Economic impact of mobile communications in sudan phần 4 pot
Bạn đang xem bản rút gọn của tài liệu. Xem và tải ngay bản đầy đủ của tài liệu tại đây (1.15 MB, 13 trang )
sold, and where handsets are repaired. People working in these shops usually share
operational expenses such as rents and utilities.
The MNOs generated employment of over 2,740 FTEs in 2008. MNOs employ
high-skilled labour force, often returning from a period spent working abroad.
MNOs therefore contribute to reverse the “brain drain” of skilled labour or “human
capital flight”, which has been affecting the Sudanese economy. In addition, MNOs’
employees receive high-quality training and are entitled to a range of social benefits.
Network equipment suppliers generated an estimated employment of 1,740 FTEs in
2008. These are employed by the major network suppliers such as Ericsson, but also
include small local companies formed by engineers and technicians who mostly install
towers, shelters and maintain the network equipment.
3.3 Demand-side impact: Increases in productivity
Mobile telephony is associated with improvements in productivity particularly in
developing countries where mobile services have “leap-frogged” fixed line services
and are the providers of universal service. Supporting this view a recent survey
conducted by Zain in Sudan asked the degree to which people agreed with the
following statement:
‘Mobile phone is a business enabler. It allows business to be more efficient and build,
keep and maintain customer relations.’
Of the 744 respondents, 84% stated that they ‘completely agreed’ with the statement
31
.
31 Based on a sample of 800 people across a broad section of Sudan geographically and socially.
67
The first impact is calculated directly by collecting data from MNOs. As above, data
for Zain has been grossed up for the remaining operators. For the related industries
bottom-up data is used and where unavailable, estimates made by dividing the
proportion of revenue spent on wages by an appropriate wage rate. Typically, support
and induced employment is estimated using a multiplier analogous to that used to
estimate further value add generated. Other studies have used a ratio of 1.1 to 1.7 for
induced employment. Following a review of the available evidence, we have chosen to
apply a multiplier of 1.2 reflecting the fact that most of the skilled and unskilled labour
is provided domestically and there is negligible ex-patriot employment.
We estimate that the mobile sector created, directly and indirectly, around 43,200 FTE
opportunities in Sudan in 2008.
The largest category of employment relates to retailers who sell airtime and SIM cards
with over 20,380 FTEs in 2008. These include specific as well as non specific points
of sale for airtime including pharmacies, small and big groceries, kiosks and street
vendors. In particular a significant number of street vendors in Khartoum sell airtime
in the streets; they also provide credit transfer facilities to customers who can afford
only small credit units. This form of employment has been increasing significantly
over the years.
Handset dealers and repairers include both handset importers and retail sellers of
handsets. The later usually operate in shops where both used and new handsets are
Figure 25: Contribution to employment from the mobile value chain in 2008
Operator data, interviews and Deloitte analysis on average wage rates. (Note this is employment directly
created by revenue flows from the MNOs and does not represent total employment in the sector).
Employment Impact
FTEs excluding
multiplier
FTEs including
multiplier
Mobile network operators
Fixed operator
Network equipment suppliers
Handset distributors and retailers
Other suppliers of capital items
Support services
Airtime and SIM distributors and retailers
Total FTEs
2,740
390
1,450
12,210
230
2,440
16,980
36,440
2,740
470
1,740
14,660
280
2,930
20,380
43,200
66
Figure 26 Are mobile phones business enablers? (Number of people)
Zain survey data
700
600
500
400
300
200
100
0
No
response
1
2
3
4
5
6
7
Do not agree Agree completely
by Bruijn et al.
33
also suggest truck drivers in Sudan are benefiting from
mobile phones with drivers reporting around 75% of their work being arranged
by mobile phone; and
• Encouragingentrepreneurialism:mobiletelephonyhasencouragedthegrowth
of small businesses as people are constantly reachable on their mobiles and start
their operations without the need to incur the initial costs of setting up offices.
It has been reported that women in Sudan have been able to start small
businesses such as beauty and hairstyle services.
The mobile operators are currently investing in GPRS and 3G networks that will
support “push mail” and other data applications. Once these networks are fully
rolled out and are found to be reliable, this is likely to encourage take-up of data
devices particularly by the business community. This can be expected to further
enhance the productivity of workers, particularly those working outside of a
formal office environment.
No established economic methodology exists to estimate the GDP and employment
effects of such productivity improvements across the economy. As such, we have considered
available evidence from the literature in the area and conducted interviews with
stakeholders (including business and Government representatives) in order to provide an
indication of the demand side impact of mobile communications in each of the countries.
Other surveys have typically quantified productivity improvements to be between 6%
and 11%. For example, Mckinsey quantified the impact to be 10% in China, whilst
the impact in the UK has been estimated to be both 6% and 11%. Based on our
interviews, it may be assumed that the productivity increase in Sudan would be at the
high-end of this range as:
• Intervieweeshaveallreportedonthedramaticimpactthatmobiletelephonyhas
had on the Sudan economy. These interviewees have described changes that
appear greater than those documented in other reports;
• Thelimitedxedlinerolloutimpliestheimpactofmobileshouldbecompared
to a base-line of limited connectivity rather than higher fixed line penetration
rates of the UK and China. Further, where fixed lines were previously in use
survey evidence has found that mobile phones have completely replaced the
fixed line, Bruijn et al.;
33
Bruijn et al. To be published. ‘The Nile Connection’.
69
32
See, for example: Africa: Vodafone. 2005. ‘The Impact of Mobile Phones’. Policy Paper Series, No.3,
March 2005.
There are numerous ways in which mobile telephony has been found to increase
productivity and enable business. The following important effects have been identified
in previous research
32
:
• Improvinginformationows:mobileservicesallowcertainoccupations(suchas
commodities and agriculture, both prominent in developing countries) to “cut
out the middle-man” as traders can obtain information on prices, quality,
quantities directly. This improves the incomes of producers, and helps reduce
wastage;
• Reducingtraveltimeandcosts:similarly,mobileservicesallowworkersto
trade and share information without travelling. The Vodafone paper on
Africa (2005), contains analysis on Tanzania and South Africa found that
67% of users in Tanzania said that mobiles greatly reduce travel time;
• Improvingefciencyofmobileworkers:mobileservicesimprovetheefciency
of all workers in the economy. This effect will particularly be felt by workers
with unpredictable schedules, for example those involved in repair and
maintenance, or collection and delivery. Mobiles will give them greater
accessibility and better knowledge of demand; and
• Improvingjobsearch:mobileservicesimprovethechancesoftheunemployed
finding employment through enabling people to call for opportunities rather
than relying on word of mouth. Further to this, owning a mobile phone makes
workers more employable as they are contactable while away.
From interviews and Zain’s recent survey, the following effects were found to be of
particular pertinence in Sudan:
• Substantiallyreducingtraveltimesandcosts:particularlyinruralareaswhere
previously traders would have needed to travel to the urban areas to check for
demand and agree on prices, this business is now conducted on the telephone.
Traders are able to ensure demand exists for their products before setting out on
a journey. This effect is particularly pronounced in Sudan where the sheer size of
the country increases average journey times;
• Creatingmarketefciency:particularlyintheagriculturesector,workersarenow
quickly notified about changes in demand or prices so that they can amend
their growing and harvest plans accordingly. Interviews from a recent survey
68
Our analysis shows large increases in productivity between 2006 and 2008. This has
been driven by mobile network roll-out which has allowed a greater proportion of the
population access to mobile technology.
Deloitte analysis based on Deloitte assumptions, interviews and information from Sudan national statistics
office
Figure 27: Economic impact in 2008 of increased productivity amongst Mobile Business User (MBU)
workers
SDG 1,946 million
Total productivity increase
11.15 million
Total workforce
x
20% of workers would
use their mobile for
business purposes
SDG 9.654
Average GDP
contribution per worker
x
21,562 SDG
Output of workers that
would use mobile
communications
x
90% of workforce able
to use mobile
communications
Key
Input
Calculation
SDG 19,467 million
Total output of workers
using mobile
communications
x
10% average
productivity increase
=
=
71
• Higherlevelsofinformalactivityimplygreaterneedforco-ordinationbetween
individuals since there is less formal communication at the company level; and
• SudanismoreruralthantheUKsothetravel-timesavingsarelikelyto
be greater.
We estimate the impact on the productivity improvements on the overall economy
by assuming that the productivity improvement will be experienced by high mobility
employees within the economy. In line with similar studies
34
, we define high mobility
workers as those workers who undertake a moderate to high degree of travel in the
course of their employment (e.g. taxi drivers, agricultural workers selling produce in
town, salesmen and transport workers). We calculate the proportion of high mobility
workers by reference to data from the latest country consensus, World Bank
35
estimates workforce participation and international labour data. It must be noted
however that although a new census is taking place this year the previous census was
in 1993. Given the vintage of this information where possible we have substituted for
more contemporary sources. We have estimated the productivity gain of high mobility
workers with access to a mobile phone by undertaking interviews to identify the
impacts seen in Sudan and by reference to previous studies.
We assume a productivity gain of 10% has been experienced by high mobility workers
who own a mobile phone. This gain is consistent to results of Zain’s recent survey
which suggest across 800 people interviewed average business revenue increases
associated with mobile phone usage are just below 11%. Using the economic value
concept, we estimate the incremental impact on the economy was SDG 1,946 million
($868 million) in 2008. This calculation is set out the following figure. We have not
considered the impact on low mobility workers in our analysis.
34
For example: Mckinsey & Co. 2006. ‘Wireless unbound, the surprising economic value and untapped
potential of the mobile phone’.
35
World Bank. 2007. ‘World Development Indicators’.
70
contact with her sons and organising family gatherings;
• Extensionofcommunicationstouserswithloweducationandliteracy,
particularly through the use of texts;
• Extensionofcommunicationstothoseonlowincomes:whilstindividuals
with low income levels are often unable to afford a handset or even the
lowest value prepaid cards, through the use of formal and informal payphones
they are able to enjoy the benefits of mobile communications.
The overall effect is a degree of ‘equalization’ generated by mobile
telephony, as discussed in Bruijn et al.
• Stimulationoflocalcontent:thiscanbeparticularlyusefulforallowingusersto
learn about local services such as healthcare or education. Zain for example, has
initiated a scheme in which free reminder text messages are sent to mothers to
remind them of vaccination appointments;
• Socialandentertainment:Partnershipsbetweencontentprovidersandthe
mobile operators, including Zain create which is a partnership between Zain and
Rotana media group, provide opportunities for users to download music, videos,
ringtones and other forms of entertainment. SMS premium content, including
sports and news updates, are also increasingly popular; and
• Assistanceindisasterrelief:mobileservicesallowfamiliesandfriendsto
stay in touch in the event of a natural disaster, which can also ensure that
they obtain more rapid relief.
Whilst it is difficult to assign a specific value to these benefits in terms of contribution
to GDP or employment, it is agreed that many of these social and educational
benefits could make people happier, healthier and more motivated; and hence able to
contribute to GDP.
73
Figure 28: Economic value from increases in productivity, 2004 to 2008
Deloitte estimates
1,800
1,600
1,400
1,200
1,000
800
600
400
200
0
2004 2005 2006 2007 2008
Population coverage
Productivity increase
% Coverage of populationSDGs (million)
100%
80%
60%
45%
20%
0%
3.4 Demand side impact: Intangible benefits
Finally, we seek to identify the intangible impact of the mobile industry in Sudan. We
utilise information provided to us during interviews in Sudan and evidence of gains
from similar studies that we have undertaken. Intangible benefits of mobile telephony
identified as being relevant to Sudan include:
• Promotionofsocialcohesion:throughenablingcontactwithfamilymembers
or friends who have moved away, and building trust through sharing of handsets.
“One Network” tariffs whereby a user can make calls at a local rate to other
African and Middle Eastern countries facilitates contact with those who are in
other countries.
• Reductionininequalitythroughmoneytransfers:Recentstudieshavefounda
statistical robust relationship between mobile ownership and willingness to help
others in the community
36
. Credit transfers are used in Sudan to transfer money
between different groups, for example parents fund their children’s school
expenses through a regular credit transfer;
• Deliveryof“peaceofmind”toparentswhocankeepintouchwiththeir
children. This finding is further illustrated in Bruijn et al In this study a
mother in Karima describes the role their mobile phone has in retaining
36
The specific article referenced is: Vodafone report. 2005. ‘Linking mobile phone ownership and use to
social capital in rural South Africa and Tanzania’.
72
40
This is likely to be a minor inaccuracy however as penetration was below 2% before 2004.
Historical average revenue per user (ARPU) shows us how much customers are willing
to pay for mobile services. If it is assumed that these intangible benefits of owning
a mobile are unchanged over time, then the value for this form of customer surplus
can be considered to be the difference between ARPU at the time of subscription,
less ARPU today (which is likely to be less due to increased competition and other
factors). This calculation may under-estimate the true level of customer surplus since
we assume that all customers have a willingness to pay based on their ARPU in 2004,
whereas many would have joined the network before this time, when prices were
higher, and hence have a higher willingness to pay. The total increase in customer
surplus has been calculated as SDG 1,053 million ($470 million) in 2008, 1.0% of GDP.
Figure 30: Intangible benefits and falling mobile call prices
Average price per
minute (SDG)
Customer surplus
(millions SDG)
Deloitte estimates
1,400
1,200
1,000
800
600
400
200
0
0.40
0.35
0.25
0.20
0.15
0.10
0.05
0.00
2004 2005 2006 2007 2008
Price per minute
Customer surplus
Estimates of intangible benefits may underestimate the true value of intangible
benefits due to:
• Datalimitations,itassumesthatallcustomersjoinedthenetworkin2004
and does not account for the increased willingness to pay that would have
resulted from the higher ARPUs in early years
40
; and
• Assumptionthatthenumberofcustomersineachyearisafunctionof
price. However, customer levels during the period are highly influenced by the
75
Box 1
The health sector and mobile telephony
The health sector in Sudan is being transformed in several ways due to the presence
of mobile telephony. For example in interviews with health sector workers, Bruijn et al.
found mobile phones eased shortages of supplies of drugs by increasing the speed of
requests and transactions. Further, MNOs are also intervening directly in the provision
of healthcare with a number of projects. Zain for example, is building a hospital in
Kordofan as well as providing several ambulances in regions such as Darfur.
Commercial linkages also exist with SIM, airtime and handsets being retailed across
a large number of pharmacies. This provides pharmacies with additional revenue and
further employment. From interviews as much as 20% of pharmacies revenues were
found to be attributable to airtime commissions.
We have proxied the value of intangible benefits using the willingness to pay
concept
37
,
38
. This seeks to calculate the increase in consumer surplus that has resulted
from a change in the price of a good
39
.
Figure 29: Increase in customer surplus following a reduction in price
37
For example: Mckinsey & Co. 2006. ‘Wireless unbound, the surprising economic value and untapped
potential of the mobile phone’.
38
This concept might underestimate the true value of the intangible benefits: for example consumers
might exhibit a higher willingness to pay than measured by ARPU; in addition, increases in the quality
of services will not be reflected in this measure.
39
It should be noted that even where poverty prevents prolonged voice conversations benefits are still
derived by the wide usage of dropping missed calls to convey messages.
Quantity of mobile customers
ARPU
2006
2007
2006 2007
D=(p)
Deloitte methodology
74
Figure 32: Economic impact as a percentage of GDP
2008
2007
2006
0.0% 1.0% 2.0% 3.0% 4.0% 5.0% 6.0%
Supply side impact Productivity increases Intangible benefits
Aggregation of previously calculated effects
The impact of mobile telephony in Sudan is consistent to our findings in previous
studies looking at a number of East African countries. Figure 33 summaries
these findings.
Figure 33: Economic impact of mobile telephony in East Africa in 2006
Country
Kenya
Uganda
Tanzania
Rwanda
5.0%
3.6%
4.1%
3.4%
Deloitte for GSMA. 2006. ‘Economic Impact of mobile telephony in East Africa’.
0.1%
0.1%
0.6%
0.1%
Mobile
penetration
Supply and pro-
ductivity impact
(% domestic GDP)
Intangible
benefits
(% domestic GDP)
18%
20%
20%
5%
77
level of network coverage and therefore, had mobile coverage been greater,
then it is likely more customers would have been signed up at higher ARPUs in
the early years.
3.5 Total static impact on economic welfare
The aggregation of the supply-side, demand side and intangible benefits provides
an indication of the total economic impact of mobile communications in Sudan.
Supply-side and demand side effects are estimated to be SDG 4,361 ($1,945 million).
Intangible benefits are estimated to be SDG 1,053 million ($470 million). There has
been a 135% increase in the total economic impact in 2008 from 2006.
Figure 31: Economic impact of mobile communications in Sudan (SDG millions)
2008
2007
2006
0 1,000 2,000 3,000 4,000 5,000 6,000
Supply side impact Productivity increases Intangible benefits
Aggregation of previously calculated effects
The impact of mobile communications on GDP has been substantial. We estimate that
the total economic impact of mobile communications excluding intangible benefits
was 2.6% of GDP in 2006 increasing to 4.0% of GDP in 2008. This increases to 2.9% in
2006 and 5.0% in 2008 when intangible benefits are included. The increase suggests
that economic value generated by mobile telephony has out paced the general
growth in economic activity.
76
78
79
43
We attempted to use time series data for each country to estimate the country specific impact of
mobile penetration on GDP growth. However, GDP data is only available on an annual basis and the
relative immaturity of the mobile market implied insufficient data points to undertake this analysis.
44
Waverman L., Meschi M., Fuss M. 2005. ‘The Impact of Telecoms on Economic Growth in Developing
Countries’. The Vodafone Policy Paper Series, Number 2.
45
For more details on this: Deloitte for the GSMA. 2007. ‘Tax and the digital divide’.
In estimating a relationship between mobile penetration and economic growth it is
crucial to recognise that there exists a two-way causality: the impact of increased
mobile penetration and investment in mobile infrastructure on economic growth, and
the impact of rising GDP on the demand for telecommunications services. A recent
study by Waverman, Meschi and Fuss (2005) showed that 10% higher penetration can
translate into a 0.59% increase in GDP, all other factors remaining constant over
22 years.
We undertook a regression based on cross section data for developing countries
43
similarly to Waverman, Meschi and Fuss (2005)
44
, we estimated a model in averages
over 24 years, with average GDP growth as dependent variable. The regression is
estimated for almost 60 developing countries in the African continent, the Asia Pacific
region and Latin America. Sudan was included in the sample of developing countries.
The dataset was based upon information from 2007.
For this sample, we estimate that a 10% increase in penetration could increase in the
GDP growth rate of 1.2%
45
. This result is approximately twice that found by Waverman,
Meschi and Fuss (2005) due to the sample including only countries from the poorest
regions in the world, where the effect of mobile penetration will be the strongest.
Using this result we estimate the 6% increase in penetration in 2008 may have led to
an increase in GDP growth rates of 0.7% in the long-run.
Figure 35: Relationship between GDP growth and mobile penetration
Deloitte Analysis
Dependent variable:
average GDP growth
Explanatory variables
Average mobile penetration per 100
people
Average investment as a percentage
of GDP
Literacy rate at the beginning of the
period
GDP per capita at the beginning of
the period
Coefficient
0.0012
0.00208
-0.00011
-0.0036
t-statistic
2.42
5.78
-0.96
-2.15
4 Mobile telephony and future economic growth
In this section we calculate the dynamic impact of mobile telephony on the
GDP growth rate. Academic research suggests that in the longer term mobile
communications have a significant impact on economic growth rates. It has been
suggested that this effect is particularly strong in developing countries. Our research
validates this and we estimate that mobile communications has raised GDP growth
rates in Sudan by 0.12% for each 1% increase in penetration
41
. As such, the 6%
increase in penetration in 2008 may have led to an increase in GDP growth rates of
0.7% in the long-run.
4.1 Methodology and results
In addition to analysing the static impact of the mobile industry on GDP and tax
revenues, we have sought to estimate the longer term dynamic relationship between
mobile communications and GDP. That is, the longer term impact that investment in
mobile communications may have on general economic welfare and GDP growth rates
in particular.
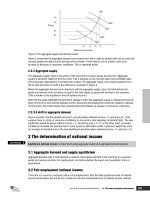
A wide range of academic studies have demonstrated that a relationship exists
between telecommunications penetration (originally fixed line, and more recently
mobile) and economic growth
42
. The following simple scatter plot demonstrates the
basis of this relationship, showing a positive correlation between penetration rates and
GDP per capita for a selection of developing countries.
41
Our analysis is based on a cross country regression, using data from 2007. Any impact of the current
economic downturn will not be captured within this analysis.
42
Studies include those by: United Nations Economic Commission for Europe, 1987; The Telecommunications
Industry; Growth and Structural Change by the ITU, 1980; and Information, Telecommunications and Development,
commissioned by the World Bank, 1983. More recently, Waverman, Meschi and Fuss (2005) and Sridhar and
Sridhar (2004) have looked specifically at the mobile industry whilst Röller (2006) looks more generally at
telecommunication infrastructure.
Figure 34: Income per capita (USD) and mobile penetration relationship in 50 African countries in 2007
9,000
8,000
7,000
6,000
5,000
4,000
3,000
2,000
1,000
0
0%
20% 40% 60% 80% 100% 120%
Sudan
Deloitte estimates using Wireless Intelligence and IMF data. Line of best fit estimated using least squares.
81
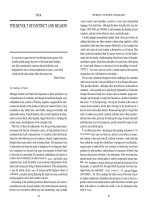
A.1 Coverage maps
A.1.1 MTN GSM coverage
A.1.2 Zain GSM coverage
Note this coverage map is noted on the GSMA site to be out of date and therefore
does not included some newly covered areas.
GSMA 2008. Red patches in Sudan represent GSM coverage
5 Conclusions
The Sudan mobile sector has expanded significantly over the last three years as
penetration has increased and operators have rolled out highly advanced networks.
The mobile sector is estimated to have contributed 4.0% to GDP in 2008 and further
intangible impact is worth up to 1.0% of GDP. In addition, the mobile sector directly
and indirectly employed over 43,200 FTEs.
The price of mobile services has fallen in recent years as the regulator has increased
the number of licensed operators and therefore competition. The mobile sector is
quickly becoming the provider of universal service in telecommunications and, given
the proliferation of data access, will soon also be a key player in driving internet
access.
By continuing to grow both its customer base and range of products, the mobile
sector will continue to increase its contribution of GDP whilst providing further
domestic employment.
GSMA 2008. Red patches in Sudan represent GSM coverage
80
A.2 Assumptions
We have not verified the accuracy or the robustness of the information provided
to us and where there have been discrepancies between data sources we used the
information provided to us by Zain or Ericsson.
83
Assumption
Description
Total FTE also includes employment for handset repairers calculated
on an ‘average wage’. Revenues flowing to repairers were estimated
based on average fault rates provided by handset dealers and an aver-
age repair price found in the market. Wages and percentage spend on
wages came from interviews with shops providing repairs.
Other suppliers of capital items
Other capital item suppliers provide: furniture and fixture, office
equipment, motor vehicles, land and buildings. FTE was calculated
using the ‘average wage’ method for these categories applying ap-
propriate benchmarks.
Suppliers of support services
Data from Zain indicated the following categories of support services
expenditure: rents, utilities, advertising and public relations, travel,
training, consulting, legal, security, communication, transportation,
printing and stationery, insurance, office supplies and cleaning, enter-
tainment, systems support and license, repair and maintenance and
audit.
FTE in each support service was calculated using the ‘average wage’
basis with interview data on percentage of revenue spent on wages
and average wage rates used where possible. Where interview data
was unavailable appropriate benchmarks were used.
Airtime and SIM distributors and retailers
Employment across the supply chain for airtime and SIMs was based
on interview evidence.
Multiplier effect
A multiplier of 1.2 was applied to indirect employment levels to gauge
the total employment in the economy created by the mobile com-
munications industry. A multiplier of 1 was applied to direct MNO
employment to capture the fact that most employment was captured
in the first round revenue flows.
Assumption Description
proportion spent on wages
average wage rate
82
Employment levels
Direct employment by MNOs
Data was obtained directly from Zain. Estimates for the market were
calculated on the basis of Zain’s market share.
Indirect employment
Fixed line operator
The number of full time employees working for the Sudatel was calcu-
lated on an ‘average wage’ basis:
Employment = revenue received from MNO x
Percentage spent on wages was calculated from Sudatel accounts.
Average wages were based on average MNO wage rates.
As public data for Canar Telecom is limited we uplifted estimated
employment in Sudatel based on market share of fixed line services.
Market share data from: Central Bureau of Statistics. 2008. ‘Transport
and communication’.
Network equipment suppliers
Ericsson provided employment data which we uplifted by market
share for other international equipment suppliers.
African firms, excluding Sudanese firms, provide civil works and power
supply capital. Employment generated in these areas was estimated
using the average wage method.
For domestic suppliers Zain provided employment data of local suppli-
ers they use. We grossed this up on the basis of Zain’s market share.
Handset dealers and repairers
For handset distributors and retailers, employment data was available
for dealers and importers from interviews. For retailers however, we
employed the ‘average wage’ method using revenues identified as
flowing to retailers. In order to calculate these revenues a conservative
replacement period of 18 months for a handset was assumed based
on handset retailer interviews. A correction for multiple SIMs was also
made assuming 20% of the market had two SIMs in 2008. Percentage
spend on wages and average wage rates were based on interviews
with retailers.
85
Assumption
Airtime and SIM
cards
Handsets
Productivity
improvement
Description
Total commission paid to distributors and retailers of Airtime and SIM
cards was provided by Zain and estimated for the rest market using
Zain data grossed up by market shares.
Data on outgoing minutes and SMS were provided by Zain and esti-
mated for the rest of the market by grossing up the data relating to
Zain using market shares.
Estimates of the total number of handsets bought were derived using:
customers figures from Zain and Wireless Intelligence, data from Zain
on the number of SIMs per handset, and data from handset retailers
on the average handset life.
The proportion of handsets bought new, bought second hand in shops
and bought new illegally were estimated following interviews with
Zain, handset dealers and handset retailers.
Data on the retail prices, wholesale prices and margins were estimated
following interviews with Zain, handset dealers and handset retailers.
An annual average productivity improvement of 10% per worker using
their phone for business purposes was assumed following interviews
and a review of similar studies.
The proportion of workers that would use their phone for business
purposes was estimated as 20% of the total workforce. This was
calculated using data from the 1993 Sudan Census, the World Bank
and a review of similar studies. Using the number of urban and rural
workers who undertake particular types of employment, and assign-
ing a percentage of mobile business users (MBU) to each category (i.e.
the percentage of workers who would use mobile communications for
business purposes), we estimated the total number of MBUs split into
urban and rural. MBUs are not necessarily those that are on specific
business contracts for their mobile subscriptions.
Assumption
Value-add margins
for each segment of
the value chain
Description
Value-add margins are the total percentage of revenue spent domesti-
cally on taxes and other payments to the government; wages; CR; and
profit.
Direct value-add of MNOs
All data was collected directly from Zain. The same margins are ap-
plied to other MNOs in the market.
Indirect value-add
These percentages are estimated based on interviews and a review of
similar companies internationally. Firstly, we collected information to
allow us to estimate the percentage of revenue which was spent on
third parties in Sudan (rather than overseas). Secondly, in relation to
this domestic expenditure, we collected information from a sample of
third parties in the value chain to determine the proportion of value-
add. This allowed us to calculate weighted average value-add margins
for the categories in the table below. For reasons of confidentiality,
we are not able to provide source data.
2008
23%
62%
23%
71%
63%
44%
43%
41%
40%
41%
47%
45%
2007
2006
Value add margins
Fixed telecommunications
operators
Network equipment suppliers
International equipment providers
African providers (excluding
Sudanese)
Domestic providers
Network support services
Handset importers, distributors
and dealers
Legal handsets
Parallel handsets
Second hand handets
Repairers
Other suppliers of capital items
Suppliers of support services
Airtime / Sim sellers
23%
65%
21%
71%
61%
45%
43%
41%
40%
40%
55%
45%
23%
62%
24%
71%
67%
45%
43%
41%
40%
39%
57%
45%
84
87
Multiplier
Population data
GDP data
20082007
2006
Total workforce
(formal and informal)
(millions)
Number of MBU
workers (millions)
% of MBU workers
GDP contribution per
MBU worker
GDP of MBU workers
Mobile phone
penetration of MBU
worker
Output of MBU
workers with mobile
phones (millions)
Average productivity
improvement
EV of MBU workers
(millions)
10
2
20.0%
7,104
14,632
43.33%
6,340
10%
634
2005
11
2
20.0%
8,191
17,336
50.36%
8,730
10%
873
11
2
20.0%
8,865
19,295
72.57%
14,001
10%
1,400
11
2
20.0%
9,654
21,562
90.28%
19,467
10%
1,947
A multiplier of 1.2 was applied to supply-side direct and indirect value-
add in order to capture the full impact on the Sudan economy.
This was assumed following a literature review and using the data pro-
vided by key players in the industry on the proportion of their expen-
diture remaining in Sudan and being spent overseas.
Averaged across data from the Central Bureau of Statistics Sudan and
IMF.
GDP data was taken as an average of World Bank and IMF data.
MBUs-2008Rural
Urban
Employment categories
Agriculture, forrestry,
fishing
Mining and quarrying
Manufacturing
Electricity, gas, water
Construction
Wholesale, retail
trade and restaurants
and hotels
Transport, storage
and communications
Financing, insurance,
real estate and busi-
ness services
Community, social
and personal services
801,328
463
157,331
17,213
131,257
340,901
199,236
45,719
540,063
Total
106,035
364
124,412
14,620
102,833
284,384
166,724
43,450
457,197
695,293
98
32,919
2,593
28,424
56,516
32,512
2,269
82,866
15%
5%
20%
15%
25%
25%
30%
25%
25%
The GDP contribution of these workers is estimated by calculating the
total GDP relating to each of the sectors. Since there is a large dispar-
ity between urban and rural GDP, we used total GDP data from the
IMF/Central Bureau of Statistics Bank and then split between different
industries using the split from the census data sheet, to calculate the
average GDP separately for these areas. The GDP for MBUs was then
weighted according to mobile network coverage in these areas.
2008
GDP per high mobility worker (SDG)
Urban areas
Rural areas
Weighted by coverage area
10,595
8,167
9,654
86
Assumption
The data below relates to 2007 and uses estimates of the total work-
force for 2008 disaggregated on the basis of the census:
Description Assumption Description
The 10% productivity improvement, number of MBU and GDP per
MBU were combined to estimate the total incremental productivity
improvement.
89
2008
Subs used in
the model
2007200620052004
Zain (previously
Mobitel)
MTN (previously
Areeba Sudan)
Sudani
3,882,144
2,021,931
2,258,263
2,747,139
1,066,000
895,556
1,801,538
268,517
0
1,048,558
0
0
5,190,278
2,510,274
3,008,820
88
Customers
Data on the number of customers was supplied by Zain with the
exception of MTN customers which was taken from Wireless Intel-
ligence.
Assumption Description