How to compete and grow a sector guide to policy phần 4 potx
Bạn đang xem bản rút gọn của tài liệu. Xem và tải ngay bản đầy đủ của tài liệu tại đây (1.94 MB, 10 trang )
32
sector growth—as obscure national security review requirements did for Russian
software exports. In addition, financial incentives to failed initiatives can costs
governments billions, as many semiconductor ventures have done around the globe.
The best odds for sustained growth come with efforts to enhance competitiveness
that target those activities with a realistic potential for competitive advantage.
Beyond sector-specific policies, government can plan a positive coordinating
role across p ri vate-s ec tor activ ities i n a se ctor suc h as tourism (se e box 3, “Th e
importance of government as coordinator in tourism”).
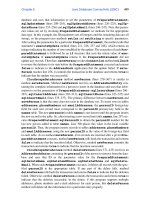
Exhibit 11
Government policy tools need to be tailored to suit
sector competitiveness drivers
SOURCE: McKinsey Global Institute/Public Sector Office Sector Competitiveness Project
Government as
principal actor
Tilting the
playing fieldBuilding enablers
Setting ground
rules/direction
EXHIBIT 11
Infrastructure
Degree of intervention
Resource-intensive
industries
Infrastructure
R&D-intensive
manufacturing
Business services
Local
services
Manufacturing
HighLow
Box 3. The impor tanc e of govern ment as coord i nator in tour ism
Many governments have been proactive in their efforts to boost the growth of
touri sm in the ir re gions.
29
Becomin g an at trac tive l oc atio n for touri sts re qu ire s
a wide ra ng e of se r vices, fro m the c on str uction of large -sc al e airpor t an d road
infrastructure to the provision of fragmented hotel and restaurant services.
Experience shows that government efforts to orchestrate consistency between
visitor expectations and this range of services have been important for success.
Competitive tourism regions need to satisfy some basic necessary conditions
that depend directly on the government. These conditions include adequate
transportation infrastructure, as well as safety, security, and sanitation. Often
a thriving tourism sector needs government to create the right zoning and
partnership models to deliver other services, including hotel zones and “flagship”
29 Tourism is an attractive sector for many governments because it is both labor intensive (unlike the
other sectors we studied, overall sector growth is driven by employment rather than productivity
growth) and has large local linkages and spillover effects. In the case of linkages, we refer to
backward multiplier effects when workers in the tourism sector spend their wages on local stores,
restaurants, and so on. By spillover effects, we mean economic benefits beyond those direct
linkages, including the lower cost of transportation for other sectors when airports and roads are
improved and the benefits to local consumers from the “beautification” of the environment.
33
How to compete and grow: A sector guide to policy
McKinsey Global Institute
tourist attractions. Government also has a role to play in ensuring a consistent
brand and the effective communication of tourism opportunities.
The experience of growing tourism industries in different countries demonstrates
the importance of these government roles. For instance, Mexico’s development
of the upmarket Riviera Maya beach resort area relied on broad, cross-sector,
coordinated public-sector efforts based on a good understanding of target
tourism segments. The government used zoning to ensure the development
of exclusive hotels, upscale restaurants, and boutiques that enabled average
hotel rates double those of Cancun, a more tightly built beach resort with a
deter io rating im age 65 k il om eter s to the no r th. In Mo roc co, the highest level
of government (including the king) committed to developing the country as a
tourism destination. Government acted as coordinator, designing the strategy
and set ting up an agency to ma na ge th e pro je ct, fu nd m ar keting, mon itor
progress, and collaborate closely with the private sector. Together with tax
exemptions in favor of the industry, this high degree of coordination from the
center has almost doubled international arrivals in six years. In both cases,
government acted as a “strategic architect” of private-sector investments rather
than making direct public interventions.
Insufficient coordination in other countries has led to less than optimal results. In the
United Kingdom, the historic lack of a hotel grading system that is common in other
countries, as well as inconsistent and overly complicated planning, has inhibited the
competitive intensity of its hotels sector compared with France, for instance.
30
We now of fer summarie s of so me of th e le s sons we have lear ne d fro m the exper ie nc e
of pol icy making in each of th e si x se ctor cases we have studied.
1. INFRASTRUCTURE SERVICES: WIRELESS
TELECOMMUNICATIONS
Designing a regulatory environment that maximizes the penetration of
telecommunication services at the lowest cost requires a good understanding
of the indu str y’s und er lying e conomic s. Focus ing on achieving sca le by havi ng a
single supplier can lead to weak incentives to reduce prices below monopoly levels.
Yet focusing too much on creating competition can lead to fragmentation and a
hig he r co st base. The ca se of th e US d igita l wi rel ess sec tor ill ustrates th e latter. T he
United States auctioned spectrum licenses for relatively small geographic areas,
and more than 50 fragmented operators resulted. In the early period after they won
licenses, these operators had much smaller subscriber bases and higher per-user
cos ts for f i xed mar keting and hum an resource s tha n di d French a nd G erman m obile
operators—three and four operators respectively.
31
The most effective regulatory approach also varies by level of income. In many low-
income countries, a key consideration is to ensure access to capital for the large network
infrastructure investments that are necessary. For this reason, overly fragmented
30 See Nicholas C. Lovegrove et al., “Why is labor productivity in the United Kingdom so low?”
McKinsey Quarterly, 1998 Number 4 (www.mckinseyquarterly.com); and UK productivity
report case study: Hotels, McKinsey Global Institute, October 1998 (www.mckinsey.com/mgi).
31 For more detail, see Thomas Kneip, Eric Labaye, and Jürgen Schrader, “Telecom: Advantage
France, Germany,” McKinsey Quarterly, February 2003 (www.mckinseyquarterly.com).
34
markets or too string ent cove rag e requi rements may d el ay a se ctor’s grow th b ecau se
lic en se hold ers c an not rais e the ca pital for expansi on. As inc om es inc rease and wireles s
penetration broadens, the regulatory focus should shift to increasing competition and
prices (see box 4, “Evolving regulatory priorities in wireless telecommunications”).
Box 4. Evolving regulatory priorities in wireless
telecommunications
McK insey has dis ce rned thre e t ype s of eme rging mar kets wi th distin ct
starting points and characteristics and therefore differing optimal regulatory
approaches (Exhibit 12):
Exhibit 12
McKinsey has identified three clusters within
emerging telecom markets
0
5
10
15
20
25
30
35
40
45
50
55
454035252015 13513012512011511010510030
Mature OECD
1
EU-15
Ukraine
Romania
Fixed line penetration, 2005
Mobile penetration, 2006
95908580750 6560 705550
Bulgaria
UAE
Qatar
Israel
Czech Republic
South Africa
Saudi Arabia
Russia
Poland
Mexico
Malaysia
Kuwait
Hungary
Chile
Argentina
Turkey
Tunisia
Thailand
Philippines
Peru
Jordan
Colombia
China
Brazil
Algeria
Pakistan
Morocco
Indonesia
India
Egypt
$20,000 +
$10,000 < $20,000
$5,000 < $10,000
< $ 5000
Per capita GDP PPP adjusted
EXHIBIT 12
1 OECD countries except Czech Republic, Hungary, Mexico, Poland, and Turkey.
SOURCE: International Telecommunications Union, Informa-World Cellular Information System (WICS+)
Percentage of population
Group 1
Group 2
Group 3
Group 1. Underpenetrated and low-income emerging markets—in this
group of countries (per capita GDP at PPP below $5,000; low fixed and mobile
service penetration), policy should focus on providing incentives for potential
stakeholders (for example, incumbents, cable operators, mobile operators,
and new players entering the market) to make necessary investments. The aim
should be to stimulate the provision of universal voice access largely through
increasing mobile penetration secured by universal coverage obligations. Once
voice access starts reaching levels close to 50 percent (as in the Philippines and
Morocco), policy makers can also focus on fixed networks in order to promote
broadband penetration. A secondary objective in this group should be to
promote lower prices by increasing competition and imposing tight regulation on
operators.
Group 2. Transition economies with high mobile penetration—policy for
this g rou p (p er ca pi ta GDP at PPP of $ 5,00 0 to $20,0 0 0; mode ratel y hi gh m obile
penetration) should mainly focus on increasing broadband penetration by
encouraging investment in fixed networks including fiber broadband, and through
financial and regulatory incentives. Policy makers should also begin regulating
to incre ase the leve l of co mp etition i n a mo bile sec tor that will be s eein g maturing
levels of penetration. However, given the continued need for investment to increase
the capacity and quality of the network, regulators in these countries should not
at this stage e ng age in a more aggres si ve value s hif t f rom o pe rator s to consu me rs
through, for example, providing open access to virtual network operators.
35
How to compete and grow: A sector guide to policy
McKinsey Global Institute
Group 3. Mobile leaders with high income per capita—in this group ( pe r
capita GDP at PPP of $20,00 0 or highe r; mode rately high fi xed p enetration),
policy should aim to increase broadband penetration. Simply correcting
regulation to offer a more even p lay ing fi el d can b e ef fective. At the s ame time,
policy needs to establish fair competition between mobile and fixed operators to
promote lower prices and the fast adaptation of new services. Direct or indirect
financial support for the rollout of such networks may also be necessary.
32
Similar to the case of telecommunications, regulation fundamentally impacts the
evolution of other regulated industries. In electric utility sectors around the world, the
traditional regulatory focus has been to reward utilities for the volume of electricity
they deliver. Instead, regulators could adjust these incentives to encourage utilities
to boost more efficient energy use among their customers.
33
In the Uni ted States,
California has kept its per capita energy consumption roughly constant for more than
30 years even while per capita consumption has grown by 50 percent in the rest of
the United States. California has achieved this stability in consumption largely due
to the fact that the state changed utility incentives and established more stringent
energy efficiency policies including appliance and lighting standards.
2. LOCAL SERVICES: RETAIL
MGI research shows that regulation alone can largely explain wide variations in the
productivity and employment of retail sectors around the world (Exhibit 13). Because
sectors like retail are so large, policy choices there can have a significant impact on an
economy’s overall GDP growth. In the United States, the combination of flexible, low-
minimum-wage labor regulation and intense competition enabled by liberal zoning
regulation has led to high productivity and employment.
34
A regulatory environment that allows the expansion of more productive modern
supermarkets and convenience stores raises productivity because larger chains can
profit from scale benefits in purchasing, merchandizing, and store operations. Yet
many countries have chosen to protect small-scale stores through barriers to foreign
direct investment, zoning laws, or restrictions on the size of stores. In Japan, laws
limiting the entry of large supermarkets and providing incentives for small retailers
to stay in business explain the high share of family retailers and low productivity.
35
In 1990s France, the introduction of more restrictive regulation over the size of retail
outlets halted the sector’s productivity growth.
36
32 For the full analysis, see Scott Beardsley et al., “Rethinking regulation in emerging
telecommunications markets,” chapter 1.7, The Global Information Technology Report 2007-
2008, World Economic Forum, 2008 World Economic Forum.
33 Curbing global energy demand growth: The energy productivity opportunity, McKinsey Global
Institute, May 2007 (www.mckinsey.com/mgi).
34 Retail and wholesale sectors alone contributed just over half of the US productivity
acceleration in the late 1990s, an acceleration that ended decades of European catch-up
and increased Europe’s income gap with the United States. See How IT enables productivity
growth, McKinsey Global Institute, 2002 (www.mckinsey.com/mgi); and US productivity
growth 1995–2000, McKinsey Global Institute, 2001 (www.mckinsey.com/mgi).
35 Why the Japanese economy is not growing: Micro barriers to productivity growth,
McKinsey Global Institute, July 2000 (www.mckinsey.com/mgi).
36 Reaching higher productivity growth in France and Germany, McKinsey Global Institute,
October 2002 (www.mckinsey.com/mgi).
36
Conversely, policy changes that facilitate the entry of new retail competitors lead to
higher productivity growth. In Sweden, the liberalization of opening hours and zoning
regulation unleashed a greater degree of competition in retail, boosting its productivity
by an average of 4.6 p erc ent for ten yea rs sta r ting in 1995, mo re tha n 2 p erc entag e
poi nts qu ic ker than in the ave rag e developed c ountr y.
37
In Ru ss ia, retailing has more
than doubled in the past ten years from 15 percent of the US level to 31 percent largely
due to an increasing share of modern retail formats that are three times as productive
as traditional ones.
38
In Mex ic o, ope ning up the fo od retai l se ctor i nter nati onally led to
increasing competition and lower prices (see box 5, “Retail in Mexico”).
Exhibit 13
Comparing countries shows a trade-off between employment and
labor productivity in retail sectors
1 Labor productivity: value added converted with single-deflated expenditure, side-value added-specific PPP to $ divided by
hours worked. Levels converted for 1997; 2005 comparison extrapolated using growth in real value added and hours worked.
SOURCE: EU KLEMS; McKinsey Global Institute analysis
EXHIBIT 13
Retail employment and labor productivity in developed countries, 2005
Employment
Hours worked per capita
10 11 12 13 14 15 16 17 18 19 20 21 22 23 246 7
Labor productivity
1
Value added ($ per hour worked)
0
100
40
50
9
60
70
80
90
0 8
Japan
United Kingdom
United
States
Sweden
France
Germany
South Korea
Spain
Differences in the level of retail employment correlate closely with labor-market
regulations—another example of how regulatory ground rules explain sector
outco me s in ser v ic es. Flex ible hiring l aws, lowe r minimum wage s, and pa r t-time
employment arrangements tend to boost retail employment. Differences in labor
regulation account for the large difference in the level of employment in the retail
sectors of France a nd th e Un ited K ingdom. S wed ish reta il has not had a good re co rd
on job creation despite rising productivity because the sector continues to suffer
from labor inflexibility. For instance, agreements between employers and trade
unions mean that the cost of labor increases by 70 percent on weekday late evenings
and 100 percent on weekends, resulting in shorter, less customer-friendly business
hours, and limiting job creation. Moreover, high social employee taxes make retail
employees particularly expensive to hire, helping explain the very low employment
and ser v ic e leve l in the sector.
37 Sweden’s economic performance, McKinsey Global Institute, September 1995
(www.mckinsey.com/mgi); and Sweden’s economic performance: Recent development,
current priorities, McKinsey Global Institute, May 2006 (www.mckinsey.com/mgi).
38 Lean Russia: Sustaining economic growth through improved productivity, McKinsey Global
Institute and McKinsey & Company, April 2009 (www.mckinsey.com/mgi).
37
How to compete and grow: A sector guide to policy
McKinsey Global Institute
Box 5. Retail in Mexico
The most important operational factor explaining differences in productivity in
retail is format mix—the share of modern supermarkets or convenience stores
relative to mom-and-pop stores and other traditional formats. In 1996, 92 percent
of food retail employees in Mexico worked in the traditional segment including
mercados and ba kerie s. Althoug h Mexic o had some moder n for mats at that
stage and these were on average three times more productive than traditional
stores, their small share in overall employment significantly diluted their impact on
the overall performance of the sector.
But when Mexico opened up its food retail sector to foreign companies, including
Wal-Mar t, whic h ac quired a lo ca l su pe rmarket ope rator Cifra in the mid-1990s,
the sector began a period of dramatic change. Wal-Mart introduced many
operational practices common in US retail including the concentration of delivery
in large-scale distribution centers. This led to suppliers having to compete for
national, or at least regional, contracts, and they came under strong pressure
to improve performance. The response of Femsa and Grupo Modelo, volume
suppliers of soft drinks and beer, was to expand to retailing itself by investing
in ra pidly growing c onve ni en ce s tore ch ains. Mexico s aw an explos ion in the
num be r of convenie nc e store s from a lit tle more tha n 1,0 0 0 to more tha n 6,00 0
in five years, and this development was a major contributor to continuing
employment growth in the food retail sector. The Mexican consumer has been
an outright beneficiary with increased competitive intensity, meaning that food
prices have grown significantly less rapidly than other prices.
39
3. BUSI NESS SERV ICES: SOFT WA R E A ND I T SERVICES
Knowledge-intensive business services such as software and IT services require
broadly market-friendly regulation to support strong growth as well as reliable electricity
and telecommunications services and sufficient IP rights. In India, the country’s
inadequate infrastructure severely delayed the growth of its IT services sector.
40
In
China and Russia, widespread software piracy has been a major barrier to growth in the
packaged-software sector.
41
By introducing and enforcing criminal antipiracy laws and
educating small and medium-sized companies about the legal risks of software piracy,
the Czech government cut piracy rates by half to below today’s French levels.
42
Beyond these aspects, government can play a useful role in enabling the broadening
of the pool of technically skilled labor. India, the Republic of Ireland, and Israel—all
39 New horizons: Multinational company investment in developing economies, chapter on retail,
McKinsey Global Institute, October 2003
(www.mckinsey.com/mgi/reports/pdfs/newhorizons/Food.pdf).
40 New horizons: Multinational company investment in developing economies, chapter on
technology/business offshoring, McKinsey Global Institute, October 2003
( />41 The Chinese government has responded by committing to relying on legal software in
government agencies and requiring computers produced or imported to China to be
preloaded with legal software. For more on the case of the Russian software sector, see
Unlocking economic growth in Russia, McKinsey Global Institute, October 1999
(
42 For BSA and IDC Annual Global Software Piracy Studies, see
/>38
countries with exceptionally rapid software or IT services export growth—had a pool of
sk ill ed engin eers available at a globa ll y co mp etitive cost.
43
Public p olicy c an en ha nce
the ta le nt p ool. The United S tates, Sweden, and Sou th Kore a have a lso helped f un d
software research activities through public innovation funds or research grants.
Because loc al de ma nd is the m ain dr ive r of grow th in IT se r vice s grow th, g over nm ent
software purchasing can be a source of that demand growth, at least in the sector’s initial
stages (Exhibit 14). In the United States and Israel, public defense spending has been a
maj or source for expanding sof tware c apab ilitie s in the se c ou ntries. Both N or way a nd
Singapore have relied on local suppliers for e-government solutions, while Brazil has
used a local provider to deliver an electronic voting system. In China, national and local
governments use Chinese vendors for both operating systems and applications. And in
the Republic of Ireland, international companies were an important source of IT services
demand (see box 6, "Sof tware i n the R epub lic of Ireland").
Exhibit 14
Software
Linkages with other sectors have been the key driver for
software demand growth
SOURCE: Arora and Gambardella Globalization of the Software Industry, 2004; McKinsey Global Institute/Public Sector Office
Sector Competitiveness Project
Electronics
South Korea
China
Hardware
Israel
Government
Singapore
Norway
Banking
China
Brazil
Telecom
Finland
Brazil
EXHIBIT 14
Usually such
linkages appear
with domestic
sectors
Low-wage
countries such as
India have also
seen these
linkages forming
with external
sectors
Many regions provide tax incentives for inbound software multinationals, but MGI
research suggests that such incentives are less critical and often unnecessary. Financial
incentives rank low in software companies’ decisions about location—far below high-
quality infrastructure and available skills.
44
Many bus ines s executives we i nter viewed
in emerging economies would prefer public money to be spent on infrastructure or
general improvements to the business environment—as long as their competitors are not
receiving subsidies either.
43 See Ashish Arora and Alfonso Gambardella, The globalization of the software industry:
Perspectives and opportunities for developed and developing countries, NBER working paper
10538, May 2004; and The emerging global labor market, McKinsey Global Institute, April
2007 (www.mckinsey.com/mgi/publications/emerginggloballabormarket/index.asp).
44 See Diana Farrell, Jaana K. Remes, and Heiner Schulz, “The truth about foreign direct
investment in emerging markets,” McKinsey Quarterly, 2004 Number 1
(www.mckinseyquarterly.com).
39
How to compete and grow: A sector guide to policy
McKinsey Global Institute
Box 6. Software in the Republic of Ireland
Bet we en 1995 a nd 20 08, the Republic of I rel an d’s revenue s fro m sof tware
more than tripled from $1.0 billion to $3.8 billion. Policy has had a significant
impact in encouraging this dynamic growth. In the 1980s, Ireland’s Industrial
Development Authority (IDA) explicitly decided to set up a program to attract
labor-intensive service businesses to Ireland.
45
The IDA shif ted its e mp hasis from
tax and financial incentives to an educated workforce and the aspiration of EU
membership. As a result, Ireland saw a host of multinational corporations (MNC)
arrive, including IBM, Lotus, Microsoft, Oracle, Claris, Corel, Symantec, and EDS.
Many successful Irish software companies started as programming houses for
the MNC subsidiaries in the IT sector or as software application developers for
other non-IT firm s. Irish sof twa re comp anie s saw the MNCs b oth as a sou rce of
revenue a nd a s an acc ess route to forei gn m ar kets.
The pre se nc e in the sector of the se l eading comp an ie s that boa st th e
latest product management and marketing techniques has contributed to
developing Ireland’s local skill base. The government played a role not only
in facilitating col la boration bet wee n indu str y and acade me but als o direc tly
inves ting in the ed uc atio n system. Total R&D in Ireland more tha n do uble d
between 2000 and 2007.
Ireland continues to develop strong strategic links with technology and platform
providers as well as with multinational companies and marketing and research
partners, and has developed managerial, marketing, customer relationship, and
technical skills. In November 2005, the government set up Lero, a dedicated
software-research center, to enhance R&D and facilitate talent development.
4. R & D -I N T ENSIV E M AN UFACT U R ING: SEMICONDUCTORS
Many governments have encouraged growth in local R&D-intensive manufacturing
sectors—the semiconductor industry being an early example. Public-policy efforts
have included creating a favorable, enabling environment through the provision of
educational programs and R&D support; tilting the playing field through government
contracts or investment incentives; and in some cases, investing directly in local
semiconductor players. Public support has played a major role in the growth of all
semiconductor clusters—but there are more examples of failure than success in
these ef for ts. As th e indus tr y has evolved f rom th e emerging tec hnology phase to the
mature sector we see today, the policy tools used by governments have changed.
So too have the odds of success—in today’s mature phase, new players in the
semiconductor industry face an extremely challenging market environment.
In the early days of the emerging US semiconductor industry, government defense
and aerospace contracts were a major source of revenues. Fairchild Semiconductor,
the predecessor of Intel, received 80 percent of its revenues in the 1950s from direct
government or government supplier contracts.
46
Sustained public demand, together
45 See Laura Alfaro, Vinati Dev, and Stephen McIntyre, Foreign Direct Investment and Ireland’s
Tiger Economy, Boston: Harvard Business School Publishing, 2005 (www.hbsp.harvard.edu).
46 John Carter, president of Fairchild, as quoted in a newspaper interview cited in Daniel
Holbrook, “Government support of the semiconductor industry: Diverse approaches and
information flows,” Business and Economic History, Volume 24, Number 2, Winter 1995.
40
with university research and training in electronics, made major contributions to
growth. In Japan, the government saw semiconductors as a strategic industry and
supported the sector from the 1960s onward by encouraging local procurement for
electronics companies, co-investing in large R&D efforts, and providing low-cost
financing for investment.
47
By the 1980 s, Ja pa ne se c om pa nies h ad bec om e the
industry’s second most important national group of players.
In the two decades that followed, governments in South Korea and Taiwan were
similarly successful in creating sustainable local industries—they lead the global
memory and foundry segments today, respectively. In both cases, competitive local
companies grew with the help of long-term committed support from governments
when the sector was still in the relatively early stages of development. South Korea
considered the semiconductor industry a priority sector, and the government made
available large amounts of favorable financing to help local companies grow. South
Korea started out from the basis of less skill-intensive assembly operations, building
increasing capabilities over time by acquiring and developing technologies. The plan
was also to focus on the dynamic random access memory (DRAM) segment of the
market because this suited South Korea’s deep manufacturing expertise more than
more skill-intensive chip-design activities would have done. Global competition in
com mo dity-like me mo r y chi ps was fierce. Not onl y were returns de ep ly c ycli ca l, but
the increasing capital costs of new fabs and rising cost of technology development
squeezed profits. Companies like Intel, Texas Instruments, and NEC exited the cyclical,
low-margin segment while Samsung eventually emerged as the leader after years of
intense competition with Micron.
48
The success of the Taiwan Semiconductor Manufacturing Company (TSMC) shows
that proac tive p olici es with a strong busi ne ss logic a nd an exec uti on team th at draws
on private-sector talent are more likely to succeed (see box 7, “Leveraging private-
sector talent: TSMC”).
47 A number of economists have evaluated the growth of the Japanese semiconductor sector
particularly after the late 1970s and 1980s when Japanese companies’ share of the global
random access memory (RAM) market surpassed that of companies based in the United
States. Contrary to the public view at the time, the evidence suggests that direct public
subsidies in Japan were not the main factor. In fact, the US government spent more on
subsidies to the sector. For further discussion, see Katsuro Sakoh, “Japanese economic
success: Industrial policy or free market?” Cato Journal, Volume 4, Number 2, Fall 1984;
Douglas A. Irwin, Trade politics and the semi-conductor industry, Center for the Economy
and the State, University of Chicago, working paper 92, January 1994; Richard E. Baldwin
and Paul R. Krugman, Market access and international competition: A simulation study of 16k
random access memories, NBER working paper 1936, 1986; and Richard E. Baldwin, “The
impact of the 1986 US-Japan Semiconductor Agreement,” Japan and the World Economy,
Volume 6, 1994.
48 Productivity-led growth for Korea, McKinsey Global Institute, March 1998 (www.mckinsey.
com/mgi).
41
How to compete and grow: A sector guide to policy
McKinsey Global Institute
Box 7. Leveraging private-sector talent: TSMC
TSMC is among the leading (and most profitable) semiconductor companies
today, ranking fifth in global sales behind Intel, Samsung, TI, and Toshiba. The
com pa ny was fo unde d in 1987 with techno lo gy that was spun of f from the
Industrial Technology Research Institute (ITRI), a publicly funded Taiwanese
resea rch institute that had acqui red and developed the u nder ly in g technolo gy.
The Taiwanese government, through the Taiwanese Development Fund, was a
major investor in TSMC early on, together with private investors such as Philips.
49
A major contributor to TSMC’s success was its new business model—foundry—
where TSMC would custom-produce chips that were designed and marketed
by other companies. The foundry model sparked a new wave of innovation in the
global semiconductor industry, as it reduced barriers to entry for new companies
that no longer needed to invest in expensive manufacturing plants. Integrated
players (IDMs) could also stop investing in new technology and assets and
instead were able to rely on foundries for their more leading-edge products.
50
TSMC executed this model with the leadership of Morris Chang, a semiconductor
manager with 25 years of experience at Texas Instruments. A critical success
factor for the new business model was Chang’s capacity to make confidentiality
a core value at TSMC. This meant that the company could gain customers’ trust
with their most secretive and IP-intensive designs at a time when IP law in the
industry was relatively untested. The company also benefited in its early days
from collaboration with Philips, an early client.
TSMC was one among several semiconductor ventures emerging from ITRI;
United Microelectronics Corporation (UMC), another major semiconductor player
today, was launched eight years earlier. Collectively, these companies formed
the nucleus around which the Hsinchu Science Park grew. Hsinchu was the
first location in Asia to build a cluster of semiconductor businesses close to one
another and to leading research institutions.
As the semiconductor industry has matured, it has become increasingly challenging
for new players to gain share in an industry that is capital intensive and fast
moving with strong winner-takes-all dynamics.
51
Many other countr ie s—inc ludin g
Singapore, Malaysia, Germany, Israel, India, and China (Shanghai)—have attempted
to replicate the su cc ess of South Korea and Ta iwa n bu t have failed to grow
sustainable semiconductor clusters. Skilled labor and access to capital are the
necessary conditions for competitiveness in this industry, and the costs of entry are
very large. Today’s semiconductor fabs cost $3 billion or more to establish, and new
players have typically received substantial public subsidies. However, money alone
cannot “buy” success because existing semiconductor clusters have real technology
and scale advantages that are not easily replicated. Even multibillion-dollar subsidies
have not succe ed ed in e nsu ring s ec tor grow th (E x hibit 15).
49 TSMC became a publicly traded company in 1994, and Philips sold its shares in 2008.
50 Integrated design and manufacture (IDM) companies both design and manufacture their
semiconductor products.
51 Japan lost its leadership position in the industry in the 1990s as local players failed to sustain
their competitiveness in the continuously evolving industry. Both increasing competition from
foundries and a waning share of consumer electronics applications, a traditional Japanese
stronghold, contributed to their decline.