Macroeconomic theory and policy phần 5 pot
Bạn đang xem bản rút gọn của tài liệu. Xem và tải ngay bản đầy đủ của tài liệu tại đây (293.23 KB, 31 trang )
114 CHAPTER 5. GOVERNMENT SPENDING AND FINANCE
0
c
1
c
2
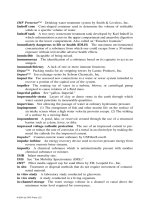
FIGURE 5.1
Individual Choice with Lump-Sum Taxes
A
y-
11
t
y-
22
t
B
C
WW-T
There is something important t o observe here. If individuals live in a ‘Fried-
man’ world (see Appendix 4.B), then they do not care about the timing of their
tax payments, if changes in the timing result in the same lifetime tax obligation
T. For example, Figure 5.1 depicts two after-tax endowment profiles that result
in the same after-tax wealth; endowment B features high current taxes (but low
future taxes), while endowment C features low current taxes (but high future
taxes). In either case, consumer demand remains at point C. On the other hand,
if individuals live in a ‘Keynesian’ world (i.e., if they are debt constrained), then
the same conclusion will generally not hold (again, see Appendix 4.B). The im-
portance of this distinction will become apparent shortly. In the meantime, we
will operate under the assumption that individuals are not debt constrained.
5.4 The R i cardian Equivalenc e Theor em
In this section, we ask two related questions. First, how does a cut in taxes
affect consumer demand? Second, does a large go vernment budget deficit pose
any sort of ‘problem’ for the economy? These two questions are related because
cutting taxes generally implies increasing the deficit, at least, to the extent that
program spending (g
1
,g
2
) is left unaltered. Another way to ask the question
being posed here is: What are the likely effects of a deficit-financed tax cut?
Deficit-financed tax cuts are sometimes recommended by policy advisors
when the economy is in recession. The reasoning here runs something as fol-
5.4. THE RICARDIAN EQUIVALENCE THEOREM 115
lows. First, we know that increases in consumer demand are often followed by
periods of economic expansion. If consumer spending is an increasing function
of disposable income (e.g., c = a + b(y − τ) as in Appendix 4.B), then a cut in
taxes will increase the disposable income of the household sector, leading to an
increase in consumer demand and therefore future GDP.
Let us investigate the logic of this argument within the context of our model.
Take a look at the government’s budget constraint (5.3). If we hold the pattern
of government spending (g
1
,g
2
) fixed, then a tax-cut today ∆τ
1
< 0 must imply
afuturetaxincrease. This is because the deficit incurred today must be repaid
(principal and interest) at some point in the future. The government budget
constrain t mak es it clear that future taxes must rise by the amount ∆τ
2
=
−∆τ
1
R>0.
The key question here is how the deficit-financed tax cut affects the after-tax
wealth of the household sector. Since gross wealth W is fixed by assumption,
after-tax wealth can only change if the present value of the household sector’s
tax liability T changes. The change in the tax liability is given by:
∆T = ∆τ
1
+
∆τ
2
R
.
Observe that since ∆τ
2
= −∆τ
1
R, it follo ws that ∆T =0.
Because the deficit-financed tax cut leaves the after-tax wealth position of the
household unchanged, we can conclude that this program will hav e absolutely
no effect on aggregate consumer demand. Another way to state this r esult is to
assert that ‘deficits do not matter.’ The intuition behind this result is straight-
forward. While the current tax cut increases current disposable income of our
model households, these households are also forecasting a future tax hike and
hence a reduction in their future disposable income. The consumption smooth-
ing motive tells us that households wo uld want to react to such a change in the
in tertemporal pattern of their disposable income by increasing their curren t de-
sired saving. By doing so, they can shift the current tax windfall to the future,
where they can use it to pa y for the higher taxes in that period. Since after-tax
wealth is left unchanged, households increase their desired saving dollar-for-
dollar with the decrease in public sector saving; i.e., ∆s
P
= −∆s
G
= ∆b
G
. In
other words, all the new bonds that are issued by the government are willing
purchased by the household sector at the prevailing interest rate, leaving desired
national saving unchanged. When these bonds mature in the future, they are
used by households to pay off the higher tax bill.
The conclusion that ‘deficits do not matter’ is a result implied the Ricar-
dian Equivalence Theorem. Loosely speaking, the Ricardian Equivalence Theo-
rem asserts that under some conditions (that we will talk about shortly), taxes
and deficits are equivalent wa ys of financing any given government expenditure
stream. That is, since deficits simply constitute future taxes, the theorem alter-
natively asserts that the timing of taxes do not matter. Another way of stating
the same thing is that the household sector should not view its government bond
116 CHAPTER 5. GOVERNMENT SPENDING AND FINANCE
holdings as net wealth since such bonds simply represen t a future tax obligation
(Barro, 1974).
1
• Exercise 5.1. If the Ricardian Equivalence Theorem holds, then the
timing of taxes ‘do not matter’ in the sense that there is no effect on
consumer demand, desired national saving, the current accoun t and (in a
closed economy) the real rate of i nterest. How ever, the timing of taxes does
have implications for the composition of desired national saving (between
the private and public sectors). Explain how.
• Exercise 5.2. True, False or Uncertain and E xplain. The Ricardian
Equivalence Theorem states that government spending ‘does not matter.’
(Hint: the answ er is False).
The conclusions of the Ricardian Equivalence Theorem are both striking and
contro versial, so let us take some time now to examine the assumptions under-
lying these results. The theorem makes an number of important assumptions
(that happen to hold true in our model economy). These assumptions are stated
below:
1. Perfect financial markets. That is, individuals are free to save and borrow
at the market interest rate. In particular, if some individuals are debt-
constrained, then the theorem does not hold. On the other hand, if only
a small number of people are debt-constrained, then the assumption of
perfect financial markets might serve as a reasonably good approximation.
2. ‘Rational’ households. In particular, households must be ‘forward looking’
and understand the go vernment budget constraint. While it is easy to
imagine that there may be ‘irrational’ households operating in the real
world, one would have to question whether these households influence
aggregate expenditure in a quantitatively important way. It is equally
apparen t by the fact that households save that they are forward looking.
And judging by the political controversy generated by budget deficits,
it seems hard to believe that households are generally not aware of the
gov ernment budget constraint.
3. Lump sum taxes. In particular, the theorem does not hold if the govern-
men t only has access to distortionary taxes. Since distortionary taxes are
the norm in reality, this assumption is potentially a serious one.
4. Long-lived households. What we literally need here is that the planning
horizon of the household is as long as the government’s planning horizon.
Since governments typically live much longer than individuals, one might
question the empirical relevance of this assumption. To see what can ‘go
wrong’ if households have short planning horizons, consider the case of
1
See also: www.garfield.library.up enn.edu/ classics1992/ A 1992G X2 2600001.p d f
5.5. GOVERNMENT SPENDING 117
an individual in retirement. If the governmen t cuts this person’s taxes
today and increases taxes at some point in the distant horizon, then our
retired individual is unlikely to ‘be around’ to settle the higher future tax
bill (he will have cleverly escaped his tax obligation by dying). For such
an individual, a deficit-financed tax cut constitutes an increase in wealth.
On the other hand, while individuals do not live forever, it is conceivable
that households do. Barro (1974) has pointed out that to the extent that
people care about their c hildren, they may want to save the tax cut and
bequestittotheirchildren(whocanthenuseittopayforthehigher
taxes they will face).
The Ricardian Equivalence Theorem clearly mak es some strong assumptions,
most of which a re literally not true in reality. However, whether an assumption
is literally true or not is not the relevant issue. The relevant question is whether
the set of assumptions serve as good approximations to reality. Whether a
set of assumptions serve as good approximations or not can only be judged by
subjecting the theory to empirical testing.
As it turns out, empirical tests of the Ricardian Equivalence Theorem report
are mixed (try performing a search on Google). Many empirical studies find that
an increase in budget deficits (a decrease in public sector saving) is met by an
increase in private sector saving, as the theorem predicts. However, it is less
clear whether private savings rise dollar for dollar with the decline in government
sa ving (as the theorem also predicts).
Perhaps the main lesson of the theorem for policy makers is as follows. To
the extent that households increase t heir saving in response to a deficit-financed
tax cut, such a policy is not likely to be as stimulative as one might expect (if one
was trained to view the w orld through the lens of the Keynesian consumption
function).
• Exercise 5.3. Explain why the Ricardian Equivalence Theorem is un-
likely to hold in an economy that experiences net immigration flows.
• Exercise 5.4. Demonstrate, with the aid of a diagram, h ow the Ricardian
Equivalence Theorem will not hold for an economy where individuals are
debt-constrained.
5.5 Go vernment Spending
It is important to understand that while our model implies that government
budget deficits ‘do not matter,’ the same is not true of government spending. In
our model, changes in the government expenditure program (g
1
,g
2
) will matter,
at least, to the extent that it alters the after-tax wealth position of the household
sector.
118 CHAPTER 5. GOVERNMENT SPENDING AND FINANCE
The results of t his section can be sum marized briefly. First, since we are
working with an endowment economy, changes in (g
1
,g
2
) can have no effect on
real output (y
1
,y
2
). Any increase in government spending then must ultimately
imply lower levels of private consumer spending. Second, since the Ricardian
Equivalence Theorem holds in our model, we can without loss of generality
assume that τ
1
= g
1
and τ
2
= g
2
. That is, since the timing of taxes ‘does not
matter,’ let’s just assume that the government balances its budget on a period
by period basis. In this case, domestic saving corresponds to private sector
sa ving (since public sector saving will always be equal to zero).
5.5.1 A Transitory Increase in Go vernm en t Spending
Consider an initial situation in which (g
1
,g
2
)=(0, 0) and suppose that house-
holds are initially content with consuming their endowment; i.e., point A in
Figure 5.2 (remember that where you place the initial indifference curve does
not matter). A transitory increase in government spending can be modeled as
∆g
1
> 0 and ∆g
2
=0. Weareassumingherethat∆τ
1
= ∆g
1
, but remember
that whether the government finances this increase with higher current taxes or
adeficit (higher future taxes) will not matter.
This fiscal policy shifts the after-tax endowment point to the left (i.e., to
point B). The h igher tax burden makes households less wealthy. The consump-
tion smoothing motive (i.e., the wealth effect) implies that generally speaking,
households will react to this fiscal policy by reducing their demand for con-
sumption at all dates; i.e., ∆c
D
1
< 0 and ∆c
D
2
< 0. We can depict this change
in behavior by moving the indifference curve from point A to point C in Figure
5.2.
5.6. GOVERN MENT SPENDING AN D TAXATION IN A MODEL WITH PR ODUCTION119
0
c
1
c
2
FIGURE 5.2
A Transitory Increase in Government Spending
A
y-
11
t
y
2
B
C
WW-T
y
1
From Figure 5.2, we see that current consumer spending does not decline by
the full amount of the tax increase. Therefore, private sector (and domestic)
sa ving must decline. Households react to the transitory increase in spending
(and taxes) by increasing the amount they wish to borrow from foreigners.
By (temporarily) increasing the net imports of goods and services, domestic
consumers can smooth their consumption over time. Of course, the resulting
curren t account deficit must be matched in the future by a corresponding current
account surplus (domestic households must export goods and services to the
foreign sector to pay back their debt).
• Exercise 5.5. Demonstrate, with the aid of a diagram, the effects of a
transitory increase in government spending financed by a deficit.
• Exercise 5.6. Demonstrate, with the aid of a diagram similar to Figure
5.2, what effect an anticipated increase in future government spending will
have on the current account.
5.6 Government Spending and Taxation in a Model
with Production
The analysis above has assumed that the intertemporal production of output
(y
1
,y
2
) is exogenous. We can move a step closer to reality by assuming instead
120 CHAPTER 5. GOVERNMENT SPENDING AND FINANCE
that the lev el of production depends on the time-allocation choices made in the
labor market, the way we described in Chapter 2 and Appendix 4.D.
In a two-period model, the preferences of households must be modified to
include time-dated leisure; i.e., u(c
1
,l
1
,c
2
,l
2
). If the production function is linear
in labor; i.e., y
j
= z
j
n
j
for j =1, 2, then using the arguments developed in
Chapter 2, we kno w that the equilibrium gross wages in this model economy will
be given by (w
∗
1
,w
∗
2
)=(z
1
,z
2
). The household’s intertemporal budget constraint
then depends on whether taxes are lump sum or distortionary. For lump-sum
taxes, the budget constraint is given by:
c
1
+
c
2
R
= z
1
(1 − l
1
) − τ
1
+
z
2
(1 − l
2
) − τ
2
R
,
and the gov ernment budget constraint takes the earlier form:
g
1
+
g
2
R
= τ
1
+
τ
2
R
.
If taxes are distortionary, as in a tax on labor earnings, then the budget con-
straint is given by:
c
1
+
c
2
R
=(1− τ
1
)z
1
(1 − l
1
)+
(1 − τ
2
)z
2
(1 − l
2
)
R
,
and the government budget constraint is given by:
g
1
+
g
2
R
= τ
1
z
1
(1 − l
1
)+
τ
2
z
2
(1 − l
2
)
R
.
When taxes are distortionary, we see that taxes will affect the real return to
labor, so that the effect on labor supply will be affectedinmuchthesameway
as it would in response t o a change in productivity (z
1
,z
2
); again, see Appendix
4.D.
5.6.1 Ricardian Equiva lence
When taxes are lump sum, the Ricardian Equivalence Theorem continues to hold
in this environment. However, this will not be the case if taxes are distortionary.
To see why, consider what happens if the government decides to implement a
deficit-financed tax cut. In this case, the tax cut today (∆τ
1
< 0) stimulates
employment (and hence, output) today so that ∆n
∗
1
> 0 and ∆y
∗
1
> 0. The
tax increase expected in the future (∆τ
2
> 0) has the opposite effect, so that
∆n
∗
2
< 0 and ∆y
∗
2
< 0. Clearly, the timing of taxes does matter here. We can
also see why a large deficit today may elicit som e concern on the part of the
population. That is, if people understand that a high deficit today must at
some point be met with higher future taxes, and if these taxes are distortionary,
then people will understand that high deficits today will put a drag on future
economic activity.
5.7. U.S. FISCAL POLICY 121
5.6.2 G o vernm en t Spending Shocks
When taxes are lump sum, any type of positive government spending shock
will simply serve to reduce the after-tax w ealth of the household sector. When
wealth declines, the demand for all normal goods declines so that ∆c
∗
j
< 0 and
∆n
∗
j
> 0. As in Chapter 3, a positiv e gov ernment spending shock (whether
transitory, anticipated, or permanent), will induce an economic boom, ∆y
∗
j
> 0
for j =1, 2. Recall, however, that since private consumption and leisure decline,
the increase in output will not necessarily be associated with an improvement
in economic welfare.
When taxes are distortionary, individuals are hit by a ‘double-whammy,’
so to speak. Since higher levels of governmen t spending require higher taxes
at some point, not only do households experience a decline in wealth, but their
decisions become distorted (in an attemp t to escape the tax). Since these higher
taxes are distortionary, they may very well lead to a decline in emplo yment
and output (again, see Chapter 3). It is for these reasons that ‘supply s ide’
economists are critical of large government spending programs.
5.6.3 B arro’s Tax-Smoothing Argument
Suppose that the government’s expenditure program (g
1
,g
2
) is fixedinplace.
When taxes are lump-sum, the government’s finance department faces a trivial
decision: choose any (τ
1
,τ
2
) that satisfies the government’s intertemporal bud-
get constrain t. However, when taxes are distortionary, Barro (1979) has pointed
out that it would be optimal for the g overnment to smooth taxes ov er time. That
is, the government should choose a tax rate that balances not only the govern-
men t ’s intertemporal budget constraint, but balances government spending and
revenue on average throughout time. This implies a relatively constant tax rate
and a budget deficit/surplus that fluctuates over time (but balance out over the
long-run).
By smoothing taxes in this manner, the go vernment is in effect smoothing
out (and therefore minimizing) the distortions that its taxes create over time.
For example, if the government requires an extraordinarily high (but transitory )
level of government purchases in one period (say, to finance a war effort), the
tax smoothing argument implies that the government should finance such an
expenditure by issuing bonds rather than by raising taxes to extraordinarily
high levels. The tax rate should be increased slightly (to minimize distortions)
and kept at this higher level until the debt is paid off.
5.7 U.S . Fisc a l Policy
There has been much talk recently of George W. Bush’s fiscal policy. In a nut-
shell, this policy appears to entail: (1) tax cuts (in order to stimulate economic
122 CHAPTER 5. GOVERNMENT SPENDING AND FINANCE
activit y); (2) an increase in government spending on the military (to fight the
war on terror); and (3) a decrease in government spending in other areas. I
will not attempt a full analysis of this fiscal program, but will provide some
perspective in the context of the historical pattern of U.S. government spending
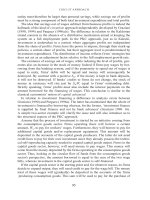
and taxation. Figure 6.3 (should be 5.3) plots U.S. government spending and
taxation (as a ratio of GDP) beginning in 1930.
0
10
20
30
40
50
30 40 50 60 70 80 90 00
REVENUE SPENDING
Projected
(2003 - 2008)
Figure 6.3
U.S. Government Spending and Taxation
1930 - 2008
Percent of GDP
Figure 6.3 (should be 5.3) reveals a number of in teresting patterns. First,
note that since the end of the second world war, government spending as a ratio
of GDP has remained relatively constant, displaying a moderate rise through
the Carter-Reagan era, and a moderate decrease through the Clinton era. While
I have not plotted it here, one should keep in mind that there has been a secular
decline in the proportion of governmen t spending devoted to the military since
the end of the Korean war (in 1953, military spending w as 15% of GDP; in 2000,
military spending was only 4% of GDP). If one is to believe the projections in
the figure, then the Bush proposal for expanded government spending plan (and
associated deficits) pales in comparison to the historical data.
5.8. SUMMARY 123
Also note the sharp rise in government spending during the second world
war (most of which was in the form of military spending). While taxes did
rise significantly during the war, they did not rise an ywhere near to the extent
needed to balance the budget. Here, we see Barro’s tax-smoothing argument
atwork. Thatis,totheextentthatthewarwasperceivedtobetransitory,it
made sense to finance the bulk of expenditures b y issuing bonds, rather t han
b y raising taxes.
5.8 Summary
The intertemporal approach to government s pending and finance emphasizes
the fact that a government with access to financial markets is subject to an
intertemporal budget constraint. From this perspective, it is clear that current
budget deficits simply represent future taxes. The intertemporal approach also
makes clear the importance of evaluating fiscal policy as an entire program that
dictates not only current spending and taxation, but the entire future path of
spending and taxation.
In some circumstances, it was shown that for a giv en expenditure program,
the timing of t axes is irrelevant as long as the government has access to a lump
sum tax instrument. This conclusion, however, is unlikely to hold empirically
because taxes are typically distortionary. When taxes are distortionary, it makes
sense to smooth taxes over time and allow budget deficits to grow during reces-
sions (or periods when government spending requirements are high), followed
by budget surpluses during periods of economic expansion (or periods when
government spending requirements are low).
In the models studied above, government spending has the effect of ‘crowding
out’ private consumption expenditures. Certain types of government spending
shocks were also sho wn to affect the current account position of a small open
economy. In addition to these effects, government spending is often asserted to
crowd out private investment spending and lead to higher interest rates. These
issues can be explored in later chapters once we have an appropriate theory of
investment developed.
124 CHAPTER 5. GOVERNMENT SPENDING AND FINANCE
5.9 Problem s
1. Consider a small open economy as in Figure 5 .2. In that figure, we assumed
that the transitory increase in government spending was financed by an
increase in current taxes. Suppose instead that the government chooses
to finance the current increase in government spending with an increase
in future taxes. Show that the method of finance has no effect on desired
consumer spending or the current account, but serves simply to alter the
composition of national saving.
2. Consider a closed economy with individuals who have preferences given
by MRS = c
2
/c
1
. Show that the equilibrium real interest rate is given by:
R
∗
=
y
2
− g
2
y
1
− g
1
.
How is the interest rate predicted to react to: (a) a transitory increase in
gov ernment purchases; and (b) an anticipated increase in future govern-
men t purchases? Explain.
3. Consider an economy populated by two types of individuals, A and B.
Normalize the total population to unity and let θ denote the fraction of
type A individuals. Type A individuals live for one period only; their
preferences are given by u
A
(c
1
)=c
1
and they have an endowment y
1
.
Type B individuals live for two periods; their preferences are given by
u
B
(c
1
,c
2
)=lnc
1
+ β ln c
2
andtheyhaveanendowment(y
1
,y
2
). The
real rate of interest is fixed at R. Imagine that a gov ernment decides
to implement a public pension plan. The governmen t plans to run this
program as follows. In period one, it taxes all individuals an amount τ
and then saves these ‘con tributions’ at the interest rate R. In period two,
the government pays out the proceeds Rτ to all (living) individuals. Each
person living in period two receives a payout equal to s = Rτ/(1 − θ).
If g
1
= g
2
=0, then the government’s intertemporal budget constraint is
given by:
(1 − θ)
s
R
= τ.
The left hand side of the GBC represents the present value of the govern-
men t’s pension liabilities (promises). The right hand side represen ts the
taxes that are collected in order to cover these liabilities.
(a) Assume for the moment that θ =0. Explain why the government
pension program has no effect on aggregate consumer demand. Hint:
use the Ricardian Equivalence Theorem.
(b) Now, assume that θ>0. Show that the aggregate demand for con-
sumption in period one is now increasing in the ‘generosity’ of the
promised payout s. Explain. Why does the Ricardian Equivalence
Theorem not hold here?
5.10. REFERENCES 125
5.10 Re ferences
1. Barro, Robert J. (1974). “Are Government Bonds Net Wealth?” Journal
of Political Economy, 82: 1095—1117.
2. Barro, Robert J. (1989). “On the Determination of the Public Debt,”
Journal of Political Economy, 64: 93—110.
126 CHAPTER 5. GOVERNMENT SPENDING AND FINANCE
Chapter 6
Capital and Investment
6.1 I nt roduction
The model economies that we have studied so far have abstracted from physical
capital and investment (expenditures on new capital goods). The models devel-
oped in Chapters 4 and 5 did feature sa vings, but these savings took the form
of purchases (or sales) of financial capital. Financial capital simply represents
claims against the output of other members in society (e.g., claims against the
output of individuals, foreigners, or governments). However, in these previous
c hapters we maintained an important assumption; namely, that output is non-
storable. The way to think of physical (as opposed to financial) capital is t hat it
represents an intertemporal production technology that allows the economy to
‘transport’ output across time. The most obvious example of physical capital is
in ventory. But phy sical capital can also take the form of a factor of production
(like labor).
Most of the physical capital in an economy constitutes durable assets that
produce services that are useful in the production of output (new goods and
services). Examples of such capital include the residential capital stock (which
produces shelter services) and various forms of business capital (office towers,
land, machinery and equipment, in ventory, etc.). In most production processes,
both labor and capital are importan t inputs for the creation of goods and ser-
vices. The goods and services that are produced by these factors of production
can be classified int o two broad categories: consumer goods and investment
goods. Investment goods are t reated as expenditures on new capital goods (and
include additions to inventory). These goods are produced in order to augment
the existing capital stoc k. When the capital stock increases, more output can
be produced with any given amount of labor. In this way, an economy may be
able to grow even in the absence of technological progress.
127
128 CHAPTER 6. C APITAL AND INVESTMENT
6.2 C apital and Intertem poral P roduction
The production function in this model economy takes the form:
y
j
= z
j
F (k
j
,n
j
),
for j =1, 2. The function F is increasing and strictly concave in both k
j
and
n
j
(see Appendix 2.A). For simplicity, let us assume that the time allocation
choice is fixed (exogenous) at (n
∗
1
,n
∗
2
)=(1, 1). Hence, the production function
can be written as zf(k) ≡ zF(k,1), where the function f is increasing and
strictly concave. All this means is that as we increase the amount of capital
used in production (holding fixed the labor input), the amount of output that is
produced increases. T he fact that f is concave means that output increases with
k at a diminishing rate (there are diminishing returns to capital accumulation).
The slope of the production function is called the marginal product of capital,
whichwedenoteherebyMPK(k, z) ≡ zf
0
(k). The MPK(k,z) tells us the
extra output that can be produced by increasing capital by a small amount
from k (given the technology parameter z). If the function f is increasing and
concave, then it follows that the MPK is positive and a decreasing function of
k. As well, note that the MPK is an increasing function of z. Figure 6.1 depicts
the production technology for t wo different levels of technology z
0
>z.Note
that MPK(k, z
0
) >MPK(k,z) >MPK(k
0
,z).
0
y
zf(k)
z’f(k)
k
k’
MPK(k,z)
MPK(k,z’)
MPK(k’,z)
FIGURE 6.1
Production Technology
and the Marginal Product of Capital
k
6.2. CAPITAL AND INTERTEMPORAL PRO DUCTION 129
We assume that the economy begins period one w ith some exogenous amount
of capital k
1
> 0. Think of this capital as having been determined by historical
in vestment decisions. Since k
1
and z
1
are exogenous, and since we are assuming
that n
∗
1
=1is exogenous, it follows that the current period GDP is exogenous
as well; i.e., y
1
= z
1
F (k
1
, 1) = z
1
f(k
1
).
The level of production at any date is imagined to consist of both new
consumer goods and new capital goods. We will assume that the division of
output between consumer and capital g oods can be made within a period. The
way to think about this assumption is that it takes firms relatively little time
to reallocate factors of production across different branches of production. This
is not a very realistic assumption to make if the time period is relatively short,
but we make it here primarily for simplicity. The production of new capital
goods serves to augment the future capital stock. Since the future leve l of
output depends i n part on the future capital stock, diverting resources away from
consumption today (toward inv estment) serves to increase the future productive
capacity of the economy.
Thelinkbetweenthefuturedomesticcapitalstockandcurrentdomestic
in vestment spending is given by the following identity:
Future Capital Stock = Current Capital Stock + Net Domestic Investment,
(6.1)
where net d omestic investment is defined as gross domestic investment less
depreciation. In what follows, I assume (for simplicity) that capital does not
depreciate so that there is no difference between gross and net investment. I also
assume that existing capital can be consumed (e.g., liquidated) after it is used
in production, so that (gross and net) investment spending may conceivably be
negative.
Let x
j
denote expenditure on new capital goods in period j =1, 2.Then
utilizing the definition in (6.1), the capital stock in our model economy evolves
over time according to:
k
1
> 0 given; (6.2)
k
2
= k
1
+ x
1
;
k
3
= k
2
+ x
2
;
Since this is a two-period model, carrying capital into the third period makes
no sense (if it can be avoided), so that setting k
3
=0is desirable here. Setting
k
3
=0implies setting x
2
= −k
2
< 0, which implies that the entire period tw o
capital stock will be (liquidated and) consumed.
130 CHAPTER 6. C APITAL AND INVESTMENT
6.3 R obinson Crusoe
To begin developing ideas, it is useful to return to our Robinson Crusoe economy.
Remember that Robinson Crusoe is a metaphor that describes a situation in
whic h an individual (or an economy) cannot trade with other individuals (or
economies). In the present context, this assumption rules out the existence of
financial assets (whic h constitute claims against the output of other individuals
or economies).
Crusoe has preferences defined over t ime-dated consumption (c
1
,c
2
), that for
present purposes, we can interpret as ‘cocon uts.’ Cocon uts are produced with
two factors of production: coconut trees (capital) and Crusoe’s labor (which
we have fixed at unity). In the current period, Crusoe is endowed with k
1
coconut trees (which can be liquidated and consumed). These trees (together
with Crusoe’s labor) produce y
1
= z
1
f(k
1
) units of new coconuts.
The supply of coconuts can be allocated to one of two uses: consumption or
investment. Investment here means planting coconut s in the ground as seed crop
if x
1
> 0 and liquidating existing coconut trees if x<0. Assume that coconuts
cannot be s tored across time as inventory (although, of course, existing coconut
trees survive int o the next period). The act of planting coconuts in the ground
constitutes an act of saving, which in this case t a kes the form of domestic
in vestment in the island’s coconut plantations. We thus have the following
relation:
c
1
+ x
1
= y
1
. (6.3)
Notice that the income-expenditure identity Y ≡ C +I is satisfied for this econ-
om y in the first period. Note as well from the d efinition of saving s ≡ y
1
−c
1
, that
all saving in this economy will take the form of domestic capital expenditure.
From equation (6.3), we can calculate the maximum first period consumption
as c
max
1
= y
1
+ k
1
, which can be achieved by liquidating the entire current stock
of capital; i.e., x
1
= −k
1
. Likewise, the maxim um level of investment can be
attained (the minimum amount of consumption) by in vesting the en tire GDP;
i.e., x
max
1
= y
1
(so that c
min
1
=0).
From (6.2), we see that the level of investment today affects the future stock
of productive capital; i.e., k
2
= k
1
+ x
1
. This future stock of coconut trees
(together with Crusoe’s future labor) produces y
2
= z
2
f(k
1
+x
1
) units of future
coconuts. Since the economy ends at the end of period two and since existing
coconut trees can be consumed, Crusoe simply consumes everything he can in
the second period; i.e., c
2
= y
2
+ k
2
(again, note that the income-expenditure
C + I = Y identity holds, with I = −k
2
).
Since c
2
= y
2
+ k
2
= z
2
f(k
1
+ x)+(k
1
+ x
1
), we can use (6.3) to write:
c
2
= z
2
f(k
1
+ y
1
− c
1
)+(k
1
+ y
1
− c
1
). (6.4)
This equation is called the production possibilities frontier (PPF). The PPF
defines the combinations of (c
1
,c
2
) that are tec hnologically feasible for Crusoe,
6.3. RO BINSON CRUSOE 131
given the parameters y
1
,k
1
,z
2
,thestructureoff, and assuming that the exis ting
capital stock has a liquidation value equal to k
1
. In particular, note that the
maximum feasible level of future consumption is achieved by setting c
1
= c
min
1
=
0; i.e., c
max
2
= z
2
f(k
1
+ y
1
)+(k
1
+ y
1
). Likewise, the maximum feasible level of
curren t consumption is achieved by setting c
2
= c
min
2
=0.
The slope of the PPF is given by:
∆c
2
∆c
1
= −z
2
f
0
(k
1
+ y
1
− c
1
) − 1.
The marginal rate of transformation (between c
1
and c
2
) is defined as that
absolute value of the slope of the PPF; i.e.,
MRT(c
1
,z
2
) ≡ 1+z
2
f
0
(k
1
+ y
1
− c
1
)=1+MPK(k
2
,z
2
).
The MRT tells us h ow many additional units of c
2
can be attained by sacrificing
one unit of c
1
(i.e., diverting current output away from consumption and into
in vestment). By increasing current investment by one unit, the future capital
stock is increased by one unit. This extra unit of future capital can be consumed
after it y ields the added return MPK, so that the extra total future output
available from the one unit of current investment is given by 1+MPK. For this
reason, you can think of the (expected) future MPK as representing the (net)
rate of return on current investment spending. Figure 6.2 displays the PPF in
a diagram.
0
c
2
max
c
1
max
y
1
k
1
PPF: c =zf(k +y -c)+(
22111
k+y-c)
111
c
1
0
c
2
0
Slope = - [1 + MPK(k + y - c , z )]
1112
0
x>0
1
0
FIGURE 6.2
Intertemporal Production
Possibilities Frontier
132 CHAPTER 6. C APITAL AND INVESTMENT
Figure 6.2 makes it clear that the availability of capital and investment allows
Crusoe to choose an intertemporal pattern of production of consumer goods and
services. In the endowment economy studied in Chapter 4, the intertemporal
production of consumption was fixed (as an endowment). The availability of
capital k
1
implies that Crusoe is now able to consume more than the current
GDP; i.e., c
1
>y
1
is feasible (by drawing down the existing stock of capital).
As well, the availability of an investment technology implies that Crusoe may
alter the future level of GDP (and future consumption) by allocating resources
aw ay from current consumption toward investmen t.
Figure 6.2 describes what is possible for Crusoe to attain. But in order
to understand how he actually behav e s, we have to consider his preferences for
time dated consumption. Crusoe’s choice problem is to choose the intertemporal
pattern of consumption that maximizes his well-being as measured b y u(c
1
,c
2
)
subject to his constraints. The solution to this choice problem is displayed in
Figure 6.3 as point A.
0
c
2
max
c
1
max
y
1
c*
1
c*
2
x*>0
1
FIGURE 6.3
Robinson Crusoe
y*
2
k*
2
A
The solution at point A is characterized by the following two mathematical
conditions:
MRS(c
∗
1
,c
∗
2
)=1+MPK(k
1
+ y
1
− c
∗
1
); (6.5)
c
∗
2
= z
2
f(k
1
+ y
1
− c
∗
1
)+(k
1
+ y
1
− c
∗
1
).
The first condition says that the slope of the indifference curve must be equal
to the s lope of the PPF; the second condi tion says that the solution must lie on
6.4. A SMALL OPEN ECONOMY 133
the PPF. Only point A in the commodity space satisfies these two conditions
simultaneously. Once c
∗
1
is known, the optimal level of (first period) investment
can be easily calculated as x
∗
1
= k
1
+ y
1
− c
∗
1
.
6.4 A Small Open Economy
Now that we understand how a Robinson Crusoe economy operates when in-
vestment is possible, let us examine how things change when we open up the
economy to international trade. We alter the environmen t by supposing that
Crusoe now has access (say, through the internet) to a world financial market
which allows him to borrow or save at the world (and hence domestic) interest
rate R. We treat R as an exogenous variable.
We can organize our thinking by breaking up Crusoe’s choice problem in to
two stages. In stage 1, Crusoe chooses a level of domestic investment spending
to maximize his wealth, subject to production possibilities. In stage 2, Cru-
soe chooses his consumption pattern (and h ence the net level of international
borrowing or lending) in order to maximize utility subject to his intertemporal
budget constraint.
6.4.1 Stage 1: Maxim izing Wealth
Imagine that you are Crusoe and that you are holding a coconut in your hand.
You are thinking about saving this coconut. What are your choices? You could
plan t the coconut in the ground (i.e., invest it domestically). Doing so will
increase your future coconut capital by ∆k
2
=1unit. This extra future capital
will then yield an additional 1+z
2
f(k
2
+1) coconuts in the future. As it turns
out, this additional output is (approximately) equal to 1+MPK(k
2
,z
2
), which
is wh y we t hink of the MPK the ‘rate of return on domestic capital investment.’
Alternatively, you could purchase a foreign bond that yields the (gross) in-
terest rate R (or net interest rate r = R − 1).The way that y ou purchase this
bond is by exporting your coconut to a foreigner in exchange for his promise
to deliver R =(1+r) coconuts to you in the future. Clearly, if MPK > r,
then you should invest the coconut domestically. If MPK < r, then yo u should
export the coconut in exchange for foreign bonds.
Now since the MPK depends on the level of domestic investment spending,
it would make sense to adjust investment (the future capital stock) to a point
where:
MPK(k
1
+ x
D
1
,z
2
)=r. (6.6)
The way to convince yourself that this must be true, suppose that the condition
does not hold. If MPK > r, then y ou could profit by borrowing a coconut
from foreigners at interest rate R and planting the coconut domestically. Your
net profitfromsuchatransactionwouldbeMPK − r>0. Consequently, in
134 CHAPTER 6. C APITAL AND INVESTMENT
order to profit in this way, you would increase domestic capital spending until
no such profit opportunity remained. Remember that since the MPK falls as
k
2
expands, eve ntually MPK will equal r as k
2
(x
1
) is increased. Alternatively,
if MPK < r, then you could profit by scaling back on domestic investment
and lending the resources to foreigners at the higher return r. Your net profit
from such a transaction would be r − MPK > 0. Of course, as you continue
to scale back on domestic investment spending, the MPK rises and eventually
equals r. Therefore, the desired level of domestic investment spending must
equal (6.6) if no such profit opportunities are to be left unexploited. Equation
(6.6) determines the investment demand function x
D
1
(as a function of R, k
1
and
z
2
); seeFigure6.4.
0
1 + MPK(k + x , z )
112
R
x
1
D
x
1
Rate of
Return
FIGURE 6.4
Determination of Domestic
Investment Demand
• Exercise 6.1. Using Figure 6.4, show that the investment demand func-
tion x
D
1
(R, k
1
,z
2
) is a decreasing function of R and k
1
, and an increasing
function of z
2
. Explain.
Wenowmovetoshowformallyhowthechoiceofx
D
1
maximizes Crusoe’s
wealth. To do this, let us think of Crusoe in his role as a business manager.
As of period one, the business owns k
1
units of capital (measured in units of
current output). This capital is used to produce the output y
1
= z
1
f(k
1
).Ifthe
business spends x
1
units of output on investment, then the period ‘cash flow’ is
given by c
1
= y
1
− x
1
. It is useful here to think of c
1
as representing the supply
of consumer goods and services in period one. Note that this supply may exceed
6.4. A SMALL OPEN ECONOMY 135
y
1
if, for example, Crusoe chose to liquidate (transform into consumer goods)
some of his current capital k
1
after production.
The investment x
1
determines the future capital stock k
2
and hence, the
future level of GDP, y
2
= z
2
f(k
2
). The future ‘cash flow’ (the supply of future
consumption) is therefore given by c
2
= k
2
+ z
2
f(k
2
), since k
2
will at this point
be liquidated into consumer goods. Since k
2
= k
1
+ x
1
= k
1
+ y
1
− c
1
, we can
alternatively write the supply of future consumption as:
c
2
=(k
1
+ y
1
− c
1
)+z
2
f(k
1
+ y
1
− c
1
). (6.7)
Observe that this equation is simply the PPF described in equation (6.4).
Crusoe’s wealth (measured in units of current output) is the present value
of his company’s cash flow; i.e.,
W = c
1
+
c
2
R
. (6.8)
Alternatively, this expression can be rewritten as c
2
= RW − Rc
1
. As a business
manager, Crusoe’s problem boils down to choosing a sequence of ‘cash flows’ that
maximizes the present value of the business subject to what is technologically
feasible. In mathematical terms, he must choose (c
1
,c
2
) to maximize equation
(6.8) subject to the constraint (6.7). The solution (c
S
1
,c
S
2
) is depicted as point
AinFigure6.5.
0
c
2
max
c
1
max
y
1
c
1
S
c
2
S
x>0
1
D
FIGURE 6.5
Stage 1: Maximizing Wealth
y
2
S
A
W
RW
c =RW-Rc
21
136 CHAPTER 6. C APITAL AND INVESTMENT
Since x
1
= y
1
− c
1
, it follows that the investment demand function is given
by x
D
1
= y
1
− c
S
1
. Notice that the slope of the PPF at point A is equal to −R. In
other words, at point A it is true that 1+MPK(k
1
+ y
1
− c
S
1
,z
2
)=R, which is
equivalent to (6.6). This proves that the in vestment demand x
D
1
characterized
by condition (6.6) maximizes Crusoe’s wealth.
• Exercise 6.2. Use Figure 6.5 to depict an allocation that lies on the PPF
but does not maximize wealth.
• Exercise 6.3. Use Figure 6.5 to deduce how (c
S
1
,c
S
2
) and x
D
1
respond to
an exogenous increase in R. Explain. How does the increase in R affect
wealth measured in present and future value? Explain.
• Exercise 6.4. Reformulate t he analysis above under the assumption
that capital depreciates fully after it is used in production. Depict the
solution in a diagram similar to Figure 6.5 and show that MPK = R
with c
S
2
= y
S
2
= z
2
f(x
D
1
).
The magnitude W derived above measures the value of Crusoe’s business
enterprise. In an open economy, his actual wealth may differ from W to the
extent that he holds other financial assets (existing claims against foreigners)
or liabilities (existing claims by foreigners against him). Let b
j
denote Crusoe’s
net foreign bond holdings (financial claims against foreigners) as of the end of
period j =0, 1, 2. If b
j
is positive, then Crusoe is a net creditor to the rest of
worldasoftheendofperiodj. If b
j
is negative, the Crusoe is a net debtor to
the rest of world as of the end of period j. The magnitude b
0
denotes Crusoe’s
‘initial’ foreign net asset position. In Chapter 4, we implicitly assumed that
b
0
=0. But if b
0
6=0, then Crusoe’s wealth as of the beginning of period one is
in fact given by W +b
0
and the first period GNP is giv en by GNP = GDP +rb
0
.
6.4.2 Sta ge 2 : Maximizing Utility
At this stage, Crusoe simply faces a standard choice problem that we have
already studied at length in Chapter 4. That is, with wealth maximized at
some level W +b
0
, Crusoe’s intertemporal consumption demands must maximize
u(c
1
,c
2
) while respecting the lifetime budget constraint: c
1
+ R
−1
c
2
= W + b
0
.
As in Chapter 4, we are free here to place the indifference curve any where
along the intertemporal budget constraint (the exact position will depend on
the nature of his preferences). The location of the indifference curve does not
determine investment or GDP; what it determines is the actual consumption
profile together with the current account position (net domestic saving position)
of the economy. Figure 4.6 displays the solution (c
D
1
,c
D
2
) to Crusoe’s utility
maximization problem (under the assumption that b
0
=0).
6.4. A SMALL OPEN ECONOMY 137
0
y
1
c
1
S
c
2
S
x
1
D
FIGURE 6.6
Stage 2: Maximizing Utility
(Trade Deficit)
A
W
RW
c =RW-Rc
21
B
c
1
D
c
2
D
s
1
D
Before proceeding, it will be useful to review some basic national income
accoun ting for an open economy (without a gov ernment sector). First, recall
the income-expenditure identity: y
1
≡ c
1
+x
1
+nx
1
, where nx
1
denotes the trade
balance (net exports) in period one. The current account balance is defined as
ca
1
≡ s
1
− x
1
or ca
1
≡ (b
1
− b
0
). The definition of national sa ving is given b y
s
1
≡ y
1
+ rb
0
− c
1
. Com bining these definitions, it follows that:
ca
1
≡ nx
1
+ rb
0
.
In the special case where b
0
=0, the current account surplus is precisely equal
to the trade balance (in period one). As well, we ha ve:
s
1
≡ x
1
+ ca
1
;
≡ x
1
+(b
1
− b
0
);
or s
1
= x
1
+ nx
1
with nx
1
= b
1
if b
0
=0.
Now, consider point B in Figure 6.6. Again, remember that the point B in
Figure 6.6 could have been placed anywhere along the budget line. As drawn
in Figure 6.6, Crusoe’s economy has positive net sa vings in period one; i.e.,
s
D
1
= y
1
+ rb
0
− c
D
1
> 0 (where recall that we have assumed b
0
=0). These
savings, however, are insufficient to finance the entire expenditure on domestic
138 CHAPTER 6. C APITAL AND INVESTMENT
in ve stment; i.e., s
D
1
<x
D
1
. The difference must be financed by importing output;
i.e., nx
D
1
= s
D
1
− x
D
1
< 0. These imports are paid for by issuing (selling) bonds
to foreigners; i.e. b
D
1
= nx
D
1
< 0, so that in this example, Crusoe becomes a
netdebtornationinperiodone. InFigure6.6,thetradedeficit corresponds
to the distance (c
D
1
− c
S
1
). This foreign debt is repaid (with interest) in period
two, which is why c
S
2
>c
D
2
. Note that in period two, net exports are given by
nx
D
2
= −(1 + r)b
D
1
= −(1 + r)nx
D
1
> 0. The current account surplus in period
two is given by ca
D
2
= nx
D
2
+ rb
D
1
. Since b
D
1
< 0, it follows that ca
D
2
<nx
D
2
(the
future current account surplus is smaller than the future trade surplus).
• Exercise 6.5. Using a diagram similar to Figure 6.6, depict an equilib-
rium for a small open econom y in which the level of consumption is greater
than current GDP. Depict another equilibrium in with the country runs a
current account surplus.
6.4.3 A Tr ansitory Productivity Shock
We are now ready to examine how our model economy reacts to a variety of
shocks. Here, I will consider a transitory increase in productivity; i.e., ∆z
1
> 0
and ∆z
2
=0. The experiment conducted here is similar to the one performed in
Chapter 4 in the context of an endowment economy. To make drawing diagrams
a bit easier, let me assume that capital depreciates fully after use and that
b
0
=0. None of the qualitative conclusions depend on these simplifications.
Asbefore,letusbeginwithaninitialsituationinwhichtheeconomyjust
happens (by coincidence) to be running a zero trade balance; this is depicted
as point A i n Figure 6.7. That is, initially we have ca
D
1
= nx
D
1
=0. The
effect of a transitory productivity shock is to shift the PPF in a parallel manner
to the right; e.g., so that point A moves to point B. As the interest rate is
exogenous, it remains unchanged, so that point B characterizes the business
sector’s optimal ‘cash flow’ (c
S
1
,c
S
2
). Assuming that both consumption goods
are normal, their demands will increase along with the increase in wealth so
that the new consumption allocation is given by point C.