Macroeconomic theory and policy phần 7 pps
Bạn đang xem bản rút gọn của tài liệu. Xem và tải ngay bản đầy đủ của tài liệu tại đây (336.47 KB, 31 trang )
176 CHAPTER 8. MONEY, INTEREST, AND PRICES
high, the value of money declines very rapidly, inducing people to take extra-
ordinary measures (involving real resource costs) to economize on their money
holdings. Over the period July-November 1923 in Germany, for example, the
price-level rose by 854,000,000,000%. According to some sources:
“Workmen are given their pay twice a day now—in the morning and
in the afternoon, with a recess of a half-hour each time so that they
can rush out and buy things—for if they waited a few hours the value
of their money would drop so far that their children would not get
half enough food to feel satisfied.”
Eviden tly, merchants eventually found that they had trouble marking up their
prices as fast enough.
“So they left the price marks as they were and posted (hourly) a
new multiplication factor. The actual price mark ed on the goods
had to be multiplied by this factor to determine the price which had
to be paid for the goods. Every hour the merchant would call up
the bank a nd receive the latest quotation upon the dollar. He would
then alter h is multiplication factor to suit and would perhaps add a
bit in anticipation of the next quotation. Banks had whole batteries
of telephone boys who answered each call as follows: ‘100 milliarden,
bitte sehr, guten Tag.’ Which mean t: ‘The present quotation on the
dollar is 100 billion marks, thank you, good day.”
10
According to the QTM, episodes like the German hyperinflation are ‘caused’
by an overly expansionary monetary policy. High money growth rates imply high
inflation. The way to prevent inflation is keep the money supply expanding at
a moderate rate (approximately equal to the growth rate of the real economy).
Indeed, if one looks at a cross-section of countries, the correlation between
inflation and money growth appears to be very high. The same is true for time-
series observations within a country over ‘long’ periods of time (the correlation
is not as strong over ‘short’ intervals of time). This type of evidence is usually
in terpreted as lending support for the QTM. On the other hand, Smith (1985)
documents one of several historical episodes in which rapid money supply growth
appears to have resulted in little, if any, inflation.
In any case, even if there is a strong positive correlation between inflation
and money growth, care must be taken in inferring a particular direction of
causalit y. The QTM asserts that inflation is ‘caused’ by monetary policy. One
way to think about this is that some exogenous event increases a government’s
demand for resources (e.g., the need to finance post WWI war reparations, in
thecaseofGermany)andthewayitchoosestofinance this need is by creating
new money.
10
These quotes were obtained from: http:// ingrimayne.saintjoe.edu/ econ/ Economic-
Cata strop he/ Hyp erIn flation.html
8.5. THE NOMINAL INTEREST RATE 177
Alternatively, one might take the view that the direction of causality works in
reverse. There appears to be a hint of this in the previous quote which suggests
that merchants increased their product prices in anticipation of the future value
of money. One way in which this might happen is through a ‘wage-price spiral’
that is accommodated by the government. That is, instead of assuming that M
t
is chosen exogenously, imagine that the government prints an amount of money
that is demanded by the private sector. In the context of o ur simple neoclassical
labor mark et model, the amount of money printed (in the firststage)willdepend
on the nominal wage; i.e., M
∗
t
= W
t
n
∗
t
. Now, imagine that the nominal wage
is chosen in a way that targets the equilibrium real wage z
t
; i.e., W
t
= z
t
P
e
t
,
where P
e
t
denotes the price-lev el that is expected to occur (in the second stage).
In this setup, the rate of money growth is determined by the expected rate of
inflation; i.e.,
M
∗
t
M
∗
t−1
=
P
e
t
P
e
t−1
.
If these expectations are correct, then the actual inflation rate will correspond
to the expected inflation rate.
A wage-price spiral may be initiated then by an exogenous increase in in-
flation expectations. Higher expectations of inflation lead workers to negotiate
higher nominal wages (to maintain their real wages). The business sector re-
sponds by either creating or acquiring the necessary money to accommodate
these wage demands. The additional money created in this wage then generates
ahigherinflation (confirming expectations).
An economist trained in the QTM is likely to accept these logical possibil-
ities. However, he or she would nevertheless maintain that inflation i s ‘alwa ys
and everywhere a monetary phenomenon.’ In particular, while the G erman hy-
perinflation may have been ‘caused’ by the government’s revenue needs, an inde-
pendent monetary authority could have prevented the hyperinflation by refusing
to accommodate the demands of the fiscal authority. Likewise, a wage-price spi-
ral can be avoided by having a ‘strong’ monetary authority that is unwilling to
accommodate the private sector’s (expectations driven) demand for money.
8.5 The Nominal In terest Rate
In earlier chapters, we introduced the concept of a real interest rate as a relative
price of time-dated output and discussed how the equilibrium real interest rate
is determined in a neoclassical model; i.e., see Sections 4.5 and 6.5. In reality,
there are rarely any direct measures of the real interest rate. Most interest rates
that are quoted are nominal. The nominal interest rate is also a relative price;
it is the relative price of time-dated money.
To examine the link between the real and nominal interest rate, consider
the following two debt instruments. Imagine that the government issues two
t ypes of bonds: a nominal bond (by far the m ost common) and a re al bond
178 CHAPTER 8. MONEY, INTEREST, AND PRICES
(considerably m ore rare). Assume that both t ypes of bond instruments are
risk-free. A nominal bond constitutes a contract stipulated in nominal terms.
For example, if I purchase a nominal bond for B
t
dollars at some date t, the
government promises to return R
n
t
B
t
dollars (principal and interest) at some
future date t +1. Here, R
n
t
denotes the (gross) nominal interest rate. The
nominal interest rate tells us that one dollar today is worth 1/R
n
t
dollars in the
future.
Similarly, a real bond constitutes a contract stipulated in real terms. For
example, if I purchase a real bond for b
t
units of output at some date t, the
government promises to return R
t
b
t
units of output (principal and interest) at
some future date t +1. Here, R
t
denotes the (gross) real interest rat e. The real
in terest rate tells us that one unit of output today is worth 1/R
t
units of output
in the future.
In practice, the contractual stipulations in a real bond are also specified in
units of money. In addition, however, the contract links the dollar repayment
amoun t to the future price-level; i.e., P
t+1
. In other words, the difference be-
tween a nominal bond and a real bond is that the latter is indexed to inflation.
Thus, if I give up B
t
dollars toda y to purchase either a real or nominal
bond, I am in effect sacrificing B
t
/P
t
= b
t
units of output (which I could have
purc hased and consumed). A nominal bond returns R
n
t
B
t
dollars to me in the
future. The purchasing power of this future money is given by R
n
t
B
t
/P
t+1
. A
real bond returns R
t
b
t
units of output (purchasing power) to me in the future.
Now let us compare the real rates of return on each of these debt instruments.
Therateofreturnonanassetisdefined as:
ROR ≡
Return
Cost
.
Hence, the real rate of return on a nominal bond is given by:
ROR
nominal bond
=
R
n
t
B
t
/P
t+1
B
t
/P
t
=
R
n
t
Π
t
.
The real rate of return on a real bond is given by:
ROR
real b ond
=
R
t
b
t
b
t
= R
t
.
Which of these two assets would you rather invest in? Recall that both debt
instruments are free of risk. If this is the case, you should prefer to invest in
the bond instrument that yields the higher real return (the nominal return is
irrelevant). In fact, for both of these bonds to be willing held in the wealth
portfolios of individuals, it must be the case that the two bonds earn the same
real return; i.e.,
R
t
=
R
n
t
Π
t
. (8.5)
8.5. THE NOMINAL INTEREST RATE 179
This condition is constitutes a simple application of a no-arbitrage-condition.
If this condition did not hold, then bond traders would be able to make huge
amounts of profit, for example, by shorting the lower return instrument and
using the proceeds to purchase long positions in the higher return instrument.
Such arbitrage opportunities are not likely to last very long in a competitive
financial m arket. The sell pressure on the low return bond will reduce its p rice,
thereby increasing its yield. Likewise, the buy pressure on the high return
bond will lower its price, thereby increasing its yield. In equilibrium, arbitrage
opportunities like this will cease to exist; i.e., the returns must adjust to satisfy
(8.5).
8.5.1 The Fisher E quation
Condition (8.5) can be rewritten as:
R
n
t
= R
t
Π
t
;
or, in terms of net rates:
r
n
t
≈ r
t
+ π
t
.
Writteninthisway,thisconditionisoftenreferredtoastheFisher equation.
The Fisher equation constitutes a theory of the nominal interest r ate. It claims
that the ( net) nominal int erest rate should be approximately equal to the (net)
real interest rate plus the (net) rate of inflation. The intuition is simple. Given
that there a re other assets (e.g., capital or indexed bonds) in the economy that
yield a real return r
t
, the nominal return on a nominal bond had better return
enough future dollars to compensate for the expected loss in the purchasing
power of money (inflation). Only if the nominal interest rate is high enough
to compensate for (expected) inflation will individuals be willing to hold an
non-indexed nominal bond.
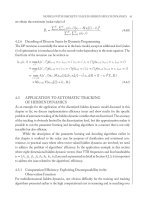
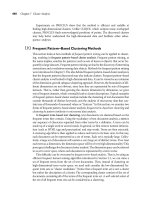
Evaluating the empirical legitimacy of the Fisher equation is not a straight-
forward exercise. For one thing, properly stated, the theory suggests that the
nominal interest rate should be a function of the expected real interest rate and
the expected rate of inflation. Direct measures of such expectations can be hard
to come by (especially of the former). Often what is done is to assume that
the expected inflation rate more o r less t racks the actual inflation rate, at least,
over long periods of time. According to the Livingston Survey of inflation ex-
pectations, this is probably not a bad assumption, although there does appear
to be a tendency for expectations to lag actual movements in inflation; i.e., see
Figure 8.2.
180 CHAPTER 8. MONEY, INTEREST, AND PRICES
0
2
4
6
8
10
12
1970 1975 1980 1985 1990 1995 2000
Inflation Expected Inflation
Percent per Annum
FIGURE 8.2
Inflation and Expected Inflation
United States 1970.1 - 2003.3
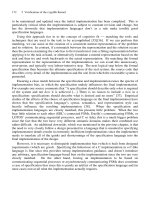
Consider next the time-series behavior of the nominal interest rate and in-
flation in the United States:
8.6. A RATE OF RETURN DOMINANCE PUZZLE 181
0
4
8
12
16
55 60 65 70 75 80 85 90 95 00
Inflation Nominal Interest Rate
Percent per Annum
FIGURE 8.3
Inflation and the Nominal Interest Rate
United States 1953.2 - 2003.3
According to Figure 8.3, the long-term movements in the nominal interest
rate do appear to follow at l east the trend movements in i nflation (and hence,
inflation expectations) in a manner consistent with the Fisher equation. Note,
however, that the correlation is not perfect, especially for short-run movements.
This latter observation is not necessarily inconsistent with the Fisher equation
since these short-run movements could be the result of movements in the (short-
run) real interest rate. In fact, because the logic o f the Fisher equation is viewed
as so compelling, economists typically assume that it is true and then use the
equation to derive a measure of the real interest rate!
8.6 A Rate of Return Dominance Puzzle
Let us reconsider the no-arbitrage principle (NAC) discussed earlier in reference
to the Fisher equation. This principle can be formally stated as follows:
No-Arbitrage Principle: Any two assets sharing identical risk characteris-
tics must yield the same expected return if they are both to be held willingly
in the wealth portfolios of individuals.
Stated another way, if one of these two assets does yield a lower rate of return,
then it will be driven out of existence. Among economists, the no-arbitrage
principle has essentially attained the status of religion. There is a good reason
182 CHAPTER 8. MONEY, INTEREST, AND PRICES
for this. In particular, the idea that unexploited riskless profit opportunities
exist for any relevant length of time seems almost impossible to imagine.
Now let us consider the following two assets, both of which are issued by
the go vernment. One asset is called a bond, and the other is called money.A
bond represents a claim against future money. But then, money also represents
a claim against future money. If I hold B dollars of one-year gov ernment bonds,
at the end of the year these bonds are transformed into R
n
B dollars. If instead
IholdM dollars of government money, at the end of the year this money is
‘transformed’ into M dollars (s ince paper money does not pay interest). In
other words, government money is just another type of government bond; i.e.,
it is a bond that pays zero nominal interest.
What is interesting about this example is that it appears (on the surface at
least) to violate the no-arbitrage principal (at least, assuming that government
bonds are free of nominal risk). Why d o people choose to hold government
money when money is so obviously dominated in rate of return? Are individ-
uals irrational? Why is this rate of return differential not arbitraged away?
Alternatively, why do go vernment bonds not drive government money out of
circulation?
The explanations for this apparent violation of t he no-arbitrage principle fall
under two categories. The first category is one that you’ve probably thought
of already. The argument goes something lik e this. Government money is a
‘special’ type of asset. In particular, it is a ‘liquid’ asset, whereas a government
bond is not. For example, just try buying a cup of coffee (or anything else)
with a government bond. Thus, while the pecuniary (i.e., monetary) return
on money may be low, money confers a non-pecuniary return in the form of
‘liquidity’ services. Thus, observing differences in the pecuniary rates of return
between money and bonds is not necessarily a violation of the no-arbitrage
principle; i.e., the apparent gap between these two returns may simply reflect
the non-pecuniary return on money.
The argument just stated sounds compelling enough to most people. But
upon further examination, it appears unsatisfactory. In particular, the explana-
tion simply asserts that government money is a ‘special’ asset without explaining
why this might be the case. It does refer to the idea that money is ‘liquid,’ but
fails to define the term or explain what it is about money that makes it ‘liquid.’
Furthermore, it is not at all apparent that such a rate of return differential could
not be arbitraged away by the banking system. For example, a bank should, in
principle, be able to purchase a government bond and then create its own paper
money ‘backed’ by such an instrument. Banks could make huge pro fits by print-
ing zero interest paper while earning interest on the bond it holds in reserve.
Competition among banks would then either compel them to pay interest on
their money, or drive the interest on bonds to zero.
11
11
A small inter est rate d ifferential may remain reflecting the cost of intermediation.
8.6. A RATE OF RETURN DOMINANCE PUZZLE 183
You might object to this argument on the g round that while the idea sounds
good in principle, in practice banks are legally preven ted from issuing their own
paper money (since 1935 in Canada). Good point. In fact, such a point repre-
sents the legal restrictions hypothesis for why government money is dominated
in rate of return (Wallace, 1983).
So now you agree that there is nothing particularly ‘special’ about govern-
ment paper money. Private banks can issue paper money too (and have done so
in the past). What prevents banks from doing so toda y is largely the product of
a legal restriction (i.e., the government wishes to maintain a monopoly over the
paper money supply). Government bonds are not useful for pay ments because
they are e ither: [1] issued in very large denominations (e.g., $10,000 or more); or
[2] they exist only as electronic book-entries (as is mainly the case these days).
Th us, the no-arbitrage principle is not violated because the principle only holds
in the absence of government trade restrictions.
As a corollary, the legal restrictions hypothesis predicts that the r ate of
return differential between money and bonds would disappear if one of the
following two government reforms were implemented. First, if the government
(in particular, the treasury or finance department) began to issue paper bonds
in the full range of denominations offered by the cen tral bank. Second, if the
government was to alter legislation that prevented banks (or any other private
agency) from issuing its own paper money.
12
8.6.1 The Friedman Rule
Is inflation/deflation ‘good’ or ‘bad’ for the economy? While we have not, as of
yet, developed a model that is capable of examining the welfare implications of
inflation, it is nevertheless useful at this stage to ponder the question for what
lies ahead.
An extremely robust result in m ost economic models is that economic effi-
ciency (in the sense of Pareto optimality) requires that no-arbitrage conditions
be satisfied. Let us consider the real ratesofreturnontwotypesofassets: gov-
ernment money and risk -free capital (if such a t hing exists).
13
The real return
on capital is R. The real return on money is 1/Π (since money is like a zero
in terest nominal bond). The no-arbitrage principle then asserts that efficiency
requires:
1
Π
= R. (8.6)
Equation (8.6) is the celebrated Friedman rule. Recall from the Fisher equa-
12
While either reform is likely to generate rate o f return equality b etween m oney and bonds,
we cannot say (without furth er analysis) wh ether th e nom ina l return will b e positive or zero.
13
The demand deposit liabilities of m o d ern-day chartered banks p erh aps constitute an ex-
ample.
184 CHAPTER 8. MONEY, INTEREST, AND PRICES
tion (8.5) t hat the nominal interest rate is given by R
n
= RΠ. Hence, the
Friedman rule is asserting that a n optimal monetary policy should operate in a
manner that drives the (net) nominal interest rate to zero; i.e., RΠ =1. If R>1
(as is normally the case), then this policy recommends engineering a deflation;
i.e., Π =1/R < 1. If R<1 (as may be the case in present day Japan), then
this policy recommends engineering an inflation; i.e., Π =1/R > 1. Price-level
stability (zero inflation) is only recommended when the (net) real interest rate
is zero.
Since the Friedman rule is based on a no-arbitrage principle, it is difficult
to dis pute it’s logic. Nevertheless, almost no one in policy circles takes the
Friedman rule seriously. Central bankers, in particular, appear to be highly
averse to the idea of a zero nominal interest rate. The reasons for why this
migh t be the case will be explored in a later c h apter. But for now, we must
simply regard any departure from the Friedman rule as an unresolv ed ‘puzzle.’
8.7 Inflation Uncertaint y
If inflation was always easily forecastable, then it is hard to imagine how (at
least moderate) inflations or deflations may pose a pressing economic problem
(at least, relative to all the other things we have to worry about). Nominal
prices could in this case be contractually agreed upon in a way that leaves the
underlying ‘real’ prices (including wages and interest rates) at their ‘correct’
levels.
Of course, inflation is not always easily forecastable. This appears to be
especially true for economies experiencing very high rates of inflation. It is a
fact of life that most real-world contracts are stated in nominal terms and that
these terms depend, at least in part, on the forecast of inflation. If inflation
is highly variable, it is not easy for nominal contracts to ensure the ‘proper’
allocation of real resources. Unexpected inflation is v iewed as being undesirable
for two reasons. First, if contracts are not indexed to inflation (normally, they
are not) a nd if contracts are costly to renegotiate (as is surely the case), then
an unexpected inflation results in a redistribution of resources (for example,
from creditors to debtors). Second, if indexation and/or renegotiation is costly,
then in flation uncertainty is likely to entail resource costs and the curtailment
of economic activity.
These are the primary reasons for why it is a stated policy of many cen tral
banks to keep inflation ‘low and stable.’
14
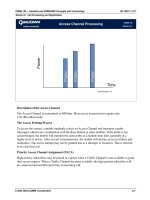
To this end, many central banks have
adopted an inflation target. The Bank of Canada, for example, has (since 1991)
adopted a n inflation target of 2% (not the Friedman rule!) with an operating
band of plus/minus 1%; i.e., see Figure 8.4. The general consensus appears to
be that inflation targets work well to ward the goal of keeping inflation ‘low a nd
14
See, for example, www.bankofcanada.ca/ en/ inside.htm
8.8. SUMMARY 185
stable.’
15
Figure 8.4
Bank of Canada Inflation Target
8.8 Summary
Money is an asset whose role is to record individual transactions. In its role as
a record-keeping device, money serves to facilitate exchange, and hence improve
economic welfare.
Money exists in two basic forms: small denomination paper and electronic
book-entry. In most modern economies, the government (via a central bank)
main tains monopoly control ov er the supply of small denomination paper, while
the private sector (via the banking system) is left to determine the supply of
book-entry money. Since the vast majorit y of money is in the form of book-
entry, it is not clear to what extent a government can con trol the total supply of
money (the sum of paper and book-entry money). In practice, however, various
legal restrictions on the banking sector likely imply that the government can
exert some influence on the supply of book-entry money (and hence, the total
money supply).
To understand the behavior of nominal variables, one m u st have a theory
that includes some role for money. But since economic welfare depends ulti-
mately on real variables, the study of money (and monetary policy) is only
15
The interested reader can refer to Bernanke, Laubach, Mishkin and Posen (1999).
186 CHAPTER 8. MONEY, INTEREST, AND PRICES
relevant to the extent it influences real economic activity. In the neoclassical
model, money may be important for economic efficiency, but money itself is not
a source of economic disturbance nor do monetary f actors influence the way an
economy responds to other shocks.
The neoclassical v iew of money may provide a good approximation for some
historical episodes in which the money supply was almost entirely provided by a
relatively free and competitive banking system (e.g., the Scottish and U.S. ‘free-
banking’ eras). There is, however, a considerable ongoing debate of this issue.
In any case, in most modern (and historical) economies, the government exerts
at least some control over mon ey supply. Furthermore, various ‘contracting
frictions’ may be severe enough to render money non-neutral, so that ‘shocks’ to
monetary policy may potentially constitute an important source of the business
cycle. Even in the absence of monetary policy shocks, these ‘frictions’ may
influence the way an economy responds to other types of disturbances.
8.9 Problem s
1. Consider the Wicksellian model in Figure 8.1. One way to imagine trade
taking place is as follows. First, B makes a ‘gift’ to A. Second, C makes a
‘gift’ to B. Finally, A makes a ‘gift’ to C. If society could keep a complete
record of such gifts, would there be any role for money? Explain how
money can be thought of as a substitute for such a public record-keeping
technology.
2. We are often counselled by financial planners to set aside at l east a part
of our saving i n the form of ‘ s afe’ government bonds and money (cash).
Explain why money and bonds are not risk -free debt instruments in the
future rate of inflation is uncertain.
3. Many macroeconomic textbooks make reference to the notion of a ‘mon-
etary policy shock.’ Does this concept make any sense to you? Wh y, in
particular, would a monetary authority want to ‘shock’ the economy? Or
is there some other way of interpreting such a shock? Discuss.
8.10 R eferences
1. Bernanke, Ben S, Thomas Laubach, Frederic S. Miskin and Adam S. Posen
(1999). Inflation Targeting: Lessons from the International Experience,
Princeton University Press, Princeton, New J ersey.
2. Laidler, David E. W. (1985). The Demand for Money,Harper&Row,
Publishers, New York.
8.10. REFERENCES 187
3. Smith, Bruce D. (1985). “American Colonial Monetary Regimes: The
Failure of the Quantity Theory and Some Evidence in Favour of an Alter-
native View,” Canadian Journal of Economics, XVIII(3): 531—565.
4. Wallace, Neil (1983). “A Legal Restrictions Theory of the Demand for
‘Money’ and the Role of Monetary Policy,” Federal Reserve Bank of Min-
neapolis Quarterly Review, 7(1): 1—7.
188 CHAPTER 8. MONEY, INTEREST, AND PRICES
Chapter 9
The New -Keynesian V iew
9.1 I ntroduction
Man y economists and policymakers do not believe that money is neutral, at
least, in the ‘short-run.’ To take this view, one must believe the follo wing two
things: [1] that the economy’s relevant money supply is determined (or at least,
greatly influenced) by policy; and [2] that ‘contracting frictions’ are present
that make at least some nominal variables ‘sticky;’ at least, for ‘short, but
sufficiently long’ periods of time. The term ‘sticky’ is meant to capture the idea
that some nominal variables do not react ‘immediately’ to shocks (in particular,
monetary policy shocks). A prominent and influen tial strand of the literature
that emphasizes the importance of sticky nominal prices operates under the
label ‘New-Keynesian’ economics.
1
9.2 Money Non-Neutralit y
New Keynesian models typically feature either sticky prices or sticky wages, but
not both. I am not sure what accounts for this either or treatment . Perhaps it
is because if both prices and wages are sticky, then real wages would be sticky,
and generating money non-neutrality may be more difficult. In what follows, I
consider a model with sticky wages.
1
The label ‘New-Keynesian’ is somewhat ironic in light of the fact that Keynes (1936)
appeared to take the view that nomin a l p rice s ‘t oo ’ flex ib le a n d destab iliz in g . Fo r ex ample, a
rapid decline in pro duct prices might lead to a ruinous ‘debt-deflation’ cycle (as falling prices
would increase real debt burdens). Likewise, rapidly falling nominal wages contribute to a
decline in demand that would exacerbate an econom ic downturn.
189
190 CHAPTER 9. THE NEW-KEYNESIAN VIEW
9.2.1 A Basic N eoclassical M odel
To begin, consider the neoclassical model of the labor market, for example,
as developed in Appendix 2.A. Profit maximization there implies a downward
sloping labor demand function n
D
(w), where w denotes the real wage. Utility
maximization on the part of households implies an upward sloping labor supply
function (assuming that the substitution effect dominates the wealth effect for
real wage changes) n
S
(w). In a neoclassical equilibrium, the equilibrium real
wage and employment are determined by n
S
(w
∗
)=n
D
(w
∗
)=n
∗
. This level of
employment generates a ‘natural’ level of real GDP; y
∗
= F (n
∗
).
Now, t o introduce money into the model, let us appeal to the Quantity The-
ory of Money, which asserts that for a given money supply M, the equilibrium
price-level is determined by P
∗
= M/y
∗
; i.e., see Chapter 8. The equilibrium
nominal wage is then given by W
∗
= w
∗
P
∗
.
Figure 9.1 depicts the neoclassical equilibrium graphically. The figure depicts
an ‘aggregate s upply’ (AS) function and an ‘aggregate demand’ (AD) function.
These labels are perhaps not the best ones available, since these ‘supply’ and
‘demand’ functions do not correspond to standard microeconomic definitions.
ThewaytothinkoftheAScurveisthatitrepresentsalltheoutput-price
combinations that are consisten t with equilibrium in the labor mark et. Since
equilibrium in the labor market does not depend on the price-level, the AS
curve is horizontal. The way to think of the AD curve is that it represents all
the o utput-price combinations that are consistent with equilibrium in the money
mark et (for a giv en level of M). The AD curv e slopes downward from left to
righ t because a higher price-level reduces the supply of real money balances,
which implies that a lower level of output is need to clear the money market.
When the money supply is equal to M
0
, the general eq uilibrium occurs at point
A, where both the labor and money market are in equilibrium. An exogenous
increase in the money supply to M
1
>M
0
moves the economy to point B,
leaving all real variables unchanged. In other words, money is neutral.
9.2. MONEY NON-NEUTRALITY 191
0
y
P
AD M()
0
AD M()
1
AS
y*
P*
1
P*
0
A
B
FIGURE 9.1
Response to a Money Shock: Neoclassical Model
9.2.2 A Basic Keynesian M odel
From a New-Keynesian perspective, point A in Figure 9.1 represents how an
economy might be expected to behave in the ‘long-run’ ( i.e., the amount of
time it takes nominal prices and wages to adjust to their equilibrium levels). In
the ‘short-run,’ however, the economy may react q uite differently to a money
supply shock.
Imagine, for example, that workers negotiate a nominal wage contract of
the following form. Workers agree to supply all the labor that is demanded
from them at some given nominal wage W. The nominal wage is not indexed
to the p rice-level. Nor can this nominal wage be renegotiated in the ‘short-
run.’ The lack of indexation or renegotiation poses no problem if the price-level
remains constant over time. Perhaps this is one wa y to rationalize a non-indexed
wage. That is, if workers expect the price-level to remain relatively stable over
time, there is no sense in negotiating (costly) indexation clauses i nto their wage
contract.
With labor supply modeled in this way, the level of employment is deter-
mined solely by labor demand; i.e., n
D
(w), where w = W/P. Notice that for a
fixed nominal wage W, the demand for labor is increasing in the price-level. This
is because a higher price-level reduces the real wage, and hence, the real cost of
labor to firms. Consequently, i t follows that the AS curve is —in the ‘short-run’ at
least—an increasing function of the price-level; i.e., y
S
(W/P)=F
£
n
D
(W/P)
¤
.
192 CHAPTER 9. THE NEW-KEYNESIAN VIEW
Let us l abel this relationship as the SRAS (short-run aggregate s upply) function.
The AD relationship is as before. Together the SRAS and the AD curve are
plotted in Figure 9.2. Assume that the wage is initially fixed at it’s neoclassical
level; i.e., W = W
∗
. In this case, the equilibrium is given by point A. At this
point, the economy is said to be both in a ‘short’ and ‘long’ run equilibrium.
Now, imagine that the money supply is unexpectedly increased (for some
unexplained reason). Then the AD curve shifts ‘up’ as in Figure 9.1. As in the
neoclassical model, the effect of this shock is to put upward pressure on the price-
level. However, unlike the neoclassical model, we see here that t he level of output
(and employment) rises as well; i.e., in the ‘short-run,’ the economy moves to
point C in Figure 9.2. The level of output increases because the expansion
in money supply ultimately reduces real labor costs (since the nominal wage
is fixed and since prices are higher). In other words, money is not neutral—at
least, in the ‘short-run.’ In the ‘long-run,’ one can imagine that workers would
react to this development b y demanding higher wages (i.e., W
∗
1
>W
∗
0
).As
this process unfolds, the SRAS shifts back ‘down,’ and the economy eventually
moves to point B.
0
y
P
AD M()
0
AD M()
1
AS
y*
P*
1
P*
0
A
B
FIGURE 9.2
Response to a Money Shock: Keynesian Model
SRAS W */P()
0
SRAS W */P()
1
C
• Exercise 9.1. Consider Figure 9.2 and imagine that the economy is
initially at point A. Now, imagine that the economy experiences a positive
productivity shoc k. The effect of this s hock is to shift the AS and SRAS
‘up’ by the same distance.
9.3. THE IS-LM-FE MODEL 193
(a) Assuming that M remains fixed, explain h ow the economy reacts both
in the short and long run (it will be helpful to first work through the
neoclassical case).
(b) How might a monetary authority react to such a shock to facilitate the
transition to the higher long-run level of output? What implications
would such a policy have for the price-level? Is such a policy likely
to improve welfare? Explain.
9.3 The IS-LM-FE Model
In order to set up the discussion that follows in the next section, it will be
useful to present an extension to the basic Keynesian model developed above.
The extension in volves introducing a role for the interest rate. As we know from
earlier chapters, an interest rate is an intertemporal price. Proper modeling of
theinterestrateshouldentailanexplicit description o f the economy’s dynamic
structure. But developing an explicitly dynamic model with sticky prices in-
volves a complicated analysis. For this reason, we follow conven tion and employ
a number of ‘short-cuts’ by favoring intuitive arguments over rigorous derivation.
The basic intuition, however, will survive a more rigorous theoretical treatment.
The extended m odel is called the IS-LM-FE model and is essentially an
extension of the basic Keynesian AS-AD model developed a bove. The IS-LM-
FE version highlights the relationship between output and the interest rate.
The extended AS-AD v ersion highligh ts the relationship between output and
the price-level. Both versions constitute the same model presented graphically
in different spaces; i.e., (y, R) space v ersus (y,P) space.
In what follows, we will take R to denote both the real and nominal interest
rate. From the Fisher equation, we know that t his will only be true if expected
inflation is zero. All that we really need, however, is to a ssume that inflation
expectations are ‘sticky’ in the short-run. But for simplicity, it is assumed here
that inflation expectations are fixed at zero.
9.3.1 The FE Curv e
FE stands for ‘Full Employment.’ The FE curve is defined as the combination
of (y, R) that are consistent with equilibrium in the labor market for a given
P. If intertemporal marke t forces are relatively weak as far as the current labor
market is concerned, then we can essentially stick to the ‘static’ labor market
model developed above. In this case, equilibrium in the labor market is inde-
pendent of (among other things) the interest rate. Hence, if we draw a graph
with y on the y-axis and R on the x-axis, the FE curve is horizontal. That is,
the FE curve consists of the the (y, R) combinations that satisfy:
y
∗
= F (n
∗
); (9.1)
194 CHAPTER 9. THE NEW-KEYNESIAN VIEW
where n
∗
is determined by n
S
(w
∗
)=n
D
(w
∗
)=n
∗
.
If the nominal wage is sticky, however, there is also a ‘short-run’ FE curve
(SRFE) that will depend on W and P. This is just the analog of the SRAS curve
discussed earlier. For a fixed W, an increase in P will shift the SRFE curve ‘up;’
and a decrease in P will shift the SRFE curve ‘down.’ All this tells us is that
in the short-run, the supply of output is increasing in the price-level; i.e., the
SRAS curve is an increasing function of P. The SRFE curve consists of all the
(y,R) combinations that satisfy:
y
S
(W/P)=F
£
n
D
(W/P)
¤
. (9.2)
Note that the SRFE curve does not depend on R (although, its position will
shift with changes in W or P that alter the real wage (W/P).
9.3.2 The IS C urve
IS stands for ‘Investment-Sav ing.’ The IS curve is defined as the combination of
(y,R) that are consistent with equilibrium in the (intertemporal) goods market.
In a closed economy, this requires that desired national investment x
D
is equal
to desired national saving s
D
(hence, invest ment-saving or IS curve).
Chapter 4 discusses at length all the factors that may influence consumer
demand (and hence, desi red saving). The analysis here simplifies by assuming
that desired saving depends primarily on current income y; i.e., s
D
(y). For
this to make sense, the view must be that any fluctuation in current income is
transitory.
2
Chapter 6 discusses at length a ll the factors that may influence inv estment
demand. The analysis here utilizes what we learned there and assumes that
in vestment demand depends n egatively on the interest rate R and positively on
an ‘expectation parameter’ z
e
; i.e., x
D
(R, z
e
). In Chapter 6, z
e
reflected the
private sector’s forecast of the future return t o capital spending. You can think
of z
e
as shifting for either ‘rational’ or ‘exogenous’ reasons (the Keynesian view
prefers the latter interpretation).
Equilibrium in the goods market requires:
s
D
(y)=x
D
(R, z
e
). (9.3)
The IS curve simply represents all the (y, R) combinations that satisfy equation
(9.3) for a given z
e
. Sometimes, the level of y that satisfies (9.3) is called the
aggregate demand for goods and services (not to be confused with the AD c urve).
• Exercise 9.2. Explain why the aggregate demand for goods and services
(output) depends negatively on R.
2
Recall from Chapter 4 that an income change that is perceived to be permanent is not
likely to influence desired saving by very much.
9.3. THE IS-LM-FE MODEL 195
From the previous exercise, it follows that y and R are negatively related to
each other (for a fixed z
e
).
• Exercise 9.3. Explain how the aggregate demand for g oods and services
depends on z
e
(explain the economics; do not just describe the mechanics).
9.3.3 The LM Curv e
LM stands for ‘Liquidity preference - Money supply.’ Here, ‘liquidity preference’
refers to the demand f or money. The LM curve is defined as all the (y, R)
combinations that are consistent with equilibrium in the money market, for a
given supply of real money balances M/P. As such, it bears some resemblance to
the AD curve derived earlier, where equilibrium in the money mark et required
M = Py.Under this v ersion of the Quantity Theory, however, the money mark et
does not depend on R. This is because the simple version of the QTM assumes
that the d emand for real money balances L depends primarily on real income;
i.e., L(y)=y.
An intuitive argument can be made, however, t hat the demand for money
should depend on R as well, leading us to write L(y, R). The presumption is
that money demand should depend negatively on the nominal rate of inter-
est. In particular, since money earns no interest, the interest rate reflects the
opportunity cost of holding money. A higher interest rate is likely to compel
individuals to economize on their money holdings (preferring to hold a greater
fraction of their wealth i n the form of interest-bearing bonds).
Equilibrium in the money market can therefore be expressed by:
M
P
= L(y, R). (9.4)
The LM curve represents all the (y, R) combinations that satisfy equation (9.4),
for a given (M/P). Since L is an increasing function of y and a decreasing
function of R, it follows that y and R are positively related. That is, since
a higher level of income increases money demand, the interest rate must then
increase to bring money demand back do wn to a fixed level (M/P).
9.3.4 Response t o a Money Supply Shock: Neoclassical
Model
As before, it is useful to describe the general equilibrium of this model under
the assumption that wages and prices are flexible (the neoclassical assumption).
The resulting equilibrium can then be interpreted as a ‘long-run’ scenario.
The general equilibrium of the model consists of a scenario in which the labor,
goods, and money market are all in equilibrium simultaneously. Mathematically,
the model consists of three equations (IS-LM-FE) and three unknowns (y, R,P).
196 CHAPTER 9. THE NEW-KEYNESIAN VIEW
We want to find a combination of (y, R,P) that satisfy all three equations
simultaneously. Such an equilibrium is depicted as poin t A in Figure 9.3.
0
y
y*
A
FIGURE 9.3
General Equilibrium: Neoclassical Model
R
FE
R*
IS z()
e
LM()M/P*
In the neoclassical model, an increase in M generates a proportional increase
in P (and W ), leaving the position of the LM curve unchanged. A money supply
shock has no effect on either output or the interest rate; the only effect is raise
nominal prices and wages. Money is neutral.
• Exercise 9.4. Imagine that the economy receives an ‘aggregate demand’
shock (i.e., an increase in z
e
). Use the logic em bedded in Figure 9.3 to
argue that such a shock will: (a) leave current output unchanged; (b)
increase the interest rate; and (c) increase the price-level. Explain the
economics.
• Exercise 9.5. Note that the IS-LM-FE analysis is ill-equipped to isolate
the ‘long-run’ effects associated with a current period c hange in z
e
. For
example, if z
e
has increased this period because individuals are forecasting
higher future productivity and if such expectations are correct, higher
future productivity will increase the supply of output (shifting the future
FE curve ‘up’). To the best of your ability, use Figure 9.3 to demonstrate
what the future equilibrium may look like.
9.3. THE IS-LM-FE MODEL 197
9.3.5 Response to a Money Supply Shock: Keynesian M odel
In the Keynesian model, the economy’s ‘long-run’ general equilibrium position
corresponds to the neoclassical case; i.e., point A in Figure 9.3 (i.e., the SRFE
curve lies on top of the FE c urve). However, if the nominal wage is sticky,
money will again be non-neutral in the short-run.
To see how things work here, consider an exogenous increase in the money
supply, say from M
0
to M
1
. The effect of this shock is to shift the SRFE curve
‘up.’ That is, for a fixed nominal wage, the resulting increase prices will lower
the real cost of labor, h ence expanding the supply of o utput (in the short-run).
Note,however,thattheinitial increase in the price-level is not as large
as it would have been in the neoclassical model. This is because the short-
run increase i n output dampens the price-level response. Since the price-level
does not initially rise in proportion to the money supply, the supply of real
money balances increases,say,from(M
0
/P
∗
) to (M
1
/P
0
), where P
0
>P
∗
.This
increase in real money balances shifts the LM curve ‘up,’ so that the short-run
equilibrium is given by point B in Figure 9.5.
The way a New-Keynesian economist would explain the economics of what
is happening here is as follows. The sudden injection of new money leads to
a liquidity effect that lowers the interest rate (both real and nominal). This
liquidity effect occurs because the supply of real money balances increases (ow-
ing to the partial adjustment in the price-level, brought about by the s ticky
nominal wage). The lower interest rate then stimulates the aggregate demand
for goods and services (the movement up along the IS curve). As the demand
for output increases, firmshiremoreworkerstomeetthedemand(theshiftup
in the SRFE curv e).
In the ‘long-run,’ (the time it takes workers to renegotiate their nominal
wages upward), the nominal wage will rise to its (neoclassical) equilibrium level.
This increase in labor costs compels firms to scale back on employment and the
supply of output (i.e., the SRFE curve shifts back down to it’s original level).
The s ubsequent contraction in output puts further upward pressure on the price-
level (shifting the LM curve back down to it’s original level). In the long-run,
money is neutral (the equilibrium level of output returns to its ‘natural’ level).
198 CHAPTER 9. THE NEW-KEYNESIAN VIEW
0
y
y*
A
FIGURE 9.4
The Liquidity Effect of a Money Supply Shock
R
FE
R*
IS z()
e
LM()M /P*
0
B
SRFE W/P’()
LM M /P’()
1
Perhaps one reason why policymakers (central bankers in particular) ‘like’
the New-Keynesian model is because i t i mplies that monetary policy can influ-
ence real economic activity—at least, in the short-run. The id ea that a central
bank might exert such influence is comforting to those who view markets as
working ‘imperfectly’ (sticky nominal variables) and perhaps subject to ‘irra-
tional’ fluctuations in ‘aggregate demand.’ According to the New-Keynesian
model, the central bank can and should vary its interest rate (money supply)
policy to keep the economy as close as possible to its ‘natural’ level of activity.
• Exercise 9.6. Suppose that the economy is initially at its general equi-
librium (i.e., point A in Figure 9.4). Imagine further that the economy is
subject to an ‘aggregate demand’ shock (i.e., an increase in z
e
).
(a) Use the logic embedded in Figure 9.4 to work through how the econ-
om y may react t o such a disturbance, both in the short and long-run.
(b) Suppose that a central bank interprets the shock as ‘irrational exu-
berance’ on the part of the private sector. Explain how the central
bank could increase the interest rate to a point that stabilizes GDP
at its ‘natural’ level. Would it be welfare improving for the central
bank to act in this manner? Explain.
9.4. HOW CENTRAL BANKERS VIEW THE WO RLD 199
9.4 H ow Central Bankers View the World
The IS-LM-FE model developed above captures many of the basic principles that
appear to be held by central bankers around the world. The actual theoretical
framework employed, however, is an extension of the IS-LM-FE model. The
extension involves providing some link between inflation (as opposed to the
price-level), inflation expectations, and output.Below,Idescribethebasic
setup of this extended model.
9.4.1 Potential Output
Potential output is defined as that level of output that would be produced in
the absence of any nominal rigidities.
3
In a neoclassical model, the economy is
alw ays producing ‘at potential.’ In a New-Keynesian model, the economy ma y
not be producing at potential; e.g., as in point B in Figure 9.4.
Note that potential output is a theoretical object; i.e., it is not as if we can
simply look at an economy and observe it’s potential output. Potential output
must be estimated within the context of a particular theory. The theory adopted
b y central bankers (largely shared by New-Keynesians) is that poten tial output
grows relatively smoothly over time. Implicit in this view is that the process
of technological development occurs in a relatively smooth manner (in contrast
to the neoclassical perspective). Furthermore, while various real shocks (like a
sudden increase in the world price of oil) may cause shif ts in potential output,
this source of variability plays a relatively minor role (at least, most of the
time) in explaining the business cycle (again, this in contrast to the neoclassical
perspective).
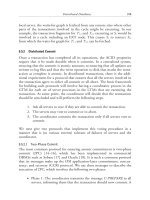
Thus, potential output corresponds in some way to an economy’s ‘trend’ level
of GDP. The way that one can estimate potential output then is to associate it
with the statistical trend line running through measurements of the economy’s
actual GDP growth pattern; for example, as in Figure 9.5.
3
Potential ou tput is sometim es also referred to as the ‘natural’ level of output.
200 CHAPTER 9. THE NEW-KEYNESIAN VIEW
10.2
10.3
10.4
10.5
10.6
10.7
10.8
1970 1975 1980 1985 1990 1995 2000
Real per capita GDP Potential GDP (HP Trend)
Log Scale
Negative
Output Gap
Positive
Output Gap
Actual and Potential Output
-5
-4
-3
-2
-1
0
1
2
3
4
1970 1975 1980 1985 1990 1995 2000
Percent Deviation from HP Trend
Output Gap
FIGURE 9.5
United States 1970.1 - 2003.3
Figure 9.5 suggests that the economy is not usually functioning at poten tial.
The difference between actual and potential output is called the output gap.A
negative output gap tends to emerge as an economy enters a recession. A pos-
itive output tends to emerge after a period of prolonged expansion. Since the
(theoretical) output gap can only emerge as a consequence of nominal rigidities,
the business cycle here is naturally viewed as being something ‘bad;’ i.e., the
product of a less than perfect market economy. In the ‘long-run,’ nominal prices
adjust to move the economy back to potential. But in the ‘short-run,’ various
shocks to the economy can move the economy away from potential. Since real
shocks are presumed to play a relatively minor role, it follows that ‘aggregate de-
mand’ shocks must constitute the primary source of economic volatility. Hence,
to the extent it is possible, policy should endeavor to stabilize the business
cycle.
4
In terms of the theory developed early, you can think of potential (or the
‘natural’ level) of output as being determined by the neoclassical FE curve. Let
y
∗
t
denote potential output at date t.
4
It is intere s tin g to contr as t the N e w-K e y nesian interpr e ta ti o n of the bu s in e ss cy c le wit h
the neo classical p ersp ective. According to the latter view, economic flu ctuations are prim arily
the product of the natural p rocess of economic development. T he market system is viewed as
work in g reason a b ly well (so tha t nom in a l rigid it ie s are no t quantitat ively impo r ta nt). Accor d -
ing to this v ie w then , th e econo my is always at (or c lo s e ) t o ‘po t entia l.’ Th e s o -c al le d ‘trend’
line and ‘output gap’ identified in Figure 9.5 then is m erely the by-pro duct of a statistical
detrending pro cedure. One cannot conclude, on the basis of drawing a sm o oth line through
the data, that th is smo o th line necessarily corresponds to any theoretical ob ject. (It is debates
like these that m ake macro econom ics so interesting).