Multi carrier and spread spectrum systems phần 2 docx
Bạn đang xem bản rút gọn của tài liệu. Xem và tải ngay bản đầy đủ của tài liệu tại đây (239.93 KB, 30 trang )
12 Introduction
[17] ETSI UMTS (TR-101 112), V 3.2.0, Sophia Antipolis, France, April 1998.
[18] Fazel K., “Performance of CDMA/OFDM for mobile communications system,” in Proc. IEEE Interna-
tional Conference on Universal Personal Communications (ICUPC’93), Ottawa, Canada, pp. 975–979,
Oct. 93.
[19] Fazel K. and Fettweis G. (eds), Multi-Carrier Spread-Spectrum. Boston: Kluwer Academic Publishers,
1997, Proceedings of the 1st International Workshop on Multi-Carrier Spread-Spectrum (MC-SS’97).
[20] Fazel K. and Kaiser S. (eds), Multi-Carrier Spread-Spectrum & Related Topics. Boston: Kluwer Academic
Publishers, 2000, Proceedings of the 2nd International Workshop on Multi-Carrier Spread-Spectrum &
Related Topics (MC-SS’99).
[21] Fazel K. and Kaiser S. (eds), Multi-Carrier Spread-Spectrum & Related Topics. Boston: Kluwer Academic
Publishers, 2002, Proceedings of the 3rd International Workshop on Multi-Carrier Spread-Spectrum &
Related Topics (MC-SS’01).
[22] Fazel K. and Kaiser S. (eds), Special Issue on Multi-Carrier Spread Spectrum and Related Topics, Euro-
pean Transactions on Telecommunications (ETT), vol. 11, no. 6, Nov./Dec. 2000.
[23] Fazel K. and Kaiser S. (eds), Special Issue on Multi-Carrier Spread Spectrum and Related Topics, Euro-
pean Transactions on Telecommunications (ETT), vol. 13, no. 5, Sept. 2002.
[24] Fazel K., Kaiser S. and Schnell M., “A flexible and high performance cellular mobile communications
system based on orthogonal multi-carrier SSMA,” Wireless Personal Communications, vol. 2, nos. 1&2,
pp. 121–144, 1995.
[25] Fazel K. and Papke L., “On the performance of convolutionally-coded CDMA/OFDM for mobile com-
munications system,” in Proc. IEEE International Symposium on Personal, Indoor and Mobile Radio
Communications (PIMRC’93), Yokohama, Japan, pp. 468–472, Sept. 1993.
[26] Fazel K. and Prasad R. (eds), Special Issue on Multi-Carrier Spread Spectrum, European Transactions on
Telecommunications (ETT), vol. 10, no. 4, July/Aug. 1999.
[27] Goodman D.J., “Second generation wireless information network,” IEEE Transactions on Vehicular Tech-
nology, vol. 40, no. 2, pp. 366–374, May 1991.
[28] Goodman D.J., “Trends in cellular and cordless communications,” IEEE Communications Magazine,
vol. 29, pp. 31–40, June 1991.
[29] Hara S. and Prasad R., “Overview of multicarrier CDMA,” IEEE Communications Magazine, vol. 35,
pp. 126–133, Dec. 1997.
[30] IEEE-802.11 (P802.11a/D6.0), “LAN/MAN specific requirements – Part 2: Wireless MAC and PHY spec-
ifications – high speed physical layer in the 5 GHz band,” IEEE 802.11, May 1999.
[31] IEEE 802.16ab-01/01, Draft, “Air interface for fixed broadband wireless access systems – Part A: Systems
between 2 and 11 GHz,” IEEE 802.16, June 2000.
[32] Kaiser S., “OFDM-CDMA versus DS-CDMA: Performance evaluation for fading channels,” in Proc.
IEEE International Conference on Communications (ICC’95), Seattle, USA, pp. 1722–1726, June 1995.
[33] Kaiser S., “On the performance of different detection techniques for OFDM-CDMA in fading channels,” in
Proc. IEEE Global Telecommunications Conference (GLOBECOM’95), Singapore, pp. 2059–2063, Nov.
1995.
[34] Kaiser S., Multi-Carrier CDMA Mobile Radio Systems – Analysis and Optimization of Detection, Decod-
ing, and Channel Estimation.D
¨
usseldorf: VDI-Verlag, Fortschrittberichte VDI, series 10, no. 531, 1998,
PhD Thesis.
[35] Kondo S. and Milstein L.B., “On the use of multicarrier direct sequence spread spectrum systems,” in
Proc. IEEE Military Communications Conference (MILCOM’93), Boston, USA, pp. 52–56, Oct. 1993.
[36] Linnartz J.P. and Hara S. (eds), Special Issue on Multi-Carrier Communications, Wireless Personal Com-
munications, Kluwer Academic Publishers, vol. 2, nos. 1 & 2, 1995.
[37] Mouly M. and Paulet M B., The GSM System for Mobile Communications Palaiseau: published by authors,
France 1992.
[38] Pereira J.M., “Beyond third generation,” in Proc. International Symposium on Wireless Personal Multi-
media Communications (WPMC’99), Amsterdam, The Netherlands, Sept. 1999.
[39] Pereira J.M., “Fourth Generation: Now it is personal!,” in Proc. IEEE International Symposium on Per-
sonal, Indoor and Mobile Radio Communications (PIMRC 2000), London, UK, pp. 1009–1016, Sept.
2000.
[40] Pickholtz R.L., Schilling D.L. and Milstein L.B., “Theory of spread-spectrum communications–a tuto-
rial,” IEEE Transactions on Communication Technology, vol. 30, pp. 855–884, May 1982.
References 13
[41] Saltzberg, B.R., “Performance of an efficient parallel data transmission system,” IEEE Transactions on
Communication Technology, vol. 15, pp. 805–811, Dec. 1967.
[42] Sourour E.A. and Nakagawa M., “Performance of orthogonal multi-carrier CDMA in a multipath fading
channel,” IEEE Transactions on Communication, vol. 44, pp. 356–367, March 1996.
[43] TIA/EIA/IS-95, “Mobile station-base station compatibility standard for dual mode wideband spread spec-
trum cellular system,” July 1993.
[44] TIA/EIA/IS-cdma2000, “Physical layer standard for cdma2000 spread spectrum systems,” Aug. 1999.
[45] Turin G.L., “Introduction to spread-spectrum anti-multi-path techniques and their application to urban
digital radio,” Proceedings of the IEEE, vol. 68, pp. 328–353, March 1980.
[46] Vandendorpe L., “Multitone direct sequence CDMA system in an indoor wireless environment,” in
Proc. IEEE First Symposium of Communications and Vehicular Technology, Delft, The Netherlands,
pp. 4.1.1–4.1.8, Oct. 1993.
[47] Viterbi A.J., “Spread-spectrum communications–myths and realities,” IEEE, Communications Magazine,
vol. 17, pp. 11–18, May 1979.
[48] Viterbi A.J., CDMA: Principles of Spread Spectrum Communication. Reading: Addison-Wesley, 1995.
[49] Weinstein S.B. and Ebert P.M., “Data transmission by frequency-division multiplexing using the discrete
Fourier transform,” IEEE Transactions on Communication Technology, vol. 19, pp. 628–634, Oct. 1971.
[50] Yee N., Linnartz J P. and Fettweis G., “Multi-carrier CDMA for indoor wireless radio networks,” in Proc.
International Symposium on Personal, Indoor and Mobile Radio Communications (PIMRC’93), Yokohama,
Japan, pp. 109–113, Sept. 1993.
1
Fundamentals
This chapter describes the fundamentals of today’s wireless communications. First a
detailed description of the radio channel and its modeling are presented, followed by the
introduction of the principle of OFDM multi-carrier transmission. In addition, a general
overview of the spread spectrum technique, especially DS-CDMA, is given and examples
of potential applications for OFDM and DS-CDMA are analyzed. This introduction is
essential for a better understanding of the idea behind the combination of OFDM with
the spread spectrum technique, which is briefly introduced in the last part of this chapter.
1.1 Radio Channel Characteristics
Understanding the characteristics of the communications medium is crucial for the appro-
priate selection of transmission system architecture, dimensioning of its components, and
optimizing system parameters, especially since mobile radio channels are considered to
be the most difficult channels, since they suffer from many imperfections like multipath
fading, interference, Doppler shift, and shadowing. The choice of system components is
totally different if, for instance, multipath propagation with long echoes dominates the
radio propagation.
Therefore, an accurate channel model describing the behavior of radio wave propagation
in different environments such as mobile/fixed and indoor/outdoor is needed. This may
allow one, through simulations, to estimate and validate the performance of a given
transmission scheme in its several design phases.
1.1.1 Understanding Radio Channels
In mobile radio channels (see Figure 1-1), the transmitted signal suffers from different
effects, which are characterized as follows:
Multipath propagation occurs as a consequence of reflections, scattering, and diffrac-
tion of the transmitted electromagnetic wave at natural and man-made objects. Thus, at
the receiver antenna, a multitude of waves arrives from many different directions with
different delays, attenuations, and phases. The superposition of these waves results in
amplitude and phase variations of the composite received signal.
Multi-Carrier and Spread Spectrum Systems K. Fazel and S. Kaiser
2003 John Wiley & Sons, Ltd ISBN: 0-470-84899-5
16 Fundamentals
BS
TS
Figure 1-1 Time-variant multipath propagation
Doppler spread is caused by moving objects in the mobile radio channel. Changes
in the phases and amplitudes of the arriving waves occur which lead to time-variant
multipath propagation. Even small movements on the order of the wavelength may result
in a totally different wave superposition. The varying signal strength due to time-variant
multipath propagation is referred to as fast fading.
Shadowing is caused by obstruction of the transmitted waves by, e.g., hills, buildings,
walls, and trees, which results in more or less strong attenuation of the signal strength.
Compared to fast fading, longer distances have to be covered to significantly change the
shadowing constellation. The varying signal strength due to shadowing is called slow
fading and can be described by a log-normal distribution [36].
Path loss indicates how the mean signal power decays with distance between transmitter
and receiver. In free space, the mean signal power decreases with the square of the distance
between base station (BS) and terminal station (TS). In a mobile radio channel, where
often no line of sight (LOS) path exists, signal power decreases with a power higher than
two and is typically in the order of three to five.
Variations of the received power due to shadowing and path loss can be efficiently
counteracted by power control. In the following, the mobile radio channel is described
with respect to its fast fading characteristic.
1.1.2 Channel Modeling
The mobile radio channel can be characterized by the time-variant channel impulse
response h(τ , t) or by the time-variant channel transfer function H(f,t), which is the
Fourier transform of h(τ , t). The channel impulse response represents the response of
the channel at time t due to an impulse applied at time t −τ. The mobile radio channel
is assumed to be a wide-sense stationary random process, i.e., the channel has a fading
statistic that remains constant over short periods of time or small spatial distances. In
environments with multipath propagation, the channel impulse response is composed of
a large number of scattered impulses received over N
p
different paths,
h(τ, t) =
N
p
−1
p=0
a
p
e
j(2πf
D,p
t+ϕ
p
)
δ(τ − τ
p
), (1.1)
Radio Channel Characteristics 17
where
δ(τ − τ
p
) =
1ifτ = τ
p
0otherwise
(1.2)
and a
p
, f
D,p
, ϕ
p
,andτ
p
are the amplitude, the Doppler frequency, the phase, and the
propagation delay, respectively, associated with path p, p = 0, ,N
p
− 1. The assigned
channel transfer function is
H(f,t) =
N
p
−1
p=0
a
p
e
j(2π(f
D,p
t−fτ
p
)+ϕ
p
)
.(1.3)
The delays are measured relative to the first detectable path at the receiver. The Doppler
frequency
f
D,p
=
vf
c
cos(α
p
)
c
(1.4)
depends on the velocity v of the terminal station, the speed of light c, the carrier frequency
f
c
, and the angle of incidence α
p
of a wave assigned to path p. A channel impulse response
with corresponding channel transfer function is illustrated in Figure 1-2.
The delay power density spectrum ρ(τ ) that characterizes the frequency selectivity of
the mobile radio channel gives the average power of the channel output as a function of
the delay τ . The mean delay
τ , the root mean square (RMS) delay spread τ
RMS
and the
maximum delay τ
max
are characteristic parameters of the delay power density spectrum.
The mean delay is
τ =
N
p
−1
p=0
τ
p
p
N
p
−1
p=0
p
,(1.5)
where
p
=|a
p
|
2
(1.6)
t
max
h(t, t)
t
H(f, t)
f
B
Figure 1-2 Time-variant channel impulse response and channel transfer function with
frequency-selective fading
18 Fundamentals
is the power of path p. The RMS delay spread is defined as
τ
RMS
=
N
p
−1
p=0
τ
2
p
p
N
p
−1
p=0
p
− τ
2
.(1.7)
Similarly, the Doppler power density spectrum S(f
D
) can be defined that characterizes
the time variance of the mobile radio channel and gives the average power of the channel
output as a function of the Doppler frequency f
D
. The frequency dispersive properties
of multipath channels are most commonly quantified by the maximum occurring Doppler
frequency f
Dmax
and the Doppler spread f
Dspread
. The Doppler spread is the bandwidth of
the Doppler power density spectrum and can take on values up to two times |f
Dmax
|, i.e.,
f
Dspread
2|f
Dmax
|.(1.8)
1.1.3 Channel Fade Statistics
The statistics of the fading process characterize the channel and are of importance for
channel model parameter specifications. A simple and often used approach is obtained
from the assumption that there is a large number of scatterers in the channel that contribute
to the signal at the receiver side. The application of the central limit theorem leads to
a complex-valued Gaussian process for the channel impulse response. In the absence of
line of sight (LOS) or a dominant component, the process is zero-mean. The magnitude
of the corresponding channel transfer function
a = a(f,t) =|H(f,t)| (1.9)
is a random variable, for brevity denoted by a, with a Rayleigh distribution given by
p(a) =
2a
e
−a
2
/
,(1.10)
where
= E{a
2
} (1.11)
is the average power. The phase is uniformly distributed in the interval [0, 2π ].
In the case that the multipath channel contains a LOS or dominant component in
addition to the randomly moving scatterers, the channel impulse response can no longer
be modeled as zero-mean. Under the assumption of a complex-valued Gaussian process
for the channel impulse response, the magnitude a of the channel transfer function has a
Rice distribution given by
p(a) =
2a
e
−(a
2
/+K
Rice
)
I
0
2a
K
Rice
.(1.12)
Radio Channel Characteristics 19
The Rice factor K
Rice
is determined by the ratio of the power of the dominant path to the
power of the scattered paths. I
0
is the zero-order modified Bessel function of first kind.
The phase is uniformly distributed in the interval [0, 2π ].
1.1.4 Inter-Symbol (ISI) and Inter-Channel Interference (ICI)
The delay spread can cause inter-symbol interference (ISI) when adjacent data symbols
overlap and interfere with each other due to different delays on different propagation paths.
The number of interfering symbols in a single-carrier modulated system is given by
N
ISI,single carrier
=
τ
max
T
d
.(1.13)
For high data rate applications with very short symbol duration T
d
<τ
max
, the effect of
ISI and, with that, the receiver complexity can increase significantly. The effect of ISI can
be counteracted by different measures such as time or frequency domain equalization. In
spread spectrum systems, rake receivers with several arms are used to reduce the effect of
ISI by exploiting the multipath diversity such that individual arms are adapted to different
propagation paths.
If the duration of the transmitted symbol is significantly larger than the maximum delay
T
d
τ
max
, the channel produces a negligible amount of ISI. This effect is exploited with
multi-carrier transmission where the duration per transmitted symbol increases with the
number of sub-carriers N
c
and, hence, the amount of ISI decreases. The number of
interfering symbols in a multi-carrier modulated system is given by
N
ISI,multi carrier
=
τ
max
N
c
T
d
.(1.14)
Residual ISI can be eliminated by the use of a guard interval (see Section 1.2).
The maximum Doppler spread in mobile radio applications using single-carrier modu-
lation is typically much less than the distance between adjacent channels, such that the
effect of interference on adjacent channels due to Doppler spread is not a problem for
single-carrier modulated systems. For multi-carrier modulated systems, the sub-channel
spacing F
s
can become quite small, such that Doppler effects can cause significant ICI. As
long as all sub-carriers are affected by a common Doppler shift f
D
, this Doppler shift can
be compensated for in the receiver and ICI can be avoided. However, if Doppler spread
in the order of several percent of the sub-carrier spacing occurs, ICI may degrade the
system performance significantly. To avoid performance degradations due to ICI or more
complex receivers with ICI equalization, the sub-carrier spacing F
s
should be chosen as
F
s
f
Dmax
,(1.15)
such that the effects due to Doppler spread can be neglected (see Chapter 4). This approach
corresponds with the philosophy of OFDM described in Section 1.2 and is followed in
current OFDM-based wireless standards.
Nevertheless, if a multi-carrier system design is chosen such that the Doppler spread
is in the order of the sub-carrier spacing or higher, a rake receiver in the frequency
domain can be used [22]. With the frequency domain rake receiver each branch of the
rake resolves a different Doppler frequency.
20 Fundamentals
1.1.5 Examples of Discrete Multipath Channel Models
Various discrete multipath channel models for indoor and outdoor cellular systems with
different cell sizes have been specified. These channel models define the statistics of the
discrete propagation paths. An overview of widely used discrete multipath channel models
is given in the following.
COST 207 [8]: The COST 207 channel models specify four outdoor macro cell prop-
agation scenarios by continuous, exponentially decreasing delay power density spectra.
Implementations of these power density spectra by discrete taps are given by using up
to 12 taps. Examples for settings with 6 taps are listed in Table 1-1. In this table for
several propagation environments the corresponding path delay and power profiles are
given. Hilly terrain causes the longest echoes.
The classical Doppler spectrum with uniformly distributed angles of arrival of the
paths can be used for all taps for simplicity. Optionally, different Doppler spectra are
defined for the individual taps in [8]. The COST 207 channel models are based on channel
measurements with a bandwidth of 8–10 MHz in the 900-MHz band used for 2G systems
such as GSM.
COST 231 [9] and COST 259 [10]: These COST actions which are the continuation
of COST 207 extend the channel characterization to DCS 1800, DECT, HIPERLAN and
UMTS channels, taking into account macro, micro, and pico cell scenarios. Channel
models with spatial resolution have been defined in COST 259. The spatial component is
introduced by the definition of several clusters with local scatterers, which are located in
a circle around the base station. Three types of channel models are defined. The macro
cell type has cell sizes from 500 m up to 5000 m and a carrier frequency of 900 MHz
or 1.8 GHz. The micro cell type is defined for cell sizes of about 300 m and a carrier
frequency of 1.2 GHz or 5 GHz. The pico cell type represents an indoor channel model
with cell sizes smaller than 100 m in industrial buildings and in the order of 10 m in an
office. The carrier frequency is 2.5 GHz or 24 GHz.
Table 1-1 Settings for the COST 207 channel models with 6 taps [8]
Rural area Typical urban Bad urban Hilly terrain
(RA) (TU) (BU) (HT)
Path #
delay power delay power delay power delay power
in µs in dB in µs in dB in µs in dB in µs in dB
1 0 0 0 −3 0 −2.5 0 0
2 0.1 −4 0.2 0 0.3 0 0.1 −1.5
3 0.2 −8 0.5 −2 1.0 −3 0.3 −4.5
4 0.3 −12 1.6 −6 1.6 −5 0.5 −7.5
5 0.4 −16 2.3 −8 5.0 −2 15.0 −8.0
6 0.5 −20 5.0 −10 6.6 −4 17.2 −17.7
Radio Channel Characteristics 21
COST 273: The COST 273 action additionally takes multi-antenna channel models into
account, which are not covered by the previous COST actions.
CODIT [7]: These channel models define typical outdoor and indoor propagation scenar-
ios for macro, micro, and pico cells. The fading characteristics of the various propagation
environments are specified by the parameters of the Nakagami-m distribution. Every
environment is defined in terms of a number of scatterers which can take on values up
to 20. Some channel models consider also the angular distribution of the scatterers. They
have been developed for the investigation of 3G system proposals. Macro cell chan-
nel type models have been developed for carrier frequencies around 900 MHz with 7
MHz bandwidth. The micro and pico cell channel type models have been developed
for carrier frequencies between 1.8 GHz and 2 GHz. The bandwidths of the measure-
ments are in the range of 10–100 MHz for macro cells and around 100 MHz for
pico cells.
JTC [28]: The JTC channel models define indoor and outdoor scenarios by specify-
ing 3 to 10 discrete taps per scenario. The channel models are designed to be applicable
for wideband digital mobile radio systems anticipated as candidates for the PCS (Per-
sonal Communications Systems) common air interface at carrier frequencies of about
2 GHz.
UMTS/UTRA [18][44]: Test propagation scenarios have been defined for UMTS and
UTRA system proposals which are developed for frequencies around 2 GHz. The mod-
eling of the multipath propagation corresponds to that used by the COST 207 chan-
nel models.
HIPERLAN/2 [33]: Five typical indoor propagation scenarios for wireless LANs in the
5 GHz frequency band have been defined. Each scenario is described by 18 discrete taps
of the delay power density spectrum. The time variance of the channel (Doppler spread)
is modeled by a classical Jake’s spectrum with a maximum terminal speed of 3 m/h.
Further channel models exist which are, for instance, given in [16].
1.1.6 Multi-Carrier Channel Modeling
Multi-carrier systems can either be simulated in the time domain or, more computationally
efficient, in the frequency domain. Preconditions for the frequency domain implementation
are the absence of ISI and ICI, the frequency nonselective fading per sub-carrier, and the
time-invariance during one OFDM symbol. A proper system design approximately fulfills
these preconditions. The discrete channel transfer function adapted to multi-carrier signals
results in
H
n,i
= H(nF
s
,iT
s
)
=
N
p
−1
p=0
a
p
e
j(2π(f
D,p
iT
s
−nF
s
τ
p
)+ϕ
p
)
= a
n,i
e
jϕ
n,i
(1.16)
where the continuous channel transfer function H(f,t) is sampled in time at OFDM
symbol rate 1/T
s
and in frequency at sub-carrier spacing F
s
. The duration T
s
is the total
OFDM symbol duration including the guard interval. Finally, a symbol transmitted on
22 Fundamentals
sub-channel n of the OFDM symbol i is multiplied by the resulting fading amplitude a
n,i
and rotated by a random phase ϕ
n,i
.
The advantage of the frequency domain channel model is that the IFFT and FFT
operation for OFDM and inverse OFDM can be avoided and the fading operation results in
one complex-valued multiplication per sub-carrier. The discrete multipath channel models
introduced in Section 1.1.5 can directly be applied to (1.16). A further simplification of
the channel modeling for multi-carrier systems is given by using the so-called uncorrelated
fading channel models.
1.1.6.1 Uncorrelated Fading Channel Models for Multi-Carrier Systems
These channel models are based on the assumption that the fading on adjacent data sym-
bols after inverse OFDM and de-interleaving can be considered as uncorrelated [29]. This
assumption holds when, e.g., a frequency and time interleaver with sufficient interleaving
depth is applied. The fading amplitude a
n,i
is chosen from a distribution p(a) according to
the considered cell type and the random phase ϕ
n,I
is uniformly distributed in the interval
[0,2π]. The resulting complex-valued channel fading coefficient is thus generated inde-
pendently for each sub-carrier and OFDM symbol. For a propagation scenario in a macro
cell without LOS, the fading amplitude a
n,i
is generated by a Rayleigh distribution and the
channel model is referred to as an uncorrelated Rayleigh fading channel. For smaller cells
where often a dominant propagation component occurs, the fading amplitude is chosen
from a Rice distribution. The advantages of the uncorrelated fading channel models for
multi-carrier systems are their simple implementation in the frequency domain and the
simple reproducibility of the simulation results.
1.1.7 Diversity
The coherence bandwidth (f )
c
of a mobile radio channel is the bandwidth over which
the signal propagation characteristics are correlated and it can be approximated by
(f )
c
≈
1
τ
max
.(1.17)
The channel is frequency-selective if the signal bandwidth B is larger than the coher-
ence bandwidth (f )
c
. On the other hand, if B is smaller than (f )
c
, the channel is
frequency nonselective or flat. The coherence bandwidth of the channel is of importance
for evaluating the performance of spreading and frequency interleaving techniques that
try to exploit the inherent frequency diversity D
f
of the mobile radio channel. In the
case of multi-carrier transmission, frequency diversity is exploited if the separation of
sub-carriers transmitting the same information exceeds the coherence bandwidth. The
maximum achievable frequency diversity D
f
is given by the ratio between the signal
bandwidth B and the coherence bandwidth,
D
f
=
B
(f )
c
.(1.18)
Radio Channel Characteristics 23
The coherence time of the channel (t)
c
is the duration over which the channel charac-
teristics can be considered as time-invariant and can be approximated by
(t)
c
≈
1
2f
Dmax
.(1.19)
If the duration of the transmitted symbol is larger than the coherence time, the channel is
time-selective. On the other hand, if the symbol duration is smaller than (t)
c
, the channel
is time nonselective during one symbol duration. The coherence time of the channel is of
importance for evaluating the performance of coding and interleaving techniques that try
to exploit the inherent time diversity D
O
of the mobile radio channel. Time diversity can
be exploited if the separation between time slots carrying the same information exceeds
the coherence time. A number of N
s
successive time slots create a time frame of duration
T
fr
. The maximum time diversity D
t
achievable in one time frame is given by the ratio
between the duration of a time frame and the coherence time,
D
t
=
T
fr
(t)
c
.(1.20)
A system exploiting frequency and time diversity can achieve the overall diversity
D
O
= D
f
D
t
.(1.21)
The system design should allow one to optimally exploit the available diversity D
O
.
For instance, in systems with multi-carrier transmission the same information should be
transmitted on different sub-carriers and in different time slots, achieving uncorrelated
faded replicas of the information in both dimensions.
Uncoded multi-carrier systems with flat fading per sub-channel and time-invariance
during one symbol cannot exploit diversity and have a poor performance in time and
frequency selective fading channels. Additional methods have to be applied to exploit
diversity. One approach is the use of data spreading where each data symbol is spread
by a spreading code of length L. This, in combination with interleaving, can achieve
performance results which are given for D
O
L by the closed-form solution for the
BER for diversity reception in Rayleigh fading channels according to [40]
P
b
=
1 − γ
2
L
L−1
l=0
L − 1 + l
l
1 + γ
2
l
,(1.22)
where
n
k
represents the combinatory function,
γ =
1
1 + σ
2
,(1.23)
and σ
2
is the variance of the noise. As soon as the interleaving is not perfect or the
diversity offered by the channel is smaller than the spreading code length L,orMC-
CDMA with multiple access interference is applied, (1.22) is a lower bound. For L = 1,
the performance of an OFDM system without forward error correction (FEC) is obtained,
24 Fundamentals
024
6
8 101214
16
18 20
E
b
/N
0
in dB
10
−5
10
−4
10
−3
10
−2
10
−1
10
0
BER
OFDM (OFDMA, MC-TDMA)
MC-SS
AWGN
L = 4
L = 2
L = 8
L=16
L = 1
Figure 1-3 Diversity in OFDM and MC-SS systems in a Rayleigh fading channel
which cannot exploit any diversity. The BER according to (1.22) of an OFDM (OFDMA,
MC-TDMA) system and a multi-carrier spread spectrum (MC-SS) system with differ-
ent spreading code lengths L is shown in Figure 1-3. No other diversity techniques are
applied. QPSK modulation is used for symbol mapping. The mobile radio channel is
modeled as uncorrelated Rayleigh fading channel (see Section 1.1.6). As these curves
show, for large values of L, the performance of MC-SS systems approaches that of an
AWGN channel.
Another form of achieving diversity in OFDM systems is channel coding by FEC,
where the information of each data bit is spread over several code bits. Additional to the
diversity gain in fading channels, a coding gain can be obtained due to the selection of
appropriate coding and decoding algorithms.
1.2 Multi-Carrier Transmission
The principle of multi-carrier transmission is to convert a serial high-rate data stream
onto multiple parallel low-rate sub-streams. Each sub-stream is modulated on another
sub-carrier. Since the symbol rate on each sub-carrier is much less than the initial serial
data symbol rate, the effects of delay spread, i.e., ISI, significantly decrease, reducing the
complexity of the equalizer. OFDM is a low-complex technique to efficiently modulate
multiple sub-carriers by using digital signal processing [5][14][26][46][49].
An example of multi-carrier modulation with four sub-channels N
c
= 4 is depicted in
Figure 1-4. Note that the three-dimensional time/frequency/power density representation
is used to illustrate the principle of various multi-carrier and multi-carrier spread spectrum
Multi-Carrier Transmission 25
serial data symbols
serial-
to-
parallel
converter
sub-carrier
f
0
sub-carrier
f
1
sub-carrier
f
N
c
−1
parallel data symbols
T
s
•
Figure 1-4 Multi-carrier modulation with N
c
= 4 sub-channels
systems. A cuboid indicates the three-dimensional time/frequency/power density range of
the signal, in which most of the signal energy is located and does not make any statement
about the pulse or spectrum shaping.
An important design goal for a multi-carrier transmission scheme based on OFDM in
a mobile radio channel is that the channel can be considered as time-invariant during one
OFDM symbol and that fading per sub-channel can be considered as flat. Thus, the OFDM
symbol duration should be smaller than the coherence time (t)
c
of the channel and the
sub-carrier spacing should be smaller than the coherence bandwidth (f )
c
of the channel.
By fulfilling these conditions, the realization of low-complex receivers is possible.
1.2.1 Orthogonal Frequency Division Multiplexing (OFDM)
A communication system with multi-carrier modulation transmits N
c
complex-valued
source symbols
1
S
n
, n = 0, ,N
c
− 1, in parallel on N
c
sub-carriers. The source symbols
may, for instance, be obtained after source and channel coding, interleaving, and symbol
mapping. The source symbol duration T
d
of the serial data symbols results after serial-
to-parallel conversion in the OFDM symbol duration
T
s
= N
c
T
d
.(1.24)
The principle of OFDM is to modulate the N
c
sub-streams on sub-carriers with a spac-
ing of
F
s
=
1
T
s
(1.25)
in order to achieve orthogonality between the signals on the N
c
sub-carriers, presuming a
rectangular pulse shaping. The N
c
parallel modulated source symbols S
n
, n = 0, ,N
c
−
1, are referred to as an OFDM symbol. The complex envelope of an OFDM symbol with
rectangular pulse shaping has the form
x(t) =
1
N
c
N
c
−1
n=0
S
n
e
j2πf
n
t
, 0 t<T
s
.(1.26)
1
Variables which can be interpreted as values in the frequency domain like the source symbols S
n
, each
modulating another sub-carrier frequency, are written with capital letters.
26 Fundamentals
The N
c
sub-carrier frequencies are located at
f
n
=
n
T
s
,n= 0, ,N
c
− 1.(1.27)
The normalized power density spectrum of an OFDM symbol with 16 sub-carriers versus
the normalized frequency fT
d
is depicted as a solid curve in Figure 1-5. Note that in
this figure the power density spectrum is shifted to the center frequency. The symbols
S
n
, n = 0, ,N
c
− 1, are transmitted with equal power. The dotted curve illustrates the
power density spectrum of the first modulated sub-carrier and indicates the construction
of the overall power density spectrum as the sum of N
c
individual power density spec-
tra, each shifted by F
s
. For large values of N
c
, the power density spectrum becomes
flatter in the normalized frequency range of −0.5
fT
d
0.5 containing the N
c
sub-
channels.
Only sub-channels near the band edges contribute to the out-of-band power emission.
Therefore, as N
c
becomes large, the power density spectrum approaches that of single-
carrier modulation with ideal Nyquist filtering.
A key advantage of using OFDM is that multi-carrier modulation can be implemented
in the discrete domain by using an IDFT, or a more computationally efficient IFFT. When
sampling the complex envelope x(t) of an OFDM symbol with rate 1/T
d
the samples are
x
v
=
1
N
c
N
c
−1
n=0
S
n
e
j2πnv/N
c
,v= 0, ,N
c
− 1.(1.28)
−1
−0.5
0
0.5
1
Normalized frequency
10
0
−10
−20
−30
Power spectral density
spectrum of 1st sub-channel
OFDM spectrum
Figure 1-5 OFDM spectrum with 16 sub-carriers
Multi-Carrier Transmission 27
inverse OFDM
IDFT
or
IFFT
OFDM
multipath
propagation
h(t, t)
DFT
or
FFT
remove
guard
interval
add
guard
interval
S
n
x(t)
y(t)
n(t)
x
n
R
n
y
n
serial-
to-
parallel
converter
serial-
to-
parallel
converter
parallel-
to-
serial
converter
parallel-
to-
serial
converter
digital-
to-
analog
converter
analog-
to-
digital
converter
Figure 1-6 Digital multi-carrier transmission system applying OFDM
The sampled sequence x
v
, v = 0, ,N
c
− 1, is the IDFT of the source symbol sequence
S
n
, n = 0, ,N
c
− 1. The block diagram of a multi-carrier modulator employing OFDM
based on an IDFT and a multi-carrier demodulator employing inverse OFDM based on a
DFT is illustrated in Figure 1-6.
When the number of sub-carriers increases, the OFDM symbol duration T
s
becomes
large compared to the duration of the impulse response τ
max
of the channel, and the
amount of ISI reduces.
However, to completely avoid the effects of ISI and, thus, to maintain the orthogonality
between the signals on the sub-carriers, i.e., to also avoid ICI, a guard interval of duration
T
g
τ
max
(1.29)
has to be inserted between adjacent OFDM symbols. The guard interval is a cyclic exten-
sion of each OFDM symbol which is obtained by extending the duration of an OFDM
symbol to
T
s
= T
g
+ T
s
.(1.30)
The discrete length of the guard interval has to be
L
g
τ
max
N
c
T
s
(1.31)
samples in order to prevent ISI. The sampled sequence with cyclic extended guard interval
results in
x
v
=
1
N
c
N
c
−1
n=0
S
n
e
j2πnv/N
c
,v=−L
g
, ,N
c
− 1.(1.32)
28 Fundamentals
This sequence is passed through a digital-to-analog converter whose output ideally
would be the signal waveform x(t) with increased duration T
s
. The signal is up con-
verted and the RF signal is transmitted to the channel (see Chapter 4 regarding RF
up/down conversion).
The output of the channel, after RF down conversion, is the received signal waveform
y(t) obtained from convolution of x(t) with the channel impulse response h(τ ,t)and
addition of a noise signal n(t), i.e.,
y(t) =
∞
−∞
x(t − τ)h(τ,t)dτ +n(t). (1.33)
The received signal y(t) is passed through an analog-to-digital converter, whose output
sequence y
v
, v =−L
g
, ,N
c
− 1, is the received signal y(t) sampled at rate 1/T
d
.Since
ISI is only present in the first L
g
samples of the received sequence, these L
g
samples
are removed before multi-carrier demodulation. The ISI-free part v = 0, ,N
c
− 1, of
y
v
is multi-carrier demodulated by inverse OFDM exploiting a DFT. The output of the
DFT is the multi-carrier demodulated sequence R
n
, n = 0, ,N
c
− 1, consisting of N
c
complex-valued symbols
R
n
=
N
c
−1
v=0
y
v
e
−j2πnv/N
c
,n= 0, ,N
c
− 1.(1.34)
Since ICI can be avoided due to the guard interval, each sub-channel can be considered
separately. Furthermore, when assuming that the fading on each sub-channel is flat and ISI
is removed, a received symbol R
n
is obtained from the frequency domain representation
according to
R
n
= H
n
S
n
+ N
n
,n= 0, ,N
c
− 1,(1.35)
where H
n
is the flat fading factor and N
n
represents the noise of the nth sub-channel.
The flat fading factor H
n
is the sample of the channel transfer function H
n,i
according
to (1.16) where the time index i is omitted for simplicity. The variance of the noise is
given by
σ
2
= E{|N
n
|
2
}.(1.36)
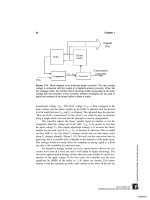
When ISI and ICI can be neglected, the multi-carrier transmission system shown in
Figure 1-6 can be viewed as a discrete time and frequency transmission system with a
set of N
c
parallel Gaussian channels with different complex-valued attenuations H
n
(see
Figure 1-7).
A time/frequency representation of an OFDM symbol is shown in Figure 1-8(a). A
block of subsequent OFDM symbols, where the information transmitted within these
OFDM symbols belongs together, e.g., due to coding and/or spreading in time and fre-
quency direction, is referred to as an OFDM frame. An OFDM frame consisting of N
s
OFDM symbols with frame duration
T
fr
= N
s
T
s
(1.37)
is illustrated in Figure 1-8(b).
Multi-Carrier Transmission 29
S
0
R
0
H
0
N
0
S
N
c
−1
R
N
c
−1
N
N
c
−1
H
N
c
−1
S/P P/S
• • •
Figure 1-7 Simplified multi-carrier transmission system using OFDM
(a) OFDM symbol (b) OFDM frame
0
N
c
−1
F
s
=
sub-carriers
n
symbol on
sub-carrier n
T
s
′
1
T
s
OFDM symbols
sub-carriers
0
B = N
c
F
s
0
N
c
−1
N
s
−1
T
fr
= N
s
T
s
′
Figure 1-8 Time/frequency representation of an OFDM symbol and an OFDM frame
The following matrix-vector notation is introduced to concisely describe multi-carrier
systems. Vectors are represented by boldface small letters and matrices by boldface
capital letters. The symbol (·)
T
denotes the transposition of a vector or a matrix. The
complex-valued source symbols S
n
, n = 0, ,N
c
− 1, transmitted in parallel in one
OFDM symbol, are represented by the vector
s = (S
0
,S
1
, ,S
N
c
−1
)
T
.(1.38)
The N
c
× N
c
channel matrix
H =
H
0,0
0 ··· 0
0 H
1,1
0
.
.
.
.
.
.
.
.
.
00··· H
N
c
−1,N
c
−1
(1.39)
30 Fundamentals
is of diagonal type in the absence of ISI and ICI. The diagonal components of H are the
complex-valued flat fading coefficients assigned to the N
c
sub-channels. The vector
n = (N
0
,N
1
, ,N
N
c
−1
)
T
(1.40)
represents the additive noise. The received symbols obtained after inverse OFDM are
given by the vector
r = (R
0
,R
1
, ,R
N
c
−1
)
T
(1.41)
and are obtained by
r = Hs + n.(1.42)
1.2.2 Advantages and Drawbacks of OFDM
This section summarizes the strengths and weaknesses of multi-carrier modulation based
on OFDM.
Advantages:
— High spectral efficiency due to nearly rectangular frequency spectrum for high numbers
of sub-carriers.
— Simple digital realization by using the FFT operation.
— Low complex receivers due to the avoidance of ISI and ICI with a sufficiently long
guard interval.
— Flexible spectrum adaptation can be realized, e.g., notch filtering.
— Different modulation schemes can be used on individual sub-carriers which are adapted
to the transmission conditions on each sub-carrier, e.g., water filling.
Disadvantages:
— Multi-carrier signals with high peak-to-average power ratio (PAPR) require high linear
amplifiers. Otherwise, performance degradations occur and the out-of-band power will
be enhanced.
— Loss in spectral efficiency due to the guard interval.
— More sensitive to Doppler spreads then single-carrier modulated systems.
— Phase noise caused by the imperfections of the transmitter and receiver oscillators
influence the system performance.
— Accurate frequency and time synchronization is required.
1.2.3 Applications and Standards
The key parameters of various multi-carrier-based communications standards for broad-
casting, WLAN and WLL, are summarized in Tables 1-2 to 1-4.
1.3 Spread Spectrum Techniques
Spread spectrum systems have been developed since the mid-1950s. The initial appli-
cations have been military antijamming tactical communications, guidance systems, and
experimental anti-multipath systems [39][43].
Spread Spectrum Techniques 31
Table 1-2 Broadcasting standards DAB and DVB-T
Parameter DAB DVB-T
Bandwidth 1.5 MHz 8MHz
Number of
sub-carriers N
c
192
(256 FFT)
384
(512 FFT)
1536
(2k FFT)
1705
(2k FFT)
6817
(8k FFT)
Symbol
duration T
s
125 µs 250 µs 1ms 224 µs 896 µs
Carrier spacing
F
s
8kHz 4kHz 1kHz 4.464 kHz 1.116 kHz
Guard time T
g
31 µs 62 µs 246 µs T
s
/32,T
s
/16,T
s
/8,T
s
/4
Modulation D-QPSK QPSK, 16-QAM, 64-QAM
Convolutional Reed Solomon + convolutional
FEC coding with code rate 1/3 up to 3/4 with code rate 1/2 up to 7/8
Max. data rate 1.7 Mbit/s 31.7 Mbit/s
Table 1-3 Wireless local area network (WLAN) standards
Parameter IEEE 802.11a, HIPERLAN/2
Bandwidth 20 MHz
Number of sub-carriers N
c
52
(64 FFT)
Symbol duration T
s
4 µs
Carrier spacing F
s
312.5 kHz
Guard time T
g
0.8 µs
Modulation BPSK, QPSK, 16-QAM, and 64-QAM
FEC coding Convolutional with code rate 1/2 up to 3/4
Max. data rate 54 Mbit/s
Literally, a spread spectrum system is one in which the transmitted signal is spread over
a wide frequency band, much wider than the minimum bandwidth required to transmit
the information being sent (see Figure 1-9). Band spreading is accomplished by means of
a code which is independent of the data. A reception synchronized to the code is used to
despread and recover the data at the receiver [47][48].
32 Fundamentals
Table 1-4 Wireless local loop (WLL) standards
Parameter Draft IEEE 802.16a, HIPERMAN
Bandwidth from 1.5 to 28 MHz
Number of sub-carriers
N
c
256 (OFDM mode) 2048 (OFDMA mode)
from 8 to 125 µs from 64 to 1024 µs
Symbol duration T
s
(depending on bandwidth) (depending on bandwidth)
Guard time T
g
from1/32upto1/4ofT
s
Modulation QPSK, 16-QAM, and 64-QAM
Reed Solomon +convolutional
FEC coding with code rate 1/2 up to 5/6
Max. data rate (in a 7
MHz channel)
up to 26 Mbit/s
Signal bandwidth B after spreading
Signal bandwidth B
s
before spreading
Power density
Frequency
Figure 1-9 Power spectral density after direct sequence spreading
There are many application fields for spreading the spectrum [13]:
— Antijamming,
— Interference rejection,
— Low probability of intercept,
— Multiple access,
— Multipath reception,
— Diversity reception,
— High resolution ranging,
— Accurate universal timing.
There are two primary spread spectrum concepts for multiple access: direct sequence
code division multiple access (DS-CDMA) and frequency hopping code division multiple
access (FH-CDMA).
Spread Spectrum Techniques 33
The general principle behind DS-CDMA is that the information signal with bandwidth
B
s
is spread over a bandwidth B,whereB B
s
. The processing gain is specified as
P
G
=
B
B
s
.(1.43)
The higher the processing gain, the lower the power density one needs to transmit the
information. If the bandwidth is very large, the signal can be transmitted such that it
appears like a noise. Here, for instance ultra wide band (UWB) systems (see Chapter 3)
can be mentioned as a example [37].
One basic design problem with DS-CDMA is that, when multiple users access the same
spectrum, it is possible that a single user could mask all other users at the receiver side
if its power level is too high. Hence, accurate power control is an inherent part of any
DS-CDMA system [39].
For signal spreading, pseudorandom noise (PN) codes with good cross- and autocorre-
lation properties are used [38]. A PN code is made up from a number of chips for mixing
the data with the code (see Figure 1-10). In order to recover the received signal, the code
which the signal was spread with in the transmitter is reproduced in the receiver and
mixed with the spread signal. If the incoming signal and the locally generated PN code
are synchronized, the original signal after correlation can be recovered. In a multiuser
environment, the user signals are distinguished by different PN codes and the receiver
needs only knowledge of the user’s PN code and has to synchronize with it. This princi-
ple of user separation is referred to as DS-CDMA. The longer the PN code is, the more
noise-like signals appear. The drawback is that synchronization becomes more difficult
unless synchronization information such as pilot signals is sent to aid acquisition.
Frequency hopping (FH) is similar to direct sequence spreading where a code is used to
spread the signal over a much larger bandwidth than that required to transmit the signal.
However, instead of spreading the signal over a continuous bandwidth by mixing the signal
with a code, the signal bandwidth is unchanged and is hopped over a number of channels,
each having the same bandwidth as the transmitted signal. Although at any instant the
transmit power level in any narrowband region may be higher than with DS-CDMA, the
signal may be present in a particular channel for a very small time period.
data symbols
spreading code
01
.
L-1
spread data symbols
01
.
L-1
01
.
L-1
01
.
L-1
01
.
L-1
carrier
f
c
T
c
{
Figure 1-10 Principle of DS-CDMA
34 Fundamentals
For detection, the receiver must know in advance the hopping pattern, unless it will
be very difficult to detect the signal. It is the function of the PN code to ensure that all
frequencies in the total available bandwidth are optimally used.
There are two kinds of frequency hopping [13]: slow frequency hopping (SFH) and
fast frequency hopping (FFH). With SFH many symbols are transmitted per hop. FFH
means that there are many hops per symbol. FFH is more resistant to jamming but it is
more complex to implement since fast frequency synthesizers are required.
In order to reduce complexity, a hybrid DS/FH scheme can be considered. Here, the
signal is first spread over a bandwidth as in DS-CDMA and then hopped over a number
of channels, each with bandwidth equal to the bandwidth of the DS spread signal. This
allows one to use a much larger bandwidth than with conventional DS spreading by using
low cost available components. For instance, if we have a 1 GHz spectrum available, a
PN code generator producing 10
9
chips/s or hopping achieving 10
9
hops/s might not be
practicable. Alternatively, we could use two code generators: one for spreading the signal
and the other for producing the hopping pattern. Both codes could be generated using
low cost components.
1.3.1 Direct Sequence Code Division Multiple Access
The principle of DS-CDMA is to spread a data symbol with a spreading sequence c
(k)
(t)
of length L,
c
(k)
(t) =
L−1
l=0
c
(k)
l
p
T
c
(t −lT
c
), (1.44)
assigned to user k,k = 0, ,K − 1, where K is the total number of active users. The
rectangular pulse p
Tc
(t) is equal to 1 for 0 t<T
c
and zero otherwise. T
c
is the chip
duration and c
(k)
l
are the chips of the user specific spreading sequence c
(k)
(t).After
spreading, the signal x
(k)
(t) of user k is given by
x
(k)
(t) = d
(k)
L−1
l=0
c
(k)
l
p
T
c
(t − lT
c
), 0 t<T
d
,(1.45)
for one data symbol duration T
d
= LT
c
,whered
(k)
is the transmitted data symbol of user
k. The multiplication of the information sequence with the spreading sequence is done
bit-synchronously and the overall transmitted signal x(t) of all K synchronous users (case
downlink of a cellular system) results in
x(t) =
K−1
k=0
x
(k)
(t). (1.46)
The proper choice of spreading sequences is a crucial problem in DS-CDMA, since the
multiple access interference strongly depends on the cross-correlation function (CCF) of
the used spreading sequences. To minimize the multiple access interference, the CCF val-
ues should be as small as possible [41]. In order to guarantee equal interference among
all transmitting users, the cross-correlation properties between different pairs of spread-
ing sequences should be similar. Moreover, the autocorrelation function (ACF) of the
Spread Spectrum Techniques 35
spreading sequences should have low out-of-phase peak magnitudes in order to achieve
a reliable synchronization.
The received signal y(t) obtained at the output of the radio channel with impulse
response h(t) can be expressed as
y(t) = x(t) ⊗ h(t) + n(t) = r(t) +n(t)
=
K−1
k=0
r
(k)
(t) +n(t) (1.47)
where r
(k)
(t) = x
(k)
(t) ⊗h(t) is the noise-free received signal of user k, n(t) is the addi-
tive white Gaussian noise (AWGN), and ⊗ denotes the convolution operation. The impulse
response of the matched filter (MF) h
(k)
MF
(t) in the receiver of user k is adapted to both the
transmitted waveform including the spreading sequence c
(k)
(t) and to the channel impulse
response h(t),
h
(k)
MF
(t) = c
(k)∗
(−t) ⊗ h
∗
(−t). (1.48)
The notation x
∗
denotes the conjugate of the complex value x. The signal z
(k)
(t) after the
matched filter of user k can be written as
z
(k)
(t) = y(t) ⊗ h
(k)
MF
(t)
= r
(k)
(t) ⊗h
(k)
MF
(t) +
K−1
g=0
g=k
r
(g)
(t) ⊗h
(g)
MF
(t) +n(t) ⊗ h
(k)
MF
(t). (1.49)
After sampling at the time-instant t = 0, the decision variable ρ
(k)
for user k results in
ρ
(k)
= z
(k)
(0)
=
T
d
+τ
max
0
r
(k)
(τ )h
(k)
MF
(τ ) dτ +
K−1
g=0
g=k
T
d
+τ
max
0
r
(g)
(τ )h
(g)
MF
(τ ) dτ
+
T
d
+τ
max
0
n(τ )h
(k)
MF
(τ ) dτ, (1.50)
where τ
max
is the maximum delay of the radio channel.
Finally, a threshold detection on ρ
(k)
is performed to obtain the estimated information
symbol
ˆ
d
(k)
. The first term in the above equation is the desired signal part of user k,
whereas the second term corresponds to the multiple access interference and the third
term is the additive noise. It should be noted that due to the multiple access interference
the estimate of the information bit might be wrong with a certain probability even at high
SNRs, leading to the well-known error-floor in the BER curves of DS-CDMA systems.
Ideally, the matched filter receiver resolves all multipath propagation in the channel.
In practice a good approximation of a matched filter receiver is a rake receiver [40][43]
(see Section 1.3.1.2). A rake receiver has D arms to resolve D echoes where D might be
limited by the implementation complexity. In each arm d, d = 0, ,D− 1, the received
36 Fundamentals
signal y(t) is delayed and despread with the code c
(k)
(t) assigned to user k and weighted
with the conjugate instantaneous value h
∗
d
, d = 0, ,D− 1, of the time-varying complex
channel attenuation of the assigned echo. Finally, the rake receiver combines the results
obtained from each arm and makes a final decision.
1.3.1.1 DS-CDMA Transmitter
Figure 1-11 shows a direct sequence spread spectrum transmitter [40]. It consists of a
forward error correction (FEC) encoder, mapping, spreader, pulse shaper, and analog
front-end (IF/RF part). Channel coding is required to protect the transmitted data against
channel errors. The encoded and mapped data are spread with the code c
(k)
(t) over a
much wider bandwidth than the bandwidth of the information signal. As the power of the
output signal is distributed over a wide bandwidth, the power density of the output signal
is much lower than that of the input signal. Note that the multiplication process is done
with a spreading sequence with no DC component.
The chip rate directly influences the bandwidth and with that the processing gain.
The wider the bandwidth, the better the resolution in multipath detection. Since the total
transmission bandwidth is limited, a pulse shaping filtering is employed (e.g., a root
Nyquist filter) so that the frequency spectrum is used efficiently.
1.3.1.2 DS-CDMA Receiver
In Figure 1-12, the receiver block-diagram of a DS-CDMA signal is plotted [40]. The
received signal is first filtered and then digitally converted with a sampling rate of 1/T
c
.
It is followed by a rake receiver. The rake receiver is necessary to combat multipath,
i.e., to combine the power of each received echo path. The echo paths are detected with
a resolution of T
c
. Therefore, each received signal of each path is delayed by lT
c
and
Data
c
(k)
(t)
Spreader
Tx filtering
Channel
coding and
interleaving
Mapping
Analog
front-end
Figure 1-11 DS spread spectrum transmitter block diagram
Data
c
(k)
(t)
T
c
lT
c
Combining
Rake receiver
A/D
c
(k)
(t)
c
(k)
(t)
Demap.,
deinterl.,
channel
decoding
Integrator
Integrator
Integrator
Rx
filter
Analog
front-end
• • •
Figure 1-12 DS-CDMA rake receiver block diagram