public utilities management challenges for the 21st century phần 3 doc
Bạn đang xem bản rút gọn của tài liệu. Xem và tải ngay bản đầy đủ của tài liệu tại đây (258.4 KB, 12 trang )
Water System Adaptation
l Approach:
u Invest in actions that mitigate
uncertainty and enhance flexibility
and resiliency so that system
managers can continue to meet their
responsibilities.
l Identify potential impacts through
downscaling and characterizing
system specific strengths and
vulnerabilities
l Adjust operations to test system
flexibility
l Develop portfolio of adaptation
options
l Engage in ongoing research &
collaborate
Portfolio of Adaptation Options
l SPU identified a series of intra-system
modifications and new supply options – and
grouped them into Tiers.
l Applied the effects on supply using Tier 1
intra-system modifications.
l Where Tier 1 modifications did not restore
supply fully, identified the need for
subsequent Tiers.
Tier 1 Solutions/Optimize
Existing Supply
l Modify storage level of Cedar Reservoir and
replace overflow dike
l Change rule curve/operating procedures for
the Tolt Reservoir
l Make modifications to Lake Young Reservoir
Next Tiers Available to SPU
l Tier 2 – Next Tier of Intra-System Modifications
u Include additional use of Lake Youngs Storage (402-497)
u Modified/optimized conjunctive use operations
u Additional conservation programs after 2030
l Tier 3 – Greater Use of Storage
u Higher refill levels at Chester Morse Lake (1566')
u Higher flood pool level at CML (assumes max level increased to 1575)
l Tier 4 – New Supply Alternatives
u Deeper drawdown of South Fork Tolt reservoir (1660’)
u Deeper drawdown of Lake Youngs (28’), Cedar Filtration
u Use of Dead Storage for normal supply, after pumping plant replacement
u Develop North Fork Tolt Diversion
u Develop Snoqualmie Aquifer Project
u Northshore and Woodinville develop Weyerhaeuser/Everett supply
u Reclaimed water projects in Retail Service Area
u Additional conservation programs
l Tier 5 – New Supply Concepts
u Reclaimed water projects in Wholesale Service Area
u Desalination plant
u Higher refill levels at Tolt reservoir (raising ring gate)
u Etc.
Bottom Line
Triple Bottom Line: Understanding
Community Impacts
Full Cost and Benefit Accounting:
l Financial
l Social
l Environmental
TBL: Financial, Social, Environmental
Examples:
l Value of stream habitat
l Value of green space
l Cost of traffic delay
l Cost of service outage
l Cost of greenhouse gas emissions
l Value of natural landscaping practices
$-
$500
$1,000
$1,500
$2,000
$2,500
$3,000
1 4 8 12 16 20 24
Y
ears
Social and Environmental
Risk Cost
Financial Cost
Proactive Replacement
Replacement on Failure
Discounted Present Value of Cost
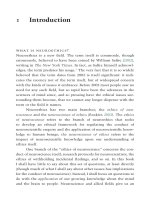
Example #1: Triple Bottom Line Justifies Early
Replacement of Plastic Service Pipes
Risk Category Probability Consequence Risk Cost
Service Interruption 10% 1 hr x 10 cust x $100/hr/cust $100
Property Use Impact 1% $2,000 $20
Surface Water Discharge 0.1% $1,000 $1
Traffic Delay
10% 1 hr x 400 cars/hr x $5/car $200
Total $321
Example #2: Value Model Helps Choose Best Triple
Bottom Line Value-for-Money Options
Environmental Impacts Social Impacts
a. fish passage a. pipeline security
b. sediment transport b. recreational access
c. large woody debris transport
d. aquatic invertebrate habitat
e. presence of ambient light
Value Scores Assigned to Each
Option for:
Best Value-for-Money
Example #3: Triple Bottom Line “Reasonable Person” Test
Helps Choose Lowest Cost Option
Guide for TBL Valuation
l When available, use agreed values for non-
market (social and environmental) benefits
and costs, otherwise:
l When justified, use agreed non-market
valuation techniques to estimate value,
otherwise:
l Use “reasonable person test” to determine
“break-even” value of non-market benefits or
costs
Minimizing Life Cycle Costs
Optimal balancing of:
Operation
Performance
Maintenance
Repair
Rehab
Renewal
Risk
Over full life cycle of asset
Replace Assets at end of Economic Life – Minimum Average Life Cycle
Cost
Age of Asset
$
A
verage Replacement
Cost
A
verage Repair
Cost
Life Cycle Cost
Economic Life
An Example: Tying Together Service Levels,
Lifecycle Costing, and the Triple Bottom Line
100+908070605040302010 5
Estimated Number of Sewer Backups per Year
$$
100%
Reactive
100%
Proactive
A Sample
A Sample
“
“
Bathtub Curve
Bathtub Curve
”
”
for the Sewer Maintenance Program
for the Sewer Maintenance Program
An Example: Tying Together Service Levels,
Lifecycle Costing, and the Triple Bottom Line
100+908070605040302010 5
Estimated Number of Sewer Backups per Year
Labor and equip. costs
$$
100%
Reactive
100%
Proactive
A Sample
A Sample
“
“
Bathtub Curve
Bathtub Curve
”
”
for the Sewer Maintenance Program
for the Sewer Maintenance Program
An Example: Tying Together Service Levels,
Lifecycle Costing, and the Triple Bottom Line
100+908070605040302010 5
Estimated Number of Sewer Backups per Year
Claims costs
Labor and equip. costs
$$
100%
Reactive
100%
Proactive
A Sample
A Sample
“
“
Bathtub Curve
Bathtub Curve
”
”
for the Sewer Maintenance Program
for the Sewer Maintenance Program
An Example: Tying Together Service Levels,
Lifecycle Costing, and the Triple Bottom Line
100+908070605040302010 5
Estimated Number of Sewer Backups per Year
Environmental/
social costs
Claims costs
Labor and equip. costs
$$
100%
Reactive
100%
Proactive
A Sample
A Sample
“
“
Bathtub Curve
Bathtub Curve
”
”
for the Sewer Maintenance Program
for the Sewer Maintenance Program
An Example: Tying Together Service Levels,
Lifecycle Costing, and the Triple Bottom Line
100+908070605040302010 5
Estimated Number of Sewer Backups per Year
Regulatory
non-compliance
costs
Environmental/
social costs
Claims costs
Labor and equip. costs
Chemical root
treatment costs
$$
100%
Reactive
100%
Proactive
A Sample
A Sample
“
“
Bathtub Curve
Bathtub Curve
”
”
for the Sewer Maintenance Program
for the Sewer Maintenance Program
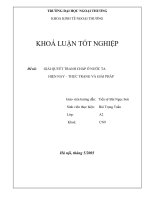
An Example: Tying Together Service Levels,
Lifecycle Costing, and the Triple Bottom Line
100+908070605040302010 5
Estimated Number of Sewer Backups per Year
Regulatory
non-compliance
costs
Environmental/
social costs
Claims costs
Labor and equip. costs
Chemical root
treatment costs
Grease abatement
costs
$$
100%
Reactive
100%
Proactive
A Sample
A Sample
“
“
Bathtub Curve
Bathtub Curve
”
”
for the Sewer Maintenance Program
for the Sewer Maintenance Program