public utilities management challenges for the 21st century phần 4 potx
Bạn đang xem bản rút gọn của tài liệu. Xem và tải ngay bản đầy đủ của tài liệu tại đây (656.64 KB, 11 trang )
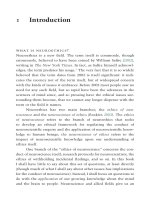
An Example: Tying Together Service Levels,
Lifecycle Costing, and the Triple Bottom Line
100+908070605040302010 5
Estimated Number of Sewer Backups per Year
Regulatory
non-compliance
costs
Environmental/
social costs
Claims costs
Labor and equip. costs
Chemical root
treatment costs
Proactive CCTV
costs
Grease abatement
costs
$$
100%
Reactive
100%
Proactive
A Sample
A Sample
“
“
Bathtub Curve
Bathtub Curve
”
”
for the Sewer Maintenance Program
for the Sewer Maintenance Program
An Example: Tying Together Service Levels,
Lifecycle Costing, and the Triple Bottom Line
100+908070605040302010 5
Estimated Number of Sewer Backups per Year
Regulatory
non-compliance
costs
Environmental/
social costs
Claims costs
Labor and equip. costs
Chemical root
treatment costs
Proactive CCTV
costs
Grease abatement
costs
Pipe rehab
costs
$$
100%
Reactive
100%
Proactive
SPU is
here
SPU wants
to be here
Exponentially rising costs: Total backup
elimination cannot be achieved
A Sample
A Sample
“
“
Bathtub Curve
Bathtub Curve
”
”
for the Sewer Maintenance Program
for the Sewer Maintenance Program
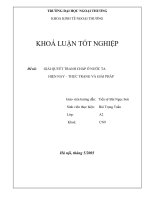
Data and Data Systems
Asset Data
l Age, material, location,
etc
l History (problem history,
maintenance history,
etc)
l Condition
l Consequence of failure
Data Systems
l Provide for analysis
l Mobile systems
l Asset costing
Pre - 1900
1900-1909
1910-1919
1920-1929
1930-1939
1940-1949
1950-1959
1960-1969
1970-1979
1980-1989
1990-1999
2000-Present
0
50
100
150
200
250
300
350
Miles of Pipe
Decade Installed
Total Length of SPU Sewer and Drainage Pipe (By Material
Type and Decade of Installation)
Brick
Vitrified Clay
Asbestos Cement
Concrete (Reinforced &
Non-Reinforced)
Benchmarking
l Determine how best to conduct
benchmarking
l Strive for best in class
l Strive for continuous improvement
l Commit to benchmarking over time
Benchmarking
Assess our performance relative to others
through benchmarking
Water Services Association of Australia
Civil Maintenance Benchmarking Results
Seattle
l Insert overall chart - functional level
Water Overall Comparison with International Benchmarking Participant
Group – Function Level
l Insert overall chart - Corporate Policy and
Business Planning
Water Overall Comparison with International Benchmarking Participant
Group – Process Level – Corporate Policy and Business Planning
l Insert overall chart - Asset Capability
Forward Planning
Water Overall Comparison with International Benchmarking Participant
Group – Process Level – Asset Capability Forward Planning
l Insert region chart – Function level
Water Comparison with North America Participant Group – Function Level
l Insert 2004 to 2008 chart – function level
Water 2004 to 2008 Comparison – Function Level
l Insert BD chart for participant and region
Business Driver Comparison to North America Group
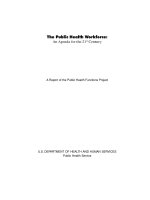
Financial Results of Applying the
Principles of Asset Management
SPU Results to date
Seattle Public Utilities' Forecast for a Typical Residential Bill:
2002 vs. 2004
$-
$20.00
$40.00
$60.00
$80.00
$100.00
$120.00
$140.00
Forecast Year
Total Monthly Bill and Bill by Service
Water
Solid
Waste
Sewer
Drainage
Water
$26.08 $23.83 $31.48 $25.62 $37.36 $33.07
Solid Waste
$21.97 $20.35 $23.43 $21.47 $25.60 $23.59
Sewer
$35.64 $30.68 $42.63 $37.89 $47.40 $45.72
Drainage
$9.97 $9.20 $13.91 $13.84 $16.21 $17.90
2004 - '02
Forecast
2004 - '04
Forecast
2007 - '02
Forecast
2007 - '04
Forecast
2010 - '02
Forecast
2010 - '04
Forecast
$93.66 $84.04 $111.45 $98.82 $126.57 $120.28
$9 to $10 less
$12 to $13 less
$6 to $7 less
SPU Water Fund Results to Date
Projected Water Capital Spending: 2002 Forecast vs. Today
$-
$10
$20
$30
$40
$50
$60
$70
$80
$90
$100
$110
$120
$130
Projected CIP Expenditures by Year
Millions $
September 2002 Forecast August 2005
September 2002 Forecast
$119.52 $88.72 $94.47 $110.99 $107.38 $93.85
August 2005
$93.60 $62.50 $72.10 $84.90 $107.30 $71.90
2003 2004 2005 2006 2007 2008
SPU Water Fund Results to Date
Projected Water O&M Spending: 2002 Forecast vs. Today
$-
$10
$20
$30
$40
$50
$60
$70
Projected Operations and Maintenance Expenditures by Year
Millions $
September 2002 Forecast August 2005
September 2002 Forecast
$53.27 $56.23 $59.17 $60.89 $62.52 $64.40
August 2005
$54.47 $55.80 $57.89 $58.70 $60.17 $61.67
2003 2004 2005 2006 2007 2008
Financial Results – Immediate Capital
Budget Reductions
Seattle Public Utilities CIP Spending
(2002-2007)
$-
$20.0
$40.0
$60.0
$80.0
$100.0
$120.0
$140.0
$160.0
$180.0
$200.0
2002 2003 2004 2005 2006 2007
Fiscal Year
Millions of Dollars
Total CIP
Water CIP
DR & WW CIP
37% Decrease in CIP
Spending (~$40M) in 1
Year
Financial Results – Immediate Capital
Budget Reductions
Seattle Public Utilities CIP Spending
(2002-2007)
$-
$20.0
$40.0
$60.0
$80.0
$100.0
$120.0
$140.0
$160.0
$180.0
$200.0
2002 2003 2004 2005 2006 2007
Fiscal Year
Millions of Dollars
Total CIP
Water CIP
DR & WW CIP
Financial Results - Continued
O&M Budget Reductions
Relative to the 2004 budget projection the 2004
actuals were reduced by 6% (about $16M) and the
2006 projection was reduced by 3% (about
$7M)…Results are complicated and ongoing though
Increasing Cash Contribution to Capital Investments
Fund
Fund
2003
2003
2004
2004
2005
2005
Water
Water
19%
19%
30%
30%
22%
22%
Drainage & WW
Drainage & WW
5%
5%
15%
15%
15%
15%
Solid Waste
Solid Waste
6%
6%
48%
48%
30%
30%
Revenue requirement:
“bookend” scenarios
Member rates
impact of
bookends
Questions