schaum s easy outline of principles of economics based on schaum s outline of theory and problems of principl phần 10 pot
Bạn đang xem bản rút gọn của tài liệu. Xem và tải ngay bản đầy đủ của tài liệu tại đây (297.71 KB, 23 trang )
130 PRINCIPLES OF ECONOMICS
3. Restricted entry is a characteristic of monopolistic competition.
4. In tacit collusion, oligopolists meet and decide on a price leader
to follow in their pricing policies.
5. In the long run oligopolists can earn profits.
Answers: 1. True; 2. False; 3. False; 4. False; 5. True
Solved Problems
Solved Problem 15.1
a. Why does a prospective monopolistic competitor find it relatively
easy to start production in the long run?
b. Why does the demand curve of a monopolistic competitor shift
down when more firms start production?
c. Why is it difficult or impossible to define the industry under mo-
nopolistic competition?
d. Why is there a cluster of prices rather than a single equilibrium
price in this kind of industry?
Solution:
a. A prospective monopolistic competitor usually finds it relatively
easy to start production because very little capital and no great technical
know-how are required to open a small gasoline station, grocery store,
barber shop, etc.
b. When more firms start producing a differentiated product, the de-
mand curve of previously existing monopolistic competitors shifts down
because each firm now has a smaller share of the market.
c. Technically speaking, we cannot define the monopolistically com-
petitive industry because each firm produces a somewhat different prod-
uct. We simply cannot add together aspirins, Bufferins, Excedrins, etc. to
get the market demand and supply curve because they are similar, but not
identical, products. Thus, our graphical analysis must be confined to the
“typical” or “representative” firm.
d. Slightly differentiated products also permit and cause slightly dif-
ferent prices. That is, even in long-run equilibrium, there will be a clus-
ter of equilibrium prices, one for each differentiated product, rather than
a single, industry-wide equilibrium price.
CHAPTER 15: Monopolistic Competition and Oligopoly 131
Solved Problem 15.2
a. What are some of the natural and artificial barriers to entry into
oligopolistic industries?
b. What are the possible harmful effects of oligopoly?
c. What are the possible beneficial effects of oligopoly?
Solution:
a. The natural barriers to entry into oligopolistic industries like the
automobile, aluminum, and steel industries are the smallness of the mar-
kets in relation to efficient operation and the huge amounts of capital and
specialized inputs required to start efficient operation. Some artificial bar-
riers to entry are control over raw materials, patents, and government
franchise. When entry is blocked or at least restricted, the firms in an oli-
gopolistic industry can earn long-run profits.
b. In the long run, oligopoly may lead to the following harmful ef-
fects: (1) P > MC and so there is an underallocation of the economy’s re-
sources to the firms in the oligopolistic industry; (2) the oligopolist usu-
ally does not produce at the lowest point on its LAC curve; and (3) when
oligopolists produce a differentiated product, too much may be spent on
advertising and model changes.
c. For technological reasons, many products (such as automobiles,
steel, etc.) cannot be produced under conditions of perfect competition
(because their cost of production would be prohibitively high). In addi-
tion, oligopolists spend a great deal of their profits on research and de-
velopment, and this may lead to faster technological advance and a high-
er standard of living than if the industry were organized along more
competitive lines. Finally, some advertising is useful since it informs cus-
tomers, and some product differentiation has the economic value of sat-
isfying the different tastes of different consumers.
Chapter 16
Demand for
Economic
Resources
In This Chapter:
✔ Resource Pricing
✔ Resource Demand
✔ Changes in Resource Demand
✔ True or False Questions
✔ Solved Problems
Resource Pricing
We now examine how the prices of productive resources such as wages,
rents, interest, and profits are determined in a mixed economy. Resource
prices are a major determinant of money incomes and of the allocation of
resources to various uses and firms.
Broadly speaking, the price of a resource is de-
termined by its market demand and supply. Firms
demand resources in order to produce commodities.
The demand for resources is a derived demand—de-
rived from the demand for the commodities that re-
quire the resources in production. The greater the
demand for the commodity and the more productive
the resource, the greater the price that firms are will-
ing to pay for the resource.
132
Copyright 2003 by The McGraw-Hill Companies, Inc. Click Here for Terms of Use.
For example, as a result of consumers’ demand for a final commod-
ity, say, shoes, firms hire labor and other resources in order to produce
shoes. The greater the demand for shoes, the greater the firms’ demands
for labor. In the absence of market imperfections (minimum wage laws,
union power, etc.), the wage rate of labor is determined exclusively by
the market demand and supply of labor.
To derive a firm’s demand for a resource, we must first define the
marginal revenue product (MRP). MRP measures the increase in the
firm’s total revenue from selling the extra product that results from em-
ploying one additional unit of the resource. If the firm is a perfect com-
petitor in the commodity market, it can sell this extra output at the given
market price for the commodity. However, as additional units of the vari-
able resource are used together with fixed resources, after a point the ex-
tra output or marginal physical product (MPP) declines because of the op-
eration of the law of diminishing returns. Because of the declining MPP,
MRP also declines.
Important!
Resources are priced just as goods and services
are—by the strength of the demand and supply for
them—but resource demand is a derived demand.
Resource Demand
In order to maximize total profits, a firm should hire additional units of a
resource as long as each adds more to the firm’s total revenue than to its
total costs. The increase in total revenue is the MRP. The
increase in total cost gives the marginal resource cost
(MRC). If the firm is a perfect competitor in the resource
market, it can hire any quantity of the variable resource at
the given resource price, so MRC equals the resource
price. Thus to maximize total profits, the firm should hire
the resource until MRP equals the resource price. The de-
clining MRP schedule then represents the firm’s demand schedule for the
resource.
CHAPTER 16: Demand for Economic Resources
133
If the firm is an imperfect competitor in the commodity market, the
MRP declines both because the MPP declines and because the firm must
lower the commodity price in order to sell more units. If the firm remains
a perfect competitor in the resource market, the firm again maximizes to-
tal profits when it hires the resource until MRP equals the resource price.
The declining MRP schedule then represents the firm’s demand schedule
for the variable resource.
Example 16.1
In Table 16.1, column 1 refers to units of a variable resource, say, labor,
employed in a given plant. Column 2 gives the total product produced.
Column 3 gives the marginal physical product or the change in total prod-
uct per unit change in the use of the resource. Commodity price (column
4) declines because of imperfect competition in the commodity market.
TR (column 5) is obtained by multiplying commodity price by total prod-
uct. Column 6 gives the MRP, measured as the change in total revenue.
MRP declines both because MPP declines and because the product price
declines. A firm that is a perfect competitor in the resource market would
maximize its total profits by employing the resource until the MRP equals
the resource price.
134 PRINCIPLES OF ECONOMICS
Table 16.1
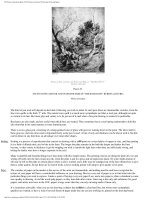
The declining MRP schedule of columns 6 and 1 in Table 16.1 is the firm’s
demand schedule for the resource and is graphed as dЈ in Figure 16-1. At
the resource price of $50, the firm will hire one unit of the resource. At
the resource price of $31, the firm will hire two units of the resource, and
so on.
Changes in Resource Demand
A firm’s demand for a productive resource will increase (i.e., shift up) if:
(1) the product demand increases; (2) the productivity of the resource ris-
es; (3) the prices of substitute resources rise; or (4) the prices of comple-
mentary resources fall.
Remember
A firm’s demand for a resource (say,
labor) depends in large part upon cir-
cumstances beyond the firm’s con-
trol.
For example, if the market demand for shoes rises and if the firm pro-
vides each worker with better but more expensive equipment, the firm’s
demand for labor will also rise. That is, to produce more shoes requires
more labor; better equipment makes labor more productive so the demand
for labor increases; an increase in the price of equipment encourages the
substitution of labor for capital in production.
If a firm uses more than one variable resource, say labor (L) and cap-
ital (K), the firm will maximize total profits when it uses labor and capi-
tal until the marginal revenue product of each resource equals the re-
CHAPTER 16: Demand for Economic Resources 135
Figure 16-1
source price (if the firm is a perfect competitor in the resource markets).
That is, the firm will maximize total profits when MRP
L
= P
L
or wage
rate, and MRP
K
= P
K
or the rate of interest. This can be rewritten as
MRP
L
/P
L
= MRP
K
/P
K
= 1 and can be generalized to any number of re-
sources. If the firm is an imperfect competitor in the resource markets,
the profit maximization condition is generalized to MPP
L
= MRC
L
and
MPP
K
= MRC
K
or MPP
L
/MRC
L
= MPP
K
/MRC
K
= 1 (where MRC refers
to the marginal resource cost).
True or False Questions
1. The price of a resource is determined by the demand for the re-
source.
2. If the firm is a perfect competitor in the product market, its MRP
curve is downward-sloping only because the marginal physical product
curve of the resource is downward sloping.
3. Marginal resource cost refers to the increase in the firm’s total
costs in hiring each additional unit of the resource.
4. To maximize profits, a firm should hire resources as long as each
additional unit of the resource adds more to the firm’s total costs than to
its total revenue.
5. A firm’s demand for a resource shifts up if the productivity of the
resource increases.
Answers: 1. False; 2. True; 3. True; 4. False; 5. True
Solved Problems
Solved Problem 16.1
a. Why do firms demand resources? In what way is a firm’s demand
for a resource a derived demand? How does this differ from consumers’
demand for final commodities?
b. What determines the strength of a firm’s demand for a productive
resource?
Solution:
a. Firms demand resources in order to produce final commodities. It
is the consumers’ demand for final commodities that ultimately gives rise
136 PRINCIPLES OF ECONOMICS
to the firm’s demand for productive resources. Because of this, the de-
mand for a resource is referred to as a derived demand. It is derived from
the demand for the final commodities that require the resource in pro-
duction. While consumers demand final commodities because of the di-
rect utility that they get from consuming commodities, producers demand
resources only because the resource can be used to produce the com-
modities that consumers demand.
b. The strength of a firm’s demand for a resource depends on: (1) the
strength of the demand for the commodity that the resource is used to pro-
duce; (2) the productivity of the resource in producing the final com-
modity; and (3) the prices of other related (i.e., substitute and comple-
mentary) resources. The higher the demand for the final commodity, the
more productive is the resource. The higher the price of substitute re-
sources and the lower the price of complementary resources, the greater
the firm’s demand for the resource.
Solved Problem 16.2 From Table 16.2,
a. Find the marginal physical product (MPP), total revenue, and the
marginal revenue product (MRP) schedules.
b. Why does the MPP decline? Why does MRP decline? How do we
know this firm is a perfect competitor in the product market?
CHAPTER 16: Demand for Economic Resources
137
Table 16.2
Solution:
a. Column 3 in Table 16.3 gives the MPP. It is obtained from the
change in total product per unit change in the use of the variable resource.
Column 5 gives the total revenue of the firm. It is obtained by multiply-
ing the product price (column 4) by the total product (column 2). Column
6 gives the marginal revenue product. It is obtained from the increase in
the total revenue in column 5.
b. The MPP that results from employing each additional unit of the
variable resource (together with fixed amounts of other resources) de-
clines because of the law of diminishing returns. The MRP declines be-
cause MPP declines. We know that this firm is a perfect competitor in the
product market because product price remains constant at $1 per unit re-
gardless of the quantity of the product sold by the firm.
Solved Problem 16.3 Explain how much of each variable resource a
firm should hire in order to maximize total profits, if the firm is an im-
perfect competitor in the resource markets.
Solution: When an imperfect competitor in the resource markets wants
to hire more of a resource, it will have to pay a higher price, not only on
the additional units of the resource but also on all previous units of the
resource hired. Thus, the increase in the total costs of hiring an addition-
al unit of the resource or marginal resource cost (MRC) exceeds the re-
source price. The firm will maximize total profits when it hires variable
resources as long as each resource MRP exceeds its MRC and until they
are equal. With variable resources labor (L) and capital (K), the firm max-
imizes total profits when MRP
L
= MRC
L
and MRP
K
= MRC
K
. Another
way of stating the profit-maximizing condition is to say that a firm should
hire resources until the MRP per dollar spent on each resource is the same.
Once again, this rule can be extended to any number of variable re-
sources.
138 PRINCIPLES OF ECONOMICS
Table 16.3
Chapter 17
Pricing of
Wages, Rent,
Interest,
and Profits
In This Chapter:
✔ Wage Determination
✔ Unions and Wage Differentials
✔ Rent
✔ Interest
✔ Profits
✔ Epilogue on Commodity and
Resource Pricing
✔ True or False Questions
✔ Solved Problems
Wage Determination
The wage rate refers to the earnings per hour of labor. The wage rate di-
vided by the price index gives the real wage rate or “purchasing power”
of wages. We are primarily concerned with real wages.
139
Copyright 2003 by The McGraw-Hill Companies, Inc. Click Here for Terms of Use.
The level of real wages depends on the produc-
tivity of labor. Real wages are higher the greater the
amount of capital available per worker, the more ad-
vanced the technology, and the greater the availabili-
ty of natural resources (fertile land, mineral deposits,
etc.).
In preceding chapters, we saw that firms demand
labor (and other resources) in order to produce the
products demanded by consumers. By adding each firm’s demand for la-
bor, we get the market demand for labor. The market supply of labor de-
pends on the population size, the proportion of the population in the la-
bor force, the state of the economy (such as boom or recession), and the
level of real wages.
The competitive equilibrium real-wage rate is determined at the in-
tersection of the market demand and supply of labor curves. The firm then
hires labor until the marginal revenue product of labor (MRP
L
) or its de-
mand for labor (d
L
) equals the wage rate.
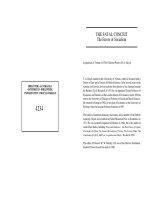
Example 17.1
In Panel B of Figure 17-1, the competitive equilibrium real-wage rate of
$6 per hour is determined at the intersection of the market demand and
supply of labor. The supply of labor to the competitive firm of Panel A
(s
L
) is horizontal at the wage rate of $6. This means that the firm is so
small (say, one of 1,000 identical firms in the market) that it can hire any
quantity of labor at the equilibrium market wage rate without affecting
that wage rate. To maximize total profits the firm hires 30 units of labor
because MRP
L
= W = $6 at 30 units of labor.
140 PRINCIPLES OF ECONOMICS
Figure 17-1
Note!
Wages are determined by the intersection of the
demand and supply of labor, not just by firms or just
by workers.
Workers may not be hired competitively. A dominant employer has
monopoly power in the local labor market and is referred to as a monop-
sonist. It faces the rising market supply curve of labor which indicates
that it must pay higher wages to hire more workers. Thus, the change in
the total cost of hiring an additional worker or marginal resource cost of
labor (MRC
L
) exceeds the wage rate. To maximize profits, the firm hires
labor until MRP
L
= MRC
L
and pays the wage indicated on the supply
curve of labor for that quantity of labor.
Unions and Wage Differentials
Labor unions attempt to increase wages in three ways. First, unions at-
tempt to increase the demand for labor by increasing productivity, by ad-
vertising union-made products, and by lobbying to
restrict imports. These are the most desirable but also
the least effective methods. Second, unions attempt
to raise wages by restricting the supply of labor
through the imposition of high initiation fees and
long apprenticeships and requirements that employ-
ers hire only union members. This is done primarily by craft unions (i.e.,
unions of such skilled workers as electricians). Third, unions attempt to
raise wage rates directly by bargaining with employers, under the threat
of a strike. This is the most common method and is used primarily by in-
dustrial unions (i.e., unions of all the workers of a particular industry,
such as automobile workers). Empirical studies seem to indicate that, in
general, unions in the U.S. have raised real wages for their members by
only about 10 to 15 percent.
CHAPTER 17: Pricing of Wages, Rent, Interest, and Profits
141
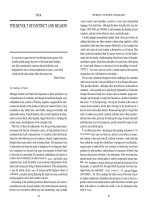
Example 17.2
In Panel A of Figure 17-2, the equilibrium real wage rate is $4 and em-
ployment is 3000 workers (at point E, where D
L
intersects S
L
).
If the union can increase D
L
to DЈ
L
, W = $6 and employment rises to
4000. Starting from the same original equilibrium point E in Panel B, a
craft union could instead attempt to reduce S
L
to SЈ
L
so that W = $6 but
only 2000 are employed. In Panel C, an industrial union could attempt to
negotiate W = $6 at which 2000 workers are employed and another 2000
workers (EЈA) are unable to find jobs.
If all jobs and individuals were exactly alike and all markets perfectly
competitive, there would be a single wage for all jobs and all workers.
However, jobs requiring equal qualifications may differ in attractiveness,
and higher wages must be paid to attract and retain workers in more un-
pleasant jobs. Such wage differentials are known as equalizing differ-
ences. Even if all jobs were equally attractive, wage differences would
persist because individuals such as doctors and clerks differ widely in ca-
142 PRINCIPLES OF ECONOMICS
Figure 17-2
pacities, skills, training, and education. Thus, labor falls into many non-
competing groups, each requiring different training and receiving differ-
ent wages. Finally, some wage differences are the result of imperfect mar-
kets. Market imperfections include lack of information, unwillingness to
move, union power, minimum-wage laws, and monopsony power. The
wide wage differences actually observed in the real world among differ-
ent categories of people and jobs are in general the result of a combina-
tion of these three factors.
Rent
Rent is the price for the use of land and other natural resources that are
fixed in total supply. If all land is alike and has one competitive use (say,
the growing of wheat), then rent is determined at the intersection of the
market demand curve and the vertical market supply curve of land. Re-
gardless of the market demand and the rent paid, the same amount of land
remains available.
You Need to Know
Pricing rent for land is different from pricing other
resources in that land is relatively fixed in supply.
Example 17.3
With the supply of land fixed (S) in Figure 17-3, rent is equal to r when
the market demand curve for land is D, and rЈ when it is DЈ. If from the
equilibrium rent of rЈ, the government imposed a tax of rЈr on rental in-
comes, land users would continue to pay rЈ but landowners would retain
only r. The quantity of land supplied, however, would remain unchanged.
In the real world, we have different types and uses of land with different
rental values. The supply of land can also be increased somewhat (say,
by drainage) or reduced (by improper use).
CHAPTER 17: Pricing of Wages, Rent, Interest, and Profits 143
Interest
Interest is the price paid for using money or loanable funds, expressed as
a percentage of the amount borrowed. If the rate of interest is 8 percent
per year, this means that for $100 borrowed today, $108 will have to be
repaid a year from today. For simplicity, we discuss the pure rate of in-
terest or the interest on a riskless loan (as on a U.S. government bond).
Other interest rates are higher depending on the risk, maturity, adminis-
trative cost, and competitiveness of the loanable-funds market.
The equilibrium interest rate is determined at the intersection of the
market demand and supply curves of loanable funds. The demand for
loanable funds comes from the borrowing of firms, consumers, and gov-
ernment, and is negatively sloped. To maximize profits, a firm will bor-
row in order to invest in machinery, inventory, etc., as long as the return,
or marginal productivity, of the investment exceeds the rate of interest on
borrowed funds. Thus, interest rates allocate the scarce loanable funds to
the most productive uses. The supply of loanable funds stems from the
past and current savings of individuals and firms. It is upward sloped and
is greatly affected by monetary policy.
Profits
Economic profits are the excess of total revenue over total costs, includ-
ing both explicit and implicit costs. Profits stem from the introduction of
a successful innovation, a reward for uninsurable risk-bearing or uncer-
tainty, and monopoly power. They serve as incentives for innovation, to
144 PRINCIPLES OF ECONOMICS
Figure 17-3
shift resources to the production of those commodities that society wants
most, and as a reward for efficiency.
Firms introduce new products and new production methods in the
expectation of profits. If successful, other firms may imitate the success-
ful innovator and compete these profits away. Similarly, more risky ven-
tures (such as petroleum exploration) require the expectation of a higher
profit to induce investments. Finally, monopoly power allows a firm to
restrict output artificially, keep competitors out, and charge a price that
allows profits to persist.
Remember
The search for profits is what brings
most new goods and services to the
market.
In 1990, the breakdown of U.S. national income was as follows:
wages and salaries, 74 percent; proprietors’ income, 7 percent, corporate
profits, 8 percent; interest, 10 percent; and rents, 1 percent. Since 1990,
wages and salaries have increased relatively and proprietors’ incomes
have fallen relatively. This is due to the increase in the importance of cor-
porations relative to individual-owned businesses.
Epilogue on Commodity
and Resource Pricing
In a free-enterprise economy, commodity and factor prices are deter-
mined by their respective demands and supplies. Firms demand resources
owned by households in order to produce the goods and services de-
manded by households. Households then use the income they receive to
purchase the goods and services produced by firms. This circular flow of
economic activity determines what, how, and for whom to produce. It is
a general equilibrium system because a change in any part of the econo-
my affects every other part of the economy. When markets are perfectly
competitive and are in long-run equilibrium, resources are allocated most
efficiently and the economy’s output of goods and services is maximized.
CHAPTER 17: Pricing of Wages, Rent, Interest, and Profits 145
In the real world, however, this most efficient resource allocation is dif-
ficult to achieve.
True or False Questions
1. The competitive equilibrium real-wage rate is determined at the
intersection of the market demand and supply curves of labor.
2. The wage differentials observed in the real world are generally due
to market imperfections.
3. The supply curve of land and natural resources is upward-sloping.
4. The factors affecting interest rates are risk, maturity, administra-
tive costs, and competitiveness of the loanable funds market.
5. In order for firms to invest in higher risk ventures the expected
profit must be higher.
Answers: 1. True; 2. False; 3. False; 4. True; 5. True
Solved Problems
Solved Problem 17.1
a. On what does the market supply of labor depend?
b. How does the state of the economy affect the market supply of la-
bor?
c. What is the effect of the real-wage rate level on the quantity of la-
bor supplied in the market?
Solution:
a. The market supply of labor depends on the population size, the
proportion of the population in the labor force, and the state of the econ-
omy. In general, the larger the population and the greater the participa-
tion rate of the population in the labor force, the greater the market sup-
ply of labor.
b. The state of the economy (boom or recession) affects the market
supply of labor. When the economy is booming, many people not previ-
ously employed may, attracted by the availability of high-paying jobs, de-
cide to enter the labor force. On the other hand, someone who felt the
need to look for a job under less prosperous conditions may leave the la-
bor force when a spouse or parent gets a high-paying job in a booming
146 PRINCIPLES OF ECONOMICS
economy. Thus, the supply of labor may increase, decrease, or remain un-
changed depending on the net effect of these two opposing forces. The
opposite is true in a recession.
c. The level of real wages also gives rise to two opposing forces af-
fecting the quantity of labor supplied. On the one hand, a high level of
real wages induces workers to substitute work for leisure and work more
hours per week to take advantage of the high real wages. On the other
hand, a high real wage (and income) results in workers demanding more
of every normal commodity, including leisure, and working fewer hours
per week. Once again, the quantity of labor supplied may increase, de-
crease, or remain unchanged, depending on the net effect of these two op-
posing forces.
Solved Problem 17.2 Getting an education and training is sometimes re-
ferred to as an “investment in human capital.”
a. In what ways is this similar to any other investment?
b. Why is treating education and training as investment in human
capital useful?
c. What are its shortcomings?
Solution:
a. Getting an education and training can be considered an investment
in human capital because, as with any other investment, it involves a cost
and entails a return. The cost of getting an education and training involves
such explicit expenses as tuition, books, etc. and such implicit cost as the
forgone wages while in school or the lower wages received while in train-
ing. The return on education and training takes the form of the higher
wages received over the individual’s working life. By discounting all
costs and extra income to the present and comparing returns to costs, we
can calculate the rate of return on the investment in human capital and
compare it to the returns from other investments.
b. Viewing education and training as investment in human capital
can explain real-world occurrences such as why we educate and train the
young more than the old, why young people migrate more readily than
old, etc. The answer is that young people have a longer working time over
which to receive the benefits of education, training, and migration.
c. Some shortcomings of this line of thinking are as follows: (1) Not
all expenses for education and training represent costs. Some should be
regarded as consumption since they do not contribute to subsequent high-
CHAPTER 17: Pricing of Wages, Rent, Interest, and Profits
147
er earnings (for example, when an engineering student takes a course in
poetry). (2) Higher subsequent earnings may be the result of innate abil-
ity and greater intelligence and effort rather than training.
Solved Problem 17.3
a. What are the functions of profits?
b. What are some objections to profits?
Solution:
a. Profits serve as incentives for innovators to shift resources to the
production of those commodities that society wants most, and as a reward
for efficiency. The introduction of an innovation involves uncertainty and
may result in financial loss if it is not successful. The expectation of a fi-
nancial reward in the form of profits is required to induce innovations.
Similarly, profit in some industries and losses in others is the indication
that society wants more commodities from the former and less from the
latter. Related to this is the fact that more efficient firms in a given in-
dustry are rewarded with profits which they can then use to expand, while
less efficient firms incur losses and have to contract operations or go out
of business.
b. Among the objections to profits are the following: (1) Profits aris-
ing from monopoly serve no socially useful purpose (except when they
lead to more innovations). Therefore, such profits should be taxed away
or the monopoly should be regulated (if it is not feasible to break it up).
(2) Profits may lead to an excessively unequal distribution of income.
This, too, can be corrected by progressive taxation. However, a general
attack on all profits is not justified, because profits, as we have seen be-
fore, do perform socially useful functions.
148 PRINCIPLES OF ECONOMICS
Index
AC (average costs), 106–107
AFC (average fixed costs), 106–
107
Aggregate demand, 26–28
Aggregate output, 28–29
Aggregate supply, 27–28, 51
AVC (average variable costs),
106–107
Average costs (AC), 106–107
Average fixed costs (AFC), 106–
107
Average variable costs (AVC),
106–107
Balance of payments, 91
Board of Governors (Federal Re-
serve), 68
Bretton Woods System, 93
Built-in stabilizers, 58–59
Business cycles, 29–30
Capital, 4
Capital accumulation, 82–83
CD (certificates of deposit), 66
Certificates of deposit (CD), 66
Ceteris paribus, 2
Circular flow of income and out-
put, 48–49
Collusion, 128
Competition, 111–114
Competitive equilibrium real-
wage rate, 140–141
Consumer demand, 96–100
Consumer price index (CPI), 31–
32
Consumer surplus, 99–100
Consumption, 37–40
Cost-push inflation, 33
Costs, 4, 5, 104–109
CPI (consumer price index), 31–
32
Credit financial instruments, 65
Crowding-out effect, 75–76
Cyclical unemployment, 30
Debit financial instruments, 65
Debt, 59–60
Deficits, 59–60
Demand, 13–16
aggregate, 26–28
resource, 133–136
Demand-pull inflation, 33
Depository institutions, 66
Discount rate, 69
Discretionary fiscal policy, 57–58
Disinflation, 32
Economic growth, 81–85
Economic resources, 132–136
Economics, 1–3
Elasticity, 19–21
Equilibrium, 17–18
long-run, 114
Equilibrium output, 47–51
149
Copyright 2003 by The McGraw-Hill Companies, Inc. Click Here for Terms of Use.
Equity financial instruments, 65
Eurodollars, 66
Exchange rates, 91–93
Expenditures:
government, 41–42, 56–57
Explicit costs, 104–105
Exports, 40–41
FDIC (Federal Deposit Insurance
Corporation), 66
Fed. See Federal Reserve System
Federal Deposit Insurance Corpo-
ration (FDIC), 66
Federal Open Market Committee
(FOMC), 68
Federal Reserve Bank, 68
Federal Reserve System, 64–71
Financial instruments, 65–66
Fiscal policy, 56–61, 74 –78
FMOC (Federal Open Market
Committee), 68
Full employment, 31
GDP (Gross Domestic Product):
deflator, 32
gap, 47
nominal, 25–26
potential, 26
real, 26
Goods, 4
Government:
debt, 59–60
deficit, 59–60
expenditures, 41–42, 56–57
price determination, 18
taxes, 41–42, 56–57
Gross Domestic Product. See
GDP
Gross exports, 40
Gross imports, 40
Guns and butter, 5–6
Illiquid financial instruments, 65
Implicit costs, 104–105
Import quotas, 90
Imports, 40
Import tariffs, 90
Income-expenditure model, 47–
49
Individual demand curve, 98–
100
Inflation, 31–33
Interest, 144
Interest rate effect, 27
International purchasing power
effect, 27
International trade, 88–93
Investment, 40
Keynes, John Maynard, 47
Keynesian model, 47–51
Labor, 4
LAC (long-run average costs),
107–109
Land, 4, 143
Law of diminishing marginal util-
ity, 96–97
Law of diminishing returns, 105,
107
Leakage-injection model, 49–50
Liquid financial instruments, 65
Long-run average costs (LAC),
107–109
Long-run costs, 107–109
Long-run equilibrium, 114
Loss, 114
150 PRINCIPLES OF ECONOMICS
M1, 66–71
M2, 66
M3, 66
Malthus, Thomas, 82
Marginal costs (MC), 106–107
Marginal propensity to consume,
39
Marginal revenue (MR), 112–113
Marginal utility, 96 –97
Market equilibrium, 18
Markets, 65–66
Market system, 7–8
MC (marginal costs), 106–107
Methodology of economics, 1–3
Models:
income-expenditure, 47–49
Keynesian, 47–51
leakage-injection, 49–50
Monetary policy, 64–71, 74–78
Monetary tools, 68–69
Money, 64–71
Monopolistic competition, 125–
127
Monopoly, 118–121
MR (marginal revenue), 112–
113
Multiplier, 50–51
Net exports, 40–41
Nominal GDP, 25–26
Oligopoly, 127–128
Open-market operations, 69–71
Opportunity cost, 4–5
Output
aggregate, 28–29
equilibrium, 47–51
with government expenditure
or taxes, 56–57
Paradox of thrift, 50
Peaks, 29
Perfect competition, 111–114
Population, 82–83
Potential GDP, 26
PPI (producer price index), 32
Price, 17–18
discrimination, 121
elasticity, 19–21
government determination,
18
level, 27
level changes, 76–78
resources, 132–133
wages, 139–143
Principle of increasing cost, 7
Producer price index (PPI), 32
Production costs, 104–109
Production-possibility frontier,
5–6
Productivity, 83
Profit, 113–114, 144 –145
Profit maximization, 112–113,
119–120, 126–127
Quantity, 17–18
Quotas, 90
Real GDP, 26
Real wage rate, 139–140
Regulation, 121
Rent, 143–144
Repurchase agreements (RP), 66
Reserve requirement, 67, 68–69
Revenue, 112–113
RP (repurchase agreements), 66
SAC (short-run average costs),
107–109
INDEX
151
Savings, 65
Scarcity, 3–5
market system, 7–8
Services, 4
Short run, 105
Short-run average costs (SAC),
107–109
Short-run costs, 105–107
Short-run loss, 114
Short-run profit, 114
Stabilizers, 58–59
Stagflation, 33
Supply, 16–17
aggregate, 27–28
elasticity, 20–21
Supply and demand, 27
Supply-side economics, 84–85
Tariffs, 90
Taxes, 41–42, 56–57
TC (total costs), 105–106
TFC (total fixed costs), 105–106
Total costs (TC), 105–106
Total fixed costs (TFC), 105–106
Total variable costs (TVC), 105–
106
Trade, 88–93
Trade deficits, 41, 91
Trade restrictions, 90–91
Troughs, 29–30
TVC (total variable costs), 105–
106
Unemployment, 30–31
Unions, 141–143
United States Steel, 128
USX, 128
Utility, 96–100
Utility maximization theory, 98–
99
Wage differentials, 141–143
Wage rate, 139–140
Wealth effect, 27
152 PRINCIPLES OF ECONOMICS