Rapid transcriptome responses of maize (Zea mays) to UV-B in irradiated and shielded tissues Paula Casati and Virginia Walbot pptx
Bạn đang xem bản rút gọn của tài liệu. Xem và tải ngay bản đầy đủ của tài liệu tại đây (499.5 KB, 19 trang )
Genome Biology 2004, 5:R16
comment reviews reports deposited research refereed research interactions information
Open Access
2004Casati and WalbotVolume 5, Issue 3, Article R16
Research
Rapid transcriptome responses of maize (Zea mays) to UV-B in
irradiated and shielded tissues
Paula Casati and Virginia Walbot
Address: Department of Biological Sciences, 385 Serra Mall, Stanford University, Stanford, CA 94305-5020, USA.
Correspondence: Paula Casati. E-mail:
© 2004 Casati and Walbot; licensee BioMed Central Ltd. This is an Open Access article: verbatim copying and redistribution of this article are permitted
in all media for any purpose, provided this notice is preserved along with the article's original URL.
Rapid transcriptome responses of maize (Zea mays) to UV-B in irradiated and shielded tissuesDepletion of stratospheric ozone has raised terrestrial levels of ultraviolet-B radiation (UV-B), an environmental change linked to an increased risk of skin cancer and with potentially deleterious consequences for plants. To better understand the processes of UV-B accli-mation that results in altered plant morphology and physiology, we investigated gene expression in different organs of maize at several UV-B fluence rates and exposure times.
Abstract
Background: Depletion of stratospheric ozone has raised terrestrial levels of ultraviolet-B
radiation (UV-B), an environmental change linked to an increased risk of skin cancer and with
potentially deleterious consequences for plants. To better understand the processes of UV-B
acclimation that result in altered plant morphology and physiology, we investigated gene
expression in different organs of maize at several UV-B fluence rates and exposure times.
Results: Microarray hybridization was used to assess UV-B responses in directly exposed maize
organs and organs shielded by a plastic that absorbs UV-B. After 8 hours of high UV-B, the
abundance of 347 transcripts was altered: 285 were increased significantly in at least one organ and
80 were downregulated. More transcript changes occurred in directly exposed than in shielded
organs, and the levels of more transcripts were changed in adult compared to seedling tissues. The
time course of transcript abundance changes indicated that the response kinetics to UV-B is very
rapid, as some transcript levels were altered within 1 hour of exposure.
Conclusions: Most of the UV-B regulated genes are organ-specific. Because shielded tissues,
including roots, immature ears, and leaves, displayed altered transcriptome profiles after exposure
of the plant to UV-B, some signal(s) must be transmitted from irradiated to shielded tissues. These
results indicate that there are integrated responses to UV-B radiation above normal levels. As the
same total UV-B irradiation dose applied at three intensities elicited different transcript profiles,
the transcriptome changes exhibit threshold effects rather than a reciprocal dose-effect response.
Transcriptome profiling highlights possible signaling pathways and molecules for future research.
Background
The evolution of terrestrial life was possible after the forma-
tion of a stratospheric ozone layer that absorbed most of the
ultraviolet-B (UV-B) radiation (280-315 nm) in sunlight [1].
Recent depletion of stratospheric ozone catalyzed by chlo-
rofluorocarbons and other pollutants has raised terrestrial
UV-B levels, an environmental change linked to increased
risk of skin cancer [2]. This also has potentially deleterious
consequences for plants, including decreases in crop yields
[3-5]. Because plants must be exposed to sunlight to power
photosynthesis, they are inevitably exposed to the damaging
UV-B. Adaptations include both protection, such as accumu-
lation of UV-absorbing pigments [6-8], and damage repair,
such as the use of UV-A photons to reverse some types of UV-
induced DNA lesions [9]. Because of its absorption spectrum,
DNA is a major and long-studied target of UV-B damage:
Published: 1 March 2004
Genome Biology 2004, 5:R16
Received: 27 October 2003
Revised: 15 December 2003
Accepted: 22 January 2004
The electronic version of this article is the complete one and can be
found online at />R16.2 Genome Biology 2004, Volume 5, Issue 3, Article R16 Casati and Walbot />Genome Biology 2004, 5:R16
even low doses of radiation can kill plant mutants that lack
specific DNA repair pathways [9,10]. UV-B can also directly
damage proteins and lipids [11], and we recently found that
UV-B radiation crosslinks RNA to particular ribosomal pro-
teins, with a concomitant decrease in translation (P.C. and
V.W., unpublished work).
In addition to damaging existing cellular constituents, UV-B
induces the rapid activation of c-fos and c-jun in mammalian
cells [12,13]. Induction is mediated through several cytoplas-
mic signal transduction pathways [14,15], including multiple
MAP kinase pathways. After UV-B irradiation, plants display
diverse morphological and physiological responses [3-5] that
are likely to involve multiple signal transduction cascades.
Changes in intracellular calcium, calmodulin, serine/threo-
nine kinases, and phosphatase activities have been implicated
in UV-B-mediated transcriptional activation of chalcone syn-
thase, the first gene in the flavonoid sunscreen biosynthetic
pathway [16,17]. In addition, UV-B has been proposed to act
through the octadecanoid pathway in tomato to stimulate the
expression of genes encoding antimicrobial defenses [18].
Recently, two highly homologous MAP kinases, LeMPK1 and
LeMPK2, were found to be activated in response to different
stresses, including UV-B radiation, in suspension cell cul-
tures of the wild tomato, Lycopersicon peruvianum, while an
additional MAP kinase, LeMPK3, was only activated by UV-B
radiation [19]. Therefore, some UV-B signal pathways are
shared with other environmental perturbations, while addi-
tional pathways may account for UV-B-specific responses.
Despite these observations, the mechanism(s) by which UV
triggers intracellular signaling pathways remains poorly
understood in both mammalian and plant cells. Candidate
triggering molecules include reactive oxygen species (ROS)
such as singlet oxygen, superoxide radicals, hydroxyl radicals,
and H
2
O
2
, all of which are increased in response to UV and
may be key regulators of UV-induced signaling pathways [20-
22]. One mechanism through which ROS can activate signal
transduction in animal cells is ligand-independent activation
of membrane receptors, which can result from oxidation of
receptor-directed protein tyrosine phosphatases [23].
In initial analyses using microarrays containing approxi-
mately 2,500 maize cDNAs, we documented the physiological
acclimation responses in adult maize leaves (Zea mays)
grown without UV-B or UV-A+B in sunlight for 20 days and
for 1 day after the UV solar spectrum was restored. In the
leaves shielded from UV, 304 transcripts were identified that
had altered abundance compared to control leaves exposed to
the full spectrum of sunlight during the depletion regime or
after 1 day of UV exposure [24]. A comparison among near-
isogenic lines with varying levels of flavonoid sunscreen indi-
cated that the b, pl anthocyanin-deficient line maize showed
a greater response than anthocyanin-containing lines [24].
This is as expected if this anthocyanin pigment is a sunscreen
that attenuates UV-B dosage [6]. Confirming previous studies
on individual genes, several stress-related pathways were
shown to be upregulated by UV-B whereas genes encoding
products required for photosynthesis were downregulated
[24]; the latter result has also been obtained through tran-
scriptome profiling in Nicotiana longiflora [25]. In addition,
dozens of candidate genes and pathways were identified that
had not been previously associated with acclimation to UV-B
[26].
With the goal of understanding the integrative processes
involved in UV-B acclimation that result in altered plant mor-
phology and physiology, we investigated gene expression at
several UV-B fluence rates and exposure times in multiple
organs of maize. Given its heightened sensitivity to UV-B and
its similarity to commercial maize varieties that have been
bred to lack anthocyanin, the b, pl anthocyanin-deficient line
was used. The B and Pl transcription factors strongly induce
expression of chalcone synthase, the first enzyme in the flavo-
noid biosynthetic pathway, and subsequent steps leading to
anthocyanin pigments [27]. After exposure to UV-B for as lit-
tle as an hour, transcript changes are detectable in the b, pl
genotype both in directly exposed leaves and in roots. These
results indicate that there are systemic, integrated responses
to supplemental UV-B. Transcriptome profiling also high-
lighted possible signaling pathways and molecules for future
research.
Results
Microarray experimental design and hybridization
reliability
To examine gene activity changes elicited by UV-B radiation
in different maize organs, microarray hybridization experi-
ments were used to determine steady-state mRNA levels
using Unigene I arrays from the Maize Gene Discovery
Project. The slides contained 5,664 maize cDNAs printed in
triplicate spots (for more information see [28]); 90% of the
elements showed hybridization above background with adult
leaf cDNA probes. We examined patterns of gene expression
in adult leaves, seedling leaves, emerging tassel, 14-day-old
roots, and immature ears after whole plants were subjected to
8 hours exposure under UV-B lamps with a biologically effec-
tive UV irradiance of 0.36 W/m
2
(9 kJ/m
2
/day) normalized to
300 nm [29]. Transcript levels were analyzed in duplicate
biological samples harvested immediately after the UV-B
treatment and in control plants treated identically except for
UV-B supplementation. UV-B-treated and control cDNA
samples were differentially labeled with Cy3 and Cy5 and
compared by microarray hybridizations in duplicate dye-
swapping experiments, which also provided a further repeti-
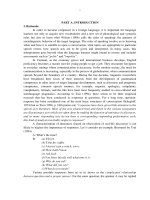
tion of each comparison. Reproducibility between hybridiza-
tions was excellent, with the correlation coefficients of the
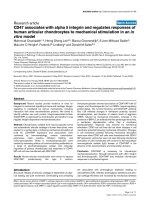
ratios greater than 0.95 in all cases (Figure 1). The mean
hybridization signal strength and the standard error of the
mean were calculated as an average of the signal intensity of
each triplicate spot within the same and duplicate hybridiza-
tions. Thus, for each expressed sequence tag (EST) queried,
Genome Biology 2004, Volume 5, Issue 3, Article R16 Casati and Walbot R16.3
comment reviews reports refereed researchdeposited research interactions information
Genome Biology 2004, 5:R16
we analyzed transcript levels in six independent spots. During
the analysis, only changes in mRNA abundance in excess of
twofold of controls in all replicate experiments were accepted
as significant.
UV-B supplementation effects on gene expression in
individual maize organs
Using these criteria, 347 ESTs were identified that showed
significant differential expression in response to UV-B treat-
ment in at least one organ after plants were irradiated for 8
hours; this corresponds to 6% of the total probe set (Figure 2).
Of these, 285 were upregulated by UV-B, while 80 were
scored as downregulated. It is important to note that the total
number of UV-B-regulated genes is lower than the sum of up-
and downregulated genes, because 18 ESTs that increased in
some organs were downregulated by UV-B in others.
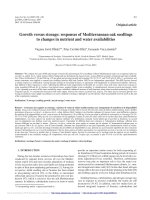
As summarized in Figure 2, the greatest overall response was
observed in adult tissues: emerging tassels (162 transcripts
up, 4 down) and mature leaves (121 up, 16 down). In contrast,
seedling leaves (62 up, 17 down) showed fewer significant
changes than adult leaves. Directly exposed organs had many
more transcripts with significant increases in expression rel-
ative to the non-UV-B irradiated control than transcripts with
lower expression. Shielded organs experienced little or no
direct UV-B, but nonetheless exhibited transcriptome altera-
tions. Roots in soil showed increases in 9 and decreases in 25
transcripts (Figure 2). Some transcripts downregulated in
roots were upregulated by UV-B in tissues directly exposed to
radiation (see Additional data file 1). Immature ears before
silk emergence are shielded by multiple layers of husk leaves;
nevertheless, 34 genes were downregulated by UV-B, while 8
were upregulated. Because roots and ears receive little or no
direct radiation, organs directly exposed to UV-B probably
produce signals that are transmitted to shielded organs,
where they elicit distinct transcriptome changes, primarily
decreases in transcript abundance.
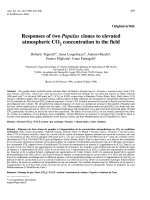
Figure 3 shows that there is little overlap between UV-B-reg-
ulated transcripts in the five sample types. In the directly irra-
diated organs, 26 ESTs were upregulated in both seedling and
adult leaves, and 36 showed increased levels in both emerging
tassels and adult leaves. Only six transcripts (an omega-6
fatty acid desaturase, GenBank accession number
AW065914; a cytochrome b5, AW144935; a glutamine syn-
thetase, AI947856; two ribosomal proteins, L11, AI948309
and P0, AW231530; and a putative protein, AI861109; see
Additional data file 1) showed upregulation in all three irradi-
ated tissues. Similarly, in the two shielded organs only eight
transcripts were downregulated in both ear and root.
Patterns of expression changes after UV-B
supplementation in different tissues
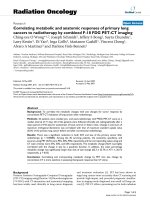
Genes were grouped according to similarity of expression pat-
terns by two algorithms: self-organizing maps (SOMs) (Fig-
ure 4a), and hierarchical clusters incorporating both patterns
and expression amplitudes (Figure 4b). We found that genes
assigned to key SOM clusters (Figure 4a) are also close in the
hierarchical clustergram (Figure 4b), indicating that the inde-
pendent methods yield consistent depictions. Several SOM
clusters were analyzed in detail. First, SOM c0 includes
transcripts that are downregulated by UV-B in adult leaves.
Microarray analysis of gene expression changes after UV-B exposureFigure 1
Microarray analysis of gene expression changes after UV-B exposure.
Scatter plot comparing ratios of signal values from two replicate
microarray hybridizations with Cy3-dUTP-labeled and Cy5-dUTP-labeled
mRNA from adult leaves of b, pl plants after 8 h exposure under UV-B
lamps and under no UV-B. Data from images of dye-swapping experiments
were plotted as the mean intensity after normalization of ESTs spotted in
triplicate.
2
3
−3
−2
1
Log
2
of the ratio of expression for replicate 1
Log
2
of the ratio of expression
for replicate 2
−2
−6
−4
2
6
4
Summary of the number of ESTs responsive to UV-B supplementation in different tissues of b, pl maize plantsFigure 2
Summary of the number of ESTs responsive to UV-B supplementation in
different tissues of b, pl maize plants.
8 h UV-B supplementation
347 UV-B responsive genes
80 downregulated by UV-B285 upregulated by UV-B
Tassel
Seedling leaf
Adult leaf
Root
Ear
162
62
121
9
8
16
4
17
34
25
R16.4 Genome Biology 2004, Volume 5, Issue 3, Article R16 Casati and Walbot />Genome Biology 2004, 5:R16
Transcripts for RuBisCO small subunit, a photosystem II 22
kDa polypeptide, and a photosystem I P700 apoprotein A2
are in this cluster (Figure 4a; see Additional data file 1 for
complete listings of genes responding to each SOM cluster).
Transcripts encoding proteins related to photosynthesis and
CO
2
fixation, such as RuBisCO, and proteins of both photo-
systems I and II were previously shown to decrease after UV-
B radiation in adult leaves [24]; downregulation of photosyn-
thetic proteins has also been documented in pea and wheat
[30,31] and in Nicotiana longiflora [25]. Surprisingly, these
transcripts were unaffected in seedling leaves, an illustration
of the greater sensitivity to UV-B radiation of adult compared
to seedling leaves.
SOM c4 includes eight ribosomal protein genes upregulated
by direct exposure to UV-B in adult tissues - both leaves and
tassels (Figure 4a; and see Additional data file 1). In previous
studies, we found that the functional group with the largest
number of genes upregulated by UV-B was that encoding pro-
teins involved in translation [24]. Because RNA strongly
absorbs UV photons, in vitro irradiation causes formation of
crosslinks in ribosomal RNA and between mRNA, tRNA,
rRNA and proteins [32]. We determined that UV-B radiation
crosslinks RNA and four specific ribosomal proteins in vivo;
concomitantly, overall translation is decreased by UV-B, sug-
gesting that ribosome damage in vivo occurs after UV-B expo-
sure (P.C. and V.W., unpublished work). As a consequence,
coordinated upregulation of ribosomal protein synthesis is
likely to be important for the restoration of this crucial cellu-
lar function by de novo ribosome synthesis. The novel discov-
ery here is that this upregulation occurs not only in adult
leaves but also in tassels; however, neither seedling leaves nor
Venn diagrams of comparisons between UV-B-responsive genes in different tissues of maizeFigure 3
Venn diagrams of comparisons between UV-B-responsive genes in different tissues of maize. Upregulated genes are colored red, downregulated genes are
colored green. Sets of genes were selected using the criteria described in Materials and methods. (a) Intersection of genes regulated by UV-B in UV-B-
exposed tissues (seedling and adult leaves and emerging tassels). (b) Intersection of genes regulated by UV-B in UV-B shielded tissues (roots and immature
ears) and seedling leaves.
30
6
120
65
6
20
30
7
55
8
2
0
0
0
Seedling leaf
Tassel
Adult leaf Seedling leaf
Ear
Root
4
13
0
0
12
15
4
0
0
15
2
8
0
26
(a) (b)
Analysis of microarray dataFigure 4 (see following page)
Analysis of microarray data. Self-organizing map (SOM) clusters of expression profiles (a) and cluster analysis of transcripts (b) from maize tissues
showing different UV-B responses. RNA from the same tissues not exposed to UV-B was used as the reference. (a) Each graph displays the mean pattern
of expression of the ESTs in the cluster in blue and the standard deviation of average expression (red and yellow lines). The number of ESTs in each cluster
is at the bottom left corner of each SOM. The y-axis represents log
2
of gene-expression levels. (b) Clustering was performed according to [43]. The color
saturation reflects the magnitude of the log
2
expression ratio (Cy5/Cy3) for each transcript. Red color means higher transcript levels than the reference,
whereas green means lower transcript levels than the reference. Gray corresponds to flagged ESTs that had signals similar to the background in some
conditions and hence were eliminated during the analysis. The color log
2
scale is provided at the bottom of the figure. Correspondence between nodes of
the cluster tree and SOM clusters are indicated on vertical bars on the left side of the tree.
Genome Biology 2004, Volume 5, Issue 3, Article R16 Casati and Walbot R16.5
comment reviews reports refereed researchdeposited research interactions information
Genome Biology 2004, 5:R16
Figure 4 (see legend on previous page)
−1.5
−1
−0.5
0
0.5
1
1.5
2
−1.5
−1
−0.5
0
0.5
1
1.5
2
−1.5
−1
−0.5
0
0.5
1
1.5
2
−1.5
−1
−0.5
0
0.5
1
1.5
2
−1.5
−1
−0.5
0
0.5
1
1.5
2
−1.5
−1
−0.5
0
0.5
1
1.5
2
−1.5
−1
−0.5
0
0.5
1
1.5
2
−1.5
−1
−0.5
0
0.5
1
1.5
2
−1.5
−1
−0.5
0
0.5
1
1.5
2
−1.5
−1
−0.5
0
0.5
1
1.5
2
2.5
Adult leaf
E
merging tass
el
Seedling leaf
Immature ear
14-day-old root
82 −2 −8
Som c4
Som c6
Som c8
Som c9
Som c7
Som c3
(b)
Adult leaf
Emerging tassel
Seedling leaf
Immature ear
14-day-old root
Adult leaf
Emerging tassel
Seedling leaf
Immature ear
14-day-old root
c0: 48
c3: 20
c2: 56
c1: 34
c5: 25
c6: 36
c4: 28
c9: 33c8: 32
c7: 35
(a)
l
og
2
rat
i
o
l
og
2
rat
i
o
l
og
2
rat
i
o
l
og
2
rat
i
o
l
og
2
rat
i
o
R16.6 Genome Biology 2004, Volume 5, Issue 3, Article R16 Casati and Walbot />Genome Biology 2004, 5:R16
shielded tissues exhibit upregulation of ribosomal protein
genes. Because seedling leaves lack both the downregulation
of photosynthetic genes and upregulation of ribosomal pro-
tein genes characteristic of adult leaves, it seems that they are
less affected by UV-B radiation.
SOM c6 includes 36 ESTs that are upregulated by UV-B in all
leaves (Figure 4; and see Additional data file 2), and the iden-
tified genes correspond to three key processes: quality control
of nucleic acids; protein turnover; and production of ROS.
One example in the first category is a transcript with high
homology to Arabidopsis RAD17. Genotoxic stress in yeast
and human cells activates checkpoints that delay cell-cycle
progression to allow DNA repair [33]. RAD proteins, includ-
ing RAD17, are key to the early response during the activation
of both DNA-damage repair and replication checkpoints. A
similar role for this protein could be required in maize leaves
after UV-B exposure. Other members of SOM c6 are impor-
tant in the quality control of RNA; transcripts with homology
to proteins involved in RNA maturation, such as Sm protein
F and XRN2, are upregulated by UV-B.
UV-B causes crosslinking and oxidative damage to proteins
[11], and a range of protein-turnover pathways are implicated
in the UV-B response in maize. mRNAs for two proteinases
are included in SOM c6 (a cysteine proteinase and a zinc-
dependent protease). We previously found significant
increases in the transcript levels of ubiquitin, ubiquitin-bind-
ing proteins, proteosome proteins and proteinases, together
with several chaperonins, after UV-B exposure in maize as a
function that is inversely correlated with flavonoid sunscreen
content [24]. Considering these transcriptome profiling
experiments together with the current results, an enhanced
capacity to recycle damaged proteins is implicated as an accli-
mation response to UV-B damage in maize.
An oxidative burst can be a direct consequence of exposure to
UV-B photons, and plants respond through a variety of anti-
oxidative strategies. SOM c6 contains three different tran-
scripts for cytochrome P450 proteins. In addition, both BZ1
glucosyl transferase and chalcone synthase targets are
included in this group. Even if b, pl plants are deficient in B
and Pl transcription factors, which regulate the expression of
these two genes, a low level of expression could result if these
genes are independently regulated by UV-B in leaves [27] or
if cross-reacting transcript types are induced.
SOM cluster 9 includes transcripts downregulated by UV-B in
shielded tissues, seedling roots, and immature ears. This clus-
ter contains 34 ESTs, 13 of which have no match to any
sequence in GenBank. It is interesting that members of this
cluster with putative functions are genes involved in signal
transduction (calmodulin and a calcium-dependent protein
kinase), and one transcription factor (homologous to GATA-
binding transactivating protein from Arabidopsis). Addition-
ally, transcripts for both alpha and beta tubulins are
downregulated. These results illustrate that UV-B irradiation
of adult leaves, under conditions in which photosynthesis is
hardly perturbed (<10% reduction; P.C. and V.W., unpub-
lished work), can profoundly affect distant organs.
Confirmation by RNA gel-blot analysis and real-time
RT-PCR
To determine whether the transcript changes identified by
microarray analysis are reliable, total RNA obtained from the
same irradiated and control plants used for microarray exper-
iments was examined by RNA gel-blot analysis (Figure 5).
Three genes representing different SOM clusters (RuBisCO
small subunit, SOM c0; ribosomal protein L11, SOM c4; and
cinnamyl alcohol dehydrogenase, SOM c5) were selected as
probes. The blot hybridization results correspond closely in
magnitude and in the sensitivity of response to UV-B to the
microarray results for these genes (Figure 5). For example,
transcripts for RuBisCO small subunit are lower after UV-B
exposure in adult leaves, but the levels of this transcript are
unchanged in seedling leaves.
In addition, we did real-time reverse transcription PCR (RT-
PCR) experiments to validate the microarray results for other
transcripts that show differences after the UV-B treatments.
This technique is both highly sensitive and accurate in quan-
tifying transcript abundance; precise gene identification was
achieved by sequencing the RT-PCR products. Table 1 shows
a list of transcripts that are up- or downregulated by the 8-
hour UV-B treatment in the microarray experiments, and a
comparison with results obtained by northern blot or real-
time RT-PCR. The values obtained from both methods corre-
spond closely in magnitude to the microarray results for these
genes, demonstrating that the microarray data are highly
reproducible.
Seedling leaves have higher levels of a UV-absorbing
compound than adult leaves
Because seedling leaves showed fewer transcript changes
after UV-B radiation, they may possess greater shielding
capacity than adult leaves. b, pl plants are deficient in
anthocyanin, but they could contain other UV-B-absorbing
molecules. Previously, we found that maize plants with differ-
ent levels of anthocyanins also contain a methanol-extracta-
ble UV-absorbing molecule with a maximum absorbance in
the UV-A region [24]. As described in Materials and methods,
extracts were prepared and UV-A-absorbing compounds sep-
arated by high-performance liquid chromatography (HPLC).
A main peak with a retention time of 17 min (data not shown)
is increased by UV-B radiation in a dose-dependent manner
(Figure 6a). The concentration of this molecule increases up
to 10-fold after 8 hours irradiation at the intensity of 0.36 W/
m
2
used for samples in the microarray analysis. Under identi-
cal HPLC conditions, samples from different leaf develop-
mental stages grown at a UV-B fluence of 0.09 W/m
2
were
also examined. As shown in Figure 6b, the concentration of
the 17-min retention time molecule is about 12-fold higher in
Genome Biology 2004, Volume 5, Issue 3, Article R16 Casati and Walbot R16.7
comment reviews reports refereed researchdeposited research interactions information
Genome Biology 2004, 5:R16
seedling (leaves 1 to 5) compared to adult leaves (leaves 10-
11), and the levels of this UV-absorbing molecule are interme-
diate in juvenile samples (leaves 6-9). The compound was
purified after HPLC separation and the absorption spectrum
is shown in Figure 6c. There are two major peaks of absorb-
ance: the first is at 260 nm and the second at 345 nm, with
substantial absorption in the UV-B range as well. This com-
pound can therefore act as a natural UV protectant. Given its
high concentration in seedling leaves, it is a likely contributor
to the observed higher tolerance of the initial leaves in a
young plant to UV-B radiation. Other mechanisms of protec-
tion in seedling leaves cannot be ruled out. For example,
cuticular waxes in maize are heavily deposited on juvenile tis-
sues and could also protect the plant against UV-B [34]; seed-
ling leaves might also have a different threshold for UV-B
induced transcriptome changes.
RNA gel-blot analysis to confirm microarray dataFigure 5
RNA gel-blot analysis to confirm microarray data. Lanes contained 10 µg of total RNA extracted from the different tissues after UV-B (+) and no UV-B (-
) treatments. Several identical gels were prepared and blotted. Each blot was hybridized with
32
P-labeled RuBisCO small subunit (a), ribosomal protein
L11 (b) or cinnamyl alcohol dehydrogenase (c) probes. (d) Ethidium-bromide-stained gel as a check for equal loading. The log
2
ratio was calculated as for
microarray experiments by quantification of hybridization signals and ethidium-bromide-stained bands using Kodak ds 1D Digital Science, as described in
Materials and Methods. The log
2
ratio is provided at the bottom of each blot, using as a reference RNA from plants that were grown under natural levels
of UV-B. ND means that the signal was too low for quantification.
− +−+−+−+−+
Seedling leaf
Emerging tassel
14-day-old root
Immature ear
Adult leaf
Ribosomal protein L11
Ribosomal RNA
RuBisCO small subunit
Cinnamyl alcohol
dehydrogenase
SOM c0
SOM c5
SOM c4
(a)
(c)
(b)
(d)
log
2
ratio−0.3 −1.3 N.D. N.D.N.D.
log
2
ratio1.3 1.5 0.3 1.70.4.
log
2
ratio1.5 2.5 N.D. −0.2N.D.
log
2
ratio0.1 0.3 −0.4 0.20.1
R16.8 Genome Biology 2004, Volume 5, Issue 3, Article R16 Casati and Walbot />Genome Biology 2004, 5:R16
Effects of UV-B supplementation on gene expression in
shielded leaves
To better understand the impact of UV-B in tissues not
directly exposed to radiation, we examined the responses in
shielded organs in more detail. For this purpose, two different
experiments were carried out. In the first protocol, one adult
leaf per plant was covered with a polyester plastic sheath that
absorbs UV-B (PE, see Materials and methods). Another leaf
on each plant was covered with a cellulose acetate plastic that
allows UV-B transmittance (CA) as a control for differences in
temperature and humidity inside the sheath. After an 8-hour
UV-B treatment, transcripts from leaves covered with the two
plastics were compared by microarray hybridization; the PE-
covered leaf should respond to UV radiation only if there is a
signal transmitted from exposed leaves. In the second
protocol, we compared transcripts from PE-covered leaves in
plants exposed to UV-B to those from PE-covered leaves in
unirradiated plants; only the PE-covered leaf on an irradiated
plant should exhibit transcript changes. The results from both
hybridization protocols were compared to the dataset for
adult leaves for analysis. Of the 121 transcripts upregulated by
UV-B in adult leaves (Figure 2), 48 were also upregulated in
PE-covered leaves in UV-B irradiated plants in both protocols
(see Additional data file 2). This strengthens the
interpretation of the results presented in Figure 2 in which
responses were detected in naturally shielded ears and roots.
Table 1
Confirmation of microarray data by northern blot and real-time RT-PCR assays
Description hit GenBank
accession
number
Method used Adult leaf Seedling
leaf
14-day-old
root
Immature
ear
Emerging
tassel
RuBisCO small subunit AI855224 Microarrays -1.22 0.20 0.33 0.68 0.61
Northern blot -1.30 0.30 ND ND ND
Ribosomal protein L11, cytosolic AI948309 Microarrays 1.09 1.05 0.28 0.54 1.45
Northern blot 1.50 1.30 0.40 0.30 1.70
Cinnamyl alcohol dehydrogenase AW927923 Microarrays 1.19 1.22 -0.63 F 0.40
Northern blot 2.50 1.50 ND ND -0.20
Histone deacetylase AW438666 Microarrays 1.07 -0.69 1.04 0.84 0.69
Real-time RT-PCR 1.49 -0.29 1.09 ND 0.86
Cysteine proteinase AW129800 Microarrays 1.08 0.19 0.09 F 0.51
Real-time RT-PCR 3.19 0.89 0.82 ND 0.75
Methyl-binding protein AW737448 Microarrays F 1.31 1.03 -0.30 -0.11
Real-time RT-PCR 0.79 1.11 1.07 ND 0.24
Cytosine 5' DNA methyltransferase AW215926 Microarrays 1.75 0.02 0.79 -0.32 0.56
Real-time RT-PCR 2.27 -0.88 -0.51 ND 0.46
Membrane protein Mlo5 BE025314 Microarrays F 1.04 1.20 -0.25 -0.10
Real-time RT-PCR 0.97 1.62 1.34 ND 0.42
snRNP Sm protein F AW330881 Microarrays 2.72 1.84 1.02 -1.06 0.39
Real-time RT-PCR 1.69 5.25 1.92 ND 0.71
AW433427 Microarrays 3.04 1.03 -1.29 -0.99 0.21
Real-time RT-PCR 2.12 1.21 -1.07 ND 0.79
The numbers correspond to the log
2
ratios. The transcripts that are upregulated by UV-B by more than two-fold are in bold type, while transcripts
downregulated by UV-B by more than two-fold are in italic. F, flagged ESTs which had signals similar to the background in some condition and were
eliminated during the analysis; ND, not determined.
Genome Biology 2004, Volume 5, Issue 3, Article R16 Casati and Walbot R16.9
comment reviews reports refereed researchdeposited research interactions information
Genome Biology 2004, 5:R16
We propose that a signal(s) must be transmitted from
exposed to shielded organs, permitting indirect UV-B induc-
tion of some genes in the absence of direct exposure to UV-B
and the consequent damage to DNA, RNA, and protein. It is
important to note that 73 transcript types are upregulated in
exposed leaves but not in PE-covered leaves; this subset
probably represents direct responses to radiation or its imme-
diate cellular consequences. Similarly, naturally shielded
organs exhibit fewer transcript changes than do exposed
organs (Figure 2).
Of the 48 ESTs differentially expressed in the shielded leaf, 21
have assigned putative functions that define several classes of
response. One group contains a cytochrome P450
monooxygenase and two dioxygenases; enzymes encoded by
such transcripts could be involved in detoxification of oxi-
dized products generated by interaction with ROS. ROS mov-
ing from exposed tissues or produced locally in shielded
tissues after detection of a signal(s) from irradiated leaves
may be involved in the propagation of UV-B stress signals to
shielded tissues. Two RAD proteins are also induced in
shielded leaves; one is RAD17, which, as described above, is
involved in activation of DNA replication checkpoints [33].
RAD6 is a ubiquitin-binding enzyme that also participates in
post-replication repair of DNA in yeast [35]. Even though
direct DNA damage does not occur in shielded organs, it
appears that the regulators of cell-cycle progression are mod-
ulated there as a response to an unknown signal from irradi-
ated tissues. A third gene type upregulated in shielded leaves
encodes a sphingosine-1-phosphate lyase (GenBank
AI855283). This enzyme is involved in degradation of sphin-
gosine 1-phosphate, a polar sphingolipid metabolite that has
been proposed to act both as an extracellular mediator and as
an intracellular second messenger [36]. Extracellular effects
are mediated via a recently identified family of plasma mem-
brane G-protein-coupled receptors in mammalian cells,
whereas specific intracellular sites of action remain to be
defined [36]. Sphingosine 1-phosphate is thus a candidate
molecule participating in UV-B signaling, as it is also
involved in signaling in plants [37]. Genes for protein degra-
dation are also upregulated in UV-B-shielded leaves. Finally,
several transcripts associated with stress responses are listed
in Additional data file 2, such as a salt stress-induced protein
and a thaumatin; these results indicate that shielded tissues
may experience physiological changes after UV-B damage has
occurred elsewhere in the plant.
Transcription in leaves is affected by fluence rate
independently of the total dose
To test if transcripts regulated by UV-B in adult leaves exhibit
reciprocity (duration × intensity = response) or a threshold-
type response, a total effective dose of UV-B corresponding to
2.25 kJ/m
2
/day normalized to 300 nm was administered to
different adult plants for 2 hours (high UV-B irradiance, 0.36
W/m
2
), for 4 hours (medium UV-B irradiance, 0.18 W/m
2
),
or for 8 hours (low UV-B irradiance, 0.09 W/m
2
). As a control
UV-absorbing pigment in maize leavesFigure 6
UV-absorbing pigment in maize leaves. (a) Increase in a UV-absorbing
pigment after UV-B exposure. The concentration of the compound was
determined by integration of the area of a peak with a retention time of 17
min (data not shown) after HPLC separation; this is expressed relative to
the concentration of pigment in plants not treated with UV-B radiation.
Error bars are standard errors. (b) UV-absorbing pigment in maize leaves
at different developmental stages. The concentration of the compound
was determined by integration of the area of a peak with a retention time
of 17 min after HPLC separation; this is expressed relative to the
concentration of pigment in adult plants at 0.09 W/m
2
UV-B. Error bars
are standard errors. (c) Absorption spectrum in acidic methanol of the
purified compound after HPLC separation. The spectrum is similar to that
obtained with a number of non-anthocyanin flavonoids; it could be a single
molecule or a mixture of molecules with similar properties in the HPLC
assay.
Relative concentration
(treatment/no UV-B)
Relative concentration
(leaf/adult leaf)
OD
250 450350 750650550
Seedling
leaf
Juvenile
leaf
Adult leaf
0 W/m
2
0.09 W/m
2
0.36 W/m
2
12
8
10
2
4
6
0
12
8
10
2
4
6
0
14
0.05
0.03
0.04
0
0.01
0.02
0.06
(a)
(b)
(c)
R16.10 Genome Biology 2004, Volume 5, Issue 3, Article R16 Casati and Walbot />Genome Biology 2004, 5:R16
for circadian effects on gene expression, samples were col-
lected from control (no UV-B) plants at the same times. Tran-
script levels were compared in microarray experiments that
examined each UV-B-treated sample compared to the con-
trol. Although many plant responses to radiation exhibit reci-
procity, this relationship did not hold for most transcripts
examined in our experimental conditions. As shown in Figure
7, 106 transcripts were induced after 2 hours of high UV-B,
while only six were upregulated after 4 hours of medium-flu-
ence UV-B, and only five after 8 hours at low UV-B irradiance.
Interestingly, only two ESTs were downregulated by UV-B in
the 2-hour, high-fluence UV-B treatment, and none in the
longer-exposure, lower-irradiance treatments. These results
indicate that there is a threshold of irradiance intensity for
the elicitation of most maize responses in adult leaves.
Using the highest irradiance (0.36 W/m
2
), two total dosages
(2 hours (2.25 kJ/m
2
/day) and 8 hours (9 kJ/m
2
/day)) were
compared in adult leaf samples. More transcripts showed a
greater than twofold difference to expression in control
samples after the longer duration and hence higher total dose
of UV-B (108 after 2 hours compared to 137 after 8 hours).
Transcripts could be classified as rapid, transitory responses
(78 transcripts altered at 2 hours but similar to the control at
8 hours), rapid but persistent responses (30 transcripts), and
delayed responses (107 transcripts similar to control at 2
hours but altered at 8 hours). After 2 hours of high irradiance,
the rapid but transitory responses include three genes with
putative functions assigned: a receptor protein kinase, Gen-
Bank AW433410; a potassium transporter, AI947597; and
ADP-glucose pyrophosphorylase large subunit, AW438209.
The last gene is also UV-B induced after 8 hours UV-B expo-
sure in seedling leaves and roots (see Additional data file 1).
During a 2-hour treatment, no transcript types were down-
regulated at the more than twofold change criterion. The
rapid, persistent responses include 27 ESTs that have no
match to any other in GenBank (data not shown). The three
ESTs with assigned functions are an F
1
-ATPase alpha subunit,
GenBank AW191100 and two genes of the anthocyanin bio-
synthetic pathway, bz1 and a chalcone synthase. The latter
two genes are also UV-B upregulated by the low- and
medium-intensity UV-B treatments (intersection of all treat-
ments, Figure 7) and in seedling leaves after 8 hours UV-B
exposure (see Additional data file 1), indicating that they have
a lower threshold of UV-B perception for induction. The
delayed UV-B responses transcript types include 92 upregu-
lated and 14 downregulated ESTs. Interestingly, transcripts
for photosynthetic enzymes (such as RuBisCO small subunit,
a PSII 22 kDa polypeptide and a PSI P700 apoprotein A2) are
only downregulated after 8 hours of high-irradiance UV-B
and not by lower dosages or by a 2-hour high-irradiance expo-
sure. The results from experiments manipulating dosage and
duration collectively indicate that there are thresholds for
nearly all gene responses for both treatment length and radi-
ation intensity.
Kinetics of UV-B effects on gene expression using RNA
gel blots and real-time RT-PCR
RNA blot hybridization and real-time RT-PCR were used to
analyze the kinetics of UV-B transcript changes in both
directly exposed (adult leaf) and shielded (root) tissues. For
experiments using adult leaves, two cDNAs that were upreg-
ulated within 8 hours in this organ were utilized as probes for
northern blots. In the first protocol to determine when tran-
scripts are induced, adult leaves were exposed under UV-B
lamps for 2, 4, 6 and 8 hours at 0.36 W/m
2
; samples were col-
lected immediately after the UV-B treatment from irradiated
and control plants. As shown in Figure 8, a 2-hour UV-B
exposure suffices to increase transcript levels of clathrin
(GenBank AW134461) and ribosomal protein L11
(AI948309), although the increase is lower than the twofold
cut-off in the microarray experiments (see Additional data file
1). Clathrin transcripts (Figure 8a) show a progressive
increase with longer exposures; in contrast, ribosomal pro-
tein L11 transcripts are approximately equivalent at 2 and 8
hours. In the second protocol to explore the persistence of
transcript upregulation in the absence of UV-B, leaves were
UV-B-irradiated for 2, 4 or 6 hours, followed by a period
Venn diagram comparisons between genes regulated by UV-B under different irradiation and/or total doses in adult leaves of maizeFigure 7
Venn diagram comparisons between genes regulated by UV-B under
different irradiation and/or total doses in adult leaves of maize.
Upregulated genes are colored red, downregulated genes green. Sets of
genes were selected using the criteria described in Materials and methods.
In blue: transcripts regulated by high levels of UV-B (0.36 W/m
2
) during 2
h; in orange: transcripts regulated by medium levels of UV-B (0.18 W/m
2
)
during 4 h; in pink: transcripts regulated by low levels of UV-B (0.09 W/
m
2
) during 8 h; in green: transcripts regulated by low levels of UV-B (0.36
W/m
2
) during 8 h.
78
0
0
0
25
2
1
0
0
0
0
0
0
0
3
0
0
0
1
0
0
0
1
0
0
0
0
0
1
0
25
2
92
14
2 h high UV-B
8 h high UV-B8 h low UV-B
4 h medium UV-B
Genome Biology 2004, Volume 5, Issue 3, Article R16 Casati and Walbot R16.11
comment reviews reports refereed researchdeposited research interactions information
Genome Biology 2004, 5:R16
without UV-B to complete an 8-hour treatment; samples
were also collected from plants irradiated for 8 hours fol-
lowed by a 12-, 24- or 48-hour recovery period. As shown in
Figure 9, clathrin and ribosomal protein L11 transcripts are
induced with exposures from 2 to 8 hours, as expected from
the initial experiment. For clathrin, a short exposure of UV-B
is enough to upregulate this gene, but a longer time is
required to reach higher levels of expression. Both transcripts
persist in recovery periods of 2 hours (after a 6-hour expo-
sure), 6 hours (after a 2-hour exposure), and 12 hours (after
an 8-hour exposure). After 12 hours without UV-B, tran-
scripts are lower than at the end of the UV-B treatment, and
after 24 hours transcript levels are similar to the non-irradi-
ated control plants. The same RNA samples used in the exper-
iments above were used to compare UV-B-regulated
expression of other genes by real-time RT-PCR. Table 2
shows that, as observed for clathrin transcripts, UV-B induc-
tion of a cysteine proteinase (GenBank AW129800) shows a
progressive increase with longer exposures, while transcripts
for a histone deacetylase (AW438666) and for a cytosine 5'
DNA methyltransferase (AW215926) are approximately
equivalent at 2 and 8 hours.
Blot analysis using RNA from roots of 14-day-old seedlings
was also performed after 2, 4, 6, or 8 hours of plant irradia-
tion; as shown in Figure 10, probes were cDNAs from tran-
scripts detected to be upregulated in roots in UV-B plants (a
membrane protein Mlo5, GenBank accession number
BE025314; a receptor kinase-like protein, GenBank accession
number BE128804; and a transmembrane protein, GenBank
accession number AW313343). Samples from non UV-B-irra-
diated plants were collected at the same periods of time as
RNA gel-blot analysis to study the kinetics of UV-B induction of gene expression in adult leaves under experimental protocol 1Figure 8
RNA gel-blot analysis to study the kinetics of UV-B induction of gene
expression in adult leaves under experimental protocol 1. Lanes contained
10 µg of total RNA extracted from adult leaves after 2, 4, 6 and 8 h of UV-
B (+) and no UV-B (-) treatments. Several identical gels were prepared and
blotted. Each blot was hybridized with
32
P-labeled clathrin (a) or
ribosomal protein L11 (b) probes. (c) Ethidium-bromide-stained gel as a
check for equal loading. Bars in gray indicate light treatment without UV-B;
bars in white indicate light treatment with UV-B supplementation for the
time indicated in the figure.
Ribosomal RNA
Clathrin
Ribosomal protein L11
(a)
(b)
(c)
− UV-B + UV-B
2 h
2 h
8 h
6 h
4 h
8 h
6 h
4 h
RNA gel-blot analysis to study the kinetics of UV-B induction of gene expression in adult leaves under experimental protocol 2Figure 9
RNA gel-blot analysis to study the kinetics of UV-B induction of gene
expression in adult leaves under experimental protocol 2. Lanes contained
10 µg total RNA extracted from adult leaves after 2, 4, 6 or 8 h of UV-B
(+) followed by a no UV-B period to complete 8 h, and after 8 h of UV-B
followed to a period of 12, 24 or 48 h of no UV-B (+), and from no UV-B
(-) treatments. Several identical gels were prepared and blotted. Each blot
was hybridized with
32
P-labeled clathrin (a) or ribosomal protein L11 (b)
probes. (c) Ethidium-bromide-stained gel as a check for equal loading.
Bars in gray indicate light treatment without UV-B; bars in white indicate
light treatment with UV-B supplementation; and bars in black indicate dark
treatment for the time indicated in the figure.
8 h (−) UV-B
2 h UV-B + 6 h (−) UV-B
8 h UV-B + 12 h (−) UV-B
8 h UV-B
6 h UV-B + 2 h (−) UV-B
4 h UV-B + 4 h (−) UV-B
8 h (−) UV-B + 12 h (-) UV-B
8 h UV-B + 48 h (−) UV-B
8 h UV-B + 24 h (−) UV-B
Ribosomal RNA
Clathrin
Ribosomal protein L11
(a)
(c)
(b)
R16.12 Genome Biology 2004, Volume 5, Issue 3, Article R16 Casati and Walbot />Genome Biology 2004, 5:R16
controls. UV-B regulation of all three genes is very rapid,
because high transcript levels are apparent after 2 hours
(Figure 9). Transcript levels of all three genes are further
increased with longer times of UV-B exposure of the leaves.
For finer resolution of the time required for gene induction,
real-time RT-PCR assays were established for four additional
genes. By microarray hybridization a histone deacetylase was
strongly induced by an 8-hour UV-B treatment in both roots
and adult leaves, methyl-binding protein was induced more
than twofold in roots but unchanged in leaves, RAD5 was
unchanged in roots, and cytosine 5' DNA methyl transferase
was upregulated in leaves but not roots (see Additional data
file 1). For the four genes tested, none was significantly upreg-
ulated by 30 min of UV-B exposure; however, histone
deacetylase transcript abundance was downregulated four- to
eightfold in 30 min (Figure 11). Within 60 min, histone
deacetylase levels had increased fourfold above those in the
non-irradiated control roots and by 90 min irradiated leaves
also had a fourfold increase in this transcript type. The
unusual behavior of histone deacetylase has been verified in
three repetitions of the real-time PCR assays using independ-
ent biological samples. By 60 min, methyl transferase in
leaves and methyl-binding protein transcripts in roots were
also induced (Figure 11). RAD5 remained constant in roots
and methyl-binding protein transcripts remained constant in
leaves over the 90 min exposure period, confirming the
microarray hybridization results in which these transcripts
remain unchanged in plants exposed to UV-B for 2 to 8 hours.
The time-course experiments with nine genes collectively
indicate that UV-B can modulate transcript abundance very
quickly, even in roots where the signal(s) mediating UV-B
effects must be produced and translocated from directly
exposed tissues.
Discussion
Of 5,664 maize transcript types examined from the anthocy-
anin-deficient b, pl line by microarray hybridization, 347 are
regulated by an 8-hour UV-B-exposure in at least one of five
organs. Interestingly, most of the UV-B-regulated genes are
organ-specific. A previous report established that individual
maize organs express discrete suites of genes [38], and we
find that responses to UV-B also reflect cellular differentia-
tion. One hundred and eight transcript types are induced in
adult leaves within a 2-hour exposure period, and a subset of
the altered transcript levels persists during an 8-hour expo-
sure; genes with a delayed response were also identified. By
monitoring nine selected transcripts using RNA blot or real-
time RT-PCR we confirmed that the activation of gene expres-
sion by UV-B radiation can be very rapid, both in directly
exposed and shielded tissues - some transcripts show high
levels of induction after only 1 or 2 hours of UV-B exposure.
For these genes, transcript levels remain high for some time
after UV-B illumination is finished, but return to basal levels
one day later.
Shielded leaves as well as roots and immature ears receive a
signal(s) from irradiated tissues that triggers numerous tran-
scriptome changes. In roots and ears the major response is
downregulation of transcript abundances. Similarly shielded
leaves on an irradiated plant exhibit many transcriptome
changes. These new findings that shielded leaves and organs
respond rapidly indicates that UV-B induces an extensive,
large-scale integrated response as summarized in Figure 12.
The magnitude and diversity of responses is similar to what
has been documented as systemic responses after pathogen
attacks in a restricted location [39]. Future studies will be
directed to define the mechanisms activating UV-B-respon-
sive genes not only in directly exposed but also in shielded
Table 2
Comparison of the kinetics of UV-B induction of gene expression in adult leaves by real-time RT-PCR
Description hit GenBank
accession
number
Treatment 2 h UV-B 4 h UV-B 6 h UV-B 8 h UV-B
Histone deacetylase AW438666 (1) 1.09 ± 0.03 1.17 ± 0.03 1.24 ± 0.04 1.49 ± 0.05
(2) 1.29 ± 0.07 1.49 ± 0.02 1.09 ± 0.02 1.49 ± 0.05
Cysteine proteinase AW129800 (1) 1.09 ± 0.05 1.26 ± 0.07 2.09 ± 0.03 3.19 ± 0.09
(2) 3.10 ± 0.08 2.89 ± 0.08 3.32 ± 0.05 3.19 ± 0.09
Cytosine 5' DNA methyltransferase AW215926 (1) 1.75 ± 0.07 2.43 ± 0.03 1.89 ± 0.04 2.27 ± 0.12
(2) 2.27 ± 0.11 1.87 ± 0.09 2.12 ± 0.07 2.27 ± 0.12
The numbers correspond to the log
2
ratios. Experiments were done at least in triplicate. Adult leaves were exposed under UV-B lamps for 2, 4, 6
and 8 h at 0.36 W/m
2
, and samples were either collected immediately after the UV-B treatment (1) or after a period without UV-B to complete an
8-h treatment (2).
Genome Biology 2004, Volume 5, Issue 3, Article R16 Casati and Walbot R16.13
comment reviews reports refereed researchdeposited research interactions information
Genome Biology 2004, 5:R16
tissues and to identify the signals that activate distinctive
gene expression in individual organs.
Among 347 transcripts found to be regulated by an 8-hour
UV-B treatment, 285 showed upregulation in at least one
organ while only 80 were downregulated by UV-B (Figure 2).
For 18 genes, transcripts were upregulated by UV-B in some
tissues but decreased in others, particularly in roots. The rea-
son for this observation remains to be investigated after iden-
tification of gene function. Further experiments will be
required to determine if this regulation occurs through gene
expression control via different cis-acting promoter (to alter
transcription) or RNA structural elements (to alter RNA half-
life) or through convergence of distinct signal transduction
pathways to act on the same element to produce up- or down-
regulation. A limitation of currently available maize
microarrays is that cDNAs are the spotted elements; there-
fore, determination of which members of cross-hybridizing
gene families respond to UV-B treatment awaits gene-specific
methods such as oligonucleotide arrays. In the short term,
verification experiments with gene-specific real-time RT-
PCR primers can selectively verify microarray results. As
documented for nine examples of transcripts with different
expression patterns, the verification experiments confirmed
the conclusions drawn from the microarray hybridization
results.
The plant's perception of UV-B that results in transcript
abundance changes does not exhibit reciprocity: there is a
dosage threshold for most genes. Adult tissues (leaves and
tassel) that are directly exposed to supplementary UV-B
exhibit more changes in gene expression than do seedlings or
shielded organs such as roots and immature ears. Photosyn-
thesis-associated genes are also unaffected in seedling leaves.
We found that seedling leaves have higher levels of a UV-
absorbing compound than adult leaves and that this com-
pound is also induced by UV-B radiation. Thus seedling
leaves are better shielded than adult leaves against UV-B.
Seedling leaves may also be protected against UV-B by a waxy
coating that can attenuate its impact [34] or may require
either a higher intensity or duration threshold to trigger a
response. Extending previous observations by including more
genes involved in specific responses, we confirmed that
downregulation of photosynthetic genes and induction of ribo-
somal protein genes occur after UV-B exposure in irradiated
RNA gel-blot analysis to study the kinetics of UV-B induction of gene expression in 14-day-old rootsFigure 10
RNA gel-blot analysis to study the kinetics of UV-B induction of gene
expression in 14-day-old roots. Lanes contained 10 µg total RNA
extracted from roots after 2, 4, 6 or 8 h of UV-B (+) and no UV-B (-)
treatments. Several identical gels were prepared and blotted. Each blot
was hybridized with
32
P-labeled membrane protein Mlo5 (a), receptor
kinase (b) or transmembrane protein (c) probes. (d) Ethidium-bromide-
stained gel as a check for equal loading. Bars in gray indicate light
treatment without UV-B; bars in white indicate light treatment with UV-B
supplementation for the time indicated in the figure.
Receptor kinase
Ribosomal RNA
Membrane protein M105
Transmembrane protein
(a)
(c)
(b)
(d)
− UV-B + UV-B
2 h
2 h
8 h
6 h
4 h
8 h
6 h
4 h
Real-time RT-PCR analysis to study the kinetics of UV-B induction of gene expression in adult leaves and 14-day-old rootsFigure 11
Real-time RT-PCR analysis to study the kinetics of UV-B induction of gene
expression in adult leaves and 14-day-old roots. cDNA (50 ng) obtained by
reverse transcription of RNA from (a) adult leaves and (b) roots after 30
min, 60 min and 90 min of UV-B and no UV-B treatments was used for
real-time PCR. Experiments were done at least in triplicate. Error bars are
standard errors.
Histone
deacetylase
Histone
deacetylase
Cytosine 5′ DNA
methyltransferase
Methyl-binding
protein
Methyl-binding
protein
Transcript levels ratio
(UV-B/no UV-B)
Transcript levels ratio
(UV-B/no UV-B)
RAD5
4.5
4
3.5
3
2.5
2
1.5
1
0.5
0
4.5
4
3.5
3
2.5
2
1.5
1
0.5
0
30 min
60 min
90 min
30 min
60 min
90 min
(a)
(b)
R16.14 Genome Biology 2004, Volume 5, Issue 3, Article R16 Casati and Walbot />Genome Biology 2004, 5:R16
Classification of UV-B-regulated genes identified by microarrays on the basis of their putative functionFigure 12
Classification of UV-B-regulated genes identified by microarrays on the basis of their putative function. Transcripts with ratios at least twofold enhanced or
decreased after the various UV-B treatments were included in the diagram.
Photosynthesis (7)
RubisCO small subunit
PSI P700 apoprotein A2
Photosystem II 22 kDa protein
Photosystem I subunit PSI-E
Pyruvate phosphate dikinase
Translation and RNA processing (18)
Ribosomal proteins
Translation factors
Ribonucleases
XRN2 (RNA maturation and processing)
Sm protein F (splicing)
DNA damage/DNA-binding proteins (7)
6-4 photolyase
RAD17
RAD6
Cytoskeleton (11)
Actin 4
Alpha-tubulin
Beta-tubulin 1
Lipid metabolism (5)
Desaturases
Lipase
Cell wall and sugar metabolism (10)
Beta 1,2 N-acetylglucosaminyltransferase
Beta-1,3-glucanase
Beta-expansin
Chitinase
Pectate lyase
Cinnamyl-alcohol dehydrogenase
Polygalacturonase
Chalcone flavonone isomerase
UDP-glucose dehydrogenase
Soluble acid invertase
ADP-glucose pyrophosphorylase
Signal transduction (10)
Calmodulins
Receptors
Protein kinases
Protein phosphatase
Receptor kinase-like protein
Sphingosine-1-P lyase
Proteinases (4)
Bromelain
Zinc dependent protease
Cathepsin B-like cystein proteinase
ATP-dependent CLPB protein
Hormones (2)
Sterol delta-7 reductase
General metabolism (11)
Fructose 1,6-bisphosphate aldolase
Pyruvate dehydrogenase
Methionine synthase
Glutamine synthase
Phosphoribosyl pyrophosphate synthase
Detoxifying/stress/defense (16)
Alcohol dehydrogenase-like protein
Ferrochelatase
Glutathione S-transferases
Cytochrome P450
Peroxidases
NADPH-cytochrome P450 reductase
Methionine sulfoxide reductase
NADPH HC toxin reductase
Salt-induced protein
Sulfur-rich/thionin-like protein
Metallothionein
Membrane proteins (8)
MRP 47
Aquaporin
Dynamin-like protein
Mlo5
Chaperons/protein degradation (8)
GrpE protein
Ubiquitin-conjugating enzyme
Ubiquitin 2
Others and unknowns (225)
Transcription factors (5)
Leucine-rich repeat protein
GATA-binding proteins
CASP protein-like
Squamosa protein binding protein
UV-B
Genome Biology 2004, Volume 5, Issue 3, Article R16 Casati and Walbot R16.15
comment reviews reports refereed researchdeposited research interactions information
Genome Biology 2004, 5:R16
adult leaves and now report that these changes do not
occur in leaves sheathed in UV-B-absorbing plastic. The
genes that respond after direct UV-B radiation include many
examples of those involved in damage control. On a longer
time scale, plant morphology depends on the patterns of cell
proliferation and the direction and extent of subsequent cell
expansion. UV-B modulates plant morphology, and the data
reported here, in which regulators of the cell cycle are altered
in shielded organs, could explain these observations. Both the
immature ear and the root system contain zones of cells that
are proliferating rapidly.
Specificity of the UV-B response
Although UV-B can trigger production of ROS, and these mol-
ecules can in turn stimulate signal transduction cascades, the
specificity of maize responses to UV-B compared to other
environmental perturbations [24] that elicit ROS requires
that some aspect of the mechanism be restricted to UV-B per-
ception. The best-documented specific outcome is UV-B
damage to DNA. Our results, particularly documenting the
profound changes in gene expression in shielded organs, indi-
cate that UV-B elicits a range of responses in addition to the
well-documented DNA damage and subsequent repair. It is
possible that UV-B photons directly affect a key regulatory
protein in irradiated cells. From our data, an enhanced capac-
ity to repair and recycle damaged proteins can be implicated
as an acclimation response to UV-B in most maize tissues. It
is also possible that the combination of UV-B-induced dam-
age to DNA, RNA, proteins and lipids, plus ROS, channels
plant responses into a specific mode.
Long distance signal
We propose that signals from UV-B-irradiated tissues move
rapidly to shielded organs, where they trigger physiological
changes in the recipient cells. Consequences of signal
perception include downregulation of diverse transcript
types. Post-translational regulation may be an important
response after UV-B in these tissues, as we found significant
changes in the transcript levels of ubiquitin, ubiquitin-bind-
ing proteins and proteinases in shielded tissues. A key ques-
tion concerns the nature of the signals within irradiated
organs that trigger transcript abundance changes and the sig-
nal(s) produced in irradiated cells that elicit rapid transcrip-
tome changes in distant shielded organs. At the dosages used,
UV-B has little impact on photosynthesis in maize (<10%
decrease compared with controls after 8 h exposure; P.C. and
V.W., unpublished work). The types of transcripts changed by
UV-B in shielded tissues (see Additional data files 1 and 2)
include some genes involved in signal transduction and tran-
scripts for membrane receptors. Transcripts for a sphingo-
sine-1-phosphate lyase are upregulated in shielded leaves; the
sphingolipid could act either as an extracellular mediator or
as an intracellular second messenger in UV-B responses [37].
Integrative role for hydrogen peroxide
Previous studies have shown that UV-B exposure increases
ROS species generating oxidative stress in irradiated organs
[40,41]. It was proposed that in response to UV-B radiation
ROS function as destructive radicals and may also be compo-
nents of signal cascades that change plant gene expression
[19]. ROS are putative candidates for signal molecules that
could be involved in UV-B responses, particularly as we found
that transcripts for enzymes involved in oxidative stress and
detoxification were upregulated in shielded leaves covered
with UV-B absorbing plastic (such as cytochrome P450 and
metallothionein; see Additional data file 2) only when the rest
of the plant was irradiated with UV-B. The role of reactive
oxygen species, especially H
2
O
2
, in integrating plant
responses to biotic and abiotic stresses has been the focus of
much attention. Hydrogen peroxide has been postulated to
play multiple roles in plant defense against pathogens; among
these are triggering programmed local cell death during the
hypersensitive response, inducing defense genes near the site
of infection, and acting as a signal in the induction of systemic
acquired resistance [42]. It is thus feasible that H
2
O
2
could
also be involved in UV-B signaling within irradiated tissues
as well as triggering responses in tissues not directly exposed
to UV-B.
Figure 12 summarizes the impacts of UV-B on transcript reg-
ulation in the organs studied, combining genes of related
function into major categories. In our previous study using
microarray slides with fewer genes and RNA samples from
maize leaves with different levels of flavonoids [24], the cate-
gories of photosynthetic proteins, ribosomal proteins, and
enzymes involved in stress and cellular detoxification were
shown to be affected by UV-B. A new group included in this
work is proteins involved in DNA damage and DNA binding.
This group of genes is only upregulated by UV-B in directly
exposed tissues (see Additional data file 1). Cyclobutane pyri-
midine dimers between adjacent pyrimidine bases as well as
pyrimidine (6-4) pyrimidone dimers are formed after DNA
absorbs UV-B photons. Genetic analysis has demonstrated
that functional DNA repair pathways are essential for plant
survival in UV-B, and because photosynthetic tissues are con-
tinuously exposed to UV-B in sunlight, these DNA repair
pathways have been considered to be constitutively expressed
[9]. In maize, transcripts for one 6-4 photolyase are upregu-
lated by UV-B in emerging tassels (SOM c0, see Additional
data file 1). Moreover, transcripts for RAD6 are induced in
tassels and adult leaves, while RAD17 is induced in seedling
and adult leaves. These proteins are involved in post-replica-
tion repair of DNA in yeast, and they activate checkpoints that
delay cell-cycle progression in yeast and human cells, respec-
tively [33,35]. Our data suggest that constitutive expression
may be an adaptive feature, but that, in addition, maize can
acclimate to increased UV-B fluence by inducing some com-
ponents of DNA repair.
R16.16 Genome Biology 2004, Volume 5, Issue 3, Article R16 Casati and Walbot />Genome Biology 2004, 5:R16
Conclusions
We show here that direct exposure to UV-B results in signifi-
cant upregulation (relative to non-UV-B-irradiated control)
of many more transcripts than are downregulated. Most of
the UV-B-regulated genes are organ-specific. Shielded organs
experience little or no direct UV-B, but nonetheless display
transcriptome alterations; organs directly exposed to UV-B
probably produce signals that are transmitted to shielded
organs where they elicit distinct transcriptome changes, pri-
marily decreases in transcript abundance. These results indi-
cate that there are integrated responses to supplemental UV-
B. Collectively, the results from experiments manipulating
dosage and duration indicate that there are thresholds for
nearly all gene responses for both treatment length and
radiation intensity. Transcriptome profiling after UV-B
irradiation highlights possible signaling pathways and mole-
cules for future research. An important next step is under-
standing the regulatory networks that permit such
acclimation responses to UV-B and the relationship of UV-B
stress to other abiotic challenges that plants cope with
successfully.
Materials and methods
Plant material
The b, pl W23 line is maintained as a laboratory stock by self-
pollination. This line is deficient in flavonoid accumulation
(for details, see [24]).
Radiation treatments and measurements
UV treatments were carried out in a greenhouse illuminated
for 14 h daily with a combination of sodium vapor, metal hal-
ide, and UV-A-containing bulbs to a fluence approximately
10% of noon summer white sunlight. At specific stages of
development, plants were illuminated using UV-B lamps for
8 h (Phillips, F40UVB 40 W and TL 20 W/12) using fixtures
mounted 30 cm above the plants with a biologically effective
UV irradiance of 0.36 W/m
2
(9 kJ/m
2
/day) normalized to
300 nm [29]. As a comparison, the irradiation protocol used
corresponds to the 'supplementation treatment' in [24]. This
treatment was chosen because it provides more controlled
conditions than experiments in the field, even if some
responses may be different in this condition; and also because
some experiments, such as shielding tassels in adult plants,
are very difficult to do in the field because of the size of the
fully developed maize plants. This UV-B flux rate corresponds
to UV-B on 21 June at 50° from the equator at sea level with a
33% reduction from normal ozone levels. The bulbs were cov-
ered with cellulose acetate filters (CA, 100 mm extra-clear cel-
lulose acetate plastic, Tap Plastics, Mountain View, CA); the
CA sheeting does not remove any UV-B radiation from the
spectrum but excludes wavelengths lower than 280 nm (UV-
C). As a control of no UV-B, plants were exposed for the same
period of time under the same lamps covered with polyester
filters (PE, 100 mm clear polyester plastic; Tap Plastics). This
PE filter absorbs UV-B. The output of the UV-B source and
other spectral data were recorded using an Optronics model
752 spectroradiometer (Optronics Laboratories, Orlando, FL)
that was calibrated against a National Bureau of Standards
certified radiation source before each use. The spectrum
under each treatment was recorded periodically with 1 nm
resolution across the entire sunlight spectrum (290 to 800
nm). After 8-h UV-B treatment, seedling or adult leaves, 14-
day-old roots, emerging tassels or immature ears were col-
lected from multiple plants for RNA extraction. Pooled sam-
ples from the same treatment regime reduce the variability
compared to use of single individuals. The biological experi-
ment was repeated at least twice.
For experiments to investigate the impact of UV-B in shielded
leaves, leaf 9 or 10 in adult plants was covered with a plastic
bag fabricated from either UV-B-absorbing PE or UV-B-
transparent CA sheeting. Plants with one leaf covered by CA
or PE were illuminated using UV-B lamps for 8 h; samples
were collected for RNA extraction immediately after the end
of the radiation treatment. As a second control for changes in
temperature or humidity inside the plastic bags, leaf 9 or 10
from adult plants was covered with a PE plastic bag, and half
of the plants irradiated with UV-B. Leaf temperature and
humidity were recorded using an infrared thermometer
(Model 210ALCS microcomputer-based agri-term infrared
thermometer, Everest Interscience, Fullerton, CA) and a rel-
ative humidity hygrometer (Thermo-Hygro 800016, Sper
Scientific, Scottsdale, AZ). Average leaf temperatures covered
by the plastic bags were always within ± 0.5°C of each other,
and in no case were consistent differences in temperature
detected in leaves covered by the different plastics; relative
humidity differences were less than 25% between treatments.
To study reciprocity in the UV-B response, a total effective
dose of UV-B normalized to 300 nm corresponding to 2.25
kJ/m/
2
/day was administered to different adult leaves for 2 h
(irradiance 0.36 W/m
2
), for 4 h (irradiance 0.18 W/m
2
) and
for 8 h (irradiance 0.09 W/m
2
). Different irradiances were
adjusted by placing the plants at different distances from the
UV-B bulbs. As a control for circadian effects, samples were
collected from no UV-B-irradiated plants at the same times.
For experiments to study the kinetics of UV-B alteration of
gene expression, plants were grown as described above and
exposed under UV-B lamps for 30 min, 60 min, 90 min, 2, 4,
6 or 8 h. Leaf and root samples were collected for RNA extrac-
tion immediately after the end of the treatment or after the
end of an 8-h treatment without UV-B. As controls, samples
from untreated plants were also collected. Leaf samples were
also collected from UV-B-exposed plants 8 h after the
beginning of each treatment. Finally, plants were exposed for
8 h under UV-B light, and leaf samples were collected after 12,
24 and 48 h of the end of the radiation treatment. As control,
leaf samples were collected simultaneously from plants not
irradiated with UV-B.
Genome Biology 2004, Volume 5, Issue 3, Article R16 Casati and Walbot R16.17
comment reviews reports refereed researchdeposited research interactions information
Genome Biology 2004, 5:R16
RNA isolation, mRNA purification and probe synthesis
Multiple leaves and tissues from different plants from each
radiation treatment were collected for RNA extraction.
Because of the sensitivity of microarrays, plant-to-plant vari-
ation was reduced by bulk harvesting at least six samples of
each tissue from different plants collected from each experi-
mental treatment. RNA was extracted using TRIzol reagent
(Invitrogen, Carlsbad, CA) according to the manufacturers'
recommendations. Poly(A) RNA was isolated using Oligotex
(Qiagen, Valencia, CA), and 4 µg poly (A) RNA was used for
each cDNA synthesis using Superscript II reverse tran-
scriptase (Life Technologies, Carlsbad, CA). cDNA was
labeled using 100 µM Cy5-dUTP or Cy3-dUTP (Amersham,
Piscataway, NJ). Excess nucleotides and primers were
removed using QIAquick PCR Purification Kit (Qiagen).
RNA gel blot hybridization
Total RNA (10 µg) was analyzed by electrophoresis on a 2%
(v/v) formaldehyde/1.5% (w/v) agarose gels and blotted onto
Hybond-N+ nylon membrane (Amersham). DNA probes
were labeled with α
32
P-dCTP by the random primer method
and purified from unincorporated nucleotides using probe
purification columns (Amersham). Hybridizations were done
overnight at 42°C using 50% (v/v) formamide. Hybridization
signals were quantified using Kodak ds 1D Digital Science
(Scientific Imaging System, New Haven, CT).
Microarray experiments
Maize Unigene I arrays fabricated by the Maize Gene Discov-
ery Project contain 5,664 ESTs [28]. About 90% of the spot-
ted cDNAs showed significant hybridization when leaf mRNA
was used for the experiments. Within these arrays, the cDNA
samples are printed three times next to each other; conse-
quently, average signal intensities and the ratio between co-
hybridized samples could be assessed multiple times within
each microarray and within experiments. These arrays con-
tain cDNAs recovered from libraries of mixed adult tissues
(707 and 945), mixed stages of embryo development (687),
and salt-stressed roots (603). The experimental and reference
samples were labeled with either Cy5-dUTP or Cy3-dUTP flu-
orescent dye (Amersham). Two samples, each labeled with
one of the dyes, were mixed and then hybridized to a
microarray for 15 h at 60°C. The slides were washed and then
scanned with a GenePix 4000B Scanner (Axon Instruments,
Union City, CA). Normalization between the Cy3 and Cy5 flu-
orescent dye-emission channels was achieved by adjusting
the levels of both image intensities. The experiments were
repeated at least twice with samples from different experi-
ments as biological replicates. In these dye-swapping experi-
ments, the RNA samples from different experiments were
labeled reciprocally, both as a biological and technical repeti-
tion for comparing the reproducibility of the experiments.
Data analysis
The hybridization intensities of each microarray element
were measured using Scanalyse 4.24 (available at [43]). The
two channels were normalized in log space using the z-score
normalization on a 95% trimmed dataset. We removed unre-
liable spots according to the following criteria: spots flagged
as having false intensity caused by dust or background on the
array were removed, and spots for which intensity was less
than threefold above background were also eliminated. Sig-
nals from triplicate spots were averaged. The data was sub-
mitted to the GEO repository, and the GEO Accession number
of the series is GSE671. Multiple experiments were analyzed
using Cluster and Treeview software [44]. To interpret the
data, genes were grouped according to similarity of expres-
sion patterns by two algorithms. A hierarchical clustergram of
genes was grouped by both related regulation patterns and
expression amplitudes; and expression profiles were organ-
ized with self-organizing maps or SOMs. For hierarchical
cluster analysis, we used the default options of hierchical
clustering using the uncentered correlation similarity metric.
We performed the analysis using both normalized and non-
normalized data; the outcomes were essentially the same.
Pigment extraction and HPLC
Half a gram of fresh leaf tissue was frozen in liquid nitrogen
and ground to a powder with a mortar and pestle. The powder
was extracted for 8 h with 3 ml acidic methanol (1% HCl in
methanol), followed by a second extraction with 6 ml chloro-
form and 3 ml distilled water. The extracts were vortexed and
then centrifuged for 2 min at 3,000g. The spectra were
recorded using a SpectraMAX 250 spectrophotometer plate
reader (Molecular Devices, Sunnyvale, CA). Extractions for
HPLC analysis were done as above, and the resulting
supernatant was diluted with 5% acetic acid in a 1:10 ratio and
immediately loaded onto the HPLC. High-performance liquid
chromatography was done using a Dionex GP40 gradient
pump (Dionex, Sunnyvale, CA) using an Microsorb 100-5 C18
column (Varian, Palo Alto, CA). Data were collected and ana-
lyzed using PEAKNET software (Dionex). Pigment separation
was by gradient elution with a flow rate of 0.75 ml/min and
solvent A: 5% acetic acid; solvent B: acetonitrile. The protocol
consisted of 1 min at 90% A, 10% B; from 90% A, 10% B to
65% A, 35% B in 17.6 min; to 100% B in 2.4 min, at 100% B
for 1 min; to 90% A, 10% B in 3 min; at 90% A, 10% B for 3
min. Absorbance was detected at 380 nm using a Dionex
AD20 detector.
Real-time PCR
Real-time PCR primers were designed using the Primer3 soft-
ware [45]. The primers for the histone deacetylase gene (Gen-
Bank AI438666) were: AAGGCTGCTGAACTACAC (forward
primer) and TTGACCAGCACACTCAAG (reverse primer); for
the cytosine 5' DNA methyltransferase gene (AW215926):
CCCGCAAATTCATAGCTG (forward primer) and
AGGCCAATCAGTGGAAAG (reverse primer); for the methyl-
binding protein gene (AI737448): ATGCAGAGCCAAAT-
CAGC (forward primer) and AAGGCAGAGGCACAAAAG
(reverse primer); for the RAD5 gene (AI691852):
GCACAACAGCAGCTAAAC (forward primer) and
R16.18 Genome Biology 2004, Volume 5, Issue 3, Article R16 Casati and Walbot />Genome Biology 2004, 5:R16
GCAGCGAATGATTTCTGG (reverse primer); for the cysteine
proteinase gene (AW129800): GCTCCCGTTAGCACTATCAC
(forward primer) and GACGTGGGTGCTTGTCTT (reverse
primer); for the membrane protein Mlo5 (BE025314):
AAGACGAACTCTTCGGAGTC (forward primer) and
TGCTCTTCCTCATCCACTTC (reverse primer), for the snRNP
Sm protein F (AW330881): ACCGTTGCTGCATTCTTC (for-
ward primer) and TTGGCAAGCTGGAGATTC (reverse
primer), for AW433427: ACGGAGAATTAGGGTTCGAT (for-
ward primer) and GTCACTACCTCCCCGTGTC (reverse
primer). As an internal control, primers for a thioredoxin-like
gene (AW927774) were used: GGACCAGAAGATTGCAGAAG
(forward primer) and CAGCATAGACAGGAGCAATG (reverse
primer). Fifteen micrograms RNA was used for cDNA synthe-
sis using Superscript II reverse transcriptase (Life Technolo-
gies). Real-time PCR was carried out in a reaction containing
1x Mg-free buffer, 2 mM MgCl
2
, 200 µM mixed dNTPs, 0.4
µU DyNAzyme II (MJ Research, South San Francisco, CA),
0.5x SYBR Green I (Molecular Probes, Eugene, OR), 0.25 µM
of each primer, and 50 ng cDNA in a final volume of 20 µl.
Three replicates were performed for each sample plus tem-
plate-free samples and other negative controls (reaction with-
out reverse transcriptase). Real-time PCR was carried out in
a DNA Engine OPTICON2 (MJ Research); the standard
amplification protocol consists of an initial denaturation step
at 95°C for 30 sec, followed by 40 amplification cycles at 95°C
for 10 sec, 58°C for 5 sec, and 72°C for 10 sec. Fluorescence
measurements were taken at the end of the annealing phase
at a temperature 4°C lower than the melting point of each
amplicon. To confirm the size of the real-time PCR products
(each less than 200 base pairs (bp)), and that they correspond
to a unique and expected PCR product, the PCR products
were separated on a 2% agarose gel at the end of the reaction.
The PCR products were purified from the gel and sequenced
in the Stanford PAN facility to verify their identities. The
threshold cycle numbers (Ct) at which each sample reached
the threshold fluorescence level for each type of PCR product
were determined for all samples. The obtained Ct values for
each sample type were used in the formula 2
(Ct ref-Ct tra)
/2
(Ct
refp-Ct tra)
where Ct ref and Ct tra are the threshold cycles of the
reference gene and the gene under study in the UV-B exposed
and control samples, respectively. To validate the linearity of
the assay, the amplification efficiencies of the target and ref-
erences were shown to be approximately equal by diluting the
template and determining Ct values for the dilution series.
Two amplicons have the same efficiency if the differences in
Ct values are proportional to the cDNA dilution [46].
Additional data files
The following additional data are included with the online
version of this article: a table showing the transcripts regu-
lated by UV-B radiation in b, pl plants, organized according to
their expression profiles with self-organizing maps (Addi-
tional data file 1); a table listing the ESTs upregulated by UV-
B in adult leaves covered with PE plastic (Additional data file
2).
Additional data file 1A table showing the transcripts regulated by UV-B radiation in b, pl plantsA table showing the transcripts regulated by UV-B radiation in b, pl plantsClick here for additional data fileAdditional data file 2A table listing the ESTs upregulated by UV-B in adult leaves cov-ered with PE plasticA table listing the ESTs upregulated by UV-B in adult leaves cov-ered with PE plasticClick here for additional data file
Acknowledgements
We thank Jonathan Gent for his help with pigment extraction and HPLC
analysis and Rich Kurtz of MJ Bioworks for his advice in establishing real-
time PCR assays. Darren Morrow provided helpful comments on a draft of
the manuscript. This study was supported in part by a grant from the
National Science Foundation (IBN 98-72657). P.C. was a postdoctoral fel-
low of Fundación Antorchas and a member of the Research Career of the
Consejo Nacional de Investigaciones Científicas y Técnicas (CONICET).
References
1. Rozema J, Bjorn LO, Bornman JF, Gaberscik A, Hader DP, Trost T,
Germ M, Klisch M, Groniger A, Sinha RP, et al.: The role of UV-B
radiation in aquatic and terrestrial ecosystems: an experi-
mental and functional analysis of the evolution of UV-
absorbing compounds. J Photochem Photobiol B 2002, 66:2-12.
2. de Gruijl FR, Van der Leun JC: Estimate of the wavelength
dependency of ultraviolet carcinogenesis in humans and its
relevance to the risk assessment of a stratospheric ozone
depletion. Health Phys 1994, 67:319-325.
3. Ballaré CL, Rousseaux MC, Searles PS, Zaller JG, Giordano CV, Rob-
son TM, Caldwell MM, Sala OE, Scopel AL: Impacts of solar ultra-
violet-B radiation on terrestrial ecosystems of Tierra del
Fuego (southern Argentina) - An overview of recent
progress. J Photochem Photobiol B 2001, 62:67-77.
4. Searles PS, Flint SD, Caldwell MM: A meta analysis of plant field
studies simulating stratospheric ozone depletion. Oecologia
2001, 127:1-10.
5. Paul ND, Gwynn-Jones D: Ecological roles of solar UV radiation:
towards an integrated approach. Trends Ecol Evol 2003, 18:48-55.
6. Stapleton AE, Walbot V: Flavonoids can protect maize DNA
from the induction of ultraviolet-radiation damage. Plant
Physiol 1994, 105:881-889.
7. Mazza CA, Boccalandro HE, Giordano CV, Battista D, Scopel AL, Bal-
laré CL: Functional significance and induction by solar radia-
tion of ultraviolet-absorbing sunscreens in field-grown
soybean crops. Plant Physiol 2000, 122:117-125.
8. Bieza K, Lois R: An Arabidopsis mutant tolerant to lethal ultra-
violet-B levels shows constitutively elevated accumulation of
flavonoids and other phenolics. Plant Physiol 2001,
126:1105-1115.
9. Britt AB: DNA damage and repair in plants. Annu Rev Plant Physiol
Plant Mol Biol 1996, 4:75-100.
10. Landry LG, Stapleton AE, Lim J, Hoffman P, Hays JB, Walbot V, Last
RL: An Arabidopsis photolyase mutant is hypersensitive to
ultraviolet-B radiation. Proc Natl Acad Sci USA 1997, 94:328-332.
11. Gerhardt KE, Wilson MI, Greenberg BM: Tryptophan photolysis
leads to a UVB-induced 66 kDa photoproduct of ribulose-
1,5-bisphosphate carboxylase/oxygenase (Rubisco) in vitro
and in vivo. Photochem Photobiol 1999, 70:49-56.
12. Angel P, Imagawa M, Chiu R, Stein B, Imbra RJ, Rajmsdorf HJ, Jonat C,
Herrlich P, Karin M: Phorbol ester inducible genes contain a
common cis element recognized by a TPA-modulated trans-
acting factor. Cell 1987, 49:729-739.
13. Adler V, Pincus MR, Polotskaya A, Montano X, Friedman FK, Ronai Z:
Activation of c-Jun-NH2-kinase by UV irradiation is depend-
ent on p21(ras). J Biol Chem 1996, 271:23304-23309.
14. Tyrrell RM: Activation of mammalian gene expression by the
UV component of sunlight: from models to reality. BioEssays
1996, 18:139-148.
15. Bender K, Blattner C, Knebel A, Iordanov M, Herrlich P, Rahmsdorf
HJ: UV-induced signal transduction. J Photochem Photobiol B 1997,
37:1-17.
16. Christie JM, Jenkins GI: Distinct UV-B and UV-A/blue light sig-
nal transduction pathways induce chalcone synthase gene
expression in Arabidopsis cells. Plant Cell 1996, 8:1555-1567.
17. Frohnmeyer H, Bowler C, Schafer E: Evidence for some signal
transduction elements involved in UV-light dependent
responses in parsley protoplasts. J Exp Bot 1997, 48:739-750.
18. Conconi A, Smerdon MJ, Howe GA, Ryan CA: The octadecanoid
signalling pathway in plants mediates a response to ultravio-
Genome Biology 2004, Volume 5, Issue 3, Article R16 Casati and Walbot R16.19
comment reviews reports refereed researchdeposited research interactions information
Genome Biology 2004, 5:R16
let radiation. Nature 1996, 383:826-829.
19. Holley SR, Yalamanchili RD, Moura DS, Ryan CA, Stratmann JW:
Convergence of signaling pathways induced by systemin, oli-
gosaccharide elicitors, and ultraviolet-B radiation at the
level of mitogen-activated protein kinases in Lycopersicon
peruvianum suspension-cultured cells. Plant Physiol 2003,
132:1728-1738.
20. Surplus SL, Jordan BR, Murphy AM, Carr JP, Thomas B, Mackerness
SA-H: Ultraviolet-B-induced responses in Arabidopsis thal-
iana: role of salicylic acid and reactive oxygen species in the
regulation of transcripts encoding photosynthetic and acidic
pathogenesis-related proteins. Plant Cell Environ 1998,
21:685-694.
21. Mackerness SA-H, Jordan BR: Changes in gene expression in
response to ultraviolet B-induced stress. In Handbook of Plant
and Crop Stress 2nd edition. Edited by: Pessarakli M. New York, Basel:
Marcel Dekker; 1999:749-768.
22. Mackerness SA-H, John CF, Jordan B, Thomas B: Early signaling
components in ultraviolet-B responses: distinct roles for dif-
ferent reactive oxygen species and nitric oxide. FEBS Lett 2001,
489:237-242.
23. Gross S, Knebel A, Tenev T, Neininger A, Gaestel M, Herrlich P,
Bohmer FD: Inactivation of protein-tyrosine phosphatases as
mechanism of UV-induced signal transduction. J Biol Chem
1999, 274:26378-26386.
24. Casati P, Walbot V: Gene expression profiling in response to
ultraviolet radiation in Zea mays genotypes with varying fla-
vonoid content. Plant Physiol 2003, 132:1739-1754.
25. Izaguirre MM, Scopel AL, Baldwin IT, Ballaré CL: Convergent
responses to stress. Solar Ultraviolet-B radiation and Mand-
uca sexta herbivory elicit overlapping transcriptional
responses in field-grown plants of Nicotiana longiflora. Plant
Physiol 2003, 132:1755-1767.
26. Ballaré CL: Stress under the sun: spotlight on ultraviolet-B
responses. Plant Physiol 2003, 132:1725-1727.
27. Dooner HK: Coordinate genetic regulation of flavonoid bio-
synthetic enzymes in maize. Mol Gen Genet 1983, 189:136-141.
28. Microarray Project: overview [ />zmdb/microarray/]
29. Caldwell MM: Solar UV irradiation and the growth and devel-
opment of higher plants. Photophysiology 1971, 6:131-177.
30. Mackerness SA-H, Thomas B, Jordan BR: The effect of supplemen-
tary ultraviolet-B radiation on transcripts, translation and
stability of chloroplast proteins and pigment formation in
Pisum sativum L. J Exp Bot 1997, 48:729-738.
31. Jordan BR: The effects of UV-B radiation on plants: A molec-
ular perspective. In Advances in Botanical Research Edited by: Callow
JA. Boca Raton: Academic Press; 1996:97-162.
32. Noah JW, Shapkina T, Wollenzien P: UV-induced crosslinks in the
16S rRNAs of Escherichia coli, Bacillus subtilis and Thermus
aquaticus and their implications for ribosome structure and
photochemistry. Nucleic Acids Res 2000, 28:3785-3792.
33. Bao SD, Tibbetts RS, Brumbaugh KM, Fang YN, Richardson DA, Ali
A, Chen SM, Abraham RT, Wang XF: ATR/ATM mediated
phosphorylation of human RAD17 is required for genotoxic
stress responses. Nature 2001, 411:969-974.
34. Xu XJ, Dietrich CR, Delledonne M, Xia YJ, Wen TJ, Robertson DS,
Nikolau BJ, Schnable PS: Sequence analysis of the cloned glossy8
gene of maize suggests that it may code for a beta-ketoacyl
reductase required for the biosynthesis of cuticular waxes.
Plant Physiol 1997, 115:501-510.
35. Hishida T, Ohno T, Iwasaki H, Shinagawa H: Saccharomices cerevi-
siae MGS1 is essential in strains deficient in in the RAD6-
dependent DNA damage tolerance pathway. EMBO J 2002,
21:2019-2029.
36. Pyne S, Pyne NJ: Sphingosine 1-phosphate signaling in mam-
malian cells. Biochem J 2000, 349:385-402.
37. Spiegel S, Milstien S: Sphingosine-1-phosphate: an enigmatic
signalling lipid. Nat Rev Mol Cell Biol 2003, 4:397-407.
38. Cho Y, Fernandes J, Kim S-H, Walbot V: Gene-expression profile
comparisons distinguish seven organs of maize. Genome Biol
2002, 3:research0045.1-0045.16.
39. Kunkel BN, Brooks DM: Cross talk between signaling pathways
in pathogen defense. Curr Opin Plant Biol 2002, 5:325-331.
40. Arnots T, Murphy TM: A comparison of the effects of a fungal
elicitor and ultraviolet radiation on ion transport and hydro-
gen peroxide in rose cells. Environ Exp Bot 1991, 31:209-216.
41. Dai Q, Yan B, Huang S, Liu X, Peng S, Miranda MLM, Chavez AQ,
Vegara BS, Olszyk D: Response to oxidative stress defense sys-
tems in rice (Oryza sativa) leaves with supplemental UV-B
radiation. Physiol Plant 1997, 101:301-308.
42. Kuzniak E, Urbanek H: The involvement of hydrogen peroxide
in plant responses to stresses. Acta Physiol Plant 2000, 22:195-203.
43. SMD Microarray Links: Software & Tools [http://genome-
www5.stanford.edu/restech.shtml]
44. Eisen MB, Spellman PT, Brown PO, Botstein D: Cluster analysis
and display of genome-wide expression patterns. Proc Natl
Acad Sci USA 1998, 95:14863-14868.
45. Rozen S, Skaletsky HJ: Primer3 on the WWW for general users
and for biologist programmers. In Bioinformatics Methods and Pro-
tocols: Methods in Molecular Biology Edited by: Krawetz S, Misener S.
Totowa, NJ: Humana Press; 2000:365-386.
46. Livak KJ, Schmittgen TD: Analysis of relative gene expression
data using real time quantitative PCR and the 2-∆∆ Ct
method. Methods 2001, 25:402-408.