a database of protein functional linkages derived from coevolution doc
Bạn đang xem bản rút gọn của tài liệu. Xem và tải ngay bản đầy đủ của tài liệu tại đây (855.38 KB, 13 trang )
Genome Biology 2004, 5:R35
comment reviews reports deposited research refereed research interactions information
Open Access
2004Bowerset al.Volume 5, Issue 5, Article R35
Software
Prolinks: a database of protein functional linkages derived from
coevolution
Peter M Bowers
*
, Matteo Pellegrini
*
, Mike J Thompson
*
, Joe Fierro
†
,
Todd O Yeates
*
and David Eisenberg
*
Addresses:
*
Institute for Genomics and Proteomics, University of California, Los Angeles, CA 90095, USA.
†
454 Corporation, Branford, CT
06405, USA.
Correspondence: David Eisenberg. E-mail:
© 2004 Bowers et al.; licensee BioMed Central Ltd. This is an Open Access article: verbatim copying and redistribution of this article are permitted in all
media for any purpose, provided this notice is preserved along with the article's original URL.
Prolinks: a database of protein functional linkages derived from coevolution<p>The advent of whole-genome sequencing has led to methods that infer protein function and linkages. We have combined four such algo-rithms (phylogenetic profile, Rosetta Stone, gene neighbor and gene cluster) in a single database - Prolinks - that spans 83 organisms and includes 10 million high-confidence links. The Proteome Navigator tool allows users to browse predicted linkage networks interactively, providing accompanying annotation from public databases. The Prolinks database and the Proteome Navigator tool are available for use online at <url> />Abstract
The advent of whole-genome sequencing has led to methods that infer protein function and
linkages. We have combined four such algorithms (phylogenetic profile, Rosetta Stone, gene
neighbor and gene cluster) in a single database - Prolinks - that spans 83 organisms and includes 10
million high-confidence links. The Proteome Navigator tool allows users to browse predicted
linkage networks interactively, providing accompanying annotation from public databases.
The Prolinks database and the Proteome Navigator tool are available for use online at
/>Rationale
Genome sequencing has allowed scientists to identify most of
the genes encoded in each organism. The function of many,
typically 50%, of translated proteins can be inferred from
sequence comparison with previously characterized
sequences. However, the assignment of function by homology
gives only a partial understanding of a protein's role within a
cell. A more complete understanding of protein function
requires the identification of interacting partners: interacting
subunits if the protein is a component of a molecular com-
plex, and pathway members if the protein participates in a
metabolic or signal transduction pathway [1]. Knowledge of
these relationships, which we will call 'functional linkages', is
a prerequisite for understanding physiology and pathology.
An enhanced understanding of the physical and functional
relationships between proteins has recently become attaina-
ble through the use of non-homology-based methods [2,3].
These methods infer functional linkage between proteins by
identifying pairs of nonhomologous proteins that coevolve.
Evolutionary pressure dictates that pairs of proteins that
function in concert are often both present or both absent
within genomes (phylogenetic profiles method), tend to be
coded nearby in multiple genomes (gene neighbors method),
might be fused into a single protein in some organisms
(Rosetta Stone method) or are components of an operon
(gene cluster method). In contrast, proteins not related by
function need not appear together or exhibit spatial proximity
in the genome. The complete sequencing of over 100 genomes
provides a rich medium from which to infer protein linkages
and function by analyzing pairwise properties using these
methods. Protein functional links may also be inferred from
automated text mining. Here we use a simple algorithm (Text-
Links) to identify proteins that are often found together in
scientific abstracts [4].
In this paper we describe a new publicly available database -
Prolinks - and the associated Proteome Navigator tool that
combine pairwise associations generated from each of the
inference methods mentioned above. This tool allows the user
Published: 16 April 2004
Genome Biology 2004, 5:R35
Received: 7 January 2004
Revised: 23 February 2004
Accepted: 4 March 2004
The electronic version of this article is the complete one and can be
found online at />R35.2 Genome Biology 2004, Volume 5, Issue 5, Article R35 Bowers et al. />Genome Biology 2004, 5:R35
to explore interactively the protein links generated for 83
microbial organisms. Sequence, sequence homology, and
public annotation, including the Kyoto Encyclopedia of Genes
and Genomes (KEGG), Clusters of Orthologous Groups
(COG) and National Center for Biotechnology Information
(NCBI) descriptions, are available for each protein. The net-
work of predicted associations is tunable, based on an adjust-
able confidence limit. The network has 'clickable' nodes that
permit rapid navigation. Although this is not the first data-
base that analyzes protein coevolution, it is in many respects
distinct from existing tools [5,6]. In the Discussion section we
analyze these differences. We also show how the Proteome
Navigator may be used to recover links between functionally
related proteins and between proteins contained within pro-
tein complexes. In short, this database extends the value of
existing tools for genome annotation.
Genomic inference methods
The four genomic methods used by the Proteome Navigator
are the phylogenetic profile, gene neighbor, Rosetta Stone,
and gene cluster methods. An additional method, named Tex-
tLinks, does not use genomic context to infer functional link-
ages, but instead provides an automated analysis of PubMed
scientific abstracts to infer protein relationships. Although
each approach has been previously reported, here we provide
the details of its implementation in the Prolinks database.
Phylogenetic profile method
The phylogenetic profile method uses the co-occurrence or
absence of pairs of nonhomologous genes across genomes to
infer functional relatedness [7,8]. The underlying assumption
of this method is that pairs of nonhomologous proteins that
are often present together in genomes, or absent together, are
likely to have coevolved. That is, the organism is under evolu-
tionary pressure to encode both or neither of the proteins
within its genome and encoding just one of the proteins low-
ers its fitness. As in all of the above methods, we assume, and
later confirm, that coevolved genes are likely to be members
of the same pathway or complex.
Because sequenced genomes allow us to catalog most of the
proteins encoded in each organism, we can determine the
pattern of presence and absence of a protein by searching for
its homologs across organisms. We define a homolog of a
query protein to be present in a secondary genome if the
alignment, using BLAST [9], of the query protein with any of
the proteins encoded by the secondary genome generates an
E-value less than 10
-10
. The result of this calculation across N
genomes yields an N-dimensional vector of ones and zeroes
for the query protein that we call a phylogenetic profile. At
each position in the profile the presence of a homolog in the
corresponding genome is indicated with a one and an absence
with a zero. A schematic representation of the construction of
phylogenetic profiles is shown in Figure 1.
Using this approach we can readily compute the phylogenetic
profiles for each protein coded within a genome of interest.
We next need to determine the probability that two proteins
have coevolved; this is based on the similarity of their pro-
files. If we assume that the two proteins A and B do not coe-
volve, we can compute the probability of observing a specific
overlap between their two profiles by chance by using the
hypergeometric distribution:
where N represents the total number of genomes analyzed, n
the number of homologs for protein A, m the number of
homologs for protein B and k' the number of genomes that
contain homologs of both A and B [10]. Because P represents
the probability that the proteins do not coevolve, 1 - P(k >k')
is then the probability that they do coevolve. We compute this
probability for all pairs of proteins within a genome.
Gene cluster method
Within bacteria, proteins of closely related function are often
transcribed from a single functional unit known as an operon.
Operons contain two or more closely spaced genes located on
the same DNA strand. These genes are often in proximity to a
transcriptional promoter that regulates operon expression.
Various methods have been developed to identify operon
structure within microbial genomes [11-13], relying on inter-
genic distance as a predictor of operon structure.
Our approach to the identification of operons begins with the
assumption that gene start positions can be modeled by a
Poisson distribution, with each position having the same
probability of being a start site. In other words, if we consider
only the intergenic regions of a genome plus all the start sites,
the probability that a gene starts at any position is given by
P(start) = me
-m
where m is the total number of genes divided
by the number of intergenic nucleotides. It follows that the
probability that a gene does not start at a position is
P(position_without_start) = e
-m
and the probability of N - 1
sequential nucleotides without a start site followed by a start
site is P(N_positions_without_starts) = me
-Nm
. From this we
estimate the probability that two genes are separated by a dis-
tance less than N:
We assume that the probability that two genes that are adja-
cent and coded on the same strand are part of an operon is 1 -
P, as the more likely we are to find a greater intergenic
Pk nmN
n
k
N
m
n
k
N
m
′
()
=
−
−
|, ,
P separation N me e
mN
x
mx
<
()
==−
−−
∫
0
1
Genome Biology 2004, Volume 5, Issue 5, Article R35 Bowers et al. R35.3
comment reviews reports refereed researchdeposited research interactions information
Genome Biology 2004, 5:R35
separation the less likely two genes are to be part of an
operon. Although this is a very simple model of intergenic
spacing, it captures the basic biology that the closer two co-
directional genes are, the more likely they are to be members
of the same operon. Unlike the other coevolution methods
described here, the gene cluster method is able to identify
potential functions for proteins exhibiting no homology to
proteins in other genomes.
Gene neighbor method
Some of the operons contained within a particular organism
may be conserved across other organisms. The conservation
of an operon's structure provides additional evidence that the
genes within the operon are functionally coupled and are per-
haps components of a protein complex or pathway. Several
methods have been reported that identify conserved operons
[14-16]. However, unlike the previous approaches, we have
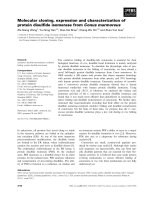
The general mechanism of inference for each of the four methods used by the Proteome NavigatorFigure 1
The general mechanism of inference for each of the four methods used by the Proteome Navigator. (a) The gene neighbor (GN) method identifies protein
pairs encoded in close proximity across multiple genomes. We see in this example that genes A and B are gene neighbors while A and C are not. (b) The
Rosetta Stone (RS) method searches for gene fusion events. We see that the A and B proteins are expressed as separate proteins in one organism.
However, in a second organism a sequence exists that represents the fusion of the two proteins. The fusion protein is termed the Rosetta Stone protein
as it allows us to infer that the A and B proteins are functionally linked. (c) The construction of phylogenetic profiles (PP) begins with four sequenced
genomes, from which the protein sequences have been predicted. The protein sequence, A, within E. coli is compared to that of the proteins coded by the
other genomes and homologs are identified. If the genome contains a homolog of A, a 1 is placed in the corresponding phylogenetic profile position, a 0
otherwise. Genes with similar phylogenetic profiles are likely to participate in the same pathway. (d) The gene cluster (GC) or operon method identifies
closely spaced genes, and assigns a probability P of observing a particular gap distance (or smaller), as judged by the collective set of inter-gene distances.
Genome 1
A
B
C
C
Genome 2
A
B
C
Genome 3
A
B
C
A
AB
B
Query protein
Rosetta protein
Linked protein
Protein A
Protein B
Protein C
Protein D
1
1
1
1
1
1
0
1
1
1
1
0
0
0
1
1
Genome 4
B
A
Genome 1 Genome 2 Genome 3 Genome 4
ABC D
E
(P=0.015) (P=0.003) (P=0.43)
(a)
(b)
(c)
(d)
B
R35.4 Genome Biology 2004, Volume 5, Issue 5, Article R35 Bowers et al. />Genome Biology 2004, 5:R35
developed a novel algorithm that generates a P value for the
likelihood that two proteins are coded within a conserved
operon. A schematic describing this method is shown in Fig-
ure 1, where genes A and B are found in close proximity on
four genomes, while gene C is positioned randomly.
Our approach, the gene neighbor method, first computes the
probability that two genes are separated by fewer than d
genes:
where N is the total number of genes in the genome. Note that
we must use the smaller of two values of d for two genes that
are coded on a circular plasmid or circular chromosome. If
the two genes have homologs in other organisms we compute
the product of the above probability across these organisms:
where m is the number of organisms that contain homologs of
the two genes of interest.
To compute the likelihood that two genes are components of
a conserved operon we need to compute the probability of
obtaining a value of X that is smaller than the observed value.
It can be shown that this probability is given by:
Rosetta Stone method
Occasionally, two proteins expressed separately in one organ-
ism can be found as a single chain in the same or a second
genome. Analysis of gene fusion/division events to infer func-
tional relatedness, commonly known as the Rosetta Stone
method, is illustrated in Figure 1, and has been described in
detail elsewhere [17,18]. Proteins that carry out consecutive
metabolic steps or are components of molecular complexes
are often expressed as a single polypeptide chain to maximize
kinetic or expression efficiency.
To detect gene-fusion events we first align all protein-coding
sequences from a genome against the nonredundant database
using BLAST. We identify cases where two nonhomologous
proteins both align over at least 70% of their sequence to dif-
ferent portions of a third protein. We refer to the third protein
as the Rosetta Stone protein. When this situation arises we
hypothesize that during the course of evolution the ancestors
of the two proteins fused to form the ancestor of the Rosetta
Stone protein.
A confounding aspect of this analysis is that many of the
alignments between the starting proteins and the Rosetta
Stone protein occur in regions of highly conserved domain
sequences, such as kinase or zinc finger domains. Proteins
that contain these common domains are often found linked to
each other by the Rosetta Stone method, even though they
may not have fused.
To screen out these confounding fusion events we compute
the probability that two proteins are found linked by the
Rosetta Stone method by chance alone:
where k' is the number of Rosetta Stone sequences, n the
number of homologs of protein A and m the number of
homologs of protein B and N the total number of sequences in
the nr database [19]. In other words, if a protein has many
homologs in the database, possibly because it contains a com-
mon domain, it is likely to be linked to a second protein, even
though the Rosetta Stone protein did not evolve by a fusion of
this protein with another. Therefore, the probability that two
proteins have fused is given by 1 - P(k >k').
TextLinks
Just as the systematic presence or absence of coevolved genes
across genomes can be used to infer functional linkages, so to
can the co-occurrence of gene names and symbols within the
scientific literature be used to establish known gene interac-
tions. Again, the underlying assumption is that genes, related
by function, will often appear within the same scientific arti-
cle or abstract. For this analysis, we have used the PubMed
database [20], containing 14 million abstracts and citations,
as a basis set. Within abstracts, we identify the presence or
absence of individual genes using a controlled vocabulary of
gene names and symbols available for each genome at NCBI
[21].
As with the phylogenetic profile method, abstracts and indi-
vidual gene names were used to develop a binary vector
describing each protein's distribution within the scientific lit-
erature. The result is an N-dimensional vector (where N is the
total number of abstracts) of ones (a protein name is found
within a given abstract or citation) and zeroes (the protein
name is absent) for the query protein. Using this approach,
we compute the literature profile for each protein coded
within a genome of interest. Finally, we compute the proba-
bility that two proteins are related, based on the similarity of
their literature profiles, using the same hypergeometric dis-
tribution function used for the phylogenetic profile and
Rosetta Stone methods:
Pd
d
N
≤
()
=
−
2
1
XPd
d
N
ii
i
i
i
m
i
m
=≤
()
=
−
==
∏∏
2
1
11
PX PXX
X
k
mm
k
k
m
≤
()
=− >
()
≈
−
()
=
−
∑
1
0
1
ln
!
Pk nmN
n
k
N
m
n
k
N
m
′
()
=
−
−
|, ,
Genome Biology 2004, Volume 5, Issue 5, Article R35 Bowers et al. R35.5
comment reviews reports refereed researchdeposited research interactions information
Genome Biology 2004, 5:R35
where N represents the total number of abstracts analyzed, n
the number of instances for the protein A name or symbol, m
the number of instances for the protein B name or symbol,
and k' the number of abstracts that contain both A and B pro-
tein names or symbols. The probability that two proteins are
literature related, given as 1 - P(k >k'), is computed for all
pairs of annotated proteins within a genome. TextLinks rep-
resents an attempt to mine the current state of scientific
understanding of protein function and interactions. Cur-
rently TextLinks are available within Prolinks and the Pro-
teome Navigator only for E. coli.
The Prolinks database
Each of the methods outlined above is statistical in nature,
allowing us to compute a probability associated with each
predicted interaction. However, the probability metrics from
different methods differ in scale, making direct comparison of
inference between methods problematic. To overcome this
limitation we have developed a universal confidence metric.
The confidence metric for each prediction is derived from
COG pathway recovery [22]. For each method, inferences are
ordered by their intrinsic statistical metric (P-value) and the
cumulative accuracy with which COG pathway annotation is
recovered, starting from the most significant prediction, is
recorded for each pairwise prediction. Recovery means that
both proteins belong to the same pathway. Predicted pairs
with the same COG pathway annotation are treated as true
positive, while pairs assigned to different COG pathways are
considered false positive.
The current version of the Prolinks database contains link-
ages for 83 genomes. We list all the organisms in Table 1:
there are ten from the Archaea, five from the Eukaryota and
the rest are from the Bacteria. In total we have computed
18,077,293 links between proteins coded within these
genomes. As the number of fully sequenced genomes is con-
stantly increasing, we expect that future versions of this data-
base will contain significantly more data. The Prolinks
database may be accessed though the Proteome Navigator
tool [23] or by accompanying flatfiles.
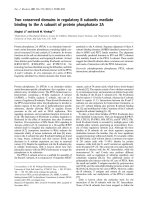
Figure 2 shows how well each of the four coevolution methods
performs in recovering protein pairs that are assigned to the
same COG pathway. Based on this metric, the gene neighbor
method provides the most accurate and extensive coverage of
the four methods, whereas the gene cluster method is the
least accurate.
Because each method is now measured according to the same
confidence metric, we combine all the methods by consider-
ing any pair of genes to be linked with a confidence given by
the maximal confidence of any method. The receiver operator
characteristic curve (ROC; Figure 2b) shows that the rank-
ordered list of combined protein interactions recovers func-
tionally related protein links with a 15-fold greater accuracy
than would be expected from a random selection of protein
pairs. From this analysis we conclude that pairs of genes that
function within the same pathway are likely to be coupled
Pk nmN
n
k
N
m
n
k
N
m
′
()
=
−
−
|, ,
We assess COG category recovery for the four individual methods, the combination of the four methods, and TextLinksFigure 2
We assess COG category recovery for the four individual methods, the
combination of the four methods, and TextLinks. (a) We assign a
confidence measure to the likelihood that a pair of proteins is acting within
the same COG pathway, reflecting the number of COG-annotated pairs
that lie within the same pathway relative to the total number of annotated
pairs. The COG confidence metric is used in the network-graphing
function of the Proteome Navigator to select inferred protein linkages
with uniform confidence. E. coli protein pairs displayed in this figure have a
COG pathway confidence recovery (cumulative accuracy) of greater than
0.4, with the exception of the TextLinks pairs. (b) The receiver
operator characteristic (ROC) curve shows the performance of the rank-
ordered list of all E. coli interactions predicted from genomic inference
(solid line) compared with the random selection of protein pairs (dashed
line).
0 5,000 10,000 15,000 20,000 25,000
Number of predicted pairs
Cumulative accuracy
Gene neighbor
TextLinks
All methods
Rosetta stone
Phylogenetic profile
Gene
cluster
0.000
0.005
0.010
0.015
0.020
0.000 0.001 0.002 0.003
Fraction false positive
Fraction true positive
0
0.2
0.4
0.6
0.8
1
(a)
(b)
R35.6 Genome Biology 2004, Volume 5, Issue 5, Article R35 Bowers et al. />Genome Biology 2004, 5:R35
Table 1
Genomes contained in Prolinks
Taxonomy ID Name Lineage
24 Shewanella putrefaciens Bacteria
139 Borrelia burgdorferi Bacteria
158 Treponema denticola Bacteria
160 Treponema pallidum Bacteria
197 Campylobacter jejuni Bacteria
287 Pseudomonas aeruginosa Bacteria
303 Pseudomonas putida Bacteria
358 Agrobacterium tumefaciens Bacteria
382 Sinorhizobium meliloti Bacteria
485 Neisseria gonorrhoeae Bacteria
520 Bordetella pertussis Bacteria
601 Salmonella typhi Bacteria
632 Yersinia pestis Bacteria
666 Vibrio cholerae Bacteria
714 Actinobacillus actinomycetemcomitans Bacteria
747 Pasteurella multocida Bacteria
782 Rickettsia prowazekii Bacteria
837 Porphyromonas gingivalis Bacteria
881 Desulfovibrio vulgaris Bacteria
920 Acidithiobacillus ferrooxidans Bacteria
956 Wolbachia sp. Bacteria
1097 Chlorobium tepidum Bacteria
1148 Synechocystis sp. PCC 6803 Bacteria
1299 Deinococcus radiodurans Bacteria
1309 Streptococcus mutans Bacteria
1313 Streptococcus pneumoniae Bacteria
1314 Streptococcus pyogenes Bacteria
1351 Enterococcus faecalis Bacteria
1352 Enterococcus faecium Bacteria
1360 Lactococcus lactis subsp. lactis Bacteria
1392 Bacillus anthracis Bacteria
1423 Bacillus subtilis Bacteria
1488 Clostridium acetobutylicum Bacteria
1496 Clostridium difficile Bacteria
1717 Corynebacterium diphtheriae Bacteria
1764 Mycobacterium avium Bacteria
1769 Mycobacterium leprae Bacteria
1772 Mycobacterium smegmatis Bacteria
1773 Mycobacterium tuberculosis Bacteria
2097 Mycoplasma genitalium Bacteria
2104 Mycoplasma pneumoniae Bacteria
2107 Mycoplasma pulmonis Bacteria
2130 Ureaplasma urealyticum Bacteria
2190 Methanocaldococcus jannaschii Archaea
2234 Archaeoglobus fulgidus Archaea
2287 Sulfolobus solfataricus Archaea
2303 Thermoplasma acidophilum Archaea
2336 Thermotoga maritima Bacteria
Genome Biology 2004, Volume 5, Issue 5, Article R35 Bowers et al. R35.7
comment reviews reports refereed researchdeposited research interactions information
Genome Biology 2004, 5:R35
during the course of their evolution. Therefore the methods
we have developed to infer coevolution between proteins are
useful for detecting protein pairs that act within the same cel-
lular pathways.
Proteome Navigator
We applied the four genomic inference methods to 83 fully
sequenced microbial genomes and the TextLinks approach to
Escherichia coli. The resulting calculation generates several
hundred thousand predicted protein associations for each
organism. In order to facilitate access to these data, we have
developed an online browser, the Proteome Navigator [23].
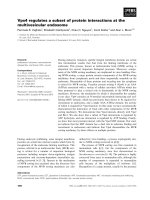
The opening page of the Proteome Navigator prompts the
user to identify a protein using a protein name, sequence
identifier or functional category (Figure 3). Note that if a pro-
tein is selected on the basis of an identifier, it may not be
coded within a fully sequenced genome contained in the data-
base; in which case no Prolinks will be generated for the pro-
tein. To identify a related gene or gene name that is coded
within a fully sequenced genome, one may use BLAST against
the fully sequenced genome at NCBI.
Selecting an individual protein takes the user to a general pro-
tein information page, providing the protein's primary
2371 Xylella fastidiosa Bacteria
3702 Arabidopsis thaliana Eukaryota
4932 Saccharomyces cerevisiae Eukaryota
5476 Candida albicans Eukaryota
6239 Caenorhabditis elegans Eukaryota
7227 Drosophila melanogaster Eukaryota
29292 Pyrococcus abyssi Archaea
35554 Geobacter sulfurreducens Bacteria
50339 Thermoplasma volcanium Archaea
53953 Pyrococcus horikoshii Archaea
56636 Aeropyrum pernix Archaea
61435 Dehalococcoides ethenogenes Bacteria
63363 Aquifex aeolicus Bacteria
64091 Halobacterium sp. NRC-1 Archaea
69394 Caulobacter vibrioides Bacteria
71421 Haemophilus influenzae Rd KW20 Bacteria
83331 Mycobacterium tuberculosis CDC1551 Bacteria
83333 Escherichia coli K12 Bacteria
83334 Escherichia coli O157:H7 Bacteria
83554 Chlamydophila psittaci Bacteria
83560 Chlamydia muridarum Bacteria
85962 Helicobacter pylori 26695 Bacteria
85963 Helicobacter pylori J99 Bacteria
86665 Bacillus halodurans Bacteria
107806 Buchnera aphidicola str. APS Bacteria
115711 Chlamydophila pneumoniae AR39 Bacteria
115713 Chlamydophila pneumoniae CWL029 Bacteria
122586 Neisseria meningitidis MC58 Bacteria
122587 Neisseria meningitidis Z2491 Bacteria
129958 Carboxydothermus hydrogenoformans Bacteria
138677 Chlamydophila pneumoniae J138 Bacteria
145262 Methanothermobacter thermautotrophicus Archaea
155864 Escherichia coli O157:H7 EDL933 Bacteria
158878 Staphylococcus aureus subsp. aureus Mu50 Bacteria
158879 Staphylococcus aureus subsp. aureus N315 Bacteria
Table 1 (Continued)
Genomes contained in Prolinks
R35.8 Genome Biology 2004, Volume 5, Issue 5, Article R35 Bowers et al. />Genome Biology 2004, 5:R35
sequence, known function(s), name and alias. Tabs at the top
of each page allow the user to examine known homologs of the
protein, the profile or distribution of homologous proteins
among the sequenced genomes, protein characteristics and
annotation, and the graph of the network of predicted inter-
actions for the protein.
The graph function of the Proteome Navigator (Figure 4)
allows the user to navigate the network of predicted interac-
tions interactively. The layout of the graph is determined
using a spring minimization algorithm. Each protein is con-
nected by a 'spring' whose spring constant is proportional to
the number of links separating the nodes on the graph.
Because the minimization algorithm is seeded with a random
number, each time the graph is rerun it will generate a differ-
ent layout.
The graph tab also permits the user to vary the scope and
attributes of the resulting network. For instance, the 'graph
order' function can be used to extend the network to include
all proteins that are linked within n interactions of the input
seed protein. Higher graph orders generate networks of
increasing size and complexity. A setting of graph order of 2
prompts the Proteome Navigator to first identify protein links
satisfying a minimum confidence threshold to an original
search protein. This original group of identified proteins is
then used to perform a secondary search using the same cri-
teria. The original protein is displayed in the resulting net-
work as a double-lined box located towards the center of the
graph. An example of such a second-order search and the
resulting network is shown in Figure 4, highlighting the E.
coli flagellar complex.
Additional graphing capabilities are also available, including
coloring of the protein nodes based on known KEGG or COG
pathway annotation and 'clickable' protein nodes. Clicking on
a given protein node within the displayed network prompts
the Proteome Navigator to perform a new search using the
chosen node as the beginning search protein and the same
search parameters as before. This operation allows the user to
navigate easily through the entire microbial network without
manually selecting new protein-search criteria.
Another important feature of the Proteome Navigator allows
one to obtain detailed information on each link. In the Pro-
links tab all of the links associated with the starting protein
are listed. Associated with each link is a 'detail' hyperlink that
generates a separate browser page that describes the underly-
ing source for each link. For instance, in the case of phyloge-
netic profile links, the page reports the organisms that
contain the two proteins of interest, and the probability of
finding the observed number of matches between the two
profiles.
Example results
Chemotaxis
To illustrate the utility of the Proteome Navigator, we show a
network search starting with a known member of the E. coli
flagellar assembly, FliG. Specifying a confidence metric of 0.6
and graph degree setting of 2, we obtain the network shown
in Figure 4, colored by KEGG pathway categories.
In addition to identifying most components of flagellar bio-
synthesis, control and structure (FliS, Flit, FliA, FliL, FliA,
and so on; orange), this procedure also associates subnet-
works of related function. These include the flagellar ATP
synthase complex (AtpA, AtpC, AtpB, AtpG, FliI; red, green,
blue), chemotaxis (CheR, CheB, CheY, CheZ, Tar, Tap; blue),
cell motility (MotA, MotB, CheA, CheW; blue), and osmolar-
ity sensors (OmpR, EnvZ; aqua). Each functional category
sublocalizes within the network, providing an intuitive sum-
mary of the E. coli chemotaxis multiprotein complexes and
their interrelationships.
Previously uncharacterized proteins such as YkfC, shown in
gray in Figure 4, also appear within the network. We see that
YkfC has multiple links to the bacterial chemotaxis machinery
and would therefore predict it to have a function related to
chemotaxis. We note that YkfC has no sequence similarity to
the other chemotactic proteins. Hence this putative func-
tional relationship has been discovered by non-homology
methods.
We also note that the network also contains some false-posi-
tive links. For instance, although OmpR and CheY are linked
The opening page of the Proteome Navigator prompts the user to select a protein by database identifier or protein name or ID, as well as selecting the genome of interestFigure 3
The opening page of the Proteome Navigator prompts the user to select a
protein by database identifier or protein name or ID, as well as selecting
the genome of interest. Pull-down tabs facilitate the selection of protein
features and microbial genomes. Here we select the E. coli gene 'fliG'.
Clicking the 'Search Proteins' button takes the user to a page displaying all
of the proteins that satisfy the search criteria (see Figure 4).
Genome Biology 2004, Volume 5, Issue 5, Article R35 Bowers et al. R35.9
comment reviews reports refereed researchdeposited research interactions information
Genome Biology 2004, 5:R35
by TextLinks, they are not in fact associated. The linkage is
derived from the fact that the two proteins often appear
together in abstracts, despite the fact that they do not physi-
cally associate.
This example illustrates one possible use of predicted net-
works, which is to the assign a function to uncharacterized
genes [24-26]. In the case of E. coli, only two thirds of the
genes have been functionally annotated, according to the
NCBI documentation. This leaves 30% of genes with no func-
tional annotation using any of the standard homology-based
bioinformatics techniques. Using Prolinks, we can assign
putative functions to most of these 1,500 open reading frames
(ORFs).
Lipopolysaccharide biosynthesis example
Another example that demonstrates the pathway reconstruc-
tion and function assignment capabilities of Prolinks involves
the lipolysaccharide biosynthesis pathway. This pathway con-
tains proteins that are involved in the formation from simpler
components of lipopolysaccharides, any of a group of related,
structurally complex components of the outer membrane of
Gram-negative bacteria.
In Figure 4b we show a network seeded with the lipolysaccha-
ride pathway gene kdtA (3-deoxy-D-manno-octulosonic-acid
transferase). This network involves six genes known to be
involved in the pathway. Along with the known genes we also
find other uncharacterized ORFs (gutQ, yrbH and yaeT) that
are also tightly linked to the cluster. We postulate from this
analysis that all three of these genes are likely to be involved
with the lipolysaccharide biosynthesis pathway.
Protein complexes
While the ability of coevolution methods to identify function-
ally related proteins has been well established, it has been less
clear how well they recognize direct protein interactions. We
show here that the methods are very effective in identifying
interactions between subunits of protein complexes. We used
the EcoCyc library of E. coli multiprotein complexes [27] to
assess the ability of the Proteome Navigator to identify direct
protein physical interactions.
Figure 5 illustrates the performance of each of the four meth-
ods in identifying components of multiprotein complexes. In
contrast to COG pathway benchmarking, gene cluster per-
forms best among the methods, identifying 6,000 protein
interactions with greater than 83% accuracy, as judged by the
EcoCyc benchmarking. The phylogenetic profile method
identifies members of known E. coli complexes with an accu-
racy of 30% (greater than the 1% percent accuracy random
selection would provide), but the accuracy appears to be inde-
pendent of the statistical confidence (P-value) of the predic-
tion. On the basis of the totality of these benchmarking
results, the Prolinks database performs well in identifying
subunits of protein complexes.
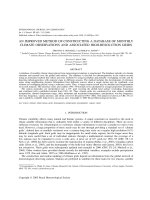
The 'Graphing' function of the Proteome Navigator displays the network of interactions satisfying the input search criterionFigure 4
The 'Graphing' function of the Proteome Navigator displays the network
of interactions satisfying the input search criterion. (a) Nodes are colored
by functional categories explained in the right-hand border. Edges
connecting proteins are colored by the method predicting the interaction,
also described in the figure border. Associations predicted by multiple
methods are shown in black. The double box around fliG indicates that
this was the input protein used to generate this network. Clicking on a
node brings the user to a protein-annotation page, and the search can be
continued using the new protein to generate a new network search. (b)
An example of functional discovery using Prolinks. Using kdtA as the initial
seed, we speculate that GutQ, an uncharacterized E. coli protein, may be
associated with lipopolysaccharide and cell-wall synthesis. Confirmation of
these predictions awaits further scientific inquiry.
(a)
(b)
R35.10 Genome Biology 2004, Volume 5, Issue 5, Article R35 Bowers et al. />Genome Biology 2004, 5:R35
Existing coevolution databases
Two databases previously described as compiling informa-
tion on coevolving proteins are Predictome [5] and String [6].
Although these databases use some of the same methods
described here, they differ from Prolinks in some important
respects.
Predictome, for instance, uses the gene fusion and phyloge-
netic methods to predict interactions between proteins. How-
ever, unlike Prolinks, there appear to be no statistical
measures to gauge the accuracy of each prediction. This is
potentially a significant limitation because, as we show in Fig-
ure 2, the accuracy with which these methods recover known
pathway associations changes dramatically as a function of
the P-value.
Unlike the Predictome database, the String database does
produce a score to estimate the accuracy of each pairwise
association. However, unlike the Prolinks database, which is
based on single proteins in a specific genome, the String data-
base is constructed around COGs [22]. COGs are groups of
orthologous proteins across organisms that have been deter-
mined using sequence-alignment techniques. The use of
COGs rather than individual genes has both benefits and lim-
itations. One of the limitations, as we will see in the example
below, is that the analysis generates a COG network that
includes COGs that may not be present in the organism you
are interested in. Another difference between the two data-
bases is that Prolinks attempts to reconstruct the operon
structure of each organism, while String relies only on the
other three methods.
Comparative benchmarking of databases
To compare Prolinks to the String and Predictome databases
we have downloaded all the functional links for E. coli in each
database. We obtained 407,520 links from String and 22,004
from Predictome in comparison with 515,892 links from
coevolution methods from Prolinks (that is, not including
TextLinks). For the links from String and Predictome, we
could not rank order the linkages as no quality measure is
provided. Therefore, in all cases we compute only averages for
the entire list.
To assess the quality of the lists, we computed the fraction of
links between proteins assigned to COG pathways that are
between proteins in the same pathway. In the case of String
we found that 17% of the annotated links were between pro-
teins in the same pathway. When we took the top 407,000
links between E. coli proteins in Prolinks, we found that 20%
of the links between proteins assigned to a COG pathway were
between proteins in the same pathway.
Similarly, we also calculated the fraction of annotated links
that are between proteins in the same COG pathway for the
Predictome list of 22,004 links. In this case we found that
60% of the links were between intrapathway pairs. We com-
pared this fraction to that obtained from the top 22,000 Pro-
links linkages that gave 68%.
The conclusion from both these analyses is that by these
measures Prolinks predicts more physical and functional
linkages at higher accuracy than those presently contained in
the String and Predictome databases. Because COG pathways
were not used to generate the linkages, this is a rigorous test
of the capability with which linkages associate members of
the same pathway. We also note that Prolinks contains more
than ten times as many linkages as the Predictome database
Assessment of the four methods by recovery of links between members of known E. coli protein complexesFigure 5
Assessment of the four methods by recovery of links between members of
known E. coli protein complexes. (a) We test to see how often predicted
interacting protein pairs are subunits of the same protein complex. E. coli
protein complexes were obtained from the EcoCyc database. (b) Again,
the ROC curve shows the performance of the rank-ordered list of all E.
coli predicted interactions (solid line) compared with the random selection
of protein pairs (dashed line), in their ability to recover constituents of
known protein complexes.
0 5,000 10,000 15,000 20,000 25,000
Number of predicted pairs
Cumulative accuracy
Gene neighbor
Rosetta stone
All methods
Phylogenetic profile
Gene cluster
0
0.2
0.4
0.6
0.8
1
0.000 0.005 0.010 0.015 0.020
Fraction false positive
Fraction true positive
0
0.2
0.4
0.6
0.8
1
(a)
(b)
Genome Biology 2004, Volume 5, Issue 5, Article R35 Bowers et al. R35.11
comment reviews reports refereed researchdeposited research interactions information
Genome Biology 2004, 5:R35
and 25% more than the String database. Also, every link from
Prolinks comes with a quality measure assigned.
We also used the EcoCyc database of known E. coli complexes
to test the frequency with which the three linkage lists
associate subunits of known complexes. In the case of String
we find that 4% of the linkages between proteins that are sub-
units of complexes are between subunits of the same complex.
In contrast, 9% of the top 407,000 Prolinks linkages between
subunits of complexes are intra-complex pairs. We also find
that 30% of the Predictome linkages between subunits of
complexes are intra-complex pairs whereas 32% of the top
22,000 Prolinks linkages are between subunits of the same
complex.
In conclusion, on the basis of a comparison with linkages
from E. coli, we find that: Prolinks offers a greater number of
functional linkages than other databases; each link from Pro-
links is assigned a confidence measure; and that our bench-
marking reported here of Prolinks against COG pathways or
complexes compares favorably to the linkages contained in
String and Predictome.
ATP synthase networks from Prolinks and String
Finally, we provide a side-by-side comparison of the String
and Prolinks databases, and their ability to identify known
and novel protein interactions within the E. coli genome. We
begin by using identical input parameters, which include a 1-
degree depth search, a 0.4 confidence setting, starting from
the protein AtpA. Each graph in Figure 6 identifies seven
additional members of the ATP synthase complex, including
AtpB, AtpC, AtpD, AtpE, AtpF, AtpG and AtpH. The Pro-
teome Navigator also identifies nine protein interactions not
identified by the String database. For instance, FliI, a flagel-
lar-specific component of the ATP synthase machinery, is not
found by in the String search, but is linked to the search pro-
tein AtpA, as well as five other components of the ATP syn-
thase complex, by the Prolinks database. The Proteome
Navigator also predicts functional links to proteins known to
govern E. coli energy metabolism, GidB and GidA, and other
proteins of known chemotaxis- related function.
Perhaps more important, the Proteome Navigator identifies
functional links to proteins of unknown function. In this
instance, YkfC, an uncharacterized reverse transcriptase in E.
coli, is linked to AtpA, FliI and AtpD, each suggesting that this
protein may have a crucial role in the regulation of chemo-
taxis and motility. Small changes in the input parameters
reveal four more uncharacterized proteins, as well as
additional related chemotaxis and osmolarity sensor subnet-
works, that are not found by an equivalent search using
String.
A comparison of graphs generated by querying the String database and Proteome Navigator to identify proteins in the ATP synthase complexFigure 6
A comparison of graphs generated by querying the String database and Proteome Navigator to identify proteins in the ATP synthase complex. COG0056,
shown in red in the String network (left), contains the E. coli protein AtpA, used to search each database and shown highlighted as a double-lined box in
the Proteome Navigator graph (right). The Proteome Navigator network and Prolinks database identify twice the number of functionally linked proteins at
the given confidence level.
R35.12 Genome Biology 2004, Volume 5, Issue 5, Article R35 Bowers et al. />Genome Biology 2004, 5:R35
A final and substantial difference between the respective
databases is their ability to generate genome-specific graphs.
Because the String database uses a COG-based approach to
phylogenetic analysis and visual output, the information pre-
sented often contains linkages to COGs that are not present in
the starting organism. For instance, a starting search using
the E. coli gene fliG and a confidence limit of 0.4 identifies the
protein as belonging to COG1536. The linkage analysis by
String links COG1536 to COG1315, a predicted polymerase
family not present within E. coli yet included within the
resulting network. Graphs and linkages produced by the Pro-
teome Navigator are always specific to the input organism
and protein, producing graphs that contain nodes colored and
clustered by known functional annotation, making their
interpretation intuitive and ideal for discovery.
In conclusion, Prolinks complements existing databases and
provides additional features and capabilities that are not
found in Predictome and String. As such, we believe that Pro-
links represents a useful addition to the suite of tools that are
available to biologists to study protein functional linkages.
Discussion
Over the past few years significant progress has been made to
measure protein interactions and protein complexes in cells
using experimental approaches. Although the data have
proved valuable to biologists, they are still limited in their
coverage of organisms whose genomes have been fully
sequenced. The majority of protein interactions have been
measured within a single organism, Saccharomyces
cerevisiae [28]. Although there is some value in extrapolating
interactions from one organism to another using homology,
several lines of evidence indicate that such an approach may
be error-prone [29,30]. Furthermore, the underlying interac-
tion data in a single organism has been shown to contain a
large percentage of false positives [30].
To complement the directly measured data on protein inter-
action we have presented a comprehensive database of pro-
tein interactions inferred from 83 fully sequenced organisms
by coevolutionary methods. We have shown that the compu-
tational methodology that we utilize to identify inferred inter-
actions is able to link proteins that function within the same
biochemical pathway as well as subunits of protein
complexes.
The potential uses of these inferred functional linkages are
several. By combining pairs of inferred linkages within a
genome, one can build up networks of functional links. These
give information on both protein complexes and metabolic
pathways that can be compared with more directly measured
information. The networks place proteins in their functional
contexts in the cell, and can thus be used to gain an expanded
view of the multiple functions of proteins within cells. This
expanded view is readily accessible in the Prolinks database,
and conveniently explored with the Proteome Navigator.
References
1. Eisenberg D, Marcotte EM, Xenarios I, Yeates TO: Protein function
in the post-genomic era. Nature 2000, 405:823-826.
2. Marcotte EM: Computational genetics: finding protein
function by nonhomology methods. Curr Opin Struct Biol 2000,
10:359-365.
3. Pellegrini M: Computational methods for protein functional
analysis. Curr Opin Chem Biol 2001, 5:46-50.
4. Jenssen TK, Laegreid A, Komorowski J, Hovig E: A literature net-
work of human genes for high-throughput analysis of gene
expression. Nat Genet 2001, 28:21-28.
5. Mellor JC, Yanai I, Clodfelter KH, Mintseris J, DeLisi C: Predictome:
a database of putative functional links between proteins.
Nucleic Acids Res 2002, 30:306-309.
6. von Mering C, Huynen M, Jaeggi D, Schmidt S, Bork P, Snel B: String:
a database of predicted functional associations between
proteins. Nucleic Acids Res 2003, 31:258-261.
7. Pellegrini M, Marcotte EM, Thompson MJ, Eisenberg D, Yeates TO:
Assigning protein functions by comparative genome analy-
sis: protein phylogenetic profiles. Proc Natl Acad Sci USA 1999,
96:4285-4288.
8. Huynen MA, Bork P: Measuring genome evolution. Proc Natl Acad
Sci USA 1998, 95:5849-5856.
9. Altschul SF, Madden TL, Schaffer AA, Zhang J, Zhang Z, Miller W, Lip-
man DJ: Gapped BLAST and PSI-BLAST: a new generation of
protein database search programs. Nucleic Acid Res 1997,
25:3389-3402.
10. Wu J, Kasif S, DeLisi C: Identification of functional links
between genes using phylogenetic profiles. Bioinformatics 2003,
19:1524-1530.
11. Ermolaeva MD, White O, Salzberg SL: Prediction of operons in
microbial genomes. Nucleic Acids Res 2001, 29:1216-1221.
12. Moreno-Hagelsieb G, Collado-Vides J: A powerful non-homology
method for the prediction of operons in prokaryotes. Bioinfor-
matics 2002, 18(Suppl 1):S329-S336.
13. Strong M, Mallick P, Pellegrini M, Thompson MJ, Eisenberg D: Infer-
ence of protein function and protein linkages in Mycobacte-
rium tuberculosis based on prokaryotic genome organization:
a combined computational approach. Genome Biol 2003, 4:R59.
14. Overbeek R, Fonstein M, D'Souza M, Pusch GD, Maltsev N: Use of
contiguity on the chromosome to predict functional
coupling. In Silico Biol 1999, 1:93-108.
15. Overbeek R, Fonstein M, D'Souza M, Pusch GD, Maltsev N: The use
of gene clusters to infer functional coupling. Proc Natl Acad Sci
USA 1999, 96:2896-2901.
16. Dandekar T, Snel B, Huygen M, Bork P: Conservation of gene
order: a fingerprint of proteins that physically interact. Trends
Biochem Sci 1998, 23:324-328.
17. Marcotte EM, Pellegrini M, Ng HL, Rice DW, Yeates TO, Eisenberg
D: Detecting protein function and protein-protein interac-
tions from genome sequences. Science 1999, 285:751-753.
18. Enright AJ, Ilioupolos I, Kyrpides NC, Ouzounis CA: Protein inter-
action maps for complete genomes based on gene fusion
events. Nature 1999, 402:86-90.
19. Marcotte CJV, Marcotte EM: Predicting functional linkages from
gene fusions with confidence. Appl Bioinformatics 2002, 1:93-100.
20. NCBI PubMed Database [ />21. NCBI Genbank Protein Annotation [ />bank/genomes]
22. Tatusov RL, Koonin EV, Lipman DJ: A genomic perspective on
protein families. Science 1997, 278:631-637.
23. The Proteome Navigator and Prolinks Database [http://
169.232.137.207/cgi-dev/functionator/pronav]
24. Marcotte EM, Pellegrini M, Thompson MJ, Yeates TO, Eisenberg D: A
combined algorithm for genome-wide prediction of protein
function. Nature 1999, 402:83-86.
25. Huynen M, Snel B, Lathe W, Bork P: Predicting protein function
by genomic context: quantitative evaluation and qualitative
inferences. Genome Res 2000, 10:1204-1210.
26. Pellegrini M, Thompson M, Fierro J, Bowers PM: Computational
method to assign microbial genes to pathways. J Cell Biochem
Suppl 2001, Suppl 37:106-109.
Genome Biology 2004, Volume 5, Issue 5, Article R35 Bowers et al. R35.13
comment reviews reports refereed researchdeposited research interactions information
Genome Biology 2004, 5:R35
27. Karp PD, Riley M, Saier M, Paulsen IT, Collado-Vides J, Paley SM, Pel-
legrini-Toole A, Bonavides C, Gama-Castro S: The EcoCyc
Database. Nucleic Acids Res 2002, 30:56-58.
28. Xenarios I, Salwinski L, Duan XJ, Higney P, Kim SM, Eisenberg D: DIP,
the Database of Interacting Proteins: a research tool for
studying cellular networks of protein interactions. Nucleic
Acids Res 2002, 30:303-305.
29. Matthews LR, Vaglio P, Reboul J, Ge H, Davis BP, Garrels J, Vincent S,
Vidal M: Identification of potential interaction networks using
sequence-based searches for conserved protein-protein
interactions or "interologs". Genome Res 2001, 11:2120-2126.
30. Deane CM, Salwinski L, Xenarios I, Eisenberg D: Protein interac-
tions: two methods for assessment of the reliability of high-
throughput observations. Mol Cell Proteomics 2002, 1:349-356.