Báo cáo y học: " A global survey identifies novel upstream components of the Ath5 neurogenic network" pdf
Bạn đang xem bản rút gọn của tài liệu. Xem và tải ngay bản đầy đủ của tài liệu tại đây (5.67 MB, 16 trang )
Genome Biology 2009, 10:R92
Open Access
2009Sourenet al.Volume 10, Issue 9, Article R92
Research
A global survey identifies novel upstream components of the Ath5
neurogenic network
Marcel Souren
¤
*
, Juan Ramon Martinez-Morales
¤
*†
, Panagiota Makri
*
,
Beate Wittbrodt
*
and Joachim Wittbrodt
*
Addresses:
*
Developmental Biology Unit, EMBL-Heidelberg, Meyerhofstrasse, Heidelberg, 69117, Germany.
†
Centro Andaluz de Biología del
Desarrollo (CABD), CSIC-Universidad Pablo de Olavide, Carretera de Utrera Km1, Sevilla, 41013, Spain.
¤ These authors contributed equally to this work.
Correspondence: Juan Ramon Martinez-Morales. Email: Joachim Wittbrodt. Email: jochen.wittbrodt@embl-
heidelberg.de
© 2009 Souren et al.; licensee BioMed Central Ltd.
This is an open access article distributed under the terms of the Creative Commons Attribution License ( which
permits unrestricted use, distribution, and reproduction in any medium, provided the original work is properly cited.
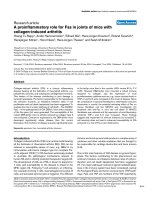
Retinal neurogenesis regulatory network<p>Regulators of vertebrate Ath5 expression were identified by high-throughput screening; extending the current gene regulatory model network controlling retinal neurogenesis.</p>
Abstract
Background: Investigating the architecture of gene regulatory networks (GRNs) is essential to
decipher the logic of developmental programs during embryogenesis. In this study we present an
upstream survey approach, termed trans-regulation screen, to comprehensively identify the
regulatory input converging on endogenous regulatory sequences.
Results: Our dual luciferase-based screen queries transcriptome-scale collections of cDNAs.
Using this approach we study the regulation of Ath5, the central node in the GRN controlling retinal
ganglion cell (RGC) specification in vertebrates. The Ath5 promoter integrates the input of
upstream regulators to enable the transient activation of the gene, which is an essential step for
RGC differentiation. We efficiently identified potential Ath5 regulators that were further filtered
for true positives by an in situ hybridization screen. Their regulatory activity was validated in vivo by
functional assays in medakafish embryos.
Conclusions: Our analysis establishes functional groups of genes controlling different regulatory
phases, including the onset of Ath5 expression at cell-cycle exit and its down-regulation prior to
terminal RGC differentiation. These results extent the current model of the GRN controlling
retinal neurogenesis in vertebrates.
Background
Gene regulatory networks (GRNs) determine the animal body
plan and cooperate to specify the different cell types of the
organism. They have evolved to integrate and precisely con-
trol developmental programs. While changes in the periphery
of the networks may lead to subtle changes in body plan mor-
phology, the GRN core architecture around central nodes
remains more conserved [1].
In the vertebrate retina, the control of retinal progenitor cell
(RPC) fate-choice and differentiation depends on the syn-
chronization of intrinsic genetic programs and extrinsic sig-
Published: 7 September 2009
Genome Biology 2009, 10:R92 (doi:10.1186/gb-2009-10-9-r92)
Received: 14 April 2009
Revised: 29 July 2009
Accepted: 7 September 2009
The electronic version of this article is the complete one and can be
found online at /> Genome Biology 2009, Volume 10, Issue 9, Article R92 Souren et al. R92.2
Genome Biology 2009, 10:R92
nals. A hierarchical GRN controls the sequential generation
of the different retinal cell types during embryogenesis [2].
There is increasing evidence that timing of cell cycle exit and
cell-fate choice are closely linked, as cells forced to exit the
cell cycle prematurely were more likely to adopt an early cell
fate and vice versa [3-6]. The position of RPC nuclei within
the developing neuroretina depends on the phase of the cell
cycle. S-phase takes places at the basal side of the epithelium,
while M-phase nuclei are located at the apical side [7-9].
In all vertebrate species analyzed, retinal ganglion cells
(RGCs) are the first to be generated within an otherwise
undifferentiated epithelium. The basic helix-loop-helix
(bHLH) transcription factor Ath5 is the central switch in the
GRN governing RGC neurogenesis. Loss of Ath5 in mouse
and zebrafish leads to a complete absence of RGCs and an
increase of later born cell types, such as amacrine cells and
cone photoreceptors [10-12]. Gain-of-function experiments
in chicken and frog showed that Ath5 promotes RGC forma-
tion at the expense of other cell types [13,14]. The onset of
Ath5 expression in newborn RGCs coincides with the exit
from the cell cycle [15,16]. RGCs are specified in a neurogenic
wave that spreads across the retina similar to the morphoge-
netic furrow that moves through the eye imaginal disc in Dro-
sophila [17]. RGCs first appear ventro-nasally close to the
optic stalk in zebrafish [18,19]. Subsequently, a wave of differ-
entiating cells spreads to the periphery of the eye [20-22]. In
medaka, newborn RGCs first appear in the center of the retina
at the initiation stage (IS). During the progression stage (PS),
neuronal differentiation proceeds towards the peripheral ret-
ina. The final stage is a 'steady wave stage' (SWS) in which
newborn RGCs are found exclusively in a ring in the periph-
eral ciliary marginal zone. At this stage retinal progenitor
cells derived from the ciliary marginal zone undergo neuro-
genesis and contribute to the layered structure of the central
retina (Figure 1a).
The initiation of Ath5 expression and RGC differentiation
depends on extra-cellular signals emanating from the optic
stalk [19]. Extra-cellular signals involved in RGC formation
include members of the Wnt and fibroblast growth factor
(FGF) signaling cascade [23,24]. Soluble molecules produced
by RGCs themselves, such as Fgf19 and Sonic hedgehog
(Shh), have been implicated in the spread of the wave [25,26].
However, the Ath5 promoter is activated in a wave-like man-
ner even in the absence of RGCs in the zebrafish Ath5 mutant
lakritz. Mutant cells initiate Ath5 expression according to
their initial position when transplanted to a different spot in
the retina [27]. These data support a cell-intrinsic mechanism
triggering Ath5 expression. A small number of transcription
factors have been shown to directly regulate Ath5 expression
in vivo (Figure 1b). The bHLH factor Hes1, activated down-
stream of the Notch pathway, has been shown to repress the
formation of RGCs and other cell types in mouse, such as rod
photoreceptors and horizontal and amacrine cells prior to the
onset of neurogenesis [28,29]. In chicken, Hes1 was shown to
repress Ath5 in proliferating RPCs [30]. After the onset of
Ath5 expression at the last mitosis, Ath5 protein binds to and
activates its own promoter [31,32]. Additionally, it also
receives positive regulatory input from Ngn2, NeuroM and
Pax6 [33-36]. The terminal differentiation of RGCs is accom-
panied by a downregulation of Ath5, which is no longer
expressed in mature neurons [30].
The Ath5 promoter integrates important upstream input to
initiate RGC specification [2]. However, little is known about
the transcriptional regulators governing the onset of Ath5
expression at the transition from proliferating progenitors to
early post-mitotic cells and its downregulation prior to termi-
nal differentiation. It is, for example, unclear how general cell
cycle regulators may impinge upon the GRN controlling RGC
specification.
The analysis of upstream gene regulation for key develop-
mental genes has mainly focused on the dissection of the cis-
regulatory logic using approaches such as promoter bashing
or computational predictions. The systematic identification
of trans-acting genes regulating a defined promoter has so far
relied on binding assays such as yeast-one-hybrid assays [37].
Yeast-one-hybrid assays have been used to identify protein-
DNA interactions based on the activity of a DNA-binding pro-
tein fused to an activating or repressing domain. Recently, the
use of bacterial hybrid-screening technology and oligo arrays
have overcome some of the limitations of the extensive clon-
ing required [38,39], but these methods still depend on the
generation of fusion proteins and only allow testing of a lim-
ited number of protein-DNA interactions. Initial attempts
have been made to overcome these limitations by the use of
luciferase-reporter based assays that employ synthetic
reporter constructs [40].
Here, we present an upstream regulation survey, termed
trans-regulation screen (TRS), using two nested screens to
identify novel regulatory input on the Ath5 promoter (Figure
1c). The dual luciferase-based screening strategy allows sur-
veying transcriptome-scale collections of full-length native
cDNAs. They are tested for their activating or repressing
properties on an endogenous promoter in vertebrate cells.
The candidates were further filtered in a semi-automated in
situ hybridization screen. Through this approach we have
identified novel regulators of Ath5, and gained insight into
the control of the retinal neurogenic network. Here we show
the power of TRS technology as an upstream approach to sur-
vey developmental regulatory networks.
Results
The trans-regulation screen identifies candidate
regulators of Ath5
To gain insight into the molecular mechanisms controlling
the dynamic expression of Ath5, we explored the regulatory
logic of a medakafish 3-kb promoter fragment that fully reca-
Genome Biology 2009, Volume 10, Issue 9, Article R92 Souren et al. R92.3
Genome Biology 2009, 10:R92
pitulates the endogenous Ath5 expression pattern in vivo
[31]. Using this promoter, we tested the ability of individual
cDNAs to either activate or repress a luciferase reporter con-
struct upon co-expression in BHK21 cells.
We employed a sequenced and arrayed medaka cDNA expres-
sion library, comprising unigene full-length clones in pCMV-
Sport6, to individually test 8,448 genes. Our high-throughput
trans-regulation screen allows efficient and reliable normali-
zation using a second control reporter. We co-transfected
each cDNA with the Ath5 firefly luciferase reporter
(Ath5::luc2) and a cytomegalovirus (CMV)-driven Renilla
luciferase control vector (pRL-CMV) in triplicate in a 96-well
format. Luminescence levels of reporter and control were
recorded after 48 h (Figure 1c). As a control we tested in par-
allel the known regulators of Ath5 - Hes-1, Pax6 and Ath5
itself - under screening conditions. We confirmed that Hes1
has a strong repressive activity on the 3-kb promoter frag-
ment, while Pax6 and Ath5 can activate the promoter in a
dose-dependent manner (Figure S1 in Additional data file 1)
as previously reported [34-36].
The inclusion of the CMV-driven Renilla luciferase control
[41] in the screen reduced the average standard deviation
Screen overviewFigure 1
Screen overview. (a) Neurogenic wave in medaka. Single confocal sections through eye stained for Ath5 mRNA at the level of the lens. The sections show
the neurogenic wave during its initiation, progression and steady wave stage. (b) Current model of Ath5 regulation. Three stages of Ath5 regulation have
been identified: initial repression in proliferating RPCs; activation and maintenance in the proneural state around the exit of cell cycle by Fgf8, NeuroD,
Pax6, and Ath5 itself; and finally terminal downregulation in differentiating RGCs. (c) Schematic overview of transregulation screen. We individually
cotransfected 8,448 Oryzias latipes cDNAs with pGL3 Ath5::Luc and a cytomegalovirus (CMV)-driven Renilla luciferase control vector (pRL-CMV) into
BHK21 cells in 96-well plates. Each transfection was carried out in triplicate. Identified candidates were filtered using semi-automated in situ hybridization.
FGF, fibroblast growth factor; Shh, Sonic hedgehog.
Genome Biology 2009, Volume 10, Issue 9, Article R92 Souren et al. R92.4
Genome Biology 2009, 10:R92
from 35.5 ± 80.2% to 17.3 ± 19.3% and was essential to correct
for unspecific variation such as initial cell number, cell prolif-
eration rate and transfection efficiency. As quality thresholds,
we discarded those clones for which Renilla luminescence
values were below 8,000 relative luminescence units, reflect-
ing low cell numbers and/or general toxicity of the trans-
fected construct. In addition, clones yielding firefly
luminescence values smaller than ten times the background
signal (ten raw units) were discarded. All raw luminescence
readings were stored in a FileMaker database. Median values
were calculated and normalized and statistics were generated
using Prism software (supplementary material and methods
in Additional data file 1). For 87.7% of the clones all three
assays were successful, reflecting the robustness and the reli-
ability of the screening setup (Figure 2a). To remove the
plate-to-plate variation, we normalized each ratio (firefly over
Renilla) against the average of all ratios in the plate. This
approach has been previously employed [42] and was used as
all plates are likely to only contain a very small number of reg-
ulators. Figure 2b represents the normalized ratios for all
clones in a frequency distribution histogram in log-space.
As only a small number of cDNAs are likely to have an effect
on the Ath5 promoter, the variation of luminescence ratios
around the average can be regarded as random for almost all
cDNAs while values outside a normal distribution curve are
unlikely to be random variations. We therefore could fit a
Gaussian normal distribution to the data (Figure 2b) and
selected candidate genes based on mathematical criteria.
Thus, clones with a normalized ratio of less than 0.2859 or
more than 2.8732 were selected as candidates. In addition,
only candidates with a standard deviation within the average
standard deviation of all clones (15.7 ± 19.1%) were chosen.
Ninety-three full-length cDNAs fulfill these criteria and can
be mapped onto genes in the Ensembl gene build (Table S1 in
Additional data file 1). They make up 1.1% of the total number
of clones screened. Of these cDNAs, 28 are in vitro repres-
sors, and 65 are in vitro activators. We analyzed the Gene
Ontology terms associated with the candidates using the
DAVID webtools (Figure 2c). Of all candidates with a GO
annotation, 45.7% are localized in the nucleus and 44.3% are
nucleic acid binding factors. The screening technology there-
fore gives a concise list of candidates that is enriched for
nuclear factors involved in gene regulation.
Screening statistics and candidate selectionFigure 2
Screening statistics and candidate selection. (a) Screening statistics. The table lists the number of successful replicates per clone. (b) Selection of clones
with non-random luminescence variation. All luminescence ratios were transformed into log-space for visualization. Luminescence ratios with a negative
log value indicate a repressive effect, and positive log values an activating effect. The dotted line represents a Gaussian normal distribution fitted to the
dataset. The left vertical line labels the threshold for repressors (less than 10
-0.544
= 0.2859), and the right vertical line labels the threshold for activators
(more than 10
0.458
= 2.8732) (c) Gene Ontology analysis of candidate regulators. Candidates were analyzed for cellular localization and molecular function
independently. The most abundant, non-redundant categories with a significant enrichment in the dataset compared to the genome are depicted.
Genome Biology 2009, Volume 10, Issue 9, Article R92 Souren et al. R92.5
Genome Biology 2009, 10:R92
Nested in situ hybridization analysis refines the dataset
to 53 high-confidence candidates
To assess whether the candidates can act as regulators in
vivo, we determined their expression patterns. Using an in
situ hybridization robot, we examined three different stages
of development that coincide with the different phases of the
Ath5 wave: initiation (IS, stage 24), progression (PS, stage 27)
and steady wave stage (SWS, stage 31). All images of expres-
sion patterns have been submitted to the Medaka Expression
Pattern Database [43] (Figure S2 in Additional data file 1).
For 17 clones no expression was found at the tested stages and
23 genes were expressed in different domains of the embryo.
Consistent with a function in Ath5 regulation, 10 genes were
expressed ubiquitously at all time, while 43 genes were
expressed specifically in the eye at one or more time points.
These specifically and dynamically expressed genes were ana-
lyzed by double fluorescence whole-mount in situ hybridiza-
tion, using Ath5 as reference probe in parallel, to determine
the exact relative expression patterns of Ath5 and the candi-
date regulators. According to their spatio-temporal expres-
sion, they were grouped into four categories (Table 1). Group
1 consists of 9 candidate repressors expressed in RPCs and
early RGCs, group 2 of 25 candidate activators expressed in
these cells. Group 3 contains three candidate activators
expressed in late differentiating RGCs and group 4 contains
six candidate repressors expressed in late differentiating
RGCs.
The expression of group 1 genes (repressors) becomes
restricted to the retinal periphery as the neurogenic wave pro-
ceeds. Genes of this group overlap with Ath5 only in the early
post-mitotic RGCs located apically in the differentiating epi-
thelium (arrowheads in Figure 3c, f). They include replication
complex factors MCM2 and 3 (Figure 3a-c; Figure S3a, b in
Additional data file 1), the importin-family members KPNA4
and 2 (Figure 3d-f; Figure S3c in Additional data file 1), the
regulator complex protein Cnot10 and a sterol demethylase
(Figure S3d-f in Additional data file 1). Representative exam-
ples of group 2 (activators) are Retinoblastoma (Rb), secreted
frizzled related protein (sFRP)1 and SRP40 (Figures 3g-k and
4a-c). Rb overlaps with Ath5 in apically located early RGCs
(arrowheads in Figure 3h, i) exiting the cell cycle at all stages
of the wave. sFRP1 is expressed at IS and PS, but ceases to be
expressed at SWS (Figure 3j, k). SRP40, a splicing factor-like
protein without known function, is found in RPCs and early
RGCs at SWS (Figure 4a, b).
Group 3 genes (late activators) include Islet-2 (Figure 3m, n)
and Ndrg3 (Figure 4c, d). Finally, group 4 (late repressors)
includes Idax, a negative regulator of the Wnt-pathway (Fig-
ure 3p, q), the nucleotide-binding protein RBPMS2 (Figure
4e, f), the zinc-finger containing protein Zfp-161 (Figure 4g,
h), ELG-protein (Figure 4i, j) and the novel NHL-domain
containing protein (Figure 4k, l). Group 3 as well as group 4
genes are co-expressed with Ath5 only in a few terminally
migrating RGCs located basally (arrowheads in Figures 3r
and 4f, h, j, l) and maintain their expression in already local-
ized RGCs.
These four categories define distinct regulatory activities at
two critical points of Ath5 regulation, the onset of Ath5
expression in RPCs exiting the cell cycle and the sharp termi-
nal downregulation in late migrating RGCs.
Candidates that act dose-dependently are potential
direct regulators of Ath5
We further characterized the activity of individual in situ val-
idated candidates by assessing the dose-dependence of their
regulatory effect. We employed our high-throughput pipeline
to perform experiments for each candidate across a wide
range of concentrations. Parallel experiments using CMV-
and SV40-driven reporters were performed independently as
a control to exclude regulatory effects on the reference pro-
moters. We obtained data for 45 genes expressed in the eye.
Of these, 19 exhibited a clear correlation between the amount
of regulator and signal strength (for the complete dataset see
supplementary Table S2 in Additional data file 1). These lin-
ear dose-response relations suggest a direct regulatory activ-
ity, while non-linear relations point at a more indirect mode
of activity. Consistent with a more direct regulation on Ath5,
71% of the genes annotated as nucleic acid binding showed a
linear dose-response in these assays (Table S2 in Additional
data file 1).
To test the direct binding of some of the regulators to the pro-
moter, namely the bona fide transcription factors Islet1 and
p65, we screened the Ath5 3-kb fragment for predicted tran-
scription factor binding sites (TFBSs) using TRANSFAC [44].
Those TFBSs located within conserved boxes proximal to the
Ath5 transcription start site were cloned upstream of a luci-
ferase reporter (Figure S4a in Additional data file 1). Frag-
ments (29 bp including the TFBSs) were then assayed for
their ability to mediate either Islet-1 or p65-induced tran-
scription in a dose-response manner. Our in vitro analysis
showed that selected TFBSs are functional by themselves
(Figure S4b in Additional data file 1), thus suggesting that
some of the identified regulators have a direct input on the
Ath5 promoter.
The list of genes with a linear dose-response curve also con-
tains enzymes, such as GPI deacetylase or thiolase, and sign-
aling components, such as Idax and sFRP1, whose functions
suggest a more upstream entry into the Ath5 regulatory path-
way. In addition, several genes with unknown function
showed dose-dependent behavior in our assays. To test
whether the linear dose-response of these candidates with
unknown function correlates with nuclear localization, we
generated carboxy-terminal green fluorescent protein (GFP)-
tagged proteins and analyzed their subcellular localization.
Fusion constructs were co-transfected into BHK21 cells
together with a red fluorescent protein membrane marker as
Genome Biology 2009, Volume 10, Issue 9, Article R92 Souren et al. R92.6
Genome Biology 2009, 10:R92
Table 1
List of candidates
Name Fold-change ID
Group 1: repressors in RPCs
AATF 0.21 ± 0.02 Rb-binding protein Che-1
ARG1 0.27 ± 0.02 Liver-type arginase
ATP-synthase 0.28 ± 0.04 ATP synthase beta chain
Cnot10 0.15 ± 0.01 CCR4-NOT transcription complex, subunit 10
DuS4L 0.28 ± 0.01 tRNA-dihydrouridine synthase 4-like
KPNA4 0.25 ± 0.04 Importin alpha-4 subunit
MCM2 0.27 ± 0.00 DNA replication licensing factor 2
USP25 0.28 ± 0.05 Ubiquitin carboxyl-terminal hydrolase 25
WDR43 0.29 ± 0.04 WD repeat protein 43, unknown function
Group 2: activators in RPCs
Bcat2 2.93 ± 0.27 Mitochondrial branched chain aminotransferase 2
Cbx7 2.96 ± 0.14 Polycomb group gene
CEB55 4.70 ± 0.39 Centrosomal protein of 55 kDa
GPI deacetylase 15.00 ± 0.81 Vesicular transport
PTPN2 3.65 ± 0.59 Tyrosine-protein phosphatase non-receptor
Rb1 3.50 ± 0.46 Cell cycle exit, transcription factor
SRP40 2.88 ± 0.10 Splicing factor
Sterol demethylase 3.33 ± 0.33 Sterols and steroids biosynthesis, oocyte maturation
Thiolase 4.98 ± 0.32 Trifunctional enzyme, acetyl-CoA transferase
TMEM79 3.01 ± 0.30 Transmembrane protein, function unclear
TMP49 3.92 ± 0.42 Transmembrane protein, function unknown
Transferase 3.39 ± 0.58 Arginine n-methyl-transferase
Bub3 4.85 ± 0.00 Mitotic checkpoint protein
FAN 3.28 ± 0.28 Associated with N-SMase activation
Hsp1 11.02 ± 1.36 Heat shock protein 1
KPNA2 3.65 ± 0.36 Importin alpha-2 subunit,
MCM3 3.00 ± 0.00 DNA replication licensing factor 3
MRPL47 3.33 ± 0.00 Mitochondrial ribosomal protein L47 isoform b
NHL-domain II 3.36 ± 0.59 NHL-domain containing, unknown function
Ribonuclease 4.15 ± 0.09 Ribonuclease HI large subunit
sFRP-1 2.97 ± 0.55 Wnt-signal regulator
TARBP2 3.05 ± 0.18 TAR RNA-binding protein 2
Tetraspanin-9 3.29 ± 0.00 Transmembrane protein, interacts with integrins
USP1 3.25 ± 0.34 Ubiquitin carboxyl-terminal hydrolase 1
Group 3: activators in RGCs
Ndrg3a 3.73 ± 0.00 N-myc downstream regulated 3, function unknown
Islet2 5.11 ± 0.22 Insulin gene enhancer, transcription factor
Tetraspanin-31 3.00 ± 0.38 Transmembrane protein, unknown function
Group 4: repressors in RGCs
ELG protein 0.27 ± 0.00 mRNP complex, unknown function
Idax 0.16 ± 0.01 Negative regulation of Wnt signaling
NHL-protein 0.27 ± 0.00 NHL-domain containing, unknown function
RBM4L 0.23 ± 0.01 RRM-class RNA-binding protein
RBPMS2 0.20 ± 0.06 RNA-binding protein RNP-1, unknown function
Zfp 161 0.23 ± 0.01 Zinc finger, function unclear
Genome Biology 2009, Volume 10, Issue 9, Article R92 Souren et al. R92.7
Genome Biology 2009, 10:R92
a reference. The splicing factor SRP40 was used as a control
for nuclear localization (Figure 4c). Our analysis showed that
the zinc finger protein 161 and the ELG-protein are exclu-
sively localized in the nucleus (Figure 4p, q). The RNA-bind-
ing protein RBPMS2 and Ndrg3 are localized in both the
nucleus and cytoplasm (Figure 4n, o), suggesting that they
can shuttle between these cellular compartments. In fact,
nuclear localization of Ndrg3 has been recently reported in
the mouse central nervous system [45]. The NHL-domain
protein is excluded from the nucleus and accumulates in a
perinuclear compartment, which resembles the Golgi appara-
tus (Figure 4r). In conclusion, the nuclear localization of four
out of five uncharacterized proteins analyzed suggests that
they act as direct regulators of Ath5.
Clonal analysis of individual regulators in transgenic
medaka embryos in vivo validates their role in RGC
differentiation
We complemented the characterization of candidate regula-
tors by testing in vivo the activity of members of each of the
four expression-activity categories in medaka embryos. To
examine RGC differentiation, we followed the dynamic regu-
lation of the Ath5 promoter using a transgenic line expressing
degradable GFP under the control of the Ath5 promoter
(Ath5::d1GFP). Candidates were expressed in the developing
neural retina in a mosaic fashion by DNA microinjection of
the candidate genes under the control of the retina-specific
medaka Rx2 promoter. Clones expressing the candidate
genes were traced by co-injection of Rx2::H2A-mCherry
[46]. In this mosaic situation we quantified the proportion of
candidate expressing cells (red) that regulated the expression
of the Ath5 reporter (green), making the analysis independ-
ent of the total number of Ath5 positive cells. We thus deter-
mined the in vivo activity of the different candidates in the
generation of Ath5 positive cells and, hence, in RGC neuro-
genesis. As a baseline control, the Rx2::nuclearCherry con-
struct was injected alone (Figure 5a). In this assay the known
regulators Ath5 and Hes-1 resulted in robust activation and
repression of the reporter (Figure 5b, c). In agreement with
the reported key role of Ath5 in RGC neurogenesis, its clonal
expression was sufficient by itself to induce ectopic differen-
tiation foci in the peripheral retina (Figure 5c).
Consistent with their behavior in our transactivation screen,
sFRP1, Rb1 and Ndrg3a act as activators of Ath5 in vivo (Fig-
ure 5d, f). Interestingly, although the over-expression of these
activators enhanced Ath5 expression, ectopic differentiation
foci were never observed, suggesting that alone they do not
act as instructive factors for RGC differentiation. Likewise,
the candidate repressors KPNA4, MCM2, Idax, RBPMS2,
ELG and Zfp161 (Figure 5e, f) down-regulated Ath5 in vivo
and inhibited neurogenesis. Three of the candidates tested,
NHL-protein, Cbx7 and Islet-2, did not significantly alter
reporter expression, although they exhibited a clear effect in
the screen and the dose-response analysis (Figure 5f). Taken
together, 75% of the candidates tested clearly regulate Ath5
expression in vivo and activate or repress Ath5 as predicted
from the in vitro assays.
Here, we present a comprehensive TRS with a detailed analy-
sis of candidate expression patterns relative to Ath5 during
the neurogenic wave. We analyze the subcellular localization
of previously uncharacterized candidates and show that iden-
tified proteins regulate RGC neurogenesis in vivo in the
medaka retina. Our data highlight the power of the technol-
ogy to obtain an enriched set of true-positive regulators from
an unbiased collection of full-length cDNAs.
Discussion
The identification of the components of GRNs is essential to
understand how specific developmental programs are exe-
cuted during embryogenesis [47]. An increasing number of
regulatory interactions have been already identified through
Ubiquitously expressed regulators
HMG 2.93 ± 0.49 HMG box DNA-binding domain
p65 TF 6.16 ± 0.81 NF-κB transcription factor p65
Beta-actin 0.27 ± 0.03 Cytoskeleton
Tubulin alpha-1B chain 3.28 ± 0.59 Cytoskeleton
UBR2 3.18 ± .0.36 Ubiquitin-protein ligase E3 component N-recognin-2
Uncharacterized1 0.22 ± 0.01 Unknown function
Coiled-coil domain 3.25 ± 0.43 Unknown function
EF-1-alpha 3.31 ± 0.26 Elongation factor
Nfkbia 2.99 ± 0.44 NF-kappaB inhibitor
Ankrd39 5.40 ± 0.71 Ankyrin repeat domain-containing protein 39, unknown function
Candidate clones were selected based on their relative effect on the reporter construct. Out of this list, clones with a specific spatio-termporal
expression in the eye were grouped into four categories (groups 1 to 4). An additional category contains clones expressed ubiquitously. For each
clone the fold-change of reporter activity with standard deviation and a short description of the gene are shown.
Table 1 (Continued)
List of candidates
Genome Biology 2009, Volume 10, Issue 9, Article R92 Souren et al. R92.8
Genome Biology 2009, 10:R92
Double-fluorescent whole-mount in situ hybridization of candidatesFigure 3
Double-fluorescent whole-mount in situ hybridization of candidates. Ath5 mRNA was detected using TSA-fluorescein (shown in green), and regulator
mRNA was visualized using FastRed staining (shown in purple). (a-f) Group 1, repressors in RPCs. (g-k) Group 2, activators in RPCs. (l) A schematic
representation of a SWS retina. The box demarcates the magnification shown in the close-ups of the transition zone of Ath5 and candidate regulator
expression. (m-o) Group 3, activators in RGCs. (p-r) Group 3, repressors in RGCs. In this and subsequent figures, all images are single horizontal
confocal sections of the developing eye at the level of the lens, anterior is to the left. Arrowheads point to sites of co-expression of Ath5 and the candidate
regulator.
Idax Ath5
st.30
Islet2 Ath5
st.30
Islet2 Ath5
st.26
Islet2 Ath5
st.32 close up
Idax Ath5
st30
close up
Idax Ath5
st.26
Activator in RGCsRepressor in RGCs Activators in RPCs
sFRP1 Ath5
st.26
sFRP1 Ath5
st.25
apical
basal
lens
retina
Rb Ath5
st.26
Rb Ath5
st.28
Rb Ath5
st.32 close up
MCM2 Ath5
st.26
MCM2 Ath5
st.30
MCM2 Ath5
st.30 close up
KPNA4 Ath5
st.26
KPNA4 Ath5
st.32
KPNA4 Ath5
st.32 close up
Repressors in RPCs
(a) (b) (c)
(d) (e) (f)
(g) (h) (i)
(j) (k) (l)
(m) (n) (o)
(p) (q) (r)
Genome Biology 2009, Volume 10, Issue 9, Article R92 Souren et al. R92.9
Genome Biology 2009, 10:R92
Double-fluorescent whole-mount in situ hybridization (DFWIS) of novel regulators and subcellular localizationFigure 4
Double-fluorescent whole-mount in situ hybridization (DFWIS) of novel regulators and subcellular localization. DFWIS A-L. Ath5 mRNA was detected
using TSA-fluorescein (green), and regulator mRNA was visualized using FastRed staining (purple). (a, b) Group 1, activators in RPCs. (c, d) Group 3,
activators in RGCs. (e-l) Group 4, repressors in RGCs. (m-r) Cellular localization. BHK21 cells were transfected with GFP-fusion proteins. The upper
half of each image shows the single channel including the GFP-fusion protein. The lower half of each image shows an overlay of the GFP-fusion protein
(green), DAPI-stained nucleus (blue) and lynd-Tomato stained cell membrane (purple).
Activator in RGCs Activator in RPCs
SRP40 Ath5
st.28
SRP40 Ath5
st. 30
SRP40-GFP
Ndrg3 Ath5
st.28
Ndrg3 Ath5
st.32
Ndrg3-GFP
Repressors in RGCs
st.28
ELG Ath5
st.32
ELG Ath5 ELG-GFP
RBPMS2 Ath5
st.26
RBPMS2 Ath5
st.28
RBPMS2-GFP
st.28
Zfp161 Ath5 Zfp161 Ath5
st.31
Zfp161-GFP
NHL Ath5
st.28
NHL Ath5
st.32
NHL-GFP
st.28
(a) (b)
(c) (d)
(e) (f)
(g) (h)
(i) (j)
(k) (l)
(m)
(n)
(o)
(p)
(q)
(r)
Genome Biology 2009, Volume 10, Issue 9, Article R92 Souren et al. R92.10
Genome Biology 2009, 10:R92
Targeted overexpression analysisFigure 5
Targeted overexpression analysis. (a-e) Reporter expression. Optical confocal sections through stage 26 retina of Ath5::d1GFP transgenic medaka at the
level of the lens. Embryos were co-injected with Rx2::candidate and Rx2::nuclearCherry at the one-cell stage. White arrowheads indicate representative
double-labeled cells. Red arrowheads indicate the ectopic differentiation of Ath5-positive neurons in the peripheral retina upon Ath5 over-expression (f)
Analysis of reporter overlap. For each candidate the percentage of overlap between the regulator and Ath5-positive cells is plotted, with error bars
indicating the standard error. The significance of the differences was explored by one-way Anova analysis followed by Dunnett's post-tests to compare
each value with the control. Values significantly higher (P < 0.01) than the control are shown by white bars, and percentages significantly lower by black
bars. Percentages that deviate non-significantly from the control are shown by grey bars.
(b)
(d)
(c)
Rx2::Hes1Rx2::sFRP1Rx2::zf161
(e)
0
10
20
30
40
50
60
**
**
**
**
**
**
**
**
**
**
*
% of overlap
Candidate regulators
(f)
Ath5
sFRP1
Ctrl
Nhl-p
Ndrg3a
Rb1
Kpna4
Islet2
Cbx7
Idax
Hes1
RBPMS2
MCM2
zf161
ELG-p
(a)
Merge
Rx2::H2A-Cherry Ath5::d1GFP
Control
Rx2::Ath5
Genome Biology 2009, Volume 10, Issue 9, Article R92 Souren et al. R92.11
Genome Biology 2009, 10:R92
microarray analysis, chromatin immunoprecipitation-based
methodologies and bioinformatics approaches. While these
technologies can be applied to systematically detect gene bat-
teries downstream of a given component of the network and
are powerful tools to detect individual upstream inputs, they
have limited use as genome-wide screening technologies
upstream of a node.
We developed the TRS approach to identify upstream factors
from a large collection of cDNAs in an unbiased manner. We
focused on genes acting in the control of Ath5-mediated RGC
specification.
The transregulation screen robustly identifies high-
confidence candidate regulators of Ath5
The TRS approach represents a high-throughput method to
explore the transregulatory activity of transcriptome-scale
sets of genes acting on native promoter sequences. Using a
rapid screening procedure and taking advantage of a high-
quality medaka unigene expression library, our procedure
overcomes many of the limitations of previously used
approaches. We benchmarked the assay setup using the
known Ath5 regulators Hes-1, Pax6 and Ath5 itself, confirm-
ing that Hes1 represses the Ath5 promoter, while Pax6 and
Ath5 activate the promoter under screening conditions. We
have screened 44% of the protein-coding genes predicted in
medaka (Ensembl 50) for their activity on the Ath5 promoter.
The internal control provided by a dual luciferase-based
approach allows efficient data normalization. Due to the basal
activity of the native promoter, both putative repressors and
activators are identified in a single screen.
The TRS intrinsically favors the identification of direct regu-
lators whose input on Ath5 may be mediated either by direct
binding to the promoter or through their participation as
cofactors in transcriptional complexes. Accordingly, the col-
lection of candidate genes identified is enriched in transcrip-
tional regulators: 44.3% of candidates are annotated as
nucleic acid binding proteins (22% as transcription factors),
while the percentage of transcription factors in vertebrate
genomes is estimated at between 5 and 10% [48]. In fact,
most of the previously uncharacterized candidates show
nuclear localization. By screening the activity of medaka pro-
teins on a medaka promoter in the context of a mammalian
cell line, only strongly conserved interactions were picked up
by the screen. Notably, the screen was not restricted to direct
regulators only, and also identified a number of upstream
regulators, such as sFRP1, a secreted molecule that has been
shown to promote RGC differentiation in chicken [23].
To limit the number of selected genes to high-confidence can-
didates, we applied very stringent selection criteria (Figure
2b), accepting a number of false-negatives. In general, the
rate of false negatives obtained by TRS will depend critically
on the quality and coverage of the reference cDNA library as
well as on the DNA preparations employed during the proce-
dure. In our analysis we further discriminated false-positives
by employing a pipeline of two nested screens, firstly collect-
ing luciferase data and secondly obtaining spatio-temporal
information about the candidate genes in the in situ hybridi-
zation screen. Indeed, we identified a number of transcription
factors that clearly regulate the promoter but are expressed
elsewhere in the embryo. Interestingly, each of these TFs
belonged to a protein family out of which at least one member
was found to be expressed in the eye. The expression pattern
filter efficiently removed these false entries and the number
of candidates was thus reduced from 93 to 41 genes with a
spatio-temporal expression specific to subdomains of the eye.
To assess the relevance of the findings in the context of an
embryo, we carried out functional assays in vivo and found
that 9 out of 12 genes tested by clonal analysis in the develop-
ing medaka retina regulate Ath5. This in vivo validation dem-
onstrates the power of the approach to efficiently identify
high-confidence targets. We classified our candidate regula-
tors into four different groups according to expression pat-
tern and regulatory activity:
Four spatially and functionally distinct sets of
regulators define different phases of Ath5 expression
Activation phase
Group 1 genes
Group 1 genes repress the Ath5 promoter to prevent prema-
ture neurogenesis. Genes for MCM2, a member of the general
replication initiation complex, and an importin, KPNA4, are
expressed with Ath5 only prior to exit from the cell cycle in the
most apical cells and repress the Ath5 promoter in the context
of the retina (Figure 5b), maintaining the RPCs in an undiffer-
entiated state. Interestingly, MCM2 downregulation has been
correlated with cell cycle exit and Rb hyperphosphorylation
[49].
Group 2 genes
Group 2 genes act as initial activators and are expressed in
RPCs and nascent RGCs. We demonstrate that the cell cycle
exit regulator Rb activates the Ath5 promoter in vivo. The
onset of Rb overlaps with the last mitosis in apically located
RPCs at the onset of Ath5 expression. A link between cell cycle
exit and RGC specification has long been proposed [27] and
loss of Rb has been reported to cause neuronal differentiation
defects [50]. Our findings further indicate that the Rb path-
way molecularly links cell-cycle exit and activation of the
proneural gene Ath5. Interestingly, in Drosophila eye imagi-
nal discs, increased Rb expression flanking the atonal
domain in the furrow has been reported [51], indicating that
part of the atonal/Ath5 gene network is evolutionarily con-
served.
We also show that the Wnt-signal modulator sFRP1 activates
Ath5 in vitro and in vivo. This substantiates and extends a
previous report showing that sFRP1 favors generation of
RGCs and photoreceptors in the developing chicken retina
Genome Biology 2009, Volume 10, Issue 9, Article R92 Souren et al. R92.12
Genome Biology 2009, 10:R92
[23]. These findings indicate that transregulatory input from
both cell-intrinsic factors and extracellular signals converges
on the Ath5 promoter to precisely control the timing of RGC
differentiation.
Downregulation phase
Group 3 genes
Group 3 genes maintain Ath5 expression in basal RGCs just
prior to the downregulation of Ath5. Several reports indicate
that Ath5 expression is maintained through an auto-regula-
tory feedback loop in migrating RGCs [30,33]. We hypothe-
size that late activators, such as Islet-2 and Ndrg3, cooperate
with this feedback loop to maintain high levels of Ath5 mRNA
until the sharp downregulation prior to RGC terminal differ-
entiation. In agreement with this, it has been shown that islet-
2 is a downstream target of Ath5 in mice [52].
Group 4 genes
The last step of Ath5 regulation requires sharp downregula-
tion of the promoter. This repression requires both breaking
the auto-regulatory feedback loop and directly repressing the
regulatory elements of the promoter. We identified eight
repressors that are expressed in late RGCs and overlap with
Ath5 only in very few basal cells. RBPMS2, an RNA binding
protein, and a chaperone-like ELG-protein [53] repress Ath5
in vivo (Figure 5b). We propose that they are required to
break the positive Ath5 feedback loop on the level of RNA reg-
ulation. It is likely that the zinc finger protein Zfp-161 repre-
sents a more direct transcriptional regulator of Ath5, based
on its protein structure, its nuclear localization, and the clear
dose-response. We demonstrate that the Wnt-regulator Idax
represses Ath5 in vivo, consistent with the notion that repres-
sion of Wnt signaling is required for the progression of neu-
rogenesis [54].
Conclusions
Our analysis establishes a regulatory framework of RGC neu-
rogenesis. We have identified novel repressors in proliferat-
ing RPCs in addition to the previously described initial
repressor Hes1 (Figure 6a). We propose that lifting of repres-
sion is accompanied by a rapid activation of the promoter
through cell-extrinsic (for example, sFRP1) and cell-intrinsic
(for example, Rb) inputs. The main phase of strong expres-
sion has been previously described as being driven by the
Ath5 autoregulatory feedback loop and by NeuroM activity.
We have now identified other factors that act during this
phase and contribute to sustaining the Ath5 regulatory loop.
Importantly, we describe a number of genes involved in the
final downregulation of Ath5 (Figure 6b). These include not
only transcription factors, but also regulators of RNA metab-
olism, enzymes and genes of as yet uncharacterized molecular
function.
Our nested screening approach has been highly efficient at
identifying relevant inputs to Ath5, a central node in the reti-
nal neurogenic GRN. The TRS technology extends the current
model of Ath5 regulation and gives novel insights into the
mechanisms of retinal neurogenesis.
Materials and methods
Medaka stocks
The Cab-strain of wild-type medaka (Oryzias latipes) were
kept in closed stocks at the EMBL, as described [55]. Embry-
onic stages are according to [56]. For stages after the onset of
eye pigmentation the Heino strain was used [57].
Unigene full-length library and reporter vector
Total RNA was extracted from medaka stages 18, 24, 32 and
adults. mRNA was isolated using polyT-beads. The normal-
ized full-length cDNA library was prepared using standard
reverse transcription. The cDNAs were cloned into pCMV-
Sport6.1 vector. We sequenced and clustered 55,296 clones
based on sequence alignment. One bacterial clone of each
cluster was transferred into a consolidated library in a 384-
well plate by the in-house genomics service. In addition to
13,837 clones from clusters in the initial library, 3,689 clones
not sequenced successfully were included.
Reporter vector
A 3-kb fragment upstream of the medaka Ath5 gene
(ENSORLG00000013722) was amplified using specific
primers (forward primer, TGCATCTTCAGCGCAGTGGCA;
reverse primer, GGTTTCTGTGCAAAGAGGCGAA) and
cloned into the pGL3 luciferase reporter vector that contains
the Photinus pyralis luciferase gene.
Cell culture and transfection
Syrian Hamster Fibroblast (BHK21) cells were cultivated in
Dulbecco's modified Eagle's medium (DMEM), supple-
mented with 10% fetal calf serum, 200 U/l penicillin, 200 μg/
l streptomycin and 2 mM L-glutamine. Cells were incubated
at 37°C in a humidified atmosphere with 5% CO
2
. For luci-
ferase assays cells were seeded in white 96-well plates and
grown for 5 h. pGL3 Ath5::luc vector (40 ng) and pRL-CMV
control vector (5 ng) (Promega, Mannheim, Germany) were
incubated with 2 μl (10 to 300 ng) of pCMV-Sport6.1::cDNA
in a 3- to 6-fold volume-excess of FuGENE6 transfection rea-
gent in serum-free medium for 30 minutes and then added to
the cells. After 42 h growth at 37°C, the medium was removed
and cells were lysed with 20 μl of 1× passive lysis buffer
(Promega). Each clone was assayed in triplicate.
Dose-response behavior of the candidate regulators was
assessed in triplicate by co-transfecting 20, 40, 80 or 160 ng
of pCMV-Sport6.1::cDNA with the reporter and control con-
struct. The total amount of DNA transfected in each dose-
response experiment was kept constant by adding pCS2+ vec-
tor where appropriate (see supplementary methods in Addi-
tional data file 1).
Genome Biology 2009, Volume 10, Issue 9, Article R92 Souren et al. R92.13
Genome Biology 2009, 10:R92
Luciferase assays
Raw luminescence values were sequentially recorded in a Vic-
tor Light Luminescence counter (PerkinElmer Waltham,
Massachusetts, USA) using a dual flash luciferase system
(Promega) according to manufacturer's guidelines. All values
were stored in a FileMaker database (FileMaker, Inc, Santa
Clara, California, USA) The median of the raw ratio between
the firefly luciferase and the Renilla luciferase of each tripli-
cate was normalized against the median of all ratios of the 96-
well plates containing the triplicates. Clones with a non-ran-
dom deviation from the average were selected as candidate
regulators (see supplementary methods in Additional data
file 1). When only one assay was available for a clone, no
standard deviation filter was applied.
Riboprobe preparation
The insert with a 3' flanking T7-promoter was amplified from
the pCMV-Sport6.1 backbone using standard PCR with
M13frw and M13rev primers. T7 RNA polymerase-based
transcription was performed as previously described [58].
Robotic-assisted whole-mount in situ hybridization
Fixation, protein K digestion and post-fixation of embryos
were carried out as previously described [58]. Solutions were
prepared according to standard protocols, except phosphate-
buffered saline-Tween 20 (PTW) for the washes containing
0.35% PTW. In addition to the standard protocol, a pre-stain-
ing buffer (0.1 M Tris pH7.5, 25 mM NaCl, 0.1% Tween20)
was prepared. Hybridization and washes were carried out in
an in situ robot (InSitu Pro, Intavis Koeln, Germany) with an
Model of Ath5 expression dynamicsFigure 6
Model of Ath5 expression dynamics. Summary of input on the 3-kb Ath5 promoter fragment. Solid lines represent activities that were confirmed in vivo, and
shaded solid lines represent regulatory activities that were not significant in vivo. (a) Onset of Ath5 expression. Group 1 genes such as MCM2 and KPNA4
may act to prevent premature Ath5 expression. Ath5 expression is switched on by group 2 genes, such as sFRP1 and Rb. (b) Downregulation of Ath5.
Group 3 genes: Ndrg3 and Islet-2 may prevent premature downregulation of Ath5. Expression of Ath5 is downregulated by signals through Idax and the
regulatory activity of RBPMS2, ELG-protein and Zfp-161 (group 4).
Genome Biology 2009, Volume 10, Issue 9, Article R92 Souren et al. R92.14
Genome Biology 2009, 10:R92
adapted in situ protocol (see supplementary Materials and
methods in Additional data file 1). The staining reactions
were performed manually as previously described [58].
Double-fluorescence in situ hybridization
Embryos were prepared as described above for single-color in
situ hybridization. Fluorescein-labeled probes were gener-
ated against Ath5 according to standard protocol [59].
Embryos were hybridized with a mixture of this probe and a
DIG-labeled probe against the candidate regulator. Anti-fluo-
rescein antibody (α-Fluo Ab) coupled to peroxidase and anti-
digoxigenin antibody (α-Dig Ab) coupled to alkaline phos-
phatase were mixed in blocking buffer at 1:500 and 1:1,000
dilutions, respectively. Embryos were first incubated with
TSA-fluorescein according to the manufacturer's instructions
(PerkinElmer) for 60 minutes at room temperature in the
dark. The DIG-probes were visualized with FastRed staining
(Roche Mannheim, Germany).
Imaging
Images from embryos mounted in toto were acquired on a
Leica SP2 confocal microscope using a HCX PL APO CS 40×,
1.25 oil objective. Images were assembled and processed in
Adobe Photoshop and ImageJ. Brightness and contrast were
adjusted; filtering was applied for noise reduction and thresh-
olding when needed.
Conservation analysis and transcription factor binding
site discovery
Conserved sequences in the 3-kb upstream sequence of Ath5
were determined as previously described [31]. Position
weight matrices for the TFBSs were obtained from TRANS-
FAC [44] (NFkB Identifier: M0019); for islet-2 we used the
position weight matrix for the LIM- and homeodomain-con-
taining transcription factor Lhx3 (M00510). Potential TFBSs
were search for using Possum [60], using a threshold of 4 and
a relative abundance range of 50 for M00194 and 100 for
M00510.
Fusion protein and localization assays
The proteins were amplified from pCMV-Sport6.1 using the
specific primers (see supplementary Materials and methods
in Additional data file 1). Forward primers contained restric-
tion sites creating an EcoRI compatible overhang and the
reverse primers a restriction site creating an NcoI compatible
overhang. The sequence verified fragments were subcloned
into a pCS2+ hGFP vector.
BHK21 cells were grown on human fibronectin-coated culture
slides to 40 to 50% confluency and transfected with 0.8 μg of
each fusion protein and 0.2 μg of pCS2+ lynd-tomato for
membrane labeling. After 42 h cells were fixed in 4% parafor-
maldehyde/phosphate-buffered saline, permeabilized in
0.2%Triton/phosphate-buffered saline and stained with
DAPI. The slides were sealed with a glass coverslip and were
kept at 4°C in the dark.
Functional assays
Candidate regulators in pCMV-Sport6.1 were cloned into a
gateway recombination destination vector containing a 2.4-
kb OlRx2 promoter fragment driving expression in the eye
[61]. Each construct (5 ng/μl) was individually co-injected
with Rx2::H2A-Cherry (7.5 ng/μl) into one-cell stage
medaka embryos as previously described [46]. Stage 26
embryos were protein K treated to remove hairs from the cho-
rion, heptanol treated (3 mM) and imaged in vivo using a
Leica SPE confocal microscope with a 40× dipping lens. Ret-
ina with clonal expression of the constructs were imaged indi-
vidually at the level of the lens. H2A-Cherry-expressing cells
within the Ath5-expression domain were scored for Ath5
coexpression.
Statistical analysis
Quantitative data are expressed as mean ± standard error of
the mean. Significant differences among groups were evalu-
ated by one-way ANOVA followed by Dunnett's tests (Graph-
Pad Prism. GraphPad Software, Inc. San Diego, California,
USA) and are indicated when relevant.
Abbreviations
bHLH: basic helix-loop-helix; GFP: green fluorescent pro-
tein; GRN: gene regulatory network; IS: initiation stage; PS:
progression stage; Rb: Retinoblastoma; RGC: retinal gan-
glion cell; RPC: retinal progenitor cell; sFRP: secreted frizzled
related protein; SWS: steady wave stage; TFBS: transcription
factor binding site; TRS: trans-regulation screen.
Authors' contributions
JRMM and JW conceived the study. JRMM and MS designed,
coordinated and carried out the screening pipeline. MS
designed and maintained the screen database. BW carried out
the semi-automated in situ hybridizations. PM participated
in the double fluorescence whole-mount in situ hybridization
experiments. The manuscript was initially drafted by MS.
JRMM and JW worked on further versions of the text. All
authors read and approved the final manuscript.
Additional data files
The following additional data are available with the online
version of this paper: a PDF including supplementary Tables
S1 and Table S2, supplementary Figures S1 to S4, and supple-
mentary Materials and methods (Additional data file 1).
Additional data file 1Tables S1 and Table S2, supplementary Figures S1 to S4, and sup-plementary Materials and methodsTable S1: a complete candidate list. Table S2: values obtained in dose-response experiments for the different candidates. Figure S1: behavior of known regulators under screening conditions. Figure S2: representative pictures form the automated in situ hybridiza-tion screen. Figure S3: double-fluorescent whole-mount in situ hybridization of additional candidates. Figure S4: functional anal-ysis of TFBSs within the Ath5 3-kb regulatory sequence. Supple-mentary Materials and methods provide a detailed description of the transregulation and in situ hybridization screens.Click here for file
Acknowledgements
We are grateful to Katherine Brown and Lazaro Centanin for their critical
input and discussion, the GeneCore Facility, EMBL, for re-arraying the
cDNA library and making 96-well format minipreps, A Nowicka and D Hof-
mann for fish husbandry, and C Müller for technical assistance. JRMM was
supported by EMBO and Marie Curie fellowships and by the Ramon y Cajal
program. This work was supported by grants from the Deutsche Forsc-
hungsgemeinschaft, Collaborative Research Centre 488, the EU to JW.
Genome Biology 2009, Volume 10, Issue 9, Article R92 Souren et al. R92.15
Genome Biology 2009, 10:R92
References
1. Erwin D, Davidson E: The evolution of hierarchical gene regu-
latory networks. Nat Rev Genet 2009, 10:141-148.
2. Mu X, Fu X, Sun H, Beremand PD, Thomas TL, Klein WH: A gene
network downstream of transcription factor Math5 regu-
lates retinal progenitor cell competence and ganglion cell
fate. Dev Biol 2005, 280:467-481.
3. Cremisi F, Philpott A, Ohnuma S: Cell cycle and cell fate interac-
tions in neural development. Curr Opin Neurobiol 2003, 13:26-33.
4. Livesey FJ, Cepko CL: Vertebrate neural cell-fate determina-
tion: lessons from the retina. Nat Rev Neurosci 2001, 2:109-118.
5. Marquardt T, Gruss P: Generating neuronal diversity in the ret-
ina: one for nearly all. Trends Neurosci 2002, 25:32-38.
6. Ohnuma S, Harris WA: Neurogenesis and the cell cycle. Neuron
2003, 40:199-208.
7. Del Bene F, Wehman AM, Link BA, Baier H: Regulation of neuro-
genesis by interkinetic nuclear migration through an apical-
basal notch gradient. Cell 2008, 134:1055-1065.
8. Frade JM: Interkinetic nuclear movement in the vertebrate
neuroepithelium: encounters with an old acquaintance. Prog
Brain Res 2002, 136:67-71.
9. Sauer FC: The interkinetic migration of embryonic epithelial
nuclei. J Morphol 1936, 60:1-11.
10. Brown NL, Patel S, Brzezinski J, Glaser T: Math5 is required for
retinal ganglion cell and optic nerve formation. Development
2001, 128:2497-2508.
11. Kay JN, Finger-Baier KC, Roeser T, Staub W, Baier H: Retinal gan-
glion cell genesis requires lakritz, a Zebrafish atonal
homolog. Neuron 2001, 30:725-736.
12. Wang SW, Kim BS, Ding K, Wang H, Sun D, Johnson RL, Klein WH,
Gan L: Requirement for math5 in the development of retinal
ganglion cells.
Genes Dev 2001, 15:24-29.
13. Kanekar S, Perron M, Dorsky R, Harris WA, Jan LY, Jan YN, Vetter
ML: Xath5 participates in a network of bHLH genes in the
developing Xenopus retina. Neuron 1997, 19:981-994.
14. Liu W, Mo Z, Xiang M: The Ath5 proneural genes function
upstream of Brn3 POU domain transcription factor genes to
promote retinal ganglion cell development. Proc Natl Acad Sci
USA 2001, 98:1649-1654.
15. Masai I, Yamaguchi M, Tonou-Fujimori N, Komori A, Okamoto H:
The hedgehog-PKA pathway regulates two distinct steps of
the differentiation of retinal ganglion cells: the cell-cycle exit
of retinoblasts and their neuronal maturation. Development
2005, 132:1539-1553.
16. Poggi L, Vitorino M, Masai I, Harris WA: Influences on neural lin-
eage and mode of division in the zebrafish retina in vivo . J Cell
Biol 2005, 171:991-999.
17. Bonini NM, Choi KW: Early decisions in Drosophila eye mor-
phogenesis. Curr Opin Genet Dev 1995, 5:507-515.
18. Hu M, Easter SS: Retinal neurogenesis: the formation of the ini-
tial central patch of postmitotic cells. Dev Biol 1999,
207:309-321.
19. Masai I, Stemple DL, Okamoto H, Wilson SW: Midline signals reg-
ulate retinal neurogenesis in zebrafish. Neuron 2000,
27:251-263.
20. Laessing U, Stuermer CA: Spatiotemporal pattern of retinal
ganglion cell differentiation revealed by the expression of
neurolin in embryonic zebrafish. J Neurobiol 1996, 29:65-74.
21. Prada C, Puga J, Perez-Mendez L, Lopez R, Ramirez G: Spatial and
temporal patterns of neurogenesis in the chick retina. Eur J
Neurosci 1991, 3:559-569.
22. Young RW: Cell differentiation in the retina of the mouse.
Anat Rec 1985, 212:199-205.
23. Esteve P, Trousse F, Rodriguez J, Bovolenta P: SFRP1 modulates
retina cell differentiation through a beta-catenin-independ-
ent mechanism. J Cell Sci 2003, 116:2471-2481.
24. Martinez-Morales JR, Del Bene F, Nica G, Hammerschmidt M, Bovo-
lenta P, Wittbrodt J: Differentiation of the vertebrate retina is
coordinated by an FGF signaling center. Dev Cell 2005,
8:565-574.
25. Shkumatava A, Fischer S, Muller F, Strahle U, Neumann CJ: Sonic
hedgehog, secreted by amacrine cells, acts as a short-range
signal to direct differentiation and lamination in the
zebrafish retina. Development 2004, 131:3849-3858.
26. Vinothkumar S, Rastegar S, Takamiya M, Ertzer R, Strahle U: Sequen-
tial and cooperative action of Fgfs and Shh in the zebrafish
retina. Dev Biol 2008, 314:200-214.
27. Kay JN, Link BA, Baier H: Staggered cell-intrinsic timing of ath5
expression underlies the wave of ganglion cell neurogenesis
in the zebrafish retina. Development 2005, 132:2573-2585.
28. Hatakeyama J, Bessho Y, Katoh K, Ookawara S, Fujioka M, Guillemot
F, Kageyama R: Hes genes regulate size, shape and histogenesis
of the nervous system by control of the timing of neural stem
cell differentiation. Development 2004, 131:5539-5550.
29. Tomita K, Ishibashi M, Nakahara K, Ang SL, Nakanishi S, Guillemot F,
Kageyama R: Mammalian hairy and Enhancer of split homolog
1 regulates differentiation of retinal neurons and is essential
for eye morphogenesis. Neuron 1996, 16:723-734.
30. Matter-Sadzinski L, Puzianowska-Kuznicka M, Hernandez J, Ballivet M,
Matter JM: A bHLH transcriptional network regulating the
specification of retinal ganglion cells. Development 2005,
132:3907-3921.
31. Del Bene F, Ettwiller L, Skowronska-Krawczyk D, Baier H, Matter JM,
Birney E, Wittbrodt J: In vivo validation of a computationally
predicted conserved Ath5 target gene set. PLoS Genet 2007,
3:1661-1671.
32. Skowronska-Krawczyk D, Ballivet M, Dynlacht BD, Matter JM:
Highly specific interactions between bHLH transcription fac-
tors and chromatin during retina development. Development
2004, 131:4447-4454.
33. Hernandez J, Matter-Sadzinski L, Skowronska-Krawczyk D, Chiodini
F, Alliod C, Ballivet M, Matter JM: Highly conserved sequences
mediate the dynamic interplay of basic helix-loop-helix pro-
teins regulating retinogenesis. J Biol Chem 2007,
282:37894-37905.
34. Hufnagel RB, Riesenberg AN, Saul SM, Brown NL: Conserved reg-
ulation of Math5 and Math1 revealed by Math5-GFP trans-
genes. Mol Cell Neurosci 2007, 36:435-448.
35. Riesenberg AN, Le TT, Willardsen MI, Blackburn DC, Vetter ML,
Brown NL: Pax6 regulation of Math5 during mouse retinal
neurogenesis. Genesis 2009, 47:175-187.
36. Willardsen MI, Suli A, Pan Y, Marsh-Armstrong N, Chien CB, El-
Hodiri H, Brown NL, Moore KB, Vetter ML: Temporal regulation
of Ath5 gene expression during eye development. Dev Biol
2009, 326:471-481.
37. Deplancke B, Dupuy D, Vidal M, Walhout AJ: A gateway-compat-
ible yeast one-hybrid system. Genome Res 2004, 14:2093-2101.
38. Berger MF, Badis G, Gehrke AR, Talukder S, Philippakis AA, Pena-
Castillo L, Alleyne TM, Mnaimneh S, Botvinnik OB, Chan ET, Khalid
F, Zhang W, Newburger D, Jaeger SA, Morris QD, Bulyk ML, Hughes
TR: Variation in homeodomain DNA binding revealed by
high-resolution analysis of sequence preferences. Cell 2008,
133:1266-1276.
39. Noyes MB, Christensen RG, Wakabayashi A, Stormo GD, Brodsky
MH, Wolfe SA: Analysis of homeodomain specificities allows
the family-wide prediction of preferred recognition sites. Cell
2008, 133:1277-1289.
40. Liu Y, Kern JT, Walker JR, Johnson JA, Schultz PG, Luesch H: A
genomic screen for activators of the antioxidant response
element. Proc Natl Acad Sci USA 2007, 104:5205-5210.
41. Fan F, Wood KV: Bioluminescent assays for high-throughput
screening.
Assay Drug Dev Technol 2007, 5:127-136.
42. Boutros M, Brás LP, Huber W: Analysis of cell-based RNAi
screens. Genome Biol 2006, 7:R66.
43. Medaka Expression Pattern Database [:8080/
mepd/]
44. Matys V, Fricke E, Geffers R, Gossling E, Haubrock M, Hehl R, Hor-
nischer K, Karas D, Kel AE, Kel-Margoulis OV, Kloos DU, Land S,
Lewicki-Potapov B, Michael H, Münch R, Reuter I, Rotert S, Saxel H,
Scheer M, Thiele S, Wingender E: TRANSFAC: transcriptional
regulation, from patterns to profiles. Nucleic Acids Res 2003,
31:374-378.
45. Okuda T, Kokame K, Miyata T: Differential expression patterns
of NDRG family proteins in the central nervous system. J His-
tochem Cytochem 2008, 56:175-182.
46. Rembold M, Lahiri K, Foulkes NS, Wittbrodt J: Transgenesis in fish:
efficient selection of transgenic fish by co-injection with a flu-
orescent reporter construct. Nat Protoc 2006, 1:1133-1139.
47. Stathopoulos A, Levine M: Genomic regulatory networks and
animal development. Dev Cell 2005, 9:449-462.
48. Levine M, Tjian R: Transcription regulation and animal diver-
sity. Nature 2003, 424:147-151.
49. Noseda M, Niessen K, McLean G, Chang L, Karsan A: Notch-
dependent cell cycle arrest is associated with downregula-
tion of minichromosome maintenance proteins. Circ Res 2005,
Genome Biology 2009, Volume 10, Issue 9, Article R92 Souren et al. R92.16
Genome Biology 2009, 10:R92
97:102-104.
50. Chen D, Opavsky R, Pacal M, Tanimoto N, Wenzel P, Seeliger MW,
Leone G, Bremner R: Rb-mediated neuronal differentiation
through cell-cycle-independent regulation of E2f3a. PLoS Biol
2007, 5:e179.
51. Keller SA, Ullah Z, Buckley MS, Henry RW, Arnosti DN: Distinct
developmental expression of Drosophila retinoblastoma fac-
tors. Gene Expr Patterns 2005, 5:411-421.
52. Yang Z, Ding K, Pan L, Deng M, Gan L: Math5 determines the
competence state of retinal ganglion cell progenitors. Dev
Biol 2003, 264:240-254.
53. Merz C, Urlaub H, Will CL, Luhrmann R: Protein composition of
human mRNPs spliced in vitro and differential requirements
for mRNP protein recruitment. RNA 2007, 13:116-128.
54. Yamaguchi M, Tonou-Fujimori N, Komori A, Maeda R, Nojima Y, Li
H, Okamoto H, Masai I: Histone deacetylase 1 regulates retinal
neurogenesis in zebrafish by suppressing Wnt and Notch sig-
naling pathways. Development 2005, 132:3027-3043.
55. Koster R, Stick R, Loosli F, Wittbrodt J: Medaka spalt acts as a tar-
get gene of hedgehog signaling. Development 1997,
124:3147-3156.
56. Iwamatsu T: Stages of normal development in the medaka
Oryzias latipes . Mech Dev 2004, 121:605-618.
57. Loosli F, Koster RW, Carl M, Kuhnlein R, Henrich T, Mucke M, Krone
A, Wittbrodt J: A genetic screen for mutations affecting
embryonic development in medaka fish (Oryzias latipes).
Mech Dev 2000, 97:133-139.
58. Loosli F, Winkler S, Burgtorf C, Wurmbach E, Ansorge W, Henrich
T, Grabher C, Arendt D, Carl M, Krone A, Grzebisz E, Wittbrodt J:
Medaka eyeless is the key factor linking retinal determina-
tion and eye growth. Development 2001, 128:4035-4044.
59. Loosli F, Koster RW, Carl M, Krone A, Wittbrodt J: Six3, a medaka
homologue of the Drosophila homeobox gene sine oculis is
expressed in the anterior embryonic shield and the develop-
ing eye. Mech Dev 1998, 74:159-164.
60. Possum web page [ />61. Martinez-Morales JR, Rembold M, Greger K, Simpson JC, Brown KE,
Quiring R, Pepperkok R, Martin-Bermudo MD, Himmelbauer H, Wit-
tbrodt J: ojoplano-mediated basal constriction is essential for
optic cup morphogenesis. Development 2009, 136:2165-2175.