Báo cáo y học: " Simultaneous alignment of short reads against multiple genomes" pps
Bạn đang xem bản rút gọn của tài liệu. Xem và tải ngay bản đầy đủ của tài liệu tại đây (247.19 KB, 12 trang )
Genome Biology 2009, 10:R98
Open Access
2009Schneebergeret al.Volume 10, Issue 9, Article R98
Software
Simultaneous alignment of short reads against multiple genomes
Korbinian Schneeberger
*
, Jörg Hagmann
*
, Stephan Ossowski
*
,
Norman Warthmann
*
, Sandra Gesing
†
, Oliver Kohlbacher
†
and
Detlef Weigel
*
Addresses:
*
Department of Molecular Biology, Max Planck Institute for Developmental Biology, Spemannstrasse 37-39, D-72076 Tübingen,
Germany.
†
Center for Bioinformatics Tübingen (ZBIT), Eberhard Karls University Tübingen, Sand 14, 72076 Tübingen, Germany.
Correspondence: Detlef Weigel. Email:
© 2009 Schneeberger et al.; licensee BioMed Central Ltd.
This is an open access article distributed under the terms of the Creative Commons Attribution License ( which
permits unrestricted use, distribution, and reproduction in any medium provided the original work is properly cited.
Genome Mapper<p>New software for the alignment of short-read sequence data to multiple genomes allows identification of polymorphisms that cannot be identified by alignment to a single reference genome.</p>
Abstract
Genome resequencing with short reads generally relies on alignments against a single reference.
GenomeMapper supports simultaneous mapping of short reads against multiple genomes by
integrating related genomes (e.g., individuals of the same species) into a single graph structure. It
constitutes the first approach for handling multiple references and introduces representations for
alignments against complex structures. Demonstrated benefits include access to polymorphisms
that cannot be identified by alignments against the reference alone. Download GenomeMapper at
.
Rationale
Within the last few years, a variety of second- (or next-) gen-
eration sequencing technologies have been developed to ena-
ble analyses of small to medium-sized genomes within weeks
or even days. The methods are now overcoming the disadvan-
tages of short read length (currently the longest reads are
obtained with the Titanium system produced by Roche/454
Life Sciences (Brandford, CT, USA) with Q20 at 400 bp) and
a lower quality of individual reads with a dramatic increase in
the total amount of data generated.
The initial resequencing of Caenorhabditis elegans and Ara-
bidopsis thaliana (Arabidopsis) strains with Illumina reads
[1,2] was recently complemented by genome sequences of
several human individuals, generated with data derived from
technologies from Illumina (San Diego, CA, USA), Applied
Biosystems (Foster City, CA, USA), and Helicos (Cambridge,
MA, USA) [3-10]. Even partial de novo assemblies of targeted
regions within large genomes have been attempted [2]. How-
ever, short-read analysis of complex genomes is greatly aided
by using a sequence backbone against which the short reads
are aligned to find their genomic origin.
Different approaches for fast mapping of short reads have
been suggested, including methods for indexing substrings of
either the short reads or the reference sequence with the use
of k-mers or spaced seeds (academic tools such as Bowtie,
BWA, CloudBurst, MAQ, MOM, MosaikAligner, mrFAST,
mrsFAST, Pash, PASS, PatMaN, RazorS, RMAP, SeqMap,
SHRiMP, SliderII, SOAP, SOAP2, ssaha2 [2,11-28], and com-
mercial tools such as ZOOM [29]). It has been reported that
the current high demand for rapid alignments, to accommo-
date the flood of data generated by efforts such as the 1000
Genomes Project, can be met with new indexing strategies
[16]. However, this is normally at the cost of not allowing
complex alignments, including gaps.
Published: 17 September 2009
Genome Biology 2009, 10:R98 (doi:10.1186/gb-2009-10-9-r98)
Received: 20 July 2009
Revised: 12 September 2009
Accepted: 17 September 2009
The electronic version of this article is the complete one and can be
found online at /> Genome Biology 2009, Volume 10, Issue 9, Article R98 Schneeberger et al. R98.2
Genome Biology 2009, 10:R98
For natural inbred strains of Arabidopsis, the high level of
individual differences constitutes a substantial challenge. It
has been estimated that several percent of the reference
genome are either missing or very divergent in other strains
of this species, which features homozygous genomes that are
25 times smaller than a haploid human genome [30,31]. This
results in regions inaccessible to simple short-read align-
ments, in particular for alignment algorithms that do not
accommodate many mismatches and gaps. New approaches
supporting accurate alignments even in highly divergent
regions are therefore sorely needed.
We note that the information derived from resequenced indi-
vidual genomes is in itself useful for subsequent resequencing
efforts, especially when the latter are at lower sequence cov-
erage than the earlier efforts. Incorporating known polymor-
phisms increases the genome space against which the sample
reads are aligned, which should greatly improve the mapping
results. For example, an alignment suggesting a string of
deleted bases in the focal genome becomes much more relia-
ble if this deletion is known to exist in the population. The
incorporation of such missing or inserted bases in the target/
reference sequence not only would decrease the complexity of
the alignments, but also would reduce sequencing costs, as
more reads can be placed on the genome.
Apart from these practical reasons, aligning against only a
single reference biases the analysis toward a comparison
within the sequence space highly conserved with the refer-
ence. Taking into account all known genome variants would
reduce this bias. Aligning reads against multiple genomes
separately increases computation time and storage space and
introduces new problems of merging and interpreting redun-
dant results.
Here we present a new short-read alignment algorithm,
GenomeMapper, which performs simultaneous alignments of
short reads against multiple genomes. GenomeMapper
assures high alignment quality, while competing in runtime
with other short-read alignment tools. This is achieved by
representing multiple genomes with a novel hash-based
graph data structure against which the reads are aligned. To
our knowledge, this constitutes the first approach for aligning
a sequence against a graph of sequences rather than aligning
two linear sequences. We also propose the first standards to
tackle the problems arising from multiple references. Genom-
eMapper is currently the tool of choice for the Arabidopsis
1001 Genomes Project [32,33], and the default alignment
option of the short-read analysis pipeline SHORE [2].
GenomeMapper has been used to analyze sequence reads
derived from bacterial, plant, invertebrate, and mammalian
genomes. To demonstrate the impact of adopting multiple
genomes as the short-read alignment target, we describe the
construction of a multiple genome sequence graph based on
published polymorphisms of Arabidopsis [2]. We present the
alignment and consensus sequence analysis of the Est-1 strain
by using this graph and compare the results with the conven-
tional approach of aligning the same set of reads against a sin-
gle reference. We discuss the implications of our work for the
analysis of more-complex reference sequences.
GenomeMapper's indexing and alignment
strategy
Multiple genomes in one index
One way to decrease runtime for the generation of sequence
alignments is to build index structures of either the reads or
the reference sequence. To allow simultaneous alignments
against multiple genome sequences, all target sequences have
to be combined into one data structure. GenomeMapper
achieves this goal by building a joint index of all genomes that
are alignment targets. This index will be persistently stored,
and, once compiled, the index does not need to be rebuilt for
future alignment tasks.
The index is a simple hash-based mapping of k-mers
(sequence signatures of 5 to 13 bp) to their locations within
the target sequences. Each k-mer present in target sequences
is unambiguously converted into a single integer, applying a
two-bit representation of the four DNA nucleotides. Each
hash key points to one hash value consisting of a list of all
genome locations of the k-mer. Although this rather simplis-
tic hash-indexing approach has some disadvantages com-
pared with more recently developed strategies (e.g., Burrows-
Wheeler indexing [16]), the latter are usually geared toward
ungapped alignments and are not easily extendable to nonlin-
ear structures imposed by multiple genomes. Further,
spaced-seed approaches, implemented in tools such as
SHRiMP or ZOOM, can be more sensitive [34]. However,
when these approaches are applied to real data, they do not
result in a substantial increase in the number of alignments
compared with an approach with contiguous seeds followed
by a complex alignment, because contiguous seeds are usually
chosen short enough (i.e., 9 to 12 bp) for anchoring and sub-
sequent aligning of reads (see later for comparison with other
mapping tools).
Mapping indices tend to require a large amount of random
access memory (RAM). Current computer servers usually
allow multiple processors to share physical RAM. To avoid
the unnecessary overhead of loading the same index multiple
times, GenomeMapper makes use of memory-mapped files,
allowing computer processes to share the same index struc-
ture within the memory. This reduces the overall memory
footprint when running several instances of GenomeMapper
in parallel.
Index graph creation
The input for GenomeMapper's index-creation step consists
of the sequence of one of the genomes and a list of differences
in the other genomes compared with the first one (i.e., one
FASTA file and a list of single-nucleotide polymorphisms
Genome Biology 2009, Volume 10, Issue 9, Article R98 Schneeberger et al. R98.3
Genome Biology 2009, 10:R98
(SNPs) and indels of every additional genome). Each position
not explicitly annotated as different is assumed to be identical
in all of the genomes, and will therefore be stored only once.
This is important to avoid redundant alignments to several
genomes. Divergent sequences are stored separately for each
of the genomes. Identical regions, which are represented
once, must be connected with polymorphic regions, which are
represented by branches in the index. Hence, the reference
loses its linear/sequential characteristic, but rather forms a
sequence graph. Note that none of the genomes represents
"the reference" (Figure 1).
To store this information efficiently, each of the genomes is
partitioned into non-overlapping sequence blocks of up to
256 bp, which represent the genomic sequence of all
genomes. The connections of blocks to their neighbors allow
continuous reconstruction of each genome. Invariant regions
will be represented by one block only. Every variant, includ-
ing all SNPs, will trigger the formation of branches, which
constitute the parallel blocks that account for the nonlinearity
of the genome graph (Figure 2a and 2b). Because complex dif-
ferences such as inversions or duplications can always be
defined as combinations of deletions and insertions, they can
be readily incorporated into a graph index.
A unique identifier for each block allows a constant look-up
time in a table that stores all relevant block information. In
addition to referring to the genomes, of which it is a part, each
block encodes for its sequence, the connections to its neigh-
boring blocks, and the position within the genome. Each
block thus harbors the genome sequence of all or a subset of
genomes with identical sequences within the respective
region. The block table is the implementation of a sequence
graph, where the blocks represent the nodes, and the connec-
tions between them, the edges (Figure 2b). We refer to this
table as genome graph. A comprehensive list of all features
stored in the block table is given in Supplemental Table S1
[see Additional data file 1].
Generating different genome graphs with a different number
of diverged genomes shows that the increase of a new
sequence, and thus additional blocks, decreases with every
new genome added; thus, the genome graph is less memory
expensive than storing the genomes separately [see Addi-
tional data file 1].
Because all relevant information is stored in the genome
graph, the positional information attached to each k-mer in
the hash described earlier (linking each k-mer to its locations
in the genome) must merely store the block identifier (repre-
sented by 3 bytes) and the position within the block (1 byte).
Based on this information, the position of every base within
each of the genomes can be inferred. The 4-byte encoding
accommodates a combined length of all unique sequences of
up to 4 Gb.
Efficient read mapping requires that each k-mer generated
from one of the sequences in the genome graph can be que-
ried for its locations in constant time. This is achieved by
building a hash table connecting the k-mer (hash key) to its
positional information in the genomes (hash value). Each
hash key refers to a list of entries. Each of these entries stores
a block identifier and a block position, allowing a unique posi-
tioning of each k-mer.
Need for complex alignments
Earlier studies showed that, in a random comparison of two
natural Arabidopsis strains, typically one SNP occurs for
every 200 bp. In addition, by using early-generation Illumina
single reads, more than 60,000 small indels (1 to 3 bp) and
10,000 indels of up to several hundred base pairs have been
detected in two strains, presenting a lower boundary for the
degree of polymorphism in this species [2].
Mismatches in alignments result not only from sequence dif-
ferences, but also from sequencing errors. The error probabil-
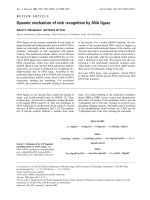
Efficient alignments against multiple genomesFigure 1
Efficient alignments against multiple genomes. (a) Only reads that are
sufficiently similar can be aligned against a single reference. (b) Separate
alignment against multiple genomes allows access to divergent regions, but
results in redundant alignments of reads that match all targets (blue). (c)
Alignments against a graph index representing multiple genomes provide
access to divergent regions without redundant alignments.
(a)
Alignments
Short reads
(b)
Alignments
Short reads
(c)
Short reads
Alignments
Genome Biology 2009, Volume 10, Issue 9, Article R98 Schneeberger et al. R98.4
Genome Biology 2009, 10:R98
Figure 2 (see legend on next page)
CTCACTGTG CCTCCAGGAGGCTA
CTCACTGTG CCTCC GGCTA
CTCACTGTGAGCCTCCAGTAGGCAA
CTCACTGTG CCTCCAGTAGGCTA
(a)
Genome 4:
Genome 3:
Genome 2:
Ref. seq. :
Conserved
Conserved
Diverged
(b)
CTC
1
ACTGTGCCTC CAGTAGGCT A
ACTGTG(-A)(-G)
ACTGTGCCTC
ACTGTGCCTC CAGGAGGCT
C(A-)(C-)(T-)(A-) GGCT
CCTCCAGTAG GCA
Block length: 10
k: 7
2 6
3
4
5
7 10
8 11
9
12
(c)
Read:
Best alignment against Genome 3:
Read:
Genome 3:
GM Alignment Format:
Transformed alignment against Ref. Seq.:
Read:
Ref. seq.:
GM Alignment Format:
CTCACTGTGAGCCTCCGGCTA
CTCACTGTGAGCCTCCGGCTA
CTCACTGTG CCTCCGGCTA
CTCACTGTG[-A][-G]CCTCCGGCTA
CTCACTGTGAGCCTCC GGCTA
CTCACTGTG CCTCCAGTAGGCTA
CTCACTGTG[-A][-G]CCTCC(A-)(G-)(T-)(A-)GGCTA
Genome Biology 2009, Volume 10, Issue 9, Article R98 Schneeberger et al. R98.5
Genome Biology 2009, 10:R98
ity of Illumina sequence reads has been shown to be less than
1% for most, but not all parts of the read [2]. In comparison
with the rate of natural variation in Arabidopsis, mismatches
from errors in individual reads outnumber true SNPs approx-
imately 17 to 1, whereas true gaps are almost as frequent as
gaps resulting from sequencing errors [see Additional data
file 1].
To avoid misplacement of individual reads, some mapping
tools favor alignments in which the cumulative base quality of
mismatching bases is low [21]. With respect to the high level
of natural differences in Arabidopsis, such a strategy could
bias alignments away from polymorphic regions. GenomeM-
apper instead performs, for each read, an alignment based on
dynamic programming similar to the Needleman-Wunsch
alignment algorithm (see [35] and Additional data file 1 for
modifications). Our method ensures that all alignments
within a given number of mismatches and gaps are reported,
provided that they share at least one identical substring of
length k when using a k-mer index. No other constraints are
imposed on the number of mismatches, gaps, or base call
quality. By default, GenomeMapper aligns against all
instances of a repeat, but it also can be instructed to align only
against a subset of them.
In our experience, resequencing projects of bacterial or
medium-sized eukaryotic genomes such as those of Arabi-
dopsis strains do not benefit from using alignments other
than the optimal ones. Nonetheless, GenomeMapper can be
configured to report not only the best scoring alignments, but
also all hits within the specified range of mismatches and gaps
(all-hits instead of best-hits strategy). As expected, this comes
with an increase in runtime, especially for highly repetitive
genomes.
Aligning sequences against the graph
GenomeMapper's alignment procedure is partitioned into
three steps, including speed optimization. The optimization
bypasses the costly calculation of alignment matrices without
a decrease in sensitivity and is based on two observations:
first, a dynamic programming alignment is required only if
the best alignment involves gaps; and, second, the frequency
of gaps is lower than that of mismatches. This is the case both
for sequencing errors in Illumina reads and for true polymor-
phisms. To cope with this, GenomeMapper applies a higher
penalty for gaps than for mismatches. Therefore, alignments
with a penalty lower than the gap penalty do not require
dynamic programming. The optimization cannot be applied
in an all-hits strategy including gapped alignments and will
not increase speed if the best alignment features gaps.
In the first step of the alignment procedure, GenomeMapper
scans the hash index for k-mers identical between read and
genome graph to detect quickly all genomes and locations
with nearly identical alignments. In the second step, Genom-
eMapper determines the location and sequence of nearly
identical maximal substrings (NIMS) between read and
genome graph. GenomeMapper will finally perform a k-
banded alignment by applying dynamic programming to
ensure a consistent gap placement [see Additional data file 1].
In detail, GenomeMapper starts by calculating the hash keys
of a predefined set of non-overlapping k-mers of the read
sequence and retrieves their genomic positions from the hash
index. The pair, consisting of a k-mer along with one of its
positions in the genome, is referred to as hit. If the best align-
ment of a read contains up to one mismatch less than the
number of non-overlapping k-mers fitting into the read, at
least one hit within this alignment can be computed (see [36]
and Additional data file 1). Each hit serves as the seed for an
ungapped alignment comparing the unmatched parts of the
read with the target sequence.
If the first step does not reveal a valid alignment, which is
always optimal because of the prerequisite that one mismatch
is less penalized than one gap, GenomeMapper starts calcu-
lating hits not only for a subset, but also for each of the k-mers
within the read sequence. If two hits are adjacent in the read
and in the genome graph, they will be merged, resulting in so-
called extended hits. If a single mismatch between read and
genome sequence is adjacent to extended hits on either side,
GenomeMapper can bridge this mismatch by merging the
extended hits now harboring this mismatch. Once all hits are
maximally extended (they now constitute NIMSs), the read
has to be aligned against the regions determined by each of
the NIMS, aborting as soon as the best possible alignment will
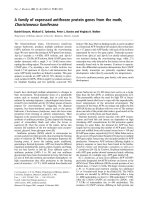
GenomeMapper's graph index structureFigure 2 (see previous page)
GenomeMapper's graph index structure. (a) Examples of orthologous sequences in four divergent genomes. Sequences at the beginning and end of each
fragment are shared (underlaid with green boxes). Divergent regions start k-1 positions (in this case, six positions) before the first true variable position,
to account for the k-mer length used for the hash-key calculation. (b) Graph structure created by these sequences, with k-mer length 7, and maximal
block length of 10 (instead of 256) for reasons of illustration. The number attached to each block is its unique identifier. Note that blocks do not occupy
their maximal block length after an indel, exemplified by blocks 3 and 8. Blocks 1 and 12 correspond to sequences identical in all four genomes and are
present only once in the index structure. Arrows between the blocks visualize the edges between the nodes in the genome graph as they are stored in the
block table [see Table S1 in Additional data file 1]. (c) Alignment of a read against the most similar genome, Genome 3, with a 2-bp insertion. Although the
insertion also is observed in Genome 2, the 4-bp deletion downstream in Genome 3 makes the read more similar to it than to Genome 2. The
transformed alignment of the read against the original reference sequence (Ref. seq.) includes the 4-bp deletion (as supported by Genome 3) given in
parentheses (green), whereas the 2-bp insertion (which is supported neither by Genome 3 nor by the reference sequence) is annotated like a mismatch by
using square brackets.
Genome Biology 2009, Volume 10, Issue 9, Article R98 Schneeberger et al. R98.6
Genome Biology 2009, 10:R98
be worse than the mismatch and gap constraints [see Addi-
tional data file 1].
To retrieve the genomic sequence for the alignments, Genom-
eMapper must follow the links between blocks. Starting from
the block harboring the hit or NIMS, GenomeMapper follows
the edges of the genome graph to generate a target sequence
for the alignment. If multiple blocks reside next to one of
these blocks, each of the branches will generate a separate tar-
get sequence for an independent alignment. Note that
GenomeMapper will not concatenate sequences from differ-
ent genomes. The alignment phase is implemented with an
efficient parallelization, which substantially reduces runtime.
It is distributed in a master-slave model on a shared-memory
architecture. All alignment threads can access the genome
data and the read data. The master thread distributes individ-
ual hits by signaling each alignment thread and collects the
results. The number of threads used by the parallel imple-
mentation is a user-defined parameter that can be adjusted to
the hardware.
The parallel version of GenomeMapper relies on POSIX
threads to manage the individual compute threads efficiently.
POSIX threads are available for all relevant platforms
(including Linux, Mac OS, and Windows).
Representation of the alignments
Independent of the algorithm used to detect the best align-
ments, GenomeMapper will report two different representa-
tions of the alignment. The first one constitutes the alignment
of the read against the genome to which it is most similar (ref-
erence-free alignment). Because commonly used tools for
alignment consensus analysis such as MAQ, Mosaik, SHORE,
and VAAL [1,2,18,37] report base calls based on the location
relative to one reference sequence, GenomeMapper imple-
ments a second alignment representation, which transforms
the strain alignment into an alignment against the reference
sequence. This reference-based alignment can then be used
as input for one of the tools mentioned earlier. Which of the
genomes constitutes the 'reference sequence' is defined in the
index creation. As the reference sequence is not necessarily
the most similar sequence to the read, the reference-based
alignment can feature more mismatches and gaps than the
strain alignment and can exceed the user-defined constraints.
This transformation generates two categories of mismatches
in the reference-based alignment. The first category contains
mismatches that are unique to the read sequence. The second
consists of mismatches identical between the read and the
strain it was aligned with, but different from the reference
sequence. Such mismatches are more likely to represent true
polymorphisms, because they have already been previously
observed. GenomeMapper indicates the different types of
mismatches by using round and square brackets (Figure 2c).
We have updated SHORE's [2] consensus analysis to exploit
this additional information (see section, Impact on Rese-
quencing).
Position descriptors for reference-free and reference-
based alignments
An alignment is typically anchored by the position of the 5'
nucleotide in the target sequence at which the alignment
starts. Because different genomes may feature indels of dif-
ferent lengths, however, even for identical sites, positional
information can become ambiguous. The decision for one of
the locations only (e.g., that of the reference genome) would
overvalue the reference.
Currently the sole community-wide accepted description of a
genomic location is the corresponding nucleotide within the
reference sequence, which easily accommodates gaps, but not
insertions, relative to the reference. We therefore imple-
mented two position descriptors into GenomeMapper. The
first refers to the particular genome against which the align-
ment was performed (the strain alignment). The second rep-
resents the position of the alignment against the reference
(the reference alignment). Insertions are annotated by using
the upstream reference position followed by the position of
the inserted nucleotide within the insertion, separated by a
decimal point (e.g., "80359.12" describes the 12th nucleotide
within the insertion after position 80359 of the reference).
Strain alignments transformed to reference alignments lose
their reference-free characteristic and therefore are immedi-
ately comparable with conventional mapping results.
Comparison with other mapping tools
GenomeMapper also can be used for alignments against a sin-
gle target genome. This allowed us to compare runtime and
sensitivity of GenomeMapper (version 0.3.1s) with those of
four other popular mapping tools: SOAP (version 1.11 [19]),
soap2 (version 2.01 [20]), bowtie (version 0.9.8 [16]), and
MAQ (version 0.7.1 [18]). SOAP and MAQ were previously
compared with bowtie [16], but with a human target. Here we
aligned against the Arabidopsis Col-0 reference genome [38]
with seed length set to 12. All tests were performed on 10
independent read sets, each consisting of 500,000 reads ran-
domly sampled from reads generated in this work for the Ara-
bidopsis Est-1 strain (see later). We tried to run all alignment
tools with optimal parameters to achieve the best possible
sensitivity and runtime [see Supplemental Table S2 in Addi-
tional data file 1 for command lines of all runs]. To make them
directly comparable with GenomeMapper, we set SOAP,
soap2, and MAQ to report all repetitive best hits rather than
a random subset of them, even though this comes with an
additional investment in runtime. All tests were performed
on a compute server with eight cores (two AMD Opteron quad
core processors) and 32 GB RAM. Figure 3 compares average
runtimes, measured as the wall clock, as well as sensitivity of
all alignments and of gapped alignments, both measured as
the number of reads that could be aligned. As this analysis is
based on real data for which no gold-standard sequence infor-
Genome Biology 2009, Volume 10, Issue 9, Article R98 Schneeberger et al. R98.7
Genome Biology 2009, 10:R98
Performance of GenomeMapper compared with that of other short-read alignment toolsFigure 3
Performance of GenomeMapper compared with that of other short-read alignment tools. (a) Runtime, measured as wall clock time between invocation
and termination of the program, averaged from 10 independent tests with different random sets of 500,000 short reads from Est-1. The worst test was
excluded from average calculations. Error bars indicate standard deviation. mm, gaps, and edit refer to the maximal number of mismatches, gaps and edit
operations allowed. GenomeMapper was run with four different parameter settings: the serial version; the parallel version on four cores; the serial version
merely aligning NIMS of length 13 or longer; and the parallel version aligning only NIMS of length 13 or longer. SOAP was found running on up to four
CPUs instead of only one CPU, as configured with the command line (option -p). (b) Average sensitivity, measured as the percentage of aligned reads.
Only GenomeMapper and SOAP can perform gapped alignments. (c) Average sensitivity of alignments, allowing three gaps and four mismatches with a
combined maximum of four edit operations, measured as number of reads with gapped alignments. Fractions refer to the number of all reads with gapped
alignments.
(a)
(b)
(c)
GenomeMapper only:
8560.1 (85.6%)
GenomeMapper
& SOAP:
1443.5 (14.4%)
SOAP only:
1.4 (0.0%)
40.0
50.0
60.0
70.0
80.0
90.0
GM SOAP bowtie soap2 MAQ
% mapped reads
0 mm / 0 gaps / 0 edit
2 mm / 0 gaps / 2 edit
4 mm / 0 gaps / 4 edit
4 mm / 1 gaps / 4 edit
4 mm / 3 gaps / 4 edit
80.0
80.5
81.0
81.5
82.0
82.5
GM SOAP
4 mm
3 gaps
4 edit
0 mm
0 gaps
0 edit
2 mm
0 gaps
2 edit
4 mm
0 gaps
4 edit
4 mm
1 gaps
4 edit
4 mm
3 gaps
4 edit
avg time [sec] / 500,000 reads
0
200
400
600
800
1000
1200
1400
1600
SOAP (4 cores)
GenomeMapper
GenomeMapper (4 cores)
GenomeMapper NIMS 13
GenomeMapper NIMS 13 (4 cores)
bowtie
soap2
MAQ
Genome Biology 2009, Volume 10, Issue 9, Article R98 Schneeberger et al. R98.8
Genome Biology 2009, 10:R98
mation is available, nothing is known about the true origin of
the DNA reads. We therefore took the fraction of aligned
reads as a proxy for sensitivity.
Without allowing any mismatches, little difference in runtime
or in sensitivity was found between the alignment tools, with
GenomeMapper being slower than bowtie and soap2, but
faster than SOAP and MAQ. Allowing two mismatches caused
similar increases in runtime for all tools. With respect to sen-
sitivity, more than 99% of the differences in the reads that
could be aligned with up to two mismatches resulted from dif-
ferent strategies in aligning ambiguous base calls (Ns). SOAP,
for example, aligns Ns without an alignment penalty.
Different from SOAP, GenomeMapper's runtime was drasti-
cally affected by allowing additional gaps (which are not
accommodated by the other tools tested) (Figure 3a). The first
reason for this disparity is the different alignment strategy.
SOAP allows neither gaps combined with mismatches nor
multiple gaps in the same alignment, whereas the dynamic
programming alignment in GenomeMapper supports any
combination of gaps and mismatches. Second, even though
SOAP was set to run on one processor (option -p was set to 1),
we found it running in parallel on up to four CPUs, and there-
fore using more computational power than the other tools.
By applying GenomeMapper's parallelization set to run on
four cores, runtime was reduced significantly. Parallelization
is geared toward complex alignments and did not reduce
runtime for ungapped alignments. Another way to reduce
runtime is offered by skipping alignments triggered by
NIMS/hits of length 12 (seeds that could not be extended by
at least one base, option -l, indicated by "NIMS 13" in Figure
3a), but this came at a cost of sensitivity being reduced by
0.6%.
Compared with SOAP, GenomeMapper's more accurate
alignment method resulted in higher sensitivity (Figure 3b;
compare results for 4 mm/1 gap and 4 mm/3 gaps). Consid-
ering only gapped alignments, GenomeMapper aligned more
than 5 times as many reads as SOAP (Figure 3c), whereas only
one of 500,000 reads was aligned by SOAP, but not by
GenomeMapper. This difference showcases GenomeMap-
per's ability to combine multiple gaps with mismatches in the
same alignment.
Note that the reads used for benchmarking had been quality
trimmed. This removes the common trend of read endings
having increased chances of harboring mismatches because
of higher error rates. Untrimmed reads with additional mis-
matches would have almost completely prohibited SOAP
from performing gapped alignments. This is expected to be
even more an issue with longer reads.
GenomeMapper's relatively high runtime when allowing a
large number of gaps and mismatches is explained mostly by
the enormous number of alignments performed once optimi-
zations could not reveal the best alignment. Nonetheless,
accurate alignments are important for correct read placement
in regions of high divergence and therefore justify the per-
formance loss. Whereas aligning against a genome graph
comes with additional computational costs, it greatly
increases sensitivity. One can compensate for increased runt-
ime with computing power, but reads that are never correctly
aligned in the first place are lost for further analyses.
Impact on resequencing
To examine the practical relevance of graph-based align-
ments against multiple genomes, we compared performance
with a conventional single-reference approach by using reads
from the genome of Arabidopsis strain Estland-1 (Est-1) from
Estonia, generated in the Arabidopsis thaliana 1001
Genomes Project [see Additional data file 1]. The 47.7 million
alignable single-end high-quality reads were produced on an
Illumina Genome Analyzer. After quality trimming of the
reads to 36 to 42 bp, the average depth of genome coverage
was 13 fold.
We first used the reference Arabidopsis Col-0 sequence
(TAIR8 [38]) as the alignment target. In the second analysis,
we included two Arabidopsis genomes, Bur-0 and Tsu-1 (see
Figure 4). Previous Illumina single-read sequencing and
comparison against the Col-0 reference had revealed 570,100
and 502,036 SNPs, as well as 48,999 and 47,765 indels of up
to 3 bp, respectively [2]. In addition, 16,463 and 3,007 longer
indels of up to 641 bp had been discovered from targeted de
novo assembly of highly polymorphic regions [2]. These two
genomes differ from the reference by 0.5 to 0.6%, which
reflects a lower bound of sequence divergence, given the lim-
itations of short-read analyses.
The Bur-0 and Tsu-1 genomes, together with the Col-0 refer-
ence genome, were used to build a multiple genome graph. To
take advantage of the additional information produced by the
graph-based alignments, and to make it comparable to a sin-
gle reference analysis, we updated SHORE [2], our genome-
resequencing analysis pipeline [see Additional data file 1].
This included incorporation of GenomeMapper's trans-
formed alignment representation, different scoring schemes
for previously known and newly discovered polymorphisms,
and the support of indels up to any length, restricted only by
the maximal indel length within the known genome space.
More than 1% of all reads, 0.51 million reads, could be aligned
to the genome graph, but not to the single reference. These
additional alignments resemble highly divergent regions of
Est-1, which are particularly interesting, but also constitute
the regions that are least accessible to conventional methods.
Compared with the "reference only" alignments, the graph
alignments increased the number of recovered SNPs by 15%,
of deletions by 22.6%, and of insertions by 37.2% (Table 1). In
particular, 1,551 deletions and 1,841 insertions longer than 3
Genome Biology 2009, Volume 10, Issue 9, Article R98 Schneeberger et al. R98.9
Genome Biology 2009, 10:R98
bp, with a maximum length of 641 bp and 281 bp, known from
previous de novo assembly of larger indels in Bur-0 and Tsu-
1 [2], were detected. Only a small subset of the long indels was
represented in the "reference only" analysis (two 3-bp dele-
tions can modify the sequence in the same way as one 6-bp
deletion). Because of the limitation of three gapped positions
per alignment, the vast majority of long indels could not be
discovered with the conventional "reference only" alignment.
These observations illustrate that indel detection is not lim-
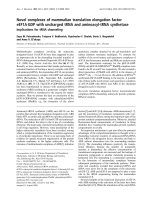
Alignments against a 17-bp insertion present in a nonreference genomeFigure 4
Alignments against a 17-bp insertion present in a nonreference genome. (a) Alignments of Est-1 reads against the graph of Arabidopsis chromosome 1,
reference positions 20,166,584 to 20,166,747. Alignments against both the Col-0 reference and the Bur-0 variant genomes are highlighted in dark gray;
alignments of reads aligning best against a single genome are highlighted in light gray. Most reads align against the Bur-0 allele, suggesting that Est-1 is more
similar to Bur-0 at this locus. In particular, the 17-bp insertion found in Bur-0 is supported by the Est-1 reads. Because of the alignment constraints
(maximum of four edit operations), these alignments could not have been performed against the Col-0 sequence only. Within the second divergent region,
indicated by a red arrow, Bur-0 has a complex change, ACC->T, relative to Col-0, with Est-1 featuring a third allele, ACC->TA. Because this change is near
the 17-bp insertion, only a subset of the alignments would have been found with single reference alignments only. For simplicity, Tsu-1, which also is
included in the graph target, is not shown here. (b) Annotation of this region with respect to the Col-0 reference genome.
At1g54020.1
Annotation
At1g54020.2
At1g54020.3
Exon 5’ UTR Intron UTR Intron
(b)
Genome graph, conserved regions
Genome graph, diverged regions,
either Bur-0 (above) or Col-0 (below)
(a)
A
Alleles absent in the genome graph
A
Alleles present in one of the genomes
A
Alleles present in both genomes
Spacer for visualization
Alignments against the Bur-0 genome.
Alignments against the Col-0 genome.
Alignments against both genomes.
Alignments against diverged regions
Alignments against conserved regions
ATATATCTTTAT TAGTATAGAGTT AAAAACGAGTACCTATAAAGAAAACTAA
ATCCCCATGAATTTTGCTGTGATTTATTCACCCCTCATCAATTTC TTACCAATCAAAATTTCCATT TAT GCTAGTTTTCTTAATGGTTAAATGATATGCATTATAGCATTATACCTATAAAGAGCGT
ATATATCTTTAA TAGTATAGAGTACC AAAAACGAGTA
TTTGCTGAGATTTATTAACCCCTCCTCAATTTCATATATCTT
ATTTGCTGTGATTTATTCACCCCTCATCAATTTCATATAT
ATTTTGCTGTGATTTTTTCACCCCTCATCAATTTCA
GTTAAATGATATGCATTATAGCATTATACCTATAAAGAGCTT
TAAT
CGTTAAATGATATGCATTATAGCATTATCCCTATCA
TTAATGGATAAATGATATGCATTATGGCATTATACCTATACT
TTCTTGATGGTTAAATGATATGCATTATAGCATTATA
AGTTTTCTTAATGGTTAAATGATATGCATTATAGCATTATCT
AACCCCATGAATTTTGCTGTGATTTATTCACCCCTCATCAAT AGTTTTCTTAATGGTTAAATGATATGCATTATAGCATTATA
GTTA TATAAAAGCGAGTAACTATAAAGAAAACAAAG
AG
ATA TATAAAAACGAGTACCTATAAAGAAAACTAA
GAGTTA TATAAAAACGAGCACCTATAAAGAAAACTAAGC
AAAGTTA TATAAAAACGAGTACCTATAAAGAAAACTAAGCT
ATAGAATTA TATAAAAACGAGTACGAATAAAGAAAA
CCATTAAGTATAGAGTTA TATAAAAACGAGTCCCTA
TCCATTTAGTATAGAGT
TA TATAAAAACGAGTACCTATAAA TAAGCTAGTTTTCTTAATGGTTAAATGATATGCATTATAG
AAAATTTCCATTTAGTATAGAGTTA TATAAAAACGAGTACTT ACTAAGCTAGTTTTCTTAATGGTTAAATGATATGCATT
AAAAAAAATTTCCATTTAGTATAGAGTTA TATAAAAAC ACTAAGCTAGTTTTCTTAATGGTTAAATGATATGCA
C
AAATCAAAATTTCCATTTAGTATAGAGTTA TATAAAAACGA AGAAAACTAAGCTAGTTTTCTTAATGGTTAAATGATATG
ATATGTCTTTATTTACCAATCAAAATTTCCATTTAGTAT AAGAAAACTAAGCTAGTTTTCTTAATGGTTAAATGATATGC
CATATATCTTTATTTACCAATCAAAATTTCCATTTAGTA AAAGATAATAAAGCTAGTTTTCTTAATGGTTTTATG
TCATATATCTTTATTTACCAATCAAAATTTCCATTTAGTA TTA TATAAAAACGAGTACCTATAAAGAAAACTAAGC
TCAATTTCATATAACTTTATTTACCAAGCAAAATTG TAGTATAGAGTTA TATAAAAACGAGTACCAGTAAAG
CTCATCAATTTCATATATCTTTATTTACGAATCAAA TAGTATAGAGTTA TATGAAAACGATTACCTATAAAT
CCCCTCATCAGTTTCATATATTTTTATTTACCAATCAAAATT TTAGTATAGAGTTA TATAAAAACGAGTACCTATAAAGAAC
TACCCTCATCAATTTCATATATCTTTA
TTTACCAATCAAAAT CATTTAGTATAGAGTTA CATAAAAACGAGTACCTATAAA
ACCAATCAAAATTTCCATTTAGTATAGACTTA TATA TATAAAGAAAACTTAGCTAGTTTTCTTCATGGTTAA
ACCAATCAAAATTTCCATTTGGTATAGAGTTA TATG TATAAAGAAAACTAAGCTAGTTTTCTTAATGGTTANA
TATTTGCCAATCAAAATTTTCATTTAGTATAGA-ATA TA TATAAAGAAAACTAAGCTAGTTTTCTTAATGGTTAAATG
CTTTA
TTTACCAATCAAAATTTCCATTTAGTATAGAGTA AAAACGAGTACCTATAAAGAAAACTAAGCTAGTTTTCTT
TTTGCTGAGATTTATTAACCCCTCCTCAATTTCATATATCTT
ATTTGCTGTGATTTATTCACCCCTCATCAATTTCATATAT
ATTTTGCTGTGATTTTTTCACCCCTCATCAATTTCA
Genome Biology 2009, Volume 10, Issue 9, Article R98 Schneeberger et al. R98.10
Genome Biology 2009, 10:R98
ited by alignment constraints, but only by the data included in
the genome graph.
The reliability of variant detection was improved as well, with
244,101 SNP calls made in the "reference only" analysis hav-
ing additional support from one of the additional genomes in
the graph (11,382 and 16,958 for deletions and insertions,
respectively). Similarly, recall rates for 1 to 3 bp indels were
drastically increased.
Validation results for single-reference and genome-graph
analysis based on 600 kb of dideoxy sequences distributed
throughout the Est-1 genome [39] are shown in Table 2. In a
typical Arabidopsis strain, about 85% of SNPs are accessible
to analysis with 36-bp single-end short reads, with the
remainder being located in repetitive regions [2]. Of 2,316
SNPs in the validation set, 85.2% were called by using
genome-graph analysis, an increase of more than 7% com-
pared with the single-reference analysis at a similar error rate
of less than 0.5%. Recall rates for indels were increased even
more, by 14.8% for insertions and 8.4% for deletions.
For a final comparison, we aligned all Est-1 reads against the
three known genomes separately, with the Bur-0 and Tsu-1
genome sequences generated by introducing all known varia-
tions into the reference Col-0 genome. As expected, nearly the
same set of reads could be aligned, but the graph alignments
were 21.3% faster than the serial alignments. This improve-
ment would be even greater if one took into account the addi-
tional analyses needed for merging and filtering of separate
and redundant alignments.
The results of the graph analysis of Est-1 can be downloaded
from the 1001 Genomes portal [33] and from TAIR [40].
Discussion
The first goal for short-read mapping tools was the design of
efficient alignment algorithms that were faster than the speed
Table 1
Recovery of Est-1 variants by using SHORE
Predicted by both anal-
yses
a
Private to genome graph
analysis
Private to reference-only
analysis
Total gain in genome graph
analysis
SNPs 401,158 66,264 5,423 15.0%
Deletions All 25,926 6,807 778 22.6%
1-3 bp 25,865 5,256 778 16.8%
≥ 4 bp 61 1,551 0 2,542%
Insertions All 22,305 9,220 678 37.2%
1-3 bp 22,285 7,379 678 29.2%
≥ 4 bp 20 1,841 0 9,205%
a
Includes variants predicted by graph analysis that have been found in the single-reference analysis in the same sequence context, although with a
differing position, resulting from ambiguous alignments. Some of the variants longer than 3 bp could be reassembled in the single-reference analysis,
by combining shorter indels.
Table 2
Validation of polymorphism predictions in Est-1
Graph analysis Single-reference analysis
N
a
Recall
b
FDR
c
Recall
b
FDR
†
SNPs 2,316 85.2% 0.4% 77.5% 0.4%
Deletions All 183 53.6% 2.0% 38.8% 2.7%
1-3 bp 132 68.2% 2.2% 53.8% 2.7%
≥ 4 bp 51 15.7% 0.0 0 n/a
Insertions All 167 53.9% 2.2% 45.5% 1.3%
1-3 bp 128 66.4% 2.3% 59.4% 1.3%
≥ 4 bp 39 12.8% 0.0 0 n/a
a
Number of known variants in 600 kb of dideoxy sequence data from [38].
b
Ratio of confirmed to the sum of confirmed and missed predictions of
the respective kind; indicates sensitivity of method.
c
False discovery rate, percentage of erroneous calls.
Genome Biology 2009, Volume 10, Issue 9, Article R98 Schneeberger et al. R98.11
Genome Biology 2009, 10:R98
with which raw data were produced. Considering that
intraspecific sequence differences are often more substantial
than previously anticipated, a major challenge is the require-
ment not to disregard or misplace too many reads. With the
rapidly increasing knowledge of variants, one could simply
align against all known genomes for a species separately. This
would not require any new methods, but it comes with the
overhead of redundant alignments in conserved regions. We
have shown that graph alignments are already superior with
information from only two divergent genomes added to the
first genome sequence produced for Arabidopsis. This advan-
tage should become much more drastic once hundreds of
genomes are incorporated into the graph structure. In addi-
tion, this should improve the workflow, as the separate han-
dling of hundreds of separate references would become
increasingly impractical.
We demonstrated that short-read alignment against a com-
plex graph representing multiple genomes not only is possi-
ble and produces meaningful results, but also provides access
to regions that are highly divergent from the first reference. In
addition, our approach reduces the number of false-positive
SNP calls caused by misalignments near indels [2]. To our
knowledge, this constitutes the first approach that efficiently
incorporates multiple references and solves resultant prob-
lems. We note in addition that the representation of multiple
genomes in a complex graph structure is not restricted to
short-read mapping or intraspecific analyses. Other applica-
tions are easily conceivable (e.g., accurate local and global
alignments of longer reads (up to whole genomes) against all
known genomes of a species or even against a structure rep-
resenting groups of related species), enabling analysis of
metagenomic samples in one step. Likewise, read alignments
against splice graphs representing known isoforms with dif-
fering exon-intron junctions would be beneficial for mRNA
analysis.
Once the species-wide genome graph of Arabidopsis covers
most common variants (see the Arabidopsis thaliana 1001
Genomes Project [32,33]), resequencing of newly collected
material will become easier, as fewer inaccessible regions
remain. A prerequisite for this are universal and community-
wide accepted positional descriptors of insertions, for which
we have advanced a proposal in this work.
Ongoing development
The steady increase in read length will improve the likelihood
that a given read spans a region of complex differences rela-
tive to the first reference. Although no theoretic limitation
exists for the lengths of global alignments (GenomeMapper
currently allows reads of up to 1,000 bp with unlimited num-
bers of mismatches or gaps), allowing more and more mis-
matches and gaps would strongly affect runtime. This could
be addressed by further increasing the efficiency of the paral-
lelization, which is already tuned to reduce runtime for long-
read alignments with numerous gaps and mismatches.
Another challenge that is conceptually similar to matching
known SNPs relative to the reference emerges from bisulfite
treatment of DNA samples for methylome analysis [41]. The
presence of cytosines that have been converted to thymines
by bisulfite can be implemented as mismatches without pen-
alty. This is currently being incorporated into GenomeMap-
per and will be supported in future versions.
Abbreviations
Bp: base pair; GB: gigabytes; indels: insertions and/or dele-
tions; k-mer: sequence signature; NIMS: nearly identical
maximal substrings; POSIX: Portable Operating System
Interface for Unix; RAM: random-access memory; SNP: sin-
gle-nucleotide polymorphism; TAIR: The Arabidopsis Infor-
mation Resource.
Authors' contributions
KS and DW designed the study. KS and JH developed and
implemented GenomeMapper. SO suggested optimizations
resulting in major speed improvements, extended SHORE for
the analysis of genome-graph alignments, and performed the
Est-1 analysis together with JH and KS. SG implemented the
parallelization, as discussed with OK. NW did the plant work
and generated the Illumina sequencing library. KS wrote the
manuscript with help from all authors.
Additional data files
The following additional data are available with the online
version of this article. Additional data file 1 describes supple-
mentary methods and discussions, as well as tables listing the
features of genome graph structure and the command lines
used for comparison of the different alignment programs.
Additional data file 1Supplementary methods and discussionsSupplementary methods and discussions, as well as tables listing the features of genome graph structure and the command lines used for comparison of the different alignment programs.Click here for file
Acknowledgements
The first three authors contributed equally to this work. The authors thank
Richard M. Clark for his initial suggestion to include polymorphism data in
short-read alignment targets, Christa Lanz for preparing libraries and run-
ning the Illumina GA, André Noll for his exemplary source code for mem-
ory-mapping files, and Felix Ott for providing indispensable help with
programming SHORE. Financial support for this work came from a Gott-
fried Wilhelm Leibniz Award of the Deutsche Forschungsgemeinschaft and
the Max Planck Society.
References
1. Hillier LW, Marth GT, Quinlan AR, Dooling D, Fewell G, Barnett D,
Fox P, Glasscock JI, Hickenbotham M, Huang W, Magrini VJ, Richt RJ,
Sander SN, Stewart DA, Stromberg M, Tsung EF, Wylie T, Schedl T,
Wilson RK, Mardis ER: Whole-genome sequencing and variant
discovery in C. elegans. Nat Methods 2008, 5:183-188.
2. Ossowski S, Schneeberger K, Clark RM, Lanz C, Warthmann N,
Weigel D: Sequencing of natural strains of Arabidopsis thaliana
with short reads. Genome Res 2008, 18:2024-2033.
3. Ahn SM, Kim TH, Lee S, Kim D, Ghang H, Kim DS, Kim BC, Kim SY,
Kim WY, Kim C, Park D, Lee YS, Kim S, Reja R, Jho S, Kim CG, Cha
JY, Kim KH, Lee B, Bhak J, Kim SJ: The first Korean genome
sequence and analysis: full genome sequencing for a socio-
ethnic group. Genome Res 2009, 19:1622-1629.
Genome Biology 2009, Volume 10, Issue 9, Article R98 Schneeberger et al. R98.12
Genome Biology 2009, 10:R98
4. Bentley DR, Balasubramanian S, Swerdlow HP, Smith GP, Milton J,
Brown CG, Hall KP, Evers DJ, Barnes CL, Bignell HR, Boutell JM, Bry-
ant J, Carter RJ, Keira Cheetham R, Cox AJ, Ellis DJ, Flatbush MR,
Gormley NA, Humphray SJ, Irving LJ, Karbelashvili MS, Kirk SM, Li H,
Liu X, Maisinger KS, Murray LJ, Obradovic B, Ost T, Parkinson ML,
Pratt MR, et al.: Accurate whole human genome sequencing
using reversible terminator chemistry. Nature 2008,
456:53-59.
5. Kim JI, Ju YS, Park H, Kim S, Lee S, Yi JH, Mudge J, Miller NA, Hong
D, Bell CJ, Kim HS, Chung IS, Lee WC, Lee JS, Seo SH, Yun JY, Woo
HN, Lee H, Suh D, Kim HJ, Yavartanoo M, Kwak M, Zheng Y, Lee MK,
Kim JY, Gokcumen O, Mills RE, Zaranek AW, Thakuria J, Wu X, et al.:
A highly annotated whole-genome sequence of a Korean
individual. Nature 2009, 460:1011-1015.
6. Ley TJ, Mardis ER, Ding L, Fulton B, McLellan MD, Chen K, Dooling
D, Dunford-Shore BH, McGrath S, Hickenbotham M, Cook L, Abbott
R, Larson DE, Koboldt DC, Pohl C, Smith S, Hawkins A, Abbott S,
Locke D, Hillier LW, Miner T, Fulton L, Magrini V, Wylie T, Glasscock
J, Conyers J, Sander N, Shi X, Osborne JR, Minx P, et al.: DNA
sequencing of a cytogenetically normal acute myeloid leu-
kaemia genome. Nature 2008, 456:66-72.
7. Mardis ER, Ding L, Dooling DJ, Larson DE, McLellan MD, Chen K,
Koboldt DC, Fulton RS, Delehaunty KD, McGrath SD, Fulton LA,
Locke DP, Magrini VJ, Abbott RM, Vickery TL, Reed JS, Robinson JS,
Wylie T, Smith SM, Carmichael L, Eldred JM, Harris CC, Walker J,
Peck JB, Du F, Dukes AF, Sanderson GE, Brummett AM, Clark E,
McMichael JF, et al.: Recurring mutations found by sequencing
an acute myeloid leukemia genome. N Engl J Med 2009. pub-
lished online August 5.
8. McKernan KJ, Peckham HE, Costa G, McLaughlin S, Tsung E, Fu Y,
Clouser C, Dunkan C, Ichikawa J, Lee C, Zhang Z, Sheridan A, Fu H,
Ranade S, Dimilanta E, Sokolsky T, Zhang L, Hendrickson C, Li B, Kot-
ler L, Stuart J, Malek J, Manning J, Antipova A, Perez D, Moore M, Hay-
ashibara K, Lyons M, Beaudoin R, Coleman B, et al.: Sequence and
structural variation in a human genome uncovered by short-
read, massively parallel ligation sequencing using two base
encoding. Genome Res 2009, 19:1527-1541.
9. Pushkarev D, Neff NF, Quake SR: Single-molecule sequencing of
an individual human genome. Nat Biotechnol 2009, 27:847-852.
10. Wang J, Wang W, Li R, Li Y, Tian G, Goodman L, Fan W, Zhang J, Li
J, Zhang J, Guo Y, Feng B, Li H, Lu Y, Fang X, Liang H, Du Z, Li D,
Zhao Y, Hu Y, Yang Z, Zheng H, Hellmann I, Inouye M, Pool J, Yi X,
Zhao J, Duan J, Zhou Y, Qin J, et al.: The diploid genome
sequence of an Asian individual. Nature 2008, 456:60-65.
11. Campagna D, Albiero A, Bilardi A, Caniato E, Forcato C, Manavski S,
Vitulo N, Valle G: PASS: a program to align short sequences.
Bioinformatics 2009, 25:967-968.
12. Coarfa C, Milosavljevic A: Pash 2.0: scaleable sequence anchor-
ing for next-generation sequencing technologies. Pac Symp
Biocomput 2008, 13:102-113.
13. Eaves HL, Gao Y: MOM: maximum oligonucleotide mapping.
Bioinformatics 2009, 25:969-970.
14. Hormozdiari F, Alkan C, Eichler EE, Sahinalp SC: Combinatorial
algorithms for structural variation detection in high-
throughput sequenced genomes. Genome Res 2009,
19:1270-1278.
15. Jiang H, Wong WH: SeqMap: mapping massive amount of oli-
gonucleotides to the genome. Bioinformatics 2008,
24:2395-2396.
16. Langmead B, Trapnell C, Pop M, Salzberg SL: Ultrafast and mem-
ory-efficient alignment of short DNA sequences to the
human genome. Genome Biol 2009, 10:R25.
17. Li H, Durbin R: Fast and accurate short read alignment with
Burrows-Wheeler transform. Bioinformatics 2009, 25:1754-1760.
18. Li H, Ruan J, Durbin R: Mapping short DNA sequencing reads
and calling variants using mapping quality scores. Genome Res
2008, 18:1851-1858.
19. Li R, Li Y, Kristiansen K, Wang J: SOAP: short oligonucleotide
alignment program. Bioinformatics 2008, 24:713-714.
20. Li R, Yu C, Li Y, Lam TW, Yiu SM, Kristiansen K, Wang J: SOAP2:
an improved ultrafast tool for short read alignment. Bioinfor-
matics 2009, 25:1966-1967.
21. Malhis N, Butterfield YS, Ester M, Jones SJ: Slider: maximum use
of probability information for alignment of short sequence
reads and SNP detection. Bioinformatics 2009, 25:6-13.
22. Ning Z, Cox AJ, Mullikin JC: SSAHA: a fast search method for
large DNA databases. Genome Res 2001, 11:1725-1729.
23. Prüfer K, Stenzel U, Dannemann M, Green RE, Lachmann M, Kelso J:
PatMaN: rapid alignment of short sequences to large data-
bases. Bioinformatics 2008, 24:1530-1531.
24. Rumble SM, Lacroute P, Dalca AV, Fiume M, Sidow A, Brudno M:
SHRiMP: accurate mapping of short color-space reads. PLoS
Comput Biol 2009, 5:e1000386.
25. Schatz MC: CloudBurst: highly sensitive read mapping with
MapReduce. Bioinformatics 2009, 25:1363-1369.
26. Smith AD, Xuan Z, Zhang MQ: Using quality scores and longer
reads improves accuracy of Solexa read mapping. BMC Bioin-
formatics 2008, 9:128.
27. Weese D, Emde A, Rausch T, Döring A, Reinert K: RazerS: fast
read mapping with sensitivity control. Genome Res 2009,
19:1646-1654.
28. Alkan C, Kidd JM, Marques-Bonet T, Aksay G, Antonacci F, Hormoz-
diari F, Kitzman JO, Baker C, Malig M, Mutlu O, Sahinalp SC, Gibbs
RA, Eichler EE: Personalized copy number and segmental
duplication maps using next-generation sequencing. Nat
Genet 2009 in press.
29. Lin H, Zhang Z, Zhang MQ, Ma B, Li M: ZOOM! Zillions of oligos
mapped. Bioinformatics 2008, 24:2431-2437.
30. Clark RM, Schweikert G, Toomajian C, Ossowski S, Zeller G, Shinn
P, Warthmann N, Hu TT, Fu G, Hinds DA, Chen H, Frazer KA, Huson
DH, Schölkopf B, Nordborg M, Rätsch G, Ecker JR, Weigel D: Com-
mon sequence polymorphisms shaping genetic diversity in
Arabidopsis thaliana . Science 2007, 317:338-342.
31. Zeller G, Clark RM, Schneeberger K, Bohlen A, Weigel D, Rätsch G:
Detecting polymorphic regions in Arabidopsis thaliana with
resequencing microarrays. Genome Res 2008,
18:918-929.
32. Weigel D, Mott R: The 1001 Genomes Project for Arabidopsis
thaliana . Genome Biol 2009, 10:107.
33. Arabidopsis thaliana 1001 Genomes Project [http://
1001genomes.org]
34. Ma B, Tromp J, Li M: PatternHunter: faster and more sensitive
homology search. Bioinformatics 2002, 18:440-445.
35. Needleman SB, Wunsch CD: A general method applicable to
the search for similarities in the amino acid sequence of two
proteins. J Mol Biol 1970, 48:443-453.
36. Ukkonen E: Approximate string-matching with q-grams and
maximal matches. Theoret Computer Sci 1992, 92:191-211.
37. Nusbaum C, Ohsumi TK, Gomez J, Aquadro J, Victor TC, Warren
RM, Hung DT, Birren BW, Lander ES, Jaffe DB: Sensitive, specific
polymorphism discovery in bacteria using massively parallel
sequencing. Nature Methods 2009, 6:67-69.
38. The Arabidopsis Genome Initiative: Analysis of the genome
sequence of the flowering plant Arabidopsis thaliana . Nature
2000, 408:796-815.
39. Nordborg M, Hu TT, Ishino Y, Jhaveri J, Toomajian C, Zheng H,
Bakker E, Calabrese P, Gladstone J, Goyal R, Jakobsson M, Kim S,
Morozov Y, Padhukasahasram B, Plagnol V, Rosenberg NA, Shah C,
Wall JD, Wang J, Zhao K, Kalbfleisch T, Schulz V, Kreitman M, Bergel-
son J: The pattern of polymorphism in Arabidopsis thaliana .
PLoS Biology 2005, 3:e196.
40. TAIR []
41. Lister R, Ecker JR: Finding the fifth base: genome-wide
sequencing of cytosine methylation. Genome Res 2009,
19:959-966.