Báo cáo y học: " A cell surface interaction network of neural leucine-rich repeat receptor" doc
Bạn đang xem bản rút gọn của tài liệu. Xem và tải ngay bản đầy đủ của tài liệu tại đây (4.49 MB, 11 trang )
Genome Biology 2009, 10:R99
Open Access
2009Söllner and WrightVolume 10, Issue 9, Article R99
Research
A cell surface interaction network of neural leucine-rich repeat
receptors
Christian Söllner
*†
and Gavin J Wright
*
Addresses:
*
Cell Surface Signalling Laboratory, Wellcome Trust Sanger Institute, Hinxton, Cambridge CB10 1HH, UK.
†
Current address: Max
Planck Institute for Developmental Biology, Department 3 (Genetics), Spemannstraße 35, 72076 Tübingen, Germany.
Correspondence: Christian Söllner. Email: Gavin J Wright. Email:
© 2009 Söllner and Wright; licensee BioMed Central Ltd.
This is an open access article distributed under the terms of the Creative Commons Attribution License ( which
permits unrestricted use, distribution, and reproduction in any medium, provided the original work is properly cited.
An extracellular neuroreceptor interaction network <p>A network of Zebrafish extracellular neuroreceptor interactions are revealed using AVEXIS, a highly stringent interaction assay.</p>
Abstract
Background: The vast number of precise intercellular connections within vertebrate nervous
systems is only partly explained by the comparatively few known extracellular guidance cues. Large
families of neural orphan receptor proteins have been identified and are likely to contribute to
these recognition processes but due to the technical difficulty in identifying novel extracellular
interactions of membrane-embedded proteins, their ligands remain unknown.
Results: To identify novel neural recognition signals, we performed a large systematic protein
interaction screen using an assay capable of detecting low affinity extracellular protein interactions
between the ectodomains of 150 zebrafish receptor proteins containing leucine-rich-repeat and/or
immunoglobulin superfamily domains. We screened 7,592 interactions to construct a network of
34 cell surface receptor-ligand pairs that included orphan receptor subfamilies such as the Lrrtms,
Lrrns and Elfns but also novel ligands for known receptors such as Robos and Unc5b. A quantitative
biochemical analysis of a subnetwork involving the Unc5b and three Flrt receptors revealed a
surprising quantitative variation in receptor binding strengths. Paired spatiotemporal gene
expression patterns revealed dynamic neural receptor recognition maps within the developing
nervous system, providing biological support for the network and revealing likely functions.
Conclusions: This integrated interaction and expression network provides a rich source of novel
neural recognition pathways and highlights the importance of quantitative systematic extracellular
protein interaction screens to mechanistically explain neural wiring patterns.
Background
Identifying the vast number of precise intercellular connec-
tions that ultimately account for higher cognitive functions in
vertebrate nervous systems, and explaining how they
develop, remains one of the main challenges facing neuro-
science [1]. Receptor proteins displayed on the surface of neu-
rons are known to relay extracellular recognition events to
elicit appropriate cellular responses such as axon guidance,
neuron migration and synapse formation, but in comparison
to the complex cellular networks that they regulate, relatively
few extracellular recognition receptor interactions have been
identified [2,3]. Comparative genome analysis and large-
scale gene expression studies, however, reveal that verte-
brates contain large families of neurally expressed receptor
Published: 18 September 2009
Genome Biology 2009, 10:R99 (doi:10.1186/gb-2009-10-9-r99)
Received: 9 June 2009
Revised: 18 August 2009
Accepted: 18 September 2009
The electronic version of this article is the complete one and can be
found online at /> Genome Biology 2009, Volume 10, Issue 9, Article R99 Söllner and Wright R99.2
Genome Biology 2009, 10:R99
proteins that are expanded relative to invertebrates [4]. These
genes are likely to account for the increased complexity of
vertebrate nervous systems and two major families are the
leucine-rich repeat (LRR) and extracellular immunoglobulin
superfamily (IgSF). The neuronal roles of some proteins con-
taining IgSF domains have been well documented (see [5] for
a review) but the functions of LRR family members are less
well characterized.
The cell surface LRR proteins cluster phylogenetically into
separate subfamilies with characteristic domain structures
(Figure 1a) [6,7]. Even within subfamilies, these genes have
discrete and dynamic expression patterns in the developing
vertebrate brain and functional analysis also suggests that
they have roles in neurodevelopment. For example, genes
from the Lrrn subfamily have roles in long-term memory for-
mation [8] and retinal development [9]. Over-expression
and/or knockdown of representative members of other sub-
families in neuronal cultures have been shown to have effects
on axon outgrowth [10-13], synapse formation [14-16] and
axon fasciculation [17]. Nogo receptor 1 (NgR1) and LINGO-
1, both members of LRR subfamilies, together with either
neurotrophin receptor p75 or TROY, form a receptor complex
for myelin components and are responsible for the inhibition
of axon regeneration in lesioned mammalian central nervous
systems [18]. In addition, genes encoding several LRR pro-
teins have been implicated in neurological disorders, includ-
ing LRRTM1 in schizophrenia [19], LRRTM3 in Alzheimer's
disease [20], SLITRK1 in Tourette's syndrome [21] and LGI1
in epilepsy [22].
Despite this involvement in neurological diseases, very little
is known about their function and especially their extracellu-
lar binding partners. Indeed, of the approximately 20 paralo-
gous subfamilies of membrane-tethered vertebrate LRR-
domain-containing receptors [7], extracellular binding part-
ners have been identified for just five: the Lingo, Lrrc4, Flrt,
Amigo and NgR subfamilies. One explanation for this dispar-
ity is that membrane-embedded receptor proteins are exper-
imentally intractable: they are generally of low abundance
and their amphipathic nature makes them difficult to solubi-
lise since they usually contain both large hydrophilic glycans
and at least one hydrophobic transmembrane region. Interac-
tions between receptor proteins are also characterised by
extremely low interaction strengths, often having half-lives of
fractions of a second when measured in their monomeric
state [23]. The fleeting nature of these interactions is neces-
sary to permit facile independent motility of migrating cells
or growth cones when many receptor proteins arrayed on
apposing cell membranes interact. These properties, how-
ever, make identifying novel extracellular recognition events
mediated through cell surface proteins technically challeng-
ing.
The aim of this study was to identify novel receptor interac-
tions that are involved in neural cellular recognition events,
focussing in particular on the LRR and also IgSF receptor
families. Furthermore, by identifying when and where each
gene of an interacting pair is expressed during neural devel-
opment, we could construct dynamic maps of the neural
intercellular recognition program. Using a recombinant pro-
tein library of 150 neural receptor ectodomains and a highly
stringent interaction assay suitable to detect low affinity
extracellular interactions, we identified extracellular binding
partners for orphan receptor families - such as the Lrrtms,
Lrrns and Elfns - and novel partners for well-characterised
receptors, including Unc5b. Paired spatiotemporal gene
expression patterns of all genes within the network revealed
when and where these interactions might occur during neural
development. This neuroreceptor interaction network with
integrated gene expression data provides a useful resource to
mechanistically explain how complex cellular neural net-
works develop.
Results
A protein interaction network of leucine-rich repeat
neuroreceptors
To identify extracellular receptor interactions involved in
neural recognition processes, we initially focused on the
zebrafish LRR family since they represent a large group of
receptor proteins expressed in the nervous system, many of
which are 'orphan' receptors. We first identified members of
this family by performing a comprehensive bioinformatics
search of the zebrafish genome. Orthologues for each of the
known type I membrane-tethered and glycophosphatidyli-
nositol-linked mammalian subfamilies [7] were identified
and at least one representative was successfully cloned by RT-
PCR, with the one exception of the Lrig subfamily (Figure 1a;
see Additional data file 4 for a comprehensive list). In total,
ectodomain expression constructs were made for 53 genes,
which accounts for the vast majority (approximately 80%) of
this class of LRR neuroreceptors in the zebrafish genome. To
identify novel interactions, we used the AVEXIS (for AVidity-
based EXtracellular Interaction Screen) assay developed in
our laboratory, which is able to detect very low affinity extra-
cellular interactions (t
1/2
≤ 0.1 s) and can be scaled to screen
thousands of binding events with a very low false positive rate
[24]. This assay requires that each ectodomain is expressed as
a monomeric biotinylated bait as well as a multimerized,
enzyme-tagged prey (Additional data file 1). In total, 49 baits
and 52 preys were expressed at sufficient levels and were then
normalized prior to screening [24]. The biotinylated mono-
mers were arrayed onto streptavidin-coated microtitre plates,
and binary interactions identified by probing these arrays
with the prey ectodomains. A primary screen between the
LRR receptors of 49 × 52 = 2,548 interaction tests was per-
formed and all positive interactions were then re-tested in
both bait-prey orientations in a validation screen using fresh
protein preparations. Seventeen interactions between 12 pro-
teins were identified and classified into two confidence cate-
gories (Figure 1b; see Materials and methods for full details).
Genome Biology 2009, Volume 10, Issue 9, Article R99 Söllner and Wright R99.3
Genome Biology 2009, 10:R99
Figure 1 (see legend on next page)
Genome Biology 2009, Volume 10, Issue 9, Article R99 Söllner and Wright R99.4
Genome Biology 2009, 10:R99
Essentially all of the interactions in the LRR neuroreceptor
network (Figure 2) were novel, with only the homophilic
Flrt1a interaction having been previously described [25]. The
network contained the first reported extracellular interac-
tions for the Lrrtm and Lrrn orphan receptor subfamilies.
Interacting receptor pairs were often found to involve several
members of a subfamily, suggesting that the interacting bind-
ing face is conserved between related proteins. For example,
all four Lrrtm subfamily members were able to form both
homo- and heterotypic interactions between themselves, and
Lrrn1 interacted with two out of four members of the Netrin-
G1 ligand/Lrrc4 subfamily [14]. We also identified interac-
tions between LRR proteins, which could not be clustered
into subfamilies such as the Islr2-Vasn interaction.
LRR neuroreceptors have binding partners within the
IgSF
Since the IgSF is a well documented receptor family for LRR
domains [26,27], we next systematically screened the LRR
proteins against a large library of 97 bait ectodomains belong-
ing to the zebrafish IgSF (see Additional data file 5 for a com-
prehensive list). In total, 52 × 97 = 5,044 interactions were
screened and positive interactions were subsequently
retested using independent protein preparations in both bait-
prey orientations. A further 17 interactions involving nine
IgSF proteins were added to our neuroreceptor interaction
network and similarly placed into two confidence categories
(Figure 1c).
All interactions within the LRR-IgSF network except one [28]
were previously unknown. The systematic nature of the
screen revealed novel extracellular interactions for well
described axon guidance receptors. For example, we identi-
fied novel LRR-domain-containing transmembrane ligands
for the receptors Robo2 and 3, which we have shown bind to
zebrafish Slit proteins (see Materials and methods) demon-
strating that they were functionally active. Robo2 interacted
with Lrrc24 and Lrrtm1, and Robo3 with Elfn1, suggesting
that the Robo receptors are able to respond to local mem-
brane-tethered signals in addition to secreted ligands such as
Slit. Similarly, Unc5b, a known receptor for Netrin [29,30],
interacted with three out of the four Flrt-family homologs [31]
(Figure 2). Other IgSF-LRR receptor interactions were found
for the Lrrtm1 protein, which interacted with three out of four
fibroblast growth factor receptor homologs in the screen
(Fgfr4, Fgfrl1a and Fgfrl1b), and novel binding partners for
both the axon guidance receptor Boc, and the myelin-associ-
ated glycoprotein Mag.
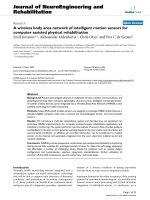
The leucine-rich repeat receptor family and its interactions in zebrafishFigure 1 (see previous page)
The leucine-rich repeat receptor family and its interactions in zebrafish. (a) Zebrafish LRR proteins were phylogenetically clustered into subfamilies using
MegAlign (DNASTAR, Madison, WI, USA), and are shown as a phylogenetic tree, together with a schematic representation of their protein architecture.
All the proteins shown were included in the protein-protein interaction screen. Protein domain abbreviations: LRR = leucine-rich repeat; LRRNT =
leucine-rich repeat amino-terminal domain; LRRCT = leucine-rich repeat carboxy-terminal domain; IG = immunoglobulin superfamily domain; FN =
fibronectin type III domain; TIR = Toll/interleukin-1 receptor homology domain; TM = transmembrane region; GPI = glycophosphatidylinositol anchor. (b)
A binding grid showing all tested reciprocal interactions between the extracellular LRR proteins using AVEXIS. The baits are vertically ordered in
correspondence to the tree shown in (a) and numbered as described in Additional data file 4. The preys are similarly ordered horizontally such that
homophilic interactions are on the diagonal from top left to bottom right. Interactions identified by a red square were positive in both screens; blue
squares were detected only once, but reciprocated. Baits 7, 8, 26 and 50 and prey 43 were expressed below the threshold required for the assay and were
therefore not included in the screen. (c) A binding grid showing the interaction screen between the zebrafish LRR and IgSF receptor families. The 97 IgSF
proteins are ordered horizontally according to their phylogenetic relationships and numbered as described in Additional data file 5; the 52 LRR proteins
are similarly arranged vertically. Red and yellow squares indicate high and lower confidence interactions, respectively, as detailed in Additional data file 6.
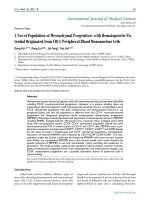
The extracellular LRR and IgSF neuroreceptor interaction networkFigure 2
The extracellular LRR and IgSF neuroreceptor interaction network.
Receptors belonging to the same paralogous subfamily are grouped and
shaded within the network, and interactions classified according to
confidence: thick lines = interaction detected in the primary screen and
independent of bait/prey orientation; thin line = other detected
interactions, including those that are orientation dependent - see Materials
and methods and Additional data file 6 for full details. An orange line
indicates that the interactions were validated using an independent
technique, either surface plasmon resonance (Figure 3) or a bead-binding
assay (Additional data file 2). IgSF-receptors = blue nodes, LRR-receptors
= red nodes.
Genome Biology 2009, Volume 10, Issue 9, Article R99 Söllner and Wright R99.5
Genome Biology 2009, 10:R99
Interaction strengths between related neuroreceptors
quantitatively vary
One notable feature of our network is that nearly half (48%)
of the receptors have more than one heterophilic binding
partner (Figure 2). In all cases, each receptor combination
had compatible expression patterns, with its multiple binding
partners expressed in overlapping territories (see below),
raising the possibility of binding competition at the cell sur-
face. In an attempt to resolve this problem, we asked to what
extent the strengths of interactions between shared receptors
might vary. We selected a subnetwork of interactions involv-
ing Unc5b and the Flrt paralogs and determined their relative
interaction strengths using monomeric proteins and surface
plasmon resonance. The ectodomain of Unc5b was expressed
as a secreted Cd4d3+4-6His-tagged protein using mamma-
lian cells, purified and eluted as a monodisperse peak using
gel filtration (data not shown). The equilibrium dissociation
constant (K
D
) was calculated by injecting dilutions of mono-
meric purified Unc5b over each of the three biotinylated Flrt
baits immobilized on a streptavidin-coated sensor chip; the
reference-subtracted binding responses at equilibrium were
plotted against the injected Unc5b concentration (Figure 3a).
As expected, the K
D
s were in the micromolar range, but varied
considerably from the relatively strong approximately 4 μM
(Flrt1b) interaction where saturable binding was evident,
through approximately 14 μM (Flrt3) to the very weak Flrt1a
interaction, the K
D
of which could not be estimated reliably
using the injected concentrations of Unc5b protein, but was
in excess of 50 μM. A kinetic analysis of the interactions was
consistent with the equilibrium binding data, with off rate
constants (k
off
) varying from 0.6 s
-1
(t
1/2
= 1.2 s) for Flrt1b to ≥
7.0 s
-1
(t
1/2
≤ 0.1 s) for Flrt1a (Figure 3b). These measurements
show that interactions between neuroreceptors within our
network have a low affinity and vary considerably in their
binding strength, even between proteins belonging to the
same paralogous family.
Paired receptor gene expression patterns reveal
dynamic cellular neural recognition maps
The binding network of IgSF and LRR receptors (Figure 2) is
a static representation of possible extracellular protein inter-
actions and does not reflect the spatial and temporal ordering
of recognition events used in the developing nervous system.
To reveal when and where these binding events might occur,
we determined the expression patterns of all the receptor
genes within the network at four stages of zebrafish embry-
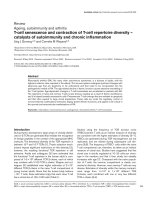
Interaction strengths between Unc5b and Flrt paralogs are surprisingly heterogeneousFigure 3
Interaction strengths between Unc5b and Flrt paralogs are surprisingly heterogeneous. (a) Equilibrium binding analysis of Unc5b and three Flrt paralogs.
Different concentrations of purified, monomeric Unc5b-Cd4d3+4-6H were injected over streptavidin-coated flow cells upon which biotinylated baits -
Flrt1a (1018 RU), Flrt1b (984 RU), Flrt3 (1027 RU) - and control Cd4d3+4 were immobilized. The amount of bound Unc5b was calculated by subtracting
responses in the control flow cells from those in the Flrt-immobilized cells once equilibrium had been reached. Equilibrium dissociation constants (K
D
s)
were obtained by fitting a non-linear binding curve to the data. To facilitate comparison, the binding responses were normalized by using the predicted
R
max
from the fit to the data. (b) Kinetic analysis of the Unc5b-Flrt interactions. Off-rate constants (k
off
) were calculated by globally fitting a first order
decay curve to the dissociation phase of three concentrations of Unc5b; half-lives (t
1/2
) were calculated as t
1/2
= ln2/k
off
. Shown are the normalized,
averaged values (error bars = ± 1 standard deviation, n = 3). On-rate constants (k
on
) were calculated in the same way using an association model and were
> 1 × 10
5
M
-1
s
-1
in all cases.
Normalized response (%)
Genome Biology 2009, Volume 10, Issue 9, Article R99 Söllner and Wright R99.6
Genome Biology 2009, 10:R99
onic development (Additional data file 7 and see Materials
and methods for details of an online database of paired stage
and orientation-matched images) using mostly two-color flu-
orescent in situ hybridization to directly compare the expres-
sion of each gene encoding an interacting receptor pair within
the same embryo.
The expression pattern of each gene encoding an interacting
pair was summarized by plotting a grid of time-resolved tis-
sues within the central and peripheral nervous systems, high-
lighting where each pair was spatiotemporally congruous
(Figure 4). All heterophilic receptor pairs had compatible
local tissue expression, usually at several different stages of
development, providing independent biological support for
the interaction network. All interacting receptor pairs were
compatibly expressed within the central nervous system
between the 24 and 48 hours post-fertilization stages, coin-
ciding with an active period of neural development, including
neuron migration and pioneering axonal outgrowth. In con-
trast, fewer of the interacting pairs were compatibly
expressed in the sensory systems, such as the retina, and
especially the acoustic and olfactory systems. Several recep-
tors were also expressed in other tissues, although these were,
in general, not spatially compatible with their binding part-
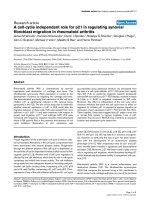
Genes encoding interacting receptors show compatible spatiotemporal expressionFigure 4
Genes encoding interacting receptors show compatible spatiotemporal expression. Genes encoding interacting receptors are paired (gene 1, gene 2) and
listed vertically; homophilic interactions were treated separately below. The expression in anatomically distinct regions of the nervous system at different
stages of embryonic development is indicated by appropriate shading within the grid. Expression key: gene 1 only = gold; gene 2 only = blue; co-expression
= pink; no expression = grey; hatched = both expressed at the same stage outside the nervous system but not in identical or neighboring tissues; cross =
expression not determined for one of the two genes. Stages: S = 14 to 19 somites; P = Prim5; Lp = Long-pec; L = Larval (4 to 5 days post-fertilization).
CNS = central nervous system.
Genome Biology 2009, Volume 10, Issue 9, Article R99 Söllner and Wright R99.7
Genome Biology 2009, 10:R99
ners in the network. This suggests the existence of additional
binding partners for these receptors outside of the developing
nervous system.
While such a summary provides a useful low resolution over-
view, further functional insights can be gained by correlating
the detailed expression patterns of interacting receptors to
known neurobiologies: we provide three examples. Firstly,
the Lrrtm family of receptors - which all interacted with each
other - showed a complex pattern within the developing brain
(Additional data file 7) but, most remarkably, were also
expressed in a largely mutually exclusive pattern within the
retina (Figure 5a-c). This receptor family could therefore be a
source of intercellular molecular recognition cues required
for directing the connectivity of the many cellular subtypes
within the retina [32]. In our second example, the gene
encoding the Vasn protein was expressed in the specialized
glial cells that make up the floor plate of the spinal cord (Fig-
ure 5d, e). Its receptor, encoded by the islr2 gene, was
expressed by head and spinal neurons (Figure 5d, e), includ-
ing motoneurons whose axons are known to directly contact
the floor plate as they innervate ipsilateral muscle fields [33].
In our last example, the expression patterns of the genes
encoding the interacting receptors Flrt1b and Unc5b were
consistent with a role in regulating retinotectal mapping:
unc5b was restricted to the dorsal region of the developing
retina from mid-somitogenesis stages whereas its binding
partner, flrt1b, was expressed in the tectum (Figure 5f).
Unc5b-Flrt1b and Flrt1b homophilic interactions could also
be involved in neural recognition within the olfactory system
since flrt1b was expressed in the olfactory epithelium, and
unc5b and flrt1b were co-expressed in the olfactory bulb at 24
hours post-fertilization (Figure 5g-i). Overall, we frequently
observed overlapping or directly abutting expression for
interacting neuroreceptors within the developing nervous
system (for examples, see Additional data file 3). Therefore,
in addition to providing starting points to identify novel sign-
aling pathways for known neurobiologies, the receptor inter-
action network coupled with the developmental gene
expression patterns is a useful resource to also identify new
potential cellular interactions on the basis that they compati-
bly express interacting receptors.
Discussion
This study represents the first step towards mapping an
extracellular interaction network between neural receptor
proteins, a resource that will be necessary to understand the
intercellular recognition processes that ultimately underlie
brain development and function. The importance of under-
standing these processes is becoming increasingly apparent
as neurological disorders are more frequently being viewed as
a product of abnormal brain development [34]. Significantly,
we have described here binding partners for three orphan
LRR receptor subfamilies, including the Lrrtms, which have
been implicated in neurological diseases, including schizo-
phrenia. While the LRR and IgSF are both large families of
neurally expressed receptors, there are several other families
of cell surface proteins that contribute to neural recognition
processes. A comprehensive extracellular network of interac-
tions within the developing nervous system will require the
addition of these protein families to our protein library. Cru-
cially, however, we have shown that the systematic screening
approach using the AVEXIS method has the scalability and
sensitivity to detect transient interactions that are not gener-
ally detected by other high throughput protein binding
assays. Beyond identifying extracellular binding partners for
orphan receptor families, this systematic unbiased method
can identify additional binding partners for receptors that
already have identified ligands.
Currently, our protein library contains approximately 80% of
the zebrafish neural LRR receptors, providing a high density
coverage for this family of receptors, which are known to be
important for synaptic target selection [35]. We have shown
that LRR receptor proteins are able to form both homophilic
and heterophilic interactions within the family but also inter-
act with receptors from the IgSF. Despite this large scale
approach, we did not identify binding partners for all LRR
subfamilies; indeed, both the Slitrk and Lrrc3 subfamilies still
have no documented extracellular binding partner. LRR
receptors are also known to bind other protein families such
as the Netrin-G [14] and tumor necrosis factor-receptor fam-
ily [36] and the future inclusion of these receptor families into
our interaction screens is likely to reveal further binding part-
ners for these subfamilies.
The AVEXIS assay was developed and implemented at a high
stringency threshold to effectively eliminate false positives so
as to produce high-quality datasets [24]. Using this strin-
gency, approximately 0.5% of unique interactions screened -
calculated using just one bait-prey orientation - are positive.
Although difficult to directly compare due to the ascertain-
ment biases inherent in selecting proteins restricted to a par-
ticular subcellular localization (such as the plasma
membrane) or screening within protein families previously
demonstrated to interact, this interaction frequency lies
between large-scale binary yeast-two-hybrid assays (approxi-
mately 0.01%) [37] and the LUMIER assay (approximately
8%) [38]. The paucity of zebrafish protein interaction data
makes a false negative rate difficult to assess, but by using the
closest mammalian orthologue, the main class of false nega-
tives comprised homophilic interactions. This is most likely
due to prey-prey associations [24], although it should be
noted that AVEXIS is able to detect some homophilic interac-
tions and further work is required to determine the biochem-
ical and/or structural reasons for this difference. A
complementary scalable assay dedicated to identifying
homophilic receptor interactions has been developed and
could be used to specifically detect this class of interactions
[39]. AVEXIS may also not be generally suitable to detect
interactions between ectodomains that interact in cis to form
Genome Biology 2009, Volume 10, Issue 9, Article R99 Söllner and Wright R99.8
Genome Biology 2009, 10:R99
Two-color wholemount in situ hybridization of interacting neuroreceptorsFigure 5
Two-color wholemount in situ hybridization of interacting neuroreceptors. (a-c) Single optical sections showing largely non-overlapping expression of the
Lrrtm genes within the inner nuclear and ganglion cell layers of 4 days post-fertilization zebrafish retinae. Note that the confluent yellow staining within the
lens represents background auto-fluorescence in both channels. (d-e) Neuron-glia interactions. (d) Dorsal view of the head region of a 32 hour post-
fertilization (hpf) zebrafish embryo: vasn (red) is expressed in the most ventral part of the spinal cord in the medial floor plate cells (FP). islr2 (green) is
expressed in fore-, mid- and hindbrain neurons; note that the midbrain neurons are in direct contact with the floor plate (arrows). (e) Lateral view of the
developing spinal cord of a 24 hpf zebrafish embryo showing discrete cells within the spinal cord (SC) that are directly adjacent but dorsal to the floor
plate. (f-i) Dorsal views of a 24 hpf zebrafish embryo showing expression of unc5b (green) and its interacting partner flrt1b (red). (f) unc5b is expressed in
the dorsal retina (arrows) and the ear (arrowheads), flrt1b in the dorsal regions of the lateral midbrain and mid-hindbrain boundary; expression is also
detectable in the vestibulo-acoustic ganglion (asterisks). (g-i) Higher magnification of the forebrain showing that unc5b is also expressed in the medial part
of the olfactory bulb (g) where it overlaps with the flrt1b staining (h) in the olfactory bulb (OB) and olfactory epithelium (OE) (i). Scale bars: 50 μm (a-c);
80 μm (d); 40 μm (e); and 50 μm (f-i).
GCL = retinal ganglion cell layer; INL = inner nuclear layer; IPL = inner plexiform layer; L = lens; OB = olfactory bulb; OE = olfactory epithelium.
Genome Biology 2009, Volume 10, Issue 9, Article R99 Söllner and Wright R99.9
Genome Biology 2009, 10:R99
co-receptor complexes since no interaction between NgR1
and Lingo1 ectodomains was detected [40]. During the prep-
aration of this manuscript, an independent study reported the
Flrt3-Unc5b interaction in Xenopus and demonstrated its
role in cell adhesion processes during early embryogenesis
[28].
The systematic nature of our screening approach revealed
that many receptors have multiple binding partners with
compatible expression patterns, raising the possibility of
binding competition at the cell surface. While parameters
such as abundance, local clustering and accessibility will also
influence binding in vivo, the intrinsic binding affinity of a
ligand for its receptor is important for resolving and measur-
ing these effects. The finding that the three Flrt paralogs have
different binding affinities for the Unc5b receptor, spanning
at least an order of magnitude, was surprising and is likely to
influence their ability to initiate signaling in vivo. Quantita-
tive measurements of adhesion receptors in the immune sys-
tem have shown that solution interaction strengths weaker
than approximately 50 μM are unlikely to be high enough to
support spontaneous interactions at physiological surface
densities, highlighting the functional relevance of these meas-
urements [41].
Conclusions
We have initially focused on two large families of neural
receptor proteins - LRR and IgSF - as a starting point to begin
a systematic approach to identify all extracellular recognition
events required in the development of the vertebrate nervous
system. In principle, this approach could be applied to other
receptor families and secreted ligands. We anticipate that
these networks of recognition receptors interpreted in the
context of their corresponding gene expression patterns will
provide a valuable new resource for neurobiology and will
stimulate further research into the functional role of these
interactions.
Materials and methods
Zebrafish husbandry
Zebrafish were maintained on a 14/10 hour light/dark cycle at
28.5°C according to UK Home Office and local institutional
regulations, and staged according to Kimmel [42]. Embryos
used for in situ hybridization were the progeny of a WIK/alb
outcross; alb/alb embryos were used where endogenous pig-
ment obscured staining signals.
Gene cloning and ectodomain library construction
The entire predicted extracellular and transmembrane
regions of cell surface LRR-domain-containing genes were
amplified by RT-PCR from mixed-stage zebrafish cDNA using
oligonucleotides designed from automated gene predictions
of the zebrafish genome [43]. PCR products were either
cloned or used as further templates to amplify predicted ecto-
domains, which were ligated into a mammalian expression
vector based on pTT3 [44]. The protein library was produced
as previously described [24].
Interaction screen
Interactions were identified using the AVEXIS procedure as
described [24]. Each plate contained both negative and posi-
tive controls as shown in Additional data file 1. Negative con-
trols were the plate prey presented to the baits rat Cd4d3+4
(well H7), Cd200R (H8) and Cd200 (H9). Positive controls
were Cd200R prey and Cd200 bait (H10) and the Cd200 bait
diluted 1:10 (H11) and 1:100 (H12). Fifty-two LRR prey pro-
teins were systematically screened against 49 LRR and 97
IgSF ectodomain bait proteins derived from membrane-
bound receptors [24]. The vast majority of the LRRs and 28
of the IgSF proteins (indicated in Additional data file 5) were
initially screened in both bait-prey orientations. Protein pairs
that showed positive interactions in the first-pass screen were
re-expressed and systematically re-screened in the same
matrix-style manner as both baits and preys in an independ-
ent validation screen. Interactions that were positive in the
first screen and could be detected in a reciprocal fashion were
considered as high confidence interactions. Other interac-
tions, such as those that were dependent upon the bait-prey
orientation, were regarded as lower confidence interactions.
Full details of the screening results are shown in Additional
data file 6 and the protein interactions from this publication
have been submitted to the International Molecular
Exchange Consortium (IMEx) [45] through IntAct (pmid:
17145710) and assigned the identifier IM-11659. Expected
interactions, including those between the zebrafish Robo and
Slit orthologs, were detected in subsequent and ongoing
interaction screens showing that the recombinant proteins
are functionally active and full details are available at IntAct:
Robo1-Slit1b, 2, 3 (EBI-2268920, EBI-2269164, EBI-
2269173), Robo2-Slit2 (EBI-2269141) and Robo3-Slit1b, 2
(EBI-2269026, EBI-2268001).
Fluorescent bead binding
The extracellular regions of rat Cd200, Lrrn1, Vasn, Robo2,
Lrrtm1, Unc5b and Flrt3 used in the AVEXIS screening were
cloned into a pTT3-based expression vector to produce a chi-
meric construct that contained the transmembrane domains
of the rat Cd200R and the green fluorescent protein in the
cytoplasmic region. HEK293E cells were transfected with
these constructs, harvested 2 to 3 days later, washed three
times in phosphate-buffered saline/1% bovine serum albu-
min, vortexed and approximately 5 × 10
5
cells aliquoted into
each well of a flat-bottomed 96-well microtitre plate. Interac-
tions were then detected using a modified version of the fluo-
rescent bead binding experiments described in [46]. Cells
were then presented to biotinylated bait proteins immobi-
lised around streptavidin-coated Nile Red fluorescent 0.4 to
0.6 μm microbeads (Spherotech Inc., Lake Forest, IL, USA) at
a ratio of approximately 120 beads per cell. After incubating
for an hour on ice the cells and beads were resuspended in
Genome Biology 2009, Volume 10, Issue 9, Article R99 Söllner and Wright R99.10
Genome Biology 2009, 10:R99
250 μl of phosphate-buffered saline/1% bovine serum albu-
min and analyzed for binding events using a BD LSR II flow
cytometer and the data were analysed using FlowJo v7.5.3
software (Tree Star, Inc., Ashland, OR, USA).
Protein purification and BIAcore analysis
Protein purification and BIAcore analysis were performed as
described [24]. Briefly, the ectodomain of Unc5b was pro-
duced in mammalian cells as a Cd4d3+4-6His-tagged protein
and purified on a 1 ml His-Trap column (GE Healthcare,
Amersham, Bucks, UK). Protein aggregates, which are known
to influence kinetic experiments, were removed by gel filtra-
tion using a 125 ml Superose6 column prior to BIAcore anal-
ysis. The indicated amounts of the Flrt-Cd4d3+4-bio baits
were immobilized onto a streptavidin-coated sensor chip and
approximate molar equivalents of Cd4d3+4-bio were used as
a reference. All binding studies were performed in HBS-EP
buffer (GE Healthcare, Amersham, Bucks, UK) at zebrafish
physiological temperature (28°C). Flow rates of 100 μl min
-1
were used for kinetic studies to minimize rebinding effects
and data were collected at the maximum rate of 10 Hz. Equi-
librium dissociation and both on and off rate constants were
calculated using the appropriate fitting model in the BIAeval-
uation software.
In situ hybridization
Fluorescent two-color wholemount in situ hybridizations
were essentially carried out as described [47]. RNA probes
were prepared from a template amplified from the protein
expression constructs encoding the entire ectodomain frag-
ments. To facilitate comparison, single color images of the
gene expression patterns at several stages of development
were stage and orientation-matched and are presented in an
online database at [48]. Expression data are also publicly
available at [49].
Microscopy
Fluorescently labeled zebrafish embryos were mounted in
Vectashield mounting medium (Vector Laboratories, Burlin-
game, CA, USA) and images were captured either on a Leica
SP5 confocal microscope or a Zeiss Axioplan2 compound
microscope fitted with a Volocity OptiGrid structured light
device (Improvision, Coventry, UK).
Abbreviations
AVEXIS: avidity-based extracellular interaction screen; IgSF:
immunoglobulin superfamily; LRR: leucine-rich repeat.
Authors' contributions
CS performed all experiments and prepared the figures
except for the BIAcore analysis, which was done by GW. The
manuscript was written by GW.
Additional data files
The following additional data are available with the online
version of this paper: a figure showing an outline of the
AVEXIS procedure (Additional data file 1); a figure showing
validation of interactions using a fluorescent bead-based
assay (Additional data file 2); a figure showing that interact-
ing neuroreceptors display both complementary and overlap-
ping expression patterns in the developing brain (Additional
data file 3); a table listing the zebrafish LRR genes cloned and
used to produce recombinant ectodomains (Additional data
file 4); a table listing the 97 zebrafish IgSF ectodomain baits
(Additional data file 5); a table classifying the neuroreceptor
interactions using AVEXIS (Additional data file 6); a table
listing the spatiotemporal expression of each gene within the
interaction network (Additional data file 7).
Additional data file 1Outline of the AVEXIS procedure(a) The entire ectodomain of each LRR receptor was expressed in mammalian cells as both a bait and a prey. The bait proteins were biotinylated monomers, each containing a carboxy-terminal tag of the rat CD4 domains 3 and 4 and an enzymatically biotinylatable sequence. The prey also contained the rat CD4 tag but was followed by a pentamerization sequence derived from rat cartilage oligo-meric matrix protein (5°) and the beta-lactamase enzyme. The expression levels of both bait and prey were measured and normal-ized. (b) The library of bait proteins was arrayed on a streptavidin-coated 96-well microtiter plate and a normalized prey protein added. After a brief wash, binding was determined by adding the colorimetric beta-lactamase substrate, nitrocefin: positive wells turned red. (c) Actual screening plates showing the Islr2/Slit-like2 interaction detected in a reciprocal fashion. The left panel shows Islr2 as the bait protein and Slit-like2 as the prey; the right panel shows the interaction in the reciprocal orientation.Click here for fileAdditional data file 2Validation of interactions using a fluorescent bead-based assayInteractions identified using AVEXIS were validated by immobiliz-ing the biotinylated bait protein around a Nile Red fluorescent bead (shown on the y-axis) and presenting them to cells transfected with the extracellular regions of cell surface receptor proteins expressed as a TM-GFP chimera (x-axis). The percentage of events counted in each of the quadrants (Q1 to Q4) is shown. (a,b) Controls showing positive staining of rat Cd200-TM-GFP with rat Cd200R-coated beads (a) but not Cd4d3+4-coated beads (b). (c-f) Examples of interactions Lrrc4a-Lrrn1 (c), Islr2-Vasn (d), Lrrtm1-Robo2 (e) and Mag-Flrt3 (f) showing beads associating with transfected cells. Interactions were called as positive when beads preferentially asso-ciated with GFP-positive transfected cells (Q2:Q1 was greater than 1).Click here for fileAdditional data file 3Interacting neuroreceptors display both complementary and over-lapping expression patterns in the developing brain(a-c) Dorsal view of the zebrafish midbrain at 24 hours post-ferti-lization showing the nlrr1 gene (a) is expressed throughout the neuroepithelium of the midbrain, whereas its receptor, ngl2 (b), is restricted to two lateral midbrain domains that directly abut the nlrr1 expression domain (c). (d-f) A single optical section through the brain of a 4 days post-fertilization (dpf) zebrafish larva showing that robo2 (d) and lrrtm1 (e) are expressed in restricted patterns within all brain regions. The merge (f), shows largely non-overlap-ping, adjacent expression, particularly in a forebrain nucleus (arrowheads) and the hindbrain (arrows). (g-i) Dorsal view of the forebrain and partial midbrain of a 32 hours post-fertilization zebrafish larva showing that lingo1a (g) and lingo1b (h) are expressed in partially overlapping domains in the telencephalon (i). (j) Lateral view of a 4 dpf zebrafish larva showing robo3 expres-sion in green and elfn1 expression in red. Both genes are expressed in the habenula nucleus in the dorsal forebrain (arrowhead). (k-m) Dorsal view of the forebrain region of a 5 dpf zebrafish larva show-ing that robo3 is expressed symmetrically in both habenula nuclei (k), whereas elfn1 (l,m) is expressed asymmetrically with higher expression levels in the left nucleus (lHB). All images are two-color wholemount in situ hybridizations with anterior left; cartoons depicting the interacting receptor-ligand pairs are shown in the left panels. Scale bar: 50 μm (a-c,d-f,g-j,k-m); 93 μm (j).Click here for fileAdditional data file 4Zebrafish LRR genes cloned and used to produce recombinant ectodomainsEach gene is numbered according to its phylogenetic relationship as shown in Figure 1a and therefore clustered into LRR subfamilies as indicated. Listed for each gene are a systematic name with a cssl:d0 prefix, the current official ZFIN nomenclature, a proposed new nomenclature where appropriate (and used throughput this paper), GenBank accession number, the final carboxy-terminal amino acid of the ectodomain at which the truncation was made (the truncation site, 'Trunc.') and the closest human BLASTP match together with the percentage sequence identity.Click here for fileAdditional data file 5The 97 zebrafish IgSF ectodomain baitsEach IgSF ectodomain is numbered in the order of its phylogenetic relationship and corresponds to the numbers in the LRR-IgSF binding grid (Figure 1c). Each gene is given a systematic identifier, the cssl:d prefix, which is listed together with the current official ZFIN nomenclature (note identical gene names indicate splice var-iants), GenBank accession number and the closest human BLASP match, together with the percentage sequence identity. Twenty-eight proteins indicated by asterisks were also produced as prey proteins and, therefore, screened in both bait-prey orientations. One protein, Sc:d805 (number 28 in the table), interacted with > 50% of the library as both a prey and a bait and was therefore excluded from subsequent analysis.Click here for fileAdditional data file 6Classification of the neuroreceptor interactions using AVEXISInteractions were classified into 12 groups (A to L) according to their behavior in the interaction screen using AVEXIS as taken from [24]; according to this scheme, no class B interactions were categorized. Interactions were considered as high confidence if they were positive in the primary screen and could be detected in both bait-prey orientations in either the primary or validation screens (classes A, C, D, E, F). IntAct accession numbers for both bait-prey orientations are provided where applicable.Click here for fileAdditional data file 7Spatiotemporal expression of each gene within the interaction net-workThe expression pattern of each neuroreceptor was determined by wholemount in situ hybridization at the indicated stages during zebrafish development. Images are freely available at [49]or inte-grated with the interaction network at [48].Click here for file
Acknowledgements
We thank Bernard and Christine Thisse for high throughput in situ analysis;
Jim Stalker for the online database; Madushi Wanaguru for help with bead
binding experiments; and Seth Grant, Elisabeth Busch-Nentwich and mem-
bers of the laboratory for comments on the manuscript. Our work was
supported by the Wellcome Trust (grant number 077108/Z/05/Z) and both
a Marie Curie and Sanger postdoctoral fellowships to CS. None of the fund-
ing bodies had any influence in study design, data collection and analysis,
decision to publish, or preparation of the manuscript.
References
1. Lichtman JW, Smith SJ: Seeing circuits assemble. Neuron 2008,
60:441-448.
2. Akins MR, Biederer T: Cell-cell interactions in synaptogenesis.
Curr Opin Neurobiol 2006, 16:83-89.
3. Dickson BJ: Molecular mechanisms of axon guidance. Science
2002, 298:1959-1964.
4. Lein ES, Hawrylycz MJ, Ao N, Ayres M, Bensinger A, Bernard A, Boe
AF, Boguski MS, Brockway KS, Byrnes EJ, Chen L, Chen L, Chen TM,
Chin MC, Chong J, Crook BE, Czaplinska A, Dang CN, Datta S, Dee
NR, Desaki AL, Desta T, Diep E, Dolbeare TA, Donelan MJ, Dong
HW, Dougherty JG, Duncan BJ, Ebbert AJ, Eichele G, et al.: Genome-
wide atlas of gene expression in the adult mouse brain.
Nature 2007, 445:168-176.
5. Maness PF, Schachner M: Neural recognition molecules of the
immunoglobulin superfamily: signaling transducers of axon
guidance and neuronal migration. Nat Neurosci 2007, 10:19-26.
6. Chen Y, Aulia S, Li L, Tang BL: AMIGO and friends: an emerging
family of brain-enriched, neuronal growth modulating, type
I transmembrane proteins with leucine-rich repeats (LRR)
and cell adhesion molecule motifs. Brain Res Rev 2006,
51:265-274.
7. Dolan J, Walshe K, Alsbury S, Hokamp K, O'Keeffe S, Okafuji T, Miller
SF, Tear G, Mitchell KJ: The extracellular Leucine-Rich Repeat
superfamily; a comparative survey and analysis of evolution-
ary relationships and expression patterns. BMC Genomics 2007,
8:320.
8. Bando T, Sekine K, Kobayashi S, Watabe AM, Rump A, Tanaka M,
Suda Y, Kato S, Morikawa Y, Manabe T, Miyajima A: Neuronal leu-
cine-rich repeat protein 4 functions in hippocampus-depend-
ent long-lasting memory. Mol Cell Biol 2005, 25:4166-4175.
9. Wolfe AD, Henry JJ: Neuronal leucine-rich repeat 6 (XlNLRR-
6) is required for late lens and retina development in Xeno-
pus laevis. Dev Dyn 2006, 235:1027-1041.
10. Aruga J, Mikoshiba K: Identification and characterization of Sli-
trk, a novel neuronal transmembrane protein family con-
trolling neurite outgrowth. Mol Cell Neurosci 2003,
24:117-129.
11. Lin JC, Ho WH, Gurney A, Rosenthal A: The netrin-G1 ligand
NGL-1 promotes the outgrowth of thalamocortical axons.
Nat Neurosci 2003, 6:1270-1276.
12. Robinson M, Parsons Perez MC, Tebar L, Palmer J, Patel A, Marks D,
Sheasby A, De Felipe C, Coffin R, Livesey FJ, Hunt SP: FLRT3 is
Genome Biology 2009, Volume 10, Issue 9, Article R99 Söllner and Wright R99.11
Genome Biology 2009, 10:R99
expressed in sensory neurons after peripheral nerve injury
and regulates neurite outgrowth. Mol Cell Neurosci 2004,
27:202-214.
13. Wang CY, Chang K, Petralia RS, Wang YX, Seabold GK, Wenthold
RJ: A novel family of adhesion-like molecules that interacts
with the NMDA receptor. J Neurosci 2006, 26:2174-2183.
14. Kim S, Burette A, Chung HS, Kwon SK, Woo J, Lee HW, Kim K, Kim
H, Weinberg RJ, Kim E: NGL family PSD-95-interacting adhe-
sion molecules regulate excitatory synapse formation. Nat
Neurosci 2006, 9:1294-1301.
15. Ko J, Kim S, Chung HS, Kim K, Han K, Kim H, Jun H, Kaang BK, Kim
E: SALM synaptic cell adhesion-like molecules regulate the
differentiation of excitatory synapses. Neuron 2006,
50:233-245.
16. Linhoff MW, Lauren J, Cassidy RM, Dobie FA, Takahashi H, Nygaard
HB, Airaksinen MS, Strittmatter SM, Craig AM: An unbiased
expression screen for synaptogenic proteins identifies the
LRRTM protein family as synaptic organizers. Neuron 2009,
61:734-749.
17. Kuja-Panula J, Kiiltomaki M, Yamashiro T, Rouhiainen A, Rauvala H:
AMIGO, a transmembrane protein implicated in axon tract
development, defines a novel protein family with leucine-
rich repeats. J Cell Biol 2003, 160:963-973.
18. Yiu G, He Z: Glial inhibition of CNS axon regeneration. Nat
Rev Neurosci 2006, 7:617-627.
19. Francks C, Maegawa S, Lauren J, Abrahams BS, Velayos-Baeza A, Med-
land SE, Colella S, Groszer M, McAuley EZ, Caffrey TM, Timmusk T,
Pruunsild P, Koppel I, Lind PA, Matsumoto-Itaba N, Nicod J, Xiong L,
Joober R, Enard W, Krinsky B, Nanba E, Richardson AJ, Riley BP, Mar-
tin NG, Strittmatter SM, Moller HJ, Rujescu D, St Clair D, Muglia P,
Roos JL, et al.: LRRTM1 on chromosome 2p12 is a maternally
suppressed gene that is associated paternally with handed-
ness and schizophrenia. Mol Psychiatry 2007, 12:1129-1139.
20. Majercak J, Ray WJ, Espeseth A, Simon A, Shi XP, Wolffe C, Getty K,
Marine S, Stec E, Ferrer M, Strulovici B, Bartz S, Gates A, Xu M, Huang
Q, Ma L, Shughrue P, Burchard J, Colussi D, Pietrak B, Kahana J, Beher
D, Rosahl T, Shearman M, Hazuda D, Sachs AB, Koblan KS, Seabrook
GR, Stone DJ: LRRTM3 promotes processing of amyloid-pre-
cursor protein by BACE1 and is a positional candidate gene
for late-onset Alzheimer's disease. Proc Natl Acad Sci USA 2006,
103:17967-17972.
21. Abelson JF, Kwan KY, O'Roak BJ, Baek DY, Stillman AA, Morgan TM,
Mathews CA, Pauls DL, Rasin MR, Gunel M, Davis NR, Ercan-Sencicek
AG, Guez DH, Spertus JA, Leckman JF, Dure LSt, Kurlan R, Singer HS,
Gilbert DL, Farhi A, Louvi A, Lifton RP, Sestan N, State MW:
Sequence variants in SLITRK1 are associated with
Tourette's syndrome. Science 2005, 310:317-320.
22. Kalachikov S, Evgrafov O, Ross B, Winawer M, Barker-Cummings C,
Martinelli Boneschi F, Choi C, Morozov P, Das K, Teplitskaya E, Yu A,
Cayanis E, Penchaszadeh G, Kottmann AH, Pedley TA, Hauser WA,
Ottman R, Gilliam TC: Mutations in LGI1 cause autosomal-
dominant partial epilepsy with auditory features. Nat Genet
2002, 30:335-341.
23. Merwe PA van der, Barclay AN: Transient intercellular adhesion:
the importance of weak protein-protein interactions. Trends
Biochem Sci 1994, 19:354-358.
24. Bushell KM, Sollner C, Schuster-Boeckler B, Bateman A, Wright GJ:
Large-scale screening for novel low-affinity extracellular
protein interactions. Genome Res 2008, 18:622-630.
25. Karaulanov EE, Bottcher RT, Niehrs C: A role for fibronectin-leu-
cine-rich transmembrane cell-surface proteins in homotypic
cell adhesion. EMBO Rep 2006, 7:283-290.
26. Brose K, Bland KS, Wang KH, Arnott D, Henzel W, Goodman CS,
Tessier-Lavigne M, Kidd T: Slit proteins bind Robo receptors
and have an evolutionarily conserved role in repulsive axon
guidance. Cell 1999, 96:795-806.
27. Liu BP, Fournier A, GrandPre T, Strittmatter SM: Myelin-associated
glycoprotein as a functional ligand for the Nogo-66 receptor.
Science 2002, 297:1190-1193.
28. Karaulanov E, Bottcher RT, Stannek P, Wu W, Rau M, Ogata S, Cho
KW, Niehrs C: Unc5B interacts with FLRT3 and Rnd1 to mod-
ulate cell adhesion in Xenopus embryos. PLoS One 2009,
4:e5742.
29. Leonardo ED, Hinck L, Masu M, Keino-Masu K, Ackerman SL, Tess-
ier-Lavigne M: Vertebrate homologues of C. elegans UNC-5
are candidate netrin receptors. Nature 1997, 386:833-838.
30. Hong K, Hinck L, Nishiyama M, Poo MM, Tessier-Lavigne M, Stein E:
A ligand-gated association between cytoplasmic domains of
UNC5 and DCC family receptors converts netrin-induced
growth cone attraction to repulsion. Cell 1999, 97:927-941.
31. Haines BP, Wheldon LM, Summerbell D, Heath JK, Rigby PW: Regu-
lated expression of FLRT genes implies a functional role in
the regulation of FGF signalling during mouse development.
Dev Biol 2006, 297:14-25.
32. Mumm JS, Godinho L, Morgan JL, Oakley DM, Schroeter EH, Wong
RO: Laminar circuit formation in the vertebrate retina. Prog
Brain Res 2005, 147:155-169.
33. Jontes JD, Buchanan J, Smith SJ: Growth cone and dendrite
dynamics in zebrafish embryos: early events in synaptogene-
sis imaged in vivo. Nat Neurosci 2000, 3:231-237.
34. Ross CA, Margolis RL, Reading SA, Pletnikov M, Coyle JT: Neurobi-
ology of schizophrenia. Neuron 2006, 52:139-153.
35. Kurusu M, Cording A, Taniguchi M, Menon K, Suzuki E, Zinn K: A
screen of cell-surface molecules identifies leucine-rich
repeat proteins as key mediators of synaptic target selec-
tion. Neuron 2008, 59:972-985.
36. Wang KC, Kim JA, Sivasankaran R, Segal R, He Z: P75 interacts
with the Nogo receptor as a co-receptor for Nogo, MAG and
OMgp. Nature 2002, 420:74-78.
37. Stelzl U, Worm U, Lalowski M, Haenig C, Brembeck FH, Goehler H,
Stroedicke M, Zenkner M, Schoenherr A, Koeppen S, Timm J, Mint-
zlaff S, Abraham C, Bock N, Kietzmann S, Goedde A, Toksoz E,
Droege A, Krobitsch S, Korn B, Birchmeier W, Lehrach H, Wanker
EE: A human protein-protein interaction network: a resource
for annotating the proteome. Cell 2005, 122:957-968.
38. Barrios-Rodiles M, Brown KR, Ozdamar B, Bose R, Liu Z, Donovan
RS, Shinjo F, Liu Y, Dembowy J, Taylor IW, Luga V, Przulj N, Robinson
M, Suzuki H, Hayashizaki Y, Jurisica I, Wrana JL: High-throughput
mapping of a dynamic signaling network in mammalian cells.
Science 2005, 307:1621-1625.
39. Wojtowicz WM, Wu W, Andre I, Qian B, Baker D, Zipursky SL: A
vast repertoire of Dscam binding specificities arises from
modular interactions of variable Ig domains.
Cell 2007,
130:1134-1145.
40. Mi S, Lee X, Shao Z, Thill G, Ji B, Relton J, Levesque M, Allaire N, Per-
rin S, Sands B, Crowell T, Cate RL, McCoy JM, Pepinsky RB: LINGO-
1 is a component of the Nogo-66 receptor/p75 signaling
complex. Nat Neurosci 2004, 7:221-228.
41. Dustin ML, Golan DE, Zhu DM, Miller JM, Meier W, Davies EA,
Merwe PA van der: Low affinity interaction of human or rat T
cell adhesion molecule CD2 with its ligand aligns adhering
membranes to achieve high physiological affinity. J Biol Chem
1997, 272:30889-30898.
42. Kimmel CB, Ballard WW, Kimmel SR, Ullmann B, Schilling TF: Stages
of embryonic development of the zebrafish. Dev Dyn 1995,
203:253-310.
43. Ensembl [ />44. Durocher Y, Perret S, Kamen A: High-level and high-throughput
recombinant protein production by transient transfection of
suspension-growing human 293-EBNA1 cells. Nucleic Acids Res
2002, 30:E9.
45. The International Molecular Exchange Consortium (IMEx)
[]
46. Wright GJ, Puklavec MJ, Willis AC, Hoek RM, Sedgwick JD, Brown
MH, Barclay AN: Lymphoid/neuronal cell surface OX2 glyco-
protein recognizes a novel receptor on macrophages impli-
cated in the control of their function. Immunity 2000,
13:233-242.
47. Clay H, Ramakrishnan L: Multiplex fluorescent in situ hybridiza-
tion in zebrafish embryos using tyramide signal amplifica-
tion. Zebrafish 2005, 2:105-111.
48. A Neuroreceptor Network [ />Team30/network.shtml]
49. The Zebrafish Model Organism Database [ />bin/webdriver?MIval=aa-ZDB_home.apg]