Báo cáo y học: "A compiled and systematic reference map of nucleosome positions across the Saccharomyces cerevisiae genome" ppsx
Bạn đang xem bản rút gọn của tài liệu. Xem và tải ngay bản đầy đủ của tài liệu tại đây (1.22 MB, 11 trang )
Genome Biology 2009, 10:R109
Open Access
2009Jiang and PughVolume 10, Issue 10, Article R109
Software
A compiled and systematic reference map of nucleosome positions
across the Saccharomyces cerevisiae genome
Cizhong Jiang
*†
and B Franklin Pugh
†
Addresses:
*
Center for Eukaryotic Gene Regulation, 456 North Frear Laboratory, Department of Biochemistry and Molecular Biology, The
Pennsylvania State University, University Park, PA 16802, USA.
†
Current address: The School of Life Sciences and Technology, Tongji
University, Shanghai, 200065, PR China.
Correspondence: B Franklin Pugh. Email:
© 2009 Jiang and Pugh.; licensee BioMed Central Ltd.
This is an open access article distributed under the terms of the Creative Commons Attribution License ( which
permits unrestricted use, distribution, and reproduction in any medium, provided the original work is properly cited.
Saccharomyces nucleosome reference map<p>Different genome-wide reference maps of Saccharomyces cerevisiae nucleosome positions are compiled and can be visualized on a browser.</p>
Abstract
Nucleosomes have position-specific functions in controlling gene expression. A complete
systematic genome-wide reference map of absolute and relative nucleosome positions is needed
to minimize potential confusion when referring to the function of individual nucleosomes (or
nucleosome-free regions) across datasets. We compiled six high-resolution genome-wide maps of
Saccharomyces cerevisiae nucleosome positions from multiple labs and detection platforms, and
report new insights. Data downloads, reference position assignment software, queries, and a
visualization browser are available online />Rationale
Eukaryotic chromatin exists as a repeating unit of nucleo-
some particles [1,2], where approximately 147 bp of DNA coils
around a histone octamer [3,4]. Nucleosome positioning
makes the underlying DNA accessible or refractory. As a
result, nucleosomes can regulate processes that require
access to DNA, such as DNA replication and transcription [5].
In addition, many gene regulatory proteins interact with
nucleosomes [6]. Thus, the determination of nucleosome
positions is key to understanding genome access and how the
transcription machinery functions in vivo. Moreover, as we
learn more about distinct functional roles of individual nucle-
osome positions, it is critical that nucleosome positions be
unambiguously identified in different studies.
An early study identified nucleosome positions primarily
along chromosome III in Saccharomyces cerevisiae using a
tiled microarray approach [7]. From this study, the concept
that nucleosomes generally occupy fixed positions at genes
took hold. High-resolution microarray approaches have now
produced two complete maps of nucleosome positions in S.
cerevisiae [8,9]. With the advances in high-throughput DNA
sequencing technology, additional higher resolution genome-
wide maps of nucleosome positions have now been completed
using Roche/454 pyrosequencing [10-12] and the Illumina/
Solexa 1G sequencer [13]. Genome-wide maps of nucleosome
positions have also been produced in other species, such as in
Drosophila using Roche/454 pyrosequencing [14], in
Caenorhabditis elegans using the Applied Biosystems SOLiD
sequencer [15], and in humans using the Illumina/Solexa 1G
sequencer [16].
The genome-wide maps of nucleosome positions have shown
that nucleosomes are highly phased near the 5' end of genes,
and reside at a canonical distance from transcription start
sites (TSSs) [8-16]. Individual nucleosomes may have distinct
functions depending upon their context in and around genes.
The +1 nucleosome (the first one downstream of the TSS)
might present a barrier to transcription by RNA polymerase
II in Drosophila [14]. In addition, precise positioning of the
Published: 8 October 2009
Genome Biology 2009, 10:R109 (doi:10.1186/gb-2009-10-10-r109)
Received: 15 July 2009
Revised: 18 September 2009
Accepted: 8 October 2009
The electronic version of this article is the complete one and can be
found online at /> Genome Biology 2009, Volume 10, Issue 10, Article R109 Jiang and Pugh R109.2
Genome Biology 2009, 10:R109
+1 nucleosome may cause precise positioning of downstream
nucleosomes due to statistical principles of nucleosome pack-
aging [2,11]. Another example of a potential position-specific
function related to the +1, +2, and +3 nucleosomes may be
their preferential methylation on lysine 4 of histone H3
(H3K4me3) [16].
Just upstream of the +1 nucleosomes often resides a nucleo-
some-free region (NFR) that coincides with the promoter
region. Maintenance of this NFR may be due in part to poly
dA:dT tracts (where homopolymeric adenylate is base-paired
with homopolymeric thymidylate) in the promoter, which
resist incorporation into nucleosomes, and in part by
sequence-specific DNA binding proteins (for example, Reb1)
that help position nucleosomes [17], and by the intrinsic ten-
dency of underlying DNA sequences to wrap around the his-
tone core octamer [7,11,12,18-20]. Such positioning may also
be resisted by chromatin remodeling complexes, such as
ISW2, which preferentially moves nucleosomes into the NFR
of certain genes [9]. Nucleosomes may come and go at the dif-
ferent positions, including the NFR [13]. The -1 nucleosome
sits where many cis-regulatory elements reside and thus has
the potential to control assembly of the transcription machin-
ery in a way that no other nucleosome position can.
With individual nucleosome positions having potentially dis-
tinct functions, it is important that studies utilize a common
systematic nomenclature for identifying nucleosome posi-
tions, so as to maintain consistency in characterizing individ-
ual nucleosome function across datasets. Currently, there is
no standard in calling individual nucleosome positions, even
though several genome-wide maps of nucleosome positions
have been published. For example, the nucleosome closest to
the 3' end of a gene has been labeled as a -1 nucleosome [9],
and the rare nucleosome that appears in the NFR region has
been defined as the -1 nucleosome in humans [16]. In con-
trast, other studies have identified the -1 nucleosome as
immediately upstream of the NFR [10,11,14]. Because these
different conventions have the potential to cause confusion
and conflicting interpretations, we sought to develop a con-
vention for defining a nucleosome reference map in Saccha-
romyces. Such a convention would also be applicable to other
organisms once sufficient maps have been obtained so as to
derive a consensus reference.
In this study, we collected six sets (five published and one
unpublished) of nucleosome positions across the genome of
the conventional wild-type yeast strain S288C, under yeast
peptone dextrose (YPD) media (rich) growth condition. The
set of maps were generated from different laboratories using
different technologies [8,9,11-13], including Affymetrix 1.0
tiling arrays, and Roche/454, Illumina/Solexa, and Applied
Biosystems SOLiD genome sequencing platforms. Because
some nucleosomes were not detected in all six datasets, the
consensus of these six maps provides the most complete and
accurate set of nucleosome positions. Each reference nucleo-
some was assigned a genomic coordinate to which nucleo-
somal positions from new datasets can be linked to (see
Materials and methods). From this reference map, we catego-
rized individual nucleosomes into -1, 0, +1, +2, +3, etc. posi-
tions relative to the TSS. We constructed a nucleosome
retrieval system that allows users to extract nucleosome posi-
tions in a given region or from a list of genes. We also con-
structed an assignment system that assigns any nucleosome
position in a dataset to a reference position. The reports pro-
vide the coordinates and relative position (for example, -1, 0,
+1, etc.) of each nucleosome and its distance from the associ-
ated gene TSS. This reference map of nucleosome positions
and its associated retrieval system should have broad applica-
bility.
Implementation
A complete reference set of nucleosomes, arrays,
linkers and nucleosome-free regions
We compiled the genomic nucleosome positions from five
published datasets, and one published here (Table 1). Data-
sets 1 to 4 were produced by massively parallel DNA sequenc-
ing from three different platforms to map nucleosome
positions, whereas datasets 5 and 6 use a microarray hybrid-
ization approach from two different platforms. The vast
majority of nucleosome positions were found in most of the
six nucleosomal datasets (Figure 1a, b). Rather than report
occupancy levels as fold over background, as is common prac-
Table 1
Nucleosome datasets as input to generate the consensus nucleosomes
Set number Strain Growth condition Platform Nucleosome count Tag count
1 BY4741 YPD, 25°C Roche GS20 54,753 1,206,057
2 BY4741 YPD, 30°C Roche GS20 48,126 378,686
3 BY4741 YPD, 25°C AB SOLiD 55,124 12,477,015
4 S288C YPD, 30°C Illumina Solexa 1G 49,043 514,803
5 S288C YPD, 28°C Affymetrix 1.0 (5 bp) 63,026
6 BY4741 YPD, 30°C Affymetrix custom 70,871
References by set number: 1 [11]; 2 [12]; 3, this paper; 4 [13]; 5 [9]; 6 [8].
Genome Biology 2009, Volume 10, Issue 10, Article R109 Jiang and Pugh R109.3
Genome Biology 2009, 10:R109
Figure 1 (see legend on next page)
0
1
2
3
Nucleosome
bin count
G enomic coordinate
Browser display
0
20
40
60
80
0
1-25
26-50
51-
75
76-100
Percentage of all positions
Occupancy level
(a) (b)
(c)
(d)
(e)
(f)
Genome Biology 2009, Volume 10, Issue 10, Article R109 Jiang and Pugh R109.4
Genome Biology 2009, 10:R109
tice for chromatin immunoprecipitation (ChIP), but difficult
to define when most of the genome is occupied, we scaled
occupancy levels to range from 0 to 100% as described in the
methods. This represents a new and more versatile means of
reporting genome-wide occupancy levels.
We identified 59,915 nucleosome positions (>90% of all pos-
sible positions) that had an occupancy level of 5% in S. cere-
visiae grown in YPD media (Figure 1c; Additional data file 1).
The degree of positional phasing/fuzziness of these nucleo-
somes varied from highly positioned to essentially randomly
positioned, which we report in a quantifiable manner (Addi-
tional data file 1). Another 6,238 potential positions were suf-
ficiently large to accommodate a nucleosome but had <5%
occupancy (of which >95% had zero occupancy). The lack of
detection was not due to insufficient coverage. For example,
in dataset 3, which has not been previously published and
contains over 12 million tags (ten times more than any other
dataset), each measured nucleosome averages 160 tags. In
contrast, the potential/hypothetical positions contained no
tags (that is, the median value was zero), and were not
detected in any of the six datasets. We ruled out the possibility
that such regions are un-mappable due to technical reasons
(for example, repeated regions). Thus, many accessible
regions in the genome are truly nucleosome-free. Whether
other proteins that are bound to these regions or the underly-
ing DNA sequence exclude nucleosomes in such regions
remains to be determined.
If we assume that the most frequently encountered nucleo-
some occupancy level (in terms of tag counts) corresponds to
100% occupancy, then >95% are present at least half the time
(Figure 1d). Only approximately 4% of all detected nucleo-
somes were relatively depleted (designated as 5 to 50% occu-
pancy level, and termed nucleosome-depleted regions). We
identified 6,586 nucleosomal arrays (defined as two or more
contiguous nucleosomes, with each having >50% occupancy
level and linkers <146 bp) and 1,248 singlets (Additional data
file 1).
A browser for graphically viewing the genomic distribution of
reference nucleosomes as well as nucleosome calls from indi-
vidual datasets can be queried or browsed online [21], in a
format shown in Figure 1e. The browser also provides a
means to observe changes in nucleosome positions (due to
eviction, acquisition, or a shift, or discrepancies between
datasets - for example, see Figure S2 in Additional data file 2)
in a region of interest. Since the reference set of nucleosome
positions represents a complete set of nucleosomes in yeast
growing asynchronously in YPD media, one can identify miss-
ing nucleosomes in a test dataset.
If we define the region between the borders of adjacent nucle-
osomes as linkers, then the genome-wide distribution of link-
ers is bimodal (Figure 1f, black trace). The distribution of the
major population is centered at 15 bp. The minor distribution
is broadly distributed between approximately 100 and 200
bp, and is particularly enriched at the 5' ends of genes (green
trace). The two peaks might represent distinct functions of
linkers, the major peak being the most common distance
between nucleosomes (15 bp), and the other being roughly the
size of a displaced nucleosome. We therefore classified linkers
into two groups, partitioned at the minimum in Figure 1f:
46,241 linkers having a length of 0 to 79 bp, and 14,467 NFRs
that are 80 or more base-pairs in length. Thus, we report a
systematic definition of an NFR.
Precision of sequencing and hybridization platforms
With the reference set in place we determined the precision of
all nucleosome calls in each dataset relative to the reference
set (Figure 2). For all data sets, the median precision was
approximately 5 to 7 bp, compared to 38 bp for a randomized
set. At one extreme, the SOLiD platform (dataset 3) called
80% of the nucleosomes within 16 bp of the reference posi-
tions, while at the other extreme the Affymetrix platform
called 80% of the nucleosomes within 24 bp of the reference,
compared to 64 bp for a randomized set. This difference may
be due to any combination of differences in sample prepara-
tion, platform resolution, and bioinformatic peak calling. We
further performed the same error analysis on individual
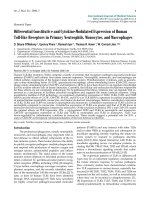
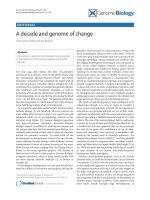
A consensus of consensus nucleosome calls defines the nucleosome reference mapFigure 1 (see previous page)
A consensus of consensus nucleosome calls defines the nucleosome reference map. (a) Screen shot of six consensus nucleosome calls (vertical
bars) in which each is a consensus of positions from six datasets (five datasets for positions 1 and 4). Shown is chromosome 11 (loci 90200 to 91200).
Narrower peaks have a stronger consensus. The trace indicates the probability landscape for a reference nucleosome. (b) Bar graph of the number of
datasets contributing to the set of reference nucleosome positions (including hypothetical positions). (c) Illustration of the types of nucleosomes in the
yeast genome, and their specifications. (d) Bar graph indicating nucleosome occupancy level throughout the genome at quartile intervals. (e) Browser
screen shot of consensus nucleosome positions from 128000 to 130600 at chromosome 1. Any location can be queried online [21]. The top track,
indicated as 'RNA', provides coordinates of different types of RNA transcripts as color-coded by the legend immediately under it. The 'Reference' track
provides the location and the positional number of the reference nucleosome calls. The darkness of the box indicates the mode-normalized nucleosomal
occupancy: light gray, < 5% (that is, in NFRs); intermediate gray, 5 to 50% (that is, in nucleosome-depleted regions); dark gray, 50 to 100%; black, 100%.
The remaining six sets of tracks represent the individual consensus calls from datasets 1 to 6 (see Materials and methods). Within each set, additional
nucleosome subsets are shown (for example, H2A.Z nucleosomes, nucleosomes from heat-shocked cells, and nucleosomes from an isw2 deletion strain).
One nucleosome may have multiple names (for example, '+1,-1') when it is associated with more than one gene (exemplified in red boxes). Asterisks
indicate this nucleosome is the terminal one to its associated gene (that is, the last one at the 3' end of the gene). (f) Smoothed frequency distribution of
all linker lengths and only those found at the 5' end of genes.
Genome Biology 2009, Volume 10, Issue 10, Article R109 Jiang and Pugh R109.5
Genome Biology 2009, 10:R109
nucleosome positions relative to the TSS, and found the
Roche/454 platform (or its associated methodology) pro-
vided the highest precision (median precision of 4 bp, with
80% of the nucleosomes called within <10 bp of the reference
position) at the +1 nucleosome position (Figure S3 in Addi-
tional data file 2). The relatively low error associated with +1
nucleosomes reflects their highly phased state. It is important
to note, however, that many other nucleosome positions are
not phased (having more fuzzy or delocalized positions), and
so reference nucleosome positions at such positions are not
particularly meaningful. Additional data file 1 reports the
fuzziness of each nucleosome, and this should be taken into
consideration when specifying nucleosome positions. For
example, shifting of a delocalized nucleosome may not be
meaningful or accurate.
Nucleosome positioning around transcription start
sites
The distribution of reference nucleosomes around the com-
bined set of all mapped 7,496 RNA polymerase II TSSs dis-
played the expected -1, NFR, +1, +2, +3, etc. canonical
arrangement, with each of the six datasets in good agreement
(Figure 3b).
We also examined the distribution of reference nucleosomes
around subclasses of genes, including TATA-less and TATA-
containing genes, cryptic unstable transcripts (CUTs), stable
untranslated transcripts (SUTs), and tRNA genes (Figure S4
in Additional data file 2), and obtained similar results as
described before [11]. However, the nucleosome distribution
around CUTs and SUTs has not been previously described.
Their nucleosome organization is essentially the same as for
other RNA polymerase II-transcribed genes, indicating that
their regulatory chromatin context may be essentially the
same as other RNA polymerase II-transcribed genes.
The uniformity of positioning relative to the TSS was evident
out to 2 kb in all datasets, with the strongest relationship
observed with TATA-less genes (Figure S4 in Additional data
file 2). The apparently strong downstream positioning
detected in sets 5 and 6 may be more a reflection of fitting
data to an idealized pattern (set 5) or idealized positioning
estimated by hidden Markov modeling (HMM; set 6) than a
true measure of individual positioning (Figure 3b). Nonethe-
less, such idealized positions were borne out (and thus vali-
dated) in the reference data set, meaning that while
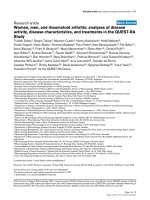
Cumulative error associated with the six sets of input nucleosomes compared against the reference setFigure 2
Cumulative error associated with the six sets of input
nucleosomes compared against the reference set. The error
interval is the midpoint distance between the reference nucleosome and
the query nucleosome. Only those reference nucleosomes that were
contributed by all six datasets were used in the error analysis. Each dataset
is described in Table 1.
The canonical -1, NFR, +1, +2, etc. nucleosome organization around the TSS is preserved in all datasetsFigure 3
The canonical -1, NFR, +1, +2, etc. nucleosome organization
around the TSS is preserved in all datasets. (a) Illustration pointing
out the -1, 0, +1 zones for systematic naming of nucleosome positions.
Also shown is the distance from the TSS to the -1 and +1 nucleosomes.
(b) Distribution of nucleosome calls in each of the six datasets around the
TSS. Only nucleosomes having >50% occupancy were considered. The
reference set is shown as a gray-filled plot. Note that sets 5 and 6
represent hidden Markov modeling or Pearson best fit of tiling array data,
and thus represent modeled positions, based upon measured periodicities.
Consensus positioning at further distances from the TSS may be artificially
maintained in those datasets.
(a)
(b)
Genome Biology 2009, Volume 10, Issue 10, Article R109 Jiang and Pugh R109.6
Genome Biology 2009, 10:R109
downstream nucleosomes tend to lose their spacing relation-
ship with the TSS (likely due to delocalization as discussed
below), they do tend towards the expected positions.
The canonical positions in datasets 1 to 4 were less uniformly
positioned relative to the TSS at position +5 and beyond (Fig-
ure 3b), suggesting that nucleosomes at positions +1, +2, +3,
and +4 may be physically distinct in some way from other
downstream nucleosomes.
Nucleosome fuzziness
Previously, we and others had reported that nucleosome
phasing was strongest at the +1 position [7,11]. Phasing pro-
gressively decreased towards the 3' end of genes, and nucleo-
somes that were not located at canonical intervals tended to
be much less phased (more fuzzy) than their canonically posi-
tioned counterparts [11]. The latter observation suggested
that nucleosomes that appear to be mis-positioned with
respect to the TSS were positionally unstable rather than hav-
ing had their location mis-identified or the TSS mis-identi-
fied. Otherwise, their fuzziness should be similar to that at
nearby canonical positions. In principle, we could not rigor-
ously exclude the possibility that the higher fuzziness of mis-
positioned nucleosomes resulted from randomly distributed
tags of contaminating DNA. Therefore, we re-opened this
question.
Instead of using the standard deviation of tag locations
around the nucleosome midpoint as a measure of fuzziness
[11], we used the standard deviation of the positional calls
made from each of the six datasets (that is, for each nucleo-
some the standard deviation was calculated for the six called
positions). By using nucleosome calls, and only those having
at least 50% occupancy, we essentially eliminated any inter-
ference by putative contaminating DNA.
In agreement with prior results, not only were more TSS-dis-
tal nucleosomes more fuzzy, but reference nucleosomes that
were not at their canonical locations were much more fuzzy
than their counterparts at canonical distances from the TSS
(as evidenced by the peaks and valleys of the red trace in Fig-
ure 4a). This further reaffirms the notion, using six independ-
ent datasets, that nucleosomes that are not at their canonical
location tend to be positionally unstable and may reflect
metastable nucleosome states (for example, remodeled states
during transcription).
Properties of nucleosomes that border nucleosome-
free regions
The borders between arrays and NFRs are of interest because
some cellular mechanism must keep nucleosomal arrays from
'spilling' into the adjacent NFR. Indeed, several studies have
implicated locally bound proteins and/or poly dA:dT tracts as
important for maintaining NFRs [7,11,12,17,19,20,22-24].
Although NFRs are found at the beginning and end of genes,
many can be found within genes. This begs the questions as to
whether such internal NFRs have the same structure as pro-
moter NFRs, which would implicate them in internal tran-
scription initiation. To address this possibility, we examined
NFRs that were 147 bp to ensure that they were large enough
to accommodate a nucleosome even though none was
detected. We compared the fuzziness of nucleosomes at such
NFR borders, and compared them to those next to promoter
NFRs (that is, at +1). As shown in Figure 4b, border nucleo-
somes at non-+1 positions had higher levels of fuzziness (red
bar graph indicated by '22') than that seen at the +1 position
(green bar graph indicated by '13'). Thus, nucleosomes that
border NFRs are not necessarily highly phased, as seen with
promoter NFRs. Apparently, some aspect of the 5' end of
Nucleosome fuzziness relative to TSSFigure 4
Nucleosome fuzziness relative to TSS. (a) Fuzziness is reported as
the standard deviation of the six input nucleosome locations for each
individual reference nucleosome. Nucleosome distances from the TSS
were binned in 10-bp intervals, and the distribution smoothed using a
three-bin moving average. Nucleosomes were required to have at least
50% occupancy and be called by at least four of the datasets. (b)
Illustration of a nucleosomal array and NFRs (147 bp) with particular
emphasis on border nucleosomes at the 5' end of genes (+1 position) in
comparison with those elsewhere in the genome (that is, not at positions -
1 through +4, nor at the end of genes nor in intergenic regions;
nucleosomes were required to have 50% occupancy and be called by at
least five datasets). Shown are bar graphs of quantitative measures of
nucleosome fuzziness, H2A.Z/H3-H4 ratios, and poly dA:dT (A
5
or T
5
)
density in all nucleosomes or NFRs (147 bp) having the illustrated
property (border versus non-border nucleosomes, and 5' NFR versus
genic NFRs).
(a)
(b)
Genome Biology 2009, Volume 10, Issue 10, Article R109 Jiang and Pugh R109.7
Genome Biology 2009, 10:R109
genes specifically positions the +1 border nucleosome and
neighboring downstream nucleosomes.
In principle, the position of a nucleosome that borders an
NFR could range from highly positioned to delocalized,
depending upon how diffuse the positioning element is. For
example, a transcription factor bound to a specific sequence
may establish well-positioned nucleosomes. However, a
nucleosome exclusion sequence such as a poly dA:dT tract
might vary in its exclusion potential based upon the length
and base composition of the tract. As a result, a neighboring
nucleosome might be presented with a 'soft' (more diffuse)
border.
To address whether poly dA:dT tracts, which are linked to
promoter NFRs, are also linked to non-promoter NFRs, we
examined whether NFRs (147 bp) that were not designated
as promoter 5' NFRs had an enrichment of poly dA:dT tracts
compared to the rest of the genome. As shown in Figure 4b
(black bars), little or no enrichment of poly dA:dT tracts was
seen in genic NFRs (147 bp) when compared to positive (5'
NFRs) and negative (genic nucleosomal) control sites. Thus,
there are likely to be other mechanisms for maintaining NFRs
besides the presence of poly dA:dT tracts.
NFRs that are far removed from the 5' and 3' ends of genes
might represent internal promoter regions for RNA polymer-
ase II. To address this possibility, we examined whether such
NFRs contained a key hallmark of promoter nucleosomes: the
replacement of H2A with the histone variant H2A.Z (histone
variant Htz1). However, we found no enrichment of H2A.Z in
genic nucleosomes that border NFRs (147 bp) compared to
positive (5' NFRs) and negative (other genic nucleosomes)
controls (Figure 4b, cyan bars). This implies that these NFRs
within genic regions were not likely internal promoters, and
is consistent with the lack of detection of TSSs in such
regions.
Taken together, these analyses suggest that promoter NFRs
are quite different from internal NFRs in terms of border
nucleosome fuzziness and H2A.Z content, and poly dA:dT
tract density. Since both types of NFRs are traversed by RNA
polymerase II, it seems unlikely that transcription per se is a
predominant determinant of such nucleosome organization.
Indeed, RNA polymerase II tends to create delocalized nucle-
osomes [6]. Rather, some aspect of promoters, such as a com-
bination of poly dA:dT tracts, positioning sequences, and
bound factors, may play a role in establishing the canonical
nucleosome organization around promoters. The higher fuzz-
iness of nucleosomes that border genic NFRs indicates that
such borders are unlikely to be generated by sequence-spe-
cific DNA binding proteins, which would be expected to pro-
duce a fixed border and highly phased border nucleosomes.
Discussion
The ability to determine the precise locations of all nucleo-
somes in a genome was unimaginable ten years ago. Yet,
remarkably, within the past two years, four different technol-
ogy platforms (high density tiling arrays, pyrosequencing,
sequencing by ligation, and sequencing by synthesis) have
provided high-resolution nucleosome maps of the yeast
genome. Each map, and thus each platform (Affymetrix,
Roche/454, Illumina/Solexa, and Applied Biosystems), are
nearly indistinguishable, reflecting a remarkable degree of
concordance. The median mapping error is on the order of 5
to 7 bp genome-wide, and <5 bp for regions of highly phased
nucleosomes. We suspect, therefore, that for nucleosome
mapping, the technology has been perfected. What 'error'
remains may largely be due to biological variation in position-
ing (phasing), which in many locations in the genome is
nearly random, and thus defining a position is meaningless.
However, strong nucleosome phasing and canonical posi-
tions exist around the start and end of genes, but even at these
positions nucleosomes might occupy multiple translational
settings in the context of a single rotational phase [10].
Our study, particularly the inclusion of a fully saturating
depth of coverage nucleosome map, reveals that NFRs are
truly devoid of nucleosomes, rather than being modestly
depleted or having low but significant levels of occupancy.
Because nucleosomes were covalently crosslinked in vivo,
and only the approximately 150 bp of DNA that is crosslinked
to histone H3 was immunopurified and gel purified in some
of the most complete datasets, transient nucleosomes would
have been detectable. However, remodeled or partial nucleo-
somes, in which less than approximately 120 bp of DNA was
protected from MNase, might have gone undetected due to
size selection of the DNA.
Other studies involving microarray hybridization of nucleo-
somal DNA and HMM of nucleosome positions provided esti-
mates of >70,000 occupied nucleosomes positions. HMM
uses a training set of well-defined positions to provide esti-
mates of positions throughout the genome. Consequently,
training on uniformly spaced positions may cause such spac-
ing to be perpetuated at regions where spacing is less defined
or occupancy is negligible. As such, we suspect that HMM
may over-estimate the uniformity and density of nucleosomes
in a genome, although our studies with other datasets validate
the HMM approach as identifying the 'best' positions, should
they become occupied or phased.
Knowing where nucleosomes reside is key to understanding
how access to DNA sequences is controlled and ultimately
how transcription, DNA replication, recombination, and
repair are controlled. Gene activation and repression are
accompanied by loss and gains of nucleosomes, respectively
[13]. Chromatin remodeling complexes will reposition nucle-
osomes to mitigate cryptic TSSs [9]. Given the location of the
-1 nucleosome in the neighborhood of the upstream activat-
Genome Biology 2009, Volume 10, Issue 10, Article R109 Jiang and Pugh R109.8
Genome Biology 2009, 10:R109
ing sequences, and the +1 nucleosome encroachment on the
TSS, it is becoming clear that individual nucleosomes will
have specific functions [6]. Therefore, a standard and facile
referencing system is helpful for identifying the most accurate
position of every nucleosome and providing a consistent
numbering system.
While the reference set of nucleosomes presented here might
provide a useful resource for systematically identifying corre-
sponding nucleosomes in orthologous experiments, it does
not supplant the need for producing a de novo reference data-
set in a set of related experiments. Such a de novo reference
state might, for biological or technical reasons, be distinct at
some loci from the reference state generated here.
Our reference system numbers nucleosomes with respect to
the TSS, starting with the 0 position, which represents the
canonical 5' NFR. Although generally nucleosome-free, the 5'
NFR may be occupied by a nucleosome at some repressed
genes (for example, PHO5 and RNR3). The referencing sys-
tem proposed here is inconsistent with the historical number-
ing system used to study several of these model genes because
those genes lacked an NFR and upstream nucleosome num-
bering thus began with -1. However, most genes have 5' NFRs,
and such nucleosome exclusion is typically hard-coded into
the DNA [23,25]. Therefore, we feel that it would be less con-
fusing to start the numbering at '0', to reflect this unique
nucleosome-free property. Nucleosomes residing at the '0'
position are likely, therefore, to represent a minority of induc-
ible genes that are repressed by placement of a nucleosome
over the core promoter.
Since individual nucleosome positions such as +1 versus +2
may have distinct functions based upon distance from the
TSS, we chose to ensure that the numbering system preserved
the canonical zones in which nucleosomes appear. Thus, the
first nucleosome downstream of the TSS is normally called
+1. However, if the first downstream nucleosome is found in
a region where the +2 nucleosome normally resides, then it is
numbered as +2 instead of as +1.
In yeast, as in some metazoans such as flies and worms, genes
are so tightly packed that a nucleosome may 'belong' to two
different genes. Our numbering system assigns both gene-
specific numbers to the same nucleosome. Thus, the full com-
plement of yeast nucleosomes can be filtered to acquire nucle-
osomes of specific positional characteristics.
The methods used here for numbering nucleosomes and
defining a reference position should be applicable to any
eukaryotic genome, once sufficient high quality and complete
nucleosomal datasets are available. Moreover, this report
may be the first such description of a systematic means of
identifying 'soft' features in the genome. The use of the term
'soft' for protein-DNA interactions reflects the fact the such
interactions are experimentally determined rather than com-
putationally predicted, and may shift from one experiment or
condition to another.
Materials and methods
Nucleosome data sets
Six independent nucleosome datasets from S. cerevisiae
strain S288C or its BY4741 derivative were used (summarized
in Table 1; Additional data file 1). Five were from previously
published datasets, and one using the SOLiD platform is pre-
sented here (set 3). Sets 1 to 4 employed DNA sequencing to
identify individual nucleosomes, and consensus positions
were estimated from clusters of sequencing reads or tags. Our
newly generated set 3 contained nearly ten times the number
of tags as all other sets combined.
For dataset 3, nucleosome preparations were made from a
BY4741 strain containing a carboxy-terminal TAP tag on his-
tone H3. Details for MNase digestion, H3 immunoprecipita-
tion, and gel purification are described elsewhere [10]. The
amplified mono-nucleosomal DNA was sequenced using
SOLiD. The SAT software tool accompanying SOLiD was used
to map tags to the yeast reference genome. Only uniquely
matched tags with up to three mismatches out of 36 bp were
used to predict nucleosomes.
For datasets 1 and 3, the 5' end of each read was considered to
be an independent measure of one border of a nucleosome. In
all cases, the goal was to identify the nucleosome midpoints
and so 73 bp was added to each read that mapped to the plus
strand, and 73 bp was subtracted from each read that mapped
to the minus strand. The reads used to predict nucleosomes in
dataset 2 have a length of 127 to 177 bp [12], which spans the
entire measured nucleosome and thus simultaneously identi-
fies both nucleosome borders. The midpoint of these reads
was treated as the nucleosome midpoint.
The nucleosome prediction program GeneTrack was
employed to make nucleosome consensus calls based on these
midpoints as was done in previous studies [10,11,14,26] (Fig-
ure 1a). Each mapped read/tag was replaced by a probability
function (having a sigma value = 20) that a measured 'call' is
located within a certain distance of the putative nucleosome
midpoint. GeneTrack then generated a smoothed probability
landscape of nucleosome locations throughout the genome by
summing the probability function over all reads. GeneTrack
makes coarse-grain calls by identifying the highest peaks (in
order of peak height) as consensus nucleosome midpoints
and setting up an exclusion zone (in this case 147 bp, corre-
sponding to the expected length of nucleosomal DNA) cen-
tered over the peak such that no new nucleosome peaks may
be called within that exclusion zone.
Datasets 4 to 6 used nucleosome calls as made by the authors
of those studies. In brief, a Parzen window-based approach
was employed to predict the borders of a nucleosome and
Genome Biology 2009, Volume 10, Issue 10, Article R109 Jiang and Pugh R109.9
Genome Biology 2009, 10:R109
then infer the nucleosome midpoint in dataset 4 [13]. Nucle-
osome calls in dataset 5 iteratively fit the probe signal of the
idealized nucleosomes to the tiling array probes. The probe
position with the best fit (that is, the highest Pearson correla-
tion coefficient) was defined as the nucleosome midpoint [9].
Nucleosome calls in dataset 6 used the probes in several char-
acterized key loci as the training data and applied HMM to
predict nucleosome positions [8]. In as much as the latter two
methods assume regular nucleosome arrays even at loci
where such regularity may not exist, such methods may over-
estimate the number of actual nucleosomes in the genome
and create a more idealized rather than actual pattern.
Determination of a measured 'reference set' of
nucleosome positions
Consensus nucleosome midpoint positions were combined
from each of the six datasets and used by GeneTrack to make
a new consensus, which we define as the measured 'reference
set' of positions. A total of 61,110 measured reference nucleo-
somes were determined (59,915 at 5% occupancy). We
assigned 5,043 non-overlapping regions that were at least 147
bp and lacked any measured nucleosome as 'hypothetical'
nucleosome placeholders (Additional data file 1; is also
described in more detail below), which, under other growth
conditions, might be occupied by nucleosomes.
Assigning individual reference nucleosomes a
numerical position relative to the TSS
Overview
Initially we sought to number each nucleosome according to
its location within well-defined consensus zones of where
nucleosomes tend to reside relative to the TSS (for example,
see Figure 3a). These zones were spaced in 165-bp intervals,
corresponding to the canonical nucleosome spacing. How-
ever, in some cases, close packing resulted in more than one
nucleosome in a zone, which thus acquired the same posi-
tional number. Thus, we opted for a more complex scheme in
which nucleosome positions in the -1 and +1 zones (where the
numbering scheme originates) were first identified (see
below). Next, adjacent nucleosomes were numbered sequen-
tially. When a linker of 147 bp was encountered, one or more
hypothetical nucleosomes were inserted, as dictated by the
size of the linker. We did this because under another cellular
state such regions may become occupied by nucleosomes.
These hypothetical nucleosomes are listed under a separate
tab in Additional data file 1. The numbering continued, utiliz-
ing the hypothetical positions, until the end of the gene was
reached. A nucleosome could be assigned more than one posi-
tional number if more than one TSS was used in assigning a
position (for example, a nucleosome may be assigned to the
+1 position for one gene, and to a -1 position for an adjacent
divergently transcribed gene).
Demarcation of the -1, 0, and +1 zones
The canonical -1, 'NFR', +1 nucleosome arrangement around
the vast majority of yeast TSSs is conserved in all the datasets.
Therefore, we used this canonical nucleosome distribution
pattern around the TSS to demarcate -1, 0, and +1 nucleo-
some zones. The valley minimum between the +1 and +2
nucleosomes demarcated the 3' border of the +1 nucleosome
zone (Figure 3a). The same level of nucleosome occupancy on
the 5' side demarcated the 5' border of the +1 nucleosome
zone. Similarly, the valley minimum between -2 and -1 nucle-
osomes demarcated the 5' border of -1 nucleosome zone, and
the same level of nucleosome occupancy demarcated the 3'
border of the -1 zone. The -1 and +1 nucleosomes bracket a
consensus NFR. Thus, we obtained three definable zones rel-
ative to the TSS to which a nucleosome midpoint may be clas-
sified: -1 (from -307 to -111), 0 (from -110 to -6), and +1 (from
-5 to +144). The canonical (peak) distance from the TSS to the
midpoint of the -1 nucleosome is -215 bp, and +55 bp for the
+1 nucleosome. These zones and the peak distance relative to
the TSS were used for labeling nucleosomes in this study.
Insertion of hypothetical nucleosomes
We found 4,628 linkers (defined in this instance as the dis-
tance from one measured reference nucleosome border to the
next adjacent measured reference nucleosome border) of size
147 bp. We inserted evenly spaced hypothetical nucleosomes
in these regions until no more sequence 147 bp existed. This
resulted in a total of 5,043 potential or hypothetical nucleo-
somes inserted, resulting in a total of 66,153 measured plus
hypothetical nucleosome positions that serve as the reference
set of nucleosome positions. The coordinates of the potential
nucleosomes are listed under two separate tabs in Additional
data file 1.
Labeling individual reference nucleosomes
Each reference nucleosome was numbered according to its
midpoint/dyad distance from the TSS according to the fol-
lowing rules. Any reference nucleosome (including both
measured and hypothetical) whose midpoint was located
within the zones -1, 0, or +1 was labeled as such. For a given
gene, we set D
i
to denote the distance of the i
th
nucleosome
midpoint from TSS, and N
i
to denote its numerical position
relative to the TSS. Therefore, N
1
equals +1. In some cases
where no nucleosome was present in the +1 nucleosome zone
because the nearest nucleosome midpoints were just outside
the +1 border, D
1
was set to the default value of +55 bp, which
is the distance from the TSS to the peak coordinate of the +1
consensus nucleosome. The number of nucleosomes that can
be placed in the region between the midpoints of the adjacent
nucleosomes was set to (D
i
- D
i-1
)/165, whose nearest integer
we denote as I
i
. Note that '165' refers to the nucleosomal core
DNA length (147 bp) plus linker (18 bp). The numerical posi-
tion of the i
th
nucleosome relative to the TSS is N
i-1
+ I
i
. In this
way, the reference genic nucleosomes were designated as +1,
+2, and so on. The last reference nucleosome midpoint
located within 50 bp downstream of and closest to the tran-
scription termination site (TTS; equivalent to the polyA addi-
tion site) was defined as the terminal nucleosome to its
associated gene. An asterisk was appended to its label as a
Genome Biology 2009, Volume 10, Issue 10, Article R109 Jiang and Pugh R109.10
Genome Biology 2009, 10:R109
postfix. Intergenic nucleosomes that were not assigned a
position label were left blank. All reference nucleosomes were
systematically named using their midpoint chromosomal
coordinates prefixed with a character 'N' (consensus meas-
ured nucleosomes) or 'P' (potential nucleosome): for exam-
ple, N1:192 represents a measured nucleosome on
chromosome 1 having a midpoint coordinate at 192.
Occupancy level of reference nucleosomes
For many analyses, the occupancy level of individual nucleo-
somes is a useful metric. We chose to utilize only the sequenc-
ing datasets (1 to 4) to provide a measure of occupancy level.
The read or tag count per nucleosome was first normalized to
the modal value for the entire dataset. This normalization
makes the assumption that the most frequent tag count cor-
responds to nucleosomes that fully occupy their position, and
is justified by the reasonable expectation that the most com-
monly observed occupancy level of a nucleosome would be
100% (a site always being occupied), inasmuch as chromo-
somes must always have the bulk of their DNA charges neu-
tralized. Thus, as a practical matter, such normalized
occupancy levels that are >100% are re-coded as 100%.
Since nonspecific DNA can contaminate nucleosome prepa-
rations, we did not want to assign nucleosome occupancy lev-
els to NFRs due to contamination. As evident in Figure S1 in
Additional data file 2, the high coverage of dataset 3 results in
a statistically high number of nucleosomes that have a very
low tag count (see the deviation of the trace from the expected
normal distribution at tag counts <20). This small deviation
may represent contamination. We calculated the standard
deviation () of the tag distribution shown in Figure S1 in
Additional data file 2. If the tag count for a nucleosome fell
below the overall mode value minus 2 (for example, tag
count <37 for set 3), then its occupancy level was set to zero.
All remaining nucleosomal tag counts between the mode
minus 2 and the mode were scaled between 1 and 99%. The
normalized occupancy was calculated for other datasets in a
similar manner. These normalized occupancy values are pre-
sented in Additional data file 1. The mean of these values
across datasets 1 to 4 were recorded as the occupancy level for
the reference nucleosome (see column 8 'occ' in Additional
data file 1).
Determination and classification of linkers and nucleosome-free
regions
Unless indicated otherwise, a linker is defined here as the dis-
tance from one measured reference nucleosome border to the
next adjacent measured reference nucleosome border, in
which each measured nucleosome has an occupancy level of
>5%. All such linkers in the genome were identified from the
reference set. If a linker was >79 bp (corresponding to the
minima between the bimodal distribution of linker lengths
shown in Figure 1f), it was named 'NFR'. All others retained
the name 'linker'. The linker/NFR that overlapped or was the
closest to the canonical location of the 5' NFR position for
RNA polymerase II-transcribed genes (58 bp upstream of the
TSS; Figure 4b) was designated as the 5' NFR or 5' linker for
the associated TSS. The same was done for TTS for 3' NFRs/
linkers. All other linkers/NFRs located between a 5' and a 3'
linker/NFR were designated as genic linkers/NFRs. The
same was done for all other identified genomic features,
assigning the closest linker/NFR to the feature start and end
coordinate (Additional data file 1).
Fuzziness of reference nucleosomes
Fuzziness is considered to be the opposite of phasing. That is,
fuzziness is the extent to which a nucleosome is delocalized at
a position. Previously, we quantified fuzziness by reporting
the standard deviation of tag distances from the consensus
position. Here we report the fuzziness of each reference
nucleosome as the standard deviation of distances of each
consensus nucleosome in a dataset from the reference posi-
tion. That is, a maximum of six consensus distances were
used to compute the fuzziness call of a reference nucleosome
(Additional data file 1).
Distribution of nucleosomes around the transcription
start site
TSSs were retrieved from the Saccharomyces Genome Data-
base [27], and combined with novel transcripts, anti-sense
transcripts, SUTs, and CUTs from published work [28,29]
after removal of the redundant transcripts (Additional data
file 1). The method for plotting the distribution of six sets of
input nucleosomes and the newly derived reference set
around the TSS was described previously [11,14]. In brief,
nucleosomes were aggregated over the genome into individ-
ual 10-bp bins determined by the nucleosome midpoint dis-
tance from the TSS. Consecutive bin counts were smoothed
using a three-bin moving average. Nucleosomes located at
less than 300 bp internal or external to a TSS or TTS of a
nearby gene were removed from the analysis to minimize
potential influence from nearby genes. For short genes or
overlapped genes, a minimum 300-bp region flanking the
TSS was analyzed. The nucleosome count was normalized to
gene number in each bin.
Assigning newly measured nucleosome positions to a
reference nucleosome position
As additional nucleosomal datasets are collected under differ-
ent cellular conditions, new insights may be best attained by
comparing each newly identified nucleosome position to its
reference position and/or coordinate. To do this we have writ-
ten a script to identify the closest reference nucleosome to
each measured nucleosome. The measured nucleosome then
acquires the profile of the reference nucleosome, such as the
associated genes and the corresponding positional number
relative to the TSS. Such a service is available via at the Penn
State Genome Cartography website [21].
Genome Biology 2009, Volume 10, Issue 10, Article R109 Jiang and Pugh R109.11
Genome Biology 2009, 10:R109
A retrieval system for reference nucleosomes
We built a retrieval system [21] to allow users to access the
reference nucleosome positions for any gene(s) in two ways:
via a browser query for a gene name or chromosomal coordi-
nate; or via a text query that produces a text file of nucleo-
somes for a gene or chromosomal coordinate, including its
numerical position and its distance from the TSS.
Abbreviations
CUT: cryptic unstable transcript; H2A.Z: histone variant
Htz1; HMM: hidden Markov modeling; NFR: nucleosome-
free region; SUT: stable untranslated transcript; TSS: tran-
scription start site; TTS: transcription termination site; YPD:
yeast peptone dextrose.
Authors' contributions
BFP conceived of the study. CJ performed the analysis, com-
putation, and software development. CJ and BFP wrote the
manuscript.
Additional data files
The following additional data are available with the online
version of this paper: an Excel table compilation of (by tabs)
nucleosome positions, hypothetical nucleosomes, arrays,
genes, and linkers/NFRs (Additional data file 1); supplemen-
tary Figures S1, S2, S3 and S4 (Additional data file 2).
Additional data file 1Nucleosome positions, hypothetical nucleosomes, arrays, genes, and linkers/NFRsNucleosome positions, hypothetical nucleosomes, arrays, genes, and linkers/NFRs.Click here for fileAdditional data file 2Figures S1, S2, S3 and S4Figures S1, S2, S3 and S4.Click here for file
Acknowledgements
This work was supported by a grant from NIH (HG004160). We thank
members of the Pugh lab for numerous helpful comments, and in particular
to Ho Sung Rhee for providing dataset 3.
References
1. Kornberg RD, Lorch Y: Twenty-five years of the nucleosome,
fundamental particle of the eukaryote chromosome. Cell
1999, 98:285-294.
2. Kornberg RD, Thomas JO: Chromatin structure; oligomers of
the histones. Science 1974, 184:865-868.
3. Luger K, Mader AW, Richmond RK, Sargent DF, Richmond TJ: Crys-
tal structure of the nucleosome core particle at 2.8 A reso-
lution. Nature 1997, 389:251-260.
4. Richmond TJ, Davey CA: The structure of DNA in the nucleo-
some core. Nature 2003, 423:145-150.
5. Ehrenhofer-Murray AE: Chromatin dynamics at DNA replica-
tion, transcription and repair. Eur J Biochem 2004,
271:2335-2349.
6. Koerber RT, Rhee HS, Jiang C, Pugh BF: Interaction of transcrip-
tional regulators with specific nucleosomes across the Sac-
charomyces genome. Mol Cell 2009, 35:889-902.
7. Yuan GC, Liu YJ, Dion MF, Slack MD, Wu LF, Altschuler SJ, Rando OJ:
Genome-scale identification of nucleosome positions in S.
cerevisiae. Science 2005, 309:626-630.
8. Lee W, Tillo D, Bray N, Morse RH, Davis RW, Hughes TR, Nislow C:
A high-resolution atlas of nucleosome occupancy in yeast.
Nat Genet 2007, 39:1235-1244.
9. Whitehouse I, Rando OJ, Delrow J, Tsukiyama T: Chromatin
remodelling at promoters suppresses antisense transcrip-
tion. Nature 2007, 450:1031-1035.
10. Albert I, Mavrich TN, Tomsho LP, Qi J, Zanton SJ, Schuster SC, Pugh
BF: Translational and rotational settings of H2A.Z nucleo-
somes across the Saccharomyces cerevisiae genome. Nature
2007, 446:572-576.
11. Mavrich TN, Ioshikhes IP, Venters BJ, Jiang C, Tomsho LP, Qi J, Schus-
ter SC, Albert I, Pugh BF: A barrier nucleosome model for sta-
tistical positioning of nucleosomes throughout the yeast
genome.
Genome Res 2008, 18:1073-1083.
12. Field Y, Kaplan N, Fondufe-Mittendorf Y, Moore IK, Sharon E, Lubling
Y, Widom J, Segal E: Distinct modes of regulation by chromatin
encoded through nucleosome positioning signals. PLoS Com-
put Biol 2008, 4:e1000216.
13. Shivaswamy S, Bhinge A, Zhao Y, Jones S, Hirst M, Iyer VR: Dynamic
remodeling of individual nucleosomes across a eukaryotic
genome in response to transcriptional perturbation. PLoS Biol
2008, 6:e65.
14. Mavrich TN, Jiang C, Ioshikhes IP, Li X, Venters BJ, Zanton SJ, Tomsho
LP, Qi J, Glaser RL, Schuster SC, Gilmour DS, Albert I, Pugh BF:
Nucleosome organization in the Drosophila genome. Nature
2008, 453:358-362.
15. Valouev A, Ichikawa J, Tonthat T, Stuart J, Ranade S, Peckham H, Zeng
K, Malek JA, Costa G, McKernan K, Sidow A, Fire A, Johnson SM: A
high-resolution, nucleosome position map of C. elegans
reveals a lack of universal sequence-dictated positioning.
Genome Res 2008, 18:1051-1063.
16. Schones DE, Cui K, Cuddapah S, Roh TY, Barski A, Wang Z, Wei G,
Zhao K: Dynamic regulation of nucleosome positioning in the
human genome. Cell 2008, 132:887-898.
17. Raisner RM, Hartley PD, Meneghini MD, Bao MZ, Liu CL, Schreiber
SL, Rando OJ, Madhani HD: Histone variant H2A.Z marks the 5'
ends of both active and inactive genes in euchromatin. Cell
2005, 123:233-248.
18. Radwan A, Younis A, Luykx P, Khuri S: Prediction and analysis of
nucleosome exclusion regions in the human genome. BMC
Genomics 2008, 9:186.
19. Iyer V, Struhl K: Poly(dA:dT), a ubiquitous promoter element
that stimulates transcription via its intrinsic DNA structure.
EMBO J 1995, 14:2570-2579.
20. Anderson JD, Widom J: Poly(dA-dT) promoter elements
increase the equilibrium accessibility of nucleosomal DNA
target sites. Mol Cell Biol 2001, 21:3830-3839.
21. Penn State Genome Cartography Project [http://
atlas.bx.psu.edu/]
22. Hartley PD, Madhani HD: Mechanisms that specify promoter
nucleosome location and identity.
Cell 2009, 137:445-458.
23. Kaplan N, Moore IK, Fondufe-Mittendorf Y, Gossett AJ, Tillo D, Field
Y, LeProust EM, Hughes TR, Lieb JD, Widom J, Segal E: The DNA-
encoded nucleosome organization of a eukaryotic genome.
Nature 2009, 458:362-366.
24. Zhang Y, Moqtaderi Z, Rattner BP, Euskirchen G, Snyder M, Kadon-
aga JT, Liu XS, Struhl K: Intrinsic histone-DNA interactions are
not the major determinant of nucleosome positions in vivo.
Nat Struct Mol Biol 2009, 16:847-852.
25. Zhang Y, Moqtaderi Z, Rattner B, Euskirchen G, Snyder M, Kadonaga
JTL, XS , Struhl K: Intrinsic histone-DNA interactions are not
the major determinant of nucleosome positions in vivo: evi-
dence against a nucleosome code. Nat Struct Mol Biol 2009,
16:847-852.
26. Albert I, Wachi S, Jiang C, Pugh BF: GeneTrack - a genomic data
processing and visualization framework. Bioinformatics 2008,
24:1305-1306.
27. Saccharomyces Genome Database [stge
nome.org]
28. Miura F, Kawaguchi N, Sese J, Toyoda A, Hattori M, Morishita S, Ito
T: A large-scale full-length cDNA analysis to explore the bud-
ding yeast transcriptome. Proc Natl Acad Sci USA 2006,
103:17846-17851.
29. Xu Z, Wei W, Gagneur J, Perocchi F, Clauder-Munster S, Camblong
J, Guffanti E, Stutz F, Huber W, Steinmetz LM: Bidirectional pro-
moters generate pervasive transcription in yeast. Nature
2009, 457:1033-1037.