Báo cáo y học: " Genome-wide comparative analysis of the Brassica rapa gene space reveals genome shrinkage and differential loss of duplicated genes after whole genome triplicatio" potx
Bạn đang xem bản rút gọn của tài liệu. Xem và tải ngay bản đầy đủ của tài liệu tại đây (1.36 MB, 18 trang )
Genome Biology 2009, 10:R111
Open Access
2009Munet al.Volume 10, Issue 10, Article R111
Research
Genome-wide comparative analysis of the Brassica rapa gene space
reveals genome shrinkage and differential loss of duplicated genes
after whole genome triplication
Jeong-Hwan Mun
*
, Soo-Jin Kwon
*
, Tae-Jin Yang
†
, Young-Joo Seol
*
,
Mina Jin
*
, Jin-A Kim
*
, Myung-Ho Lim
*
, Jung Sun Kim
*
, Seunghoon Baek
*
,
Beom-Soon Choi
‡
, Hee-Ju Yu
§
, Dae-Soo Kim
¶
, Namshin Kim
¶
, Ki-
Byung Lim
¥
, Soo-In Lee
*
, Jang-Ho Hahn
*
, Yong Pyo Lim
#
, Ian Bancroft
**
and Beom-Seok Park
*
Addresses:
*
Department of Agricultural Biotechnology, National Academy of Agricultural Science, Rural Development Administration, 150
Suin-ro, Gwonseon-gu, Suwon 441-707, Korea.
†
Department of Plant Science College of Agriculture and Life Sciences, Seoul National
University, San 56-1, Sillim-dong, Gwanak-gu, Seoul 151-921, Korea.
‡
National Instrumentation Center for Environmental Management,
College of Agriculture and Life Sciences, Seoul National University, San 56-1, Sillim-dong, Gwanak-gu, Seoul 151-921, Korea.
§
Vegetable
Research Division, National Institute of Horticultural and Herbal Science, Rural Development Administration, Tap-dong 540-41, Gwonseon-
gu, Suwon 441-440, Korea.
¶
Korea Research Institute of Bioscience and Biotechnology, 111 Gwahangno, Yuseong-gu, Daejeon 305-806, Korea.
¥
School of Applied Biosciences, College of Agriculture and Life Sciences, Kyungpook National University, Daegu 702-701, Korea.
#
Department
of Horticulture, Chungnam National University, 220 Kung-dong, Yusong-gu, Daejon 305-764, Korea.
**
John Innes Centre, Norwich Research
Centre, Colney, Norwich NR4 7UH, UK.
Correspondence: Beom-Seok Park. Email:
© 2009 Mun et al.; licensee BioMed Central Ltd.
This is an open access article distributed under the terms of the Creative Commons Attribution License ( which
permits unrestricted use, distribution, and reproduction in any medium, provided the original work is properly cited
Brassica rapa genome<p>Euchromatic regions of the Brassica rapa genome were sequenced and mapped onto the corresponding regions in the Arabidopsis thal-iana genome.</p>
Abstract
Background: Brassica rapa is one of the most economically important vegetable crops worldwide.
Owing to its agronomic importance and phylogenetic position, B. rapa provides a crucial reference
to understand polyploidy-related crop genome evolution. The high degree of sequence identity and
remarkably conserved genome structure between Arabidopsis and Brassica genomes enables
comparative tiling sequencing using Arabidopsis sequences as references to select the counterpart
regions in B. rapa, which is a strong challenge of structural and comparative crop genomics.
Results: We assembled 65.8 megabase-pairs of non-redundant euchromatic sequence of B. rapa
and compared this sequence to the Arabidopsis genome to investigate chromosomal relationships,
macrosynteny blocks, and microsynteny within blocks. The triplicated B. rapa genome contains only
approximately twice the number of genes as in Arabidopsis because of genome shrinkage. Genome
comparisons suggest that B. rapa has a distinct organization of ancestral genome blocks as a result
of recent whole genome triplication followed by a unique diploidization process. A lack of the most
recent whole genome duplication (3R) event in the B. rapa genome, atypical of other Brassica
genomes, may account for the emergence of B. rapa from the Brassica progenitor around 8 million
years ago.
Published: 12 October 2009
Genome Biology 2009, 10:R111 (doi:10.1186/gb-2009-10-10-r111)
Received: 18 May 2009
Revised: 9 August 2009
Accepted: 12 October 2009
The electronic version of this article is the complete one and can be
found online at /> Genome Biology 2009, Volume 10, Issue 10, Article R111 Mun et al. R111.2
Genome Biology 2009, 10:R111
Conclusions: This work demonstrates the potential of using comparative tiling sequencing for
genome analysis of crop species. Based on a comparative analysis of the B. rapa sequences and the
Arabidopsis genome, it appears that polyploidy and chromosomal diploidization are ongoing
processes that collectively stabilize the B. rapa genome and facilitate its evolution.
Background
Flowering plants (angiosperms) have evolved in genome size
since their sudden appearance in the fossil records of the late
Jurassic/early Cretaceous period [1-4]. The genome expan-
sion seen in angiosperms is mainly attributable to occasional
polyploidy. Estimation of polyploidy levels in angiosperms
indicates that the genomes of most (>90%) extant
angiosperms, including many crops and all the plant model
species sequenced thus far, have experienced one or more
episodes of genome doubling at some point in their evolution-
ary history [5,6]. The accumulation of transposable elements
(TEs) has been another prevalent factor in plant genome
expansion. Recent studies on maize, rice, legumes, and cotton
have demonstrated that the genome sizes of these crop spe-
cies have increased significantly due to the accumulation
and/or retention of TEs (mainly long terminal repeat retro-
transposons (LTRs)) over the past few million years; the per-
centage of the genome made up of transposons is estimated to
be between 35% and 52% based on sequenced genomes [7-
12]. However, genome expansion is not a one-way process in
plant genome evolution. Functional diversification or sto-
chastic deletion of redundant genes by accumulation of muta-
tions in polyploid genomes and removal of LTRs via
illegitimate or intra-strand recombination can result in
downsizing of the genome [13-15]. Nevertheless, neither of
the aforementioned mechanisms has been demonstrated to
occur frequently enough to balance genome size growth, and
plant genomes tend, therefore, to expand over time.
The progress in whole genome sequencing of model genomes
presents an important challenge in plant genomics: to apply
the knowledge gained from the study of model genomes to
biological and agronomical questions of importance in crop
species. Comparative structural genomics is a well-estab-
lished strategy in applied agriculture in several plant families.
However, comparative analyses of modern angiosperm
genomes, which have experienced multiple rounds of poly-
ploidy followed by differential loss of redundant sequences,
genome recombination, or invasion of LTRs, are character-
ized by interrupted synteny with only partial gene orthology
even between closely related species, such as cereals [16], leg-
umes [17,18], and Brassica species [19,20]. Furthermore,
functional divergence of duplicated genes limits interpreta-
tion of function based on orthology, which complicates
knowledge transfer from model to crop plants. Thus, better
delimitation of comparative genome arrangements reflecting
evolutionary history will allow information obtained from
fully sequenced model genomes to be used to target syntenic
regions of interest and to infer parallel or convergent evolu-
tion of homologs important to biological and agronomical
questions in closely related crop genomes.
The mustard family (Brassicaceae or Cruciferae), the fifth
largest monophyletic angiosperm family, consists of 338 gen-
era and approximately 3,700 species in 25 tribes [21], and is
fundamentally important to agriculture and the environment,
accounting for approximately 10% of the world's vegetable
crop produce and serving as a major source of edible oil and
biofuel [22]. Brassicaceae includes two important model sys-
tems: Arabidopsis thaliana (At), the most scientifically
important plant model system for which complete genome
sequence information is available, and the closely related,
agriculturally important Brassica complex - B. rapa (Br, A
genome), B. nigra (Bn, B genome), B. oleracea (Bo, C
genome), and their three allopolyploids,
B. napus (Bna, AC
genome), B. juncea (Bj, AB genome), and B. carinata (Bc, BC
genome). Syntenic relationships and polyploidy history in
these two model systems have been investigated, although
details about macro- and microsyntenic relationships
between At and Brassica are limited and fragmented. Previ-
ous studies demonstrated broad-range chromosome corre-
spondence between the At and Brassica genomes [23,24],
and a few studies have demonstrated specific cases of conser-
vation of gene content and order with frequent disruption by
interspersed gene loss and genome recombination [19,20].
Although this issue is contentious, there is evidence that
Brassicaceae genomes have undergone three rounds of whole
genome duplication (WGD; hereafter referred to as 1R, 2R,
and 3R, which are equivalent to the γ, β, and α duplication
events) [5,25,26]. One profound finding from comparative
analyses is the triplicate nature of the Brassica genome, indi-
cating the occurrence of a whole genome triplication event
(WGT, 4R) soon after divergence from the At lineage approx-
imately 17 to 20 million years ago (MYA) [19,20,26]. This
result strongly suggests that comparative genomic analyses
using single gene-specific amplicons or those based on small
scale synteny comparisons will fail to identify all related
genome segments, and thus not be able to provide accurate
indications of orthology between the At and Brassica
genomes. However, obtaining sufficient sequence informa-
tion from Brassica genomes to identify genome-wide orthol-
ogous relationships between the At and Brassica genomes is
a major challenge.
Br was recently chosen as a model species representing the
Brassica 'A' genome for genome sequencing [27,28]. This
species was selected because it has already proved a useful
model for studying polyploidy and because it has a relatively
Genome Biology 2009, Volume 10, Issue 10, Article R111 Mun et al. R111.3
Genome Biology 2009, 10:R111
small (approximately 529 megabase-pair (Mbp)) but compact
genome with genes concentrated in euchromatic spaces.
However, widespread repetitive sequences in the Br genome
hinder direct application of whole genome shotgun sequenc-
ing. Instead, targeted sequencing of specific regions of the Br
genome could be informed by the reference At genome by
selecting genomic clones based on sequence similarity; this
approach is referred to as comparative tiling [29]. Here, we
report sequencing of large-scale regions of the Br euchro-
matic genome, covering almost all of the At euchromatic
regions, obtained using the comparative tiling method. We
performed a genome-wide sequence comparison of Br and At
and analyzed the number of substitutions per synonymous
site (Ks) between the two genomes and among related
Brassica sequences to identify syntenic relationships and to
further refine our understanding of the evolution of poly-
ploidy. We also investigated genome microstructure conser-
vation between the two genomes. In this study, we provide a
foundation to reconstruct both the ancestral genome of the
Brassica progenitor and the evolutionary history of the
Brassica lineage, which we anticipate will provide a robust
model for Brassica genomic studies and facilitate the investi-
gation of the genome evolution of domesticated crop species.
Results
Generation of Br euchromatic sequence contigs and
genome coverage
Bacterial artificial chromosome (BAC) sequence assembly
generated 410 Br sequence contigs (sequences composed of
more than one BAC sequence) covering 65.8 Mbp (Tables S1
and S2 in Additional data file 1). These sequence contigs span
75.3 Mbp of the At genome, representing 92.2% of the total At
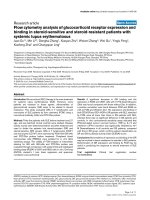
euchromatic region (Figure 1 and Table 1). A total of 43.9 Mbp
remain as uncovered gaps: among these, 6.4 Mbp are attrib-
utable to euchromatin gaps, and the remaining 37.5 Mbp to
pericentromeric heterochromatin gaps.
The genome coverage of the gene-rich Br sequences was esti-
mated by representation in two different datasets: expressed
sequence tag (EST) sequences and conserved single-copy
genes. Based on a BLAT analysis of 32,395 Br unigenes (a set
of ESTs that appear to arise from the same transcription
locus) against the sequence contigs, the proportion of hits
recovered under stringent conditions (see Materials and
methods) was 29.2%. This result was largely consistent with
the proportion of rosid-conserved single-copy genes showing
matches to Br sequences. A TBLASTN comparison of 1,070
At-Medicago truncatula (Mt) conserved single-copy genes
against Br sequences revealed a 24.3% match. Both methods
indicate approximately 30% coverage of euchromatin in the
dataset analyzed; thus, the euchromatic region of Br is esti-
mated to be approximately 220 Mbp, 42% of the whole
genome given that the genome size of Br is 529 Mbp [30].
Characteristics of the B. rapa gene space
Gene annotation was carried out using our specialized Br
annotation pipeline. Gene prediction of the Br sequence data
using a variety of ab initio, similarity-based, and EST/full-
length cDNA-based methods resulted in the construction of
15,762 gene models. Taken together with the genome cover-
age of Br sequences, the overall number of protein-coding
genes in the Br genome is at least 52,000 to 53,000, which is
higher than those of other plant genomes sequenced thus far,
including At [7], rice (Oryza sativa (Os)) [8], poplar (Populus
trichocarpa (Pt)) [9], grape [10], papaya [11], and sorghum
[12]. However, the estimated total number of genes in the Br
genome is only twice that of At. Details of the annotation are
available online at the URL cited in the 'Data used in this
study' section in the Materials and methods.
The gene structure and density statistics are shown in Table
2. The base composition of Br and At genes is very similar.
The average length of Br genes (ATG to stop codon) is 73%
that of At genes. This is consistent with previous reports on
Table 1
Summary of B. rapa chromosome sequences comparatively tiled on the A. thaliana genome
B. rapa
A. thaliana Number of BACs Number of
sequence contigs
Total sequence
length (Mbp)
Coverage of At
genome (Mbp)
Gaps of At genome (Mbp)
Euchromatin Heterochromatin
At1 147 105 16.5 18.5 1.4 10.5
At2 98 59 10.3 12.4 1.4 6
At3 124 89 14.2 15.7 0.4 7.4
At4 97 73 11.3 11.4 0.9 6.2
At5 123 84 13.5 17.3 2.3 7.4
Total 589 410 65.8 75.3 6.4 37.5
Sequence length and coverage were calculated according to Tables S1 and S2 in Additional data file 1.
Genome Biology 2009, Volume 10, Issue 10, Article R111 Mun et al. R111.4
Genome Biology 2009, 10:R111
Bo [19,20,26]. This difference appears to be due to one less
exon per gene and shorter exon and intron lengths in Br. The
average gene density of 1 per 4.2 kilobase-pairs (kbp) in Br is
slightly lower than that in At (1 per 3.8 kbp). Thus, the At/Br
ratio of gene density is 0.90, indicating slightly less compact
organization of Br euchromatin than At euchromatin. More-
over, the distance between the homologous block endpoints
in Br and At has an R
2
of 0.63 with a dAt/dBr slope of 1.36
(Figure S1 in Additional data file 2). This result indicates that
gene-containing regions in At occupy approximately 30 to
40% more space than their Br counterparts. Based on these
data and the results mentioned above, we postulate that the
euchromatic genome of Br has shrunken by approximately
30% compared to its syntenic At counterpart. Most of the
genome shrinkage in Br could be explained by the deletion of
roughly one-third of the redundant proteome as well as TEs
in the euchromatic Br genome. Only 14% of the Br genes were
tandem duplicates compared with 27% of At genes in a 100-
kbp window interval. In addition, only 45 nucleotide binding
site-encoding genes were identified in Br, suggesting that the
total number of nucleotide binding site-encoding genes in the
Br genome is likely to be almost the same as that in At
(approximately 200) [31,32]. A database search revealed that
a total of 12,802 (81%) of the predicted Br genes have similar-
ity (<E
-10
) to proteins in the non-redundant nucleotide data-
base of the National Center for Biotechnology Information
(NCBI); 2,960 (19%) are Br unique genes. To assess the puta-
tive function of the genes that recorded no hits to non-redun-
dant proteins, we assigned functional categories to the Br
unique genes using gene ontology analysis; however, this
analysis could not identify a putative function for approxi-
mately 85% of the Br unique genes. Thus, we can conclude
that 16% of the proteome of Br has acquired a novel function
since the Br-At divergence.
Repetitive sequence analysis revealed that 6% of euchromatic
Br sequences are composed of TEs, a twofold greater amount
than identified in the counterpart At euchromatic genome,
presumably due to a greater number of LTRs and long inter-
spersed elements (Table 3). In addition, low complexity
repetitive sequences are relatively abundant in the Br euchro-
matic region, indicating Br-specific expansion of repetitive
sequences. The distribution of repetitive sequences and TEs
along the chromosomes was not uneven (Figure S2 in Addi-
tional data file 2). It has previously been reported, based on
partial draft genome shotgun sequences, that Bo (approxi-
mately 696 Mbp) has a significantly higher proportion of both
class I and class II TEs sequences than At [33]. Taken
together with these previous reports [34,35], TEs appear to be
partly responsible for genome expansion in the Brassica lin-
eage, and these TEs appear to accumulate predominantly in
the heterochromatic regions of Br.
Synteny between the B. rapa and A. thaliana genomes
To identify syntenic regions in the Br and At genomes, we
compared the whole proteome between the two genomes
using BLASTP analysis, and putative synteny blocks were
plotted using DiagHunter and GenoPix2D programs [36].
The non-redundant chromosome-ordered genome sequence
in the Br build was 62.5 Mbp. An additional 3.2 Mbp had not
yet been assigned to chromosomes and was therefore not
used for synteny analysis. We examined the synteny blocks at
three different levels: whole genome (Figure 2a), large-scale
synteny blocks in chromosome-to-chromosome windows
(Figure 2b; Additional data file 3), and microsynteny <2.5
Mbp (the synteny can be viewed at the URL cited in the 'Data
used in this study' section in the Materials and methods).
Although the Br genome build was partial and incomplete
with only approximately 30% of euchromatin represented
and some misordered contigs present, the level of synteny
between the genomes was prominent and distinct. The Diag-
Hunter program detected 227 highly homologous syntenic
blocks with 72% of the sequenced and anchored Br sequence
assigned to synteny blocks in At and 72% of At euchromatic
sequence assigned to synteny blocks in Br when multiple
blocks overlapping the same region were counted (Figure 2a).
Considering the history of frequent genome duplication
events in Brassicaceae, this result strongly indicates the pres-
ence of secondary or tertiary blocks resulting from WGT.
The Br and At genomes share a minimum of 20 large-scale
synteny blocks with substantial microsynteny; these synteny
blocks extend the length of whole chromosome arms. At
shows synteny of chromosome arms with multiple chromo-
some blocks of Br, apparently corresponding to triplicated
remnants (Figure 2b). At1S (short arm), At2L (long arm),
At4L, and At5 have three long-range synteny counterparts in
three independent Br chromosomes. However, At1L and At3
have only one or two synteny blocks in the Br genome. More-
over, some genome regions of At, including a smaller section
of At2S and At4S, show no significant synteny with Br coun-
terparts, indicating chromosome-level deletion of triplicated
segments. Incidentally, Br shows synteny with a major single
chromosome along almost the entire length (A1, A2, A4, and
A10) or fragments of multiple At chromosomes in a compli-
cated mosaic pattern, indicating frequent recombination of
Br chromosomes. Notable regions of synteny are shown in
Figure 2b, and are At1S-A6/A8/A9, At1L-A7, At2L-A3/A4/
A5, At3S-A3/A5, At3L-A7/A9, At4L-A1/A3/A8, and At5-A2/
A3/A10 (synteny view available at the URL cited in the 'Data
used in this study' section in the Materials and methods.
Additional synteny blocks scattered throughout genome
regions, probably due to recombination, were also identified.
Within individual synteny blocks, microsynteny (conserva-
tion of gene content and order) was considerable. The average
degree of proteome conservation for all predicted synteny
blocks was 52 ± 13% in the blocks (Table S3 in Additional data
file 1). This value is almost the same as that of the Mt-Lotus
japonicus comparison in which an ancient WGD event at a
similar time period (Ks 0.7 to 0.9) as the Br-At WGD but ear-
lier speciation (Ks 0.6) than Br-At was detected [18]. The
Genome Biology 2009, Volume 10, Issue 10, Article R111 Mun et al. R111.5
Genome Biology 2009, 10:R111
underestimated value reported here presumably reflects sig-
nificant gene loss and rearrangement after WGT in the Br lin-
eage resulting in genome shrinkage, based on the fact that
deletion events in syntenic blocks of the Br genome were two-
fold more frequent than in the At genome. Genes without cor-
responding homologs in syntenic regions contributed to 15 ±
7% of all genes from Br but 33 ± 13% from At (Table S3 in
Additional data file 1; Additional data file 3). Genes encoding
proteins involved in transcription or signal transduction were
not found to be significantly more retained in syntenic blocks
than those encoding proteins classified as having other func-
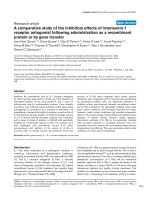
In silico allocation of 410 B. rapa BAC sequence contigs to A. thaliana chromosomesFigure 1
In silico allocation of 410 B. rapa BAC sequence contigs to A. thaliana chromosomes. BAC sequence contigs (blue bars) were aligned to At chromosomes
based on significant and directional matches of sequences using a BLASTZ cutoff of <E
-6
.
At Chr.1
0 1M 2M 3M 4M 5M 6M 7M 8M 9M 10M 11M 12M 13M 14M 15M 16M 17M 18M 19M 20M 21M 22M 23M 24M 25M 26M 27M 28M 29M 30M
1
2
3
4
5
6
7
8
9
10
11
12
13
14
15
16
17
18
19
20
21
22
23
24
25
26
27
28
29
30
31
32
33
34
35
36
37
38
39
40
41
42
43
44
45
46
47
48
49
50
51
52
53
54
55
56
57
58
59
60
61
62
63
64
65
66
67
68
69
70 71 72
73
74
75
76
77
78
79
80
81
82
83
84
85
86
87
88
89
90
91
92
93
94
95
96
97
98
99
100
101
102
103
104
105
At Chr.2
0 1M 2M 3M 4M 5M 6M 7M 8M 9M 10M 11M 12M 13M 14M 15M 16M 17M 18M 19M
106
107
108
109
110
111 112
113
114
115
116
117
118
119
120
121
122
123
124
125
126
127
128
129
130
131
132
133
134
135
136
137
138
139
140
141
142
143
144
145
146
147
148
149
150
151
152
153
154
155
156
157
158
159
160
161
162
163
164
At Chr.3
0
1M 2M 3M 4M 5M 6M 7M 8M 9M 10M 11M 12M 13M 14M 15M 16M 17M 18M 19M 20M 21M 22M 23M
165
166
167
168
169
170
171
172
173
174
175
176
177
178
179
180
181
182
183
184
185
186
187
188
189
190
191
192
193
194
195
196
197
198
199
200
201
202
203
204
205
206
207
208
209
210
211
212
213
214
215
216
217
218
219
220
221
222
223224
225
226
227
228
229
230
231
232
233
234
235
236
237
238
239
240
241
242
243
244
245
246
247
248
249
250
251
252
253
At Chr.4
0 1M 2M 3M 4M 5M 6M 7M 8M 9M 10M 11M 12M 13M 14M 15M 16M 17M 18M
254
255
256
257
258
259
260
261 262
263
264
265
266
267
268
269
270
271
272
273
274
275
276
277
278
279
280
281
282
283
284
285
286
287
288
289
290
291
292
293
294
295
296
297
298
299
300
301
302
303
304
305
306
307
308
309
310
311
312
313
314
315
316
317
318
319
320
321
322
323
324
325
326
At Chr.5
0 1M 2M 3M 4M 5M 6M 7M 8M 9M 10M 11M 12M 13M 14M 15M 16M 17M 18M 19M 20M 21M 22M 23M 24M 25M 26M
327
328
329
330
331
332
333
334
335
336
337
338
339
340
341
342
343
344
345
346
347
348
349
350
351
352
353
354
355
356
357
358
359
360
361
362
363
364
365
366
367
368
369
370
371
372
373
374
375
376
377
378
379
380
381
382
383
384
385
386
387
388
389
390
391
392
393
394
395
396
397
398
399
400
401
402
403
404
405
406
407
408
409
410
Low
High
Genome Biology 2009, Volume 10, Issue 10, Article R111 Mun et al. R111.6
Genome Biology 2009, 10:R111
tions. Further genome sequencing will help resolve the syn-
teny in the uncovered and/or the scattered genome regions.
Rearrangement of the B. rapa genome
Comparison of the genomes of Br and At allows insight into
the origin and evolution of the Brassica 'A' genome. Previous
comparative mapping studies have identified a putative
ancestral karyotype (AK) comprising 24 building blocks on 8
chromosomes from which the current Arabidopsis and
Brassica genomes have evolved via fusion/fission, rearrange-
ment, and deletion of chromosomes followed by polyploidy
[23,37-39]. According to the At-AK relationship and pair
information of Br-At synteny blocks, we defined conserved
genome building blocks of AK on the Br genome build (Figure
3; Additional data file 4). The pattern of block boundaries on
Br chromosomes was similar to that reported pattern for Bna
'A' genome components, albeit more complicated (Figure S3
in Additional data file 2). Most of the block boundaries were
conserved between Br and the 'A' genome components of Bna
with the exception of several insertions/deletions; this is pre-
sumably due to limited sequence and marker information. In
addition, inversion or serial mismatched block boundaries
were found on A2, A7 and A9, respectively, suggesting recom-
bination of homologous counterpart regions between the 'A'
and 'C' genomes in Bna.
An examination of the Br genome from the perspective of
ancestral blocks reveals that three copies of the genome are
present, as predicted from the WGT (Figure 3). Although
there are several discontinuous matches due to gaps between
syntenic blocks, almost 50% of the ancestral blocks were trip-
licated in the Br genome, while others occurred only once or
twice, indicating loss of blocks during genome rearrange-
ment. Blocks D, G, and M could not be found on the Br
genome. The Br genome is highly rearranged relative to At
compared with AK. Block R was localized together with block
W in triplicate regions (A2, A3, and A10). However, in At5,
blocks R and W were separated on the short arm and long
arm, respectively [38,39]. Similarly, blocks E and N were
adjacent and triplicated in Br but separated in At. Meanwhile,
blocks K and L, which are fused in AK but split in different
chromosomes of At, were adjacent (A6) or separated (A9) on
the same chromosomes of Br. However, we did not determine
precisely which copy of the replicated AK block family corre-
sponds to the Br BACs because of the possibility that Br
sequences in the polyploid genome were not accurately posi-
tioned. Because several genetic markers originate from dupli-
cate or triplicate regions of the Br genome, the true location
of the BACs could correspond to any of the amplified bands,
which could result in inaccurate mapping of the BAC
sequence. In this case, the resulting assignment of the BAC to
an incorrect linkage group on a specific AK block family mem-
ber would also be flawed; however, we found that almost all
BAC sequences showed excellent correspondence to the cor-
rect family of AK blocks. Further analysis, including chromo-
some painting and additional genome sequencing, will allow
determination of the precise location of AK blocks in the Br
genome.
Loss of genes from the recent duplication event in the
B. rapa genome
To deduce the approximate time point of polyploidy and spe-
ciation, we compared the distribution of synonymous substi-
tution (Ks) in homologous sequences identified by a
reciprocal best BLAST hit search between Br and the com-
pletely annotated sequences of At, Pt, Mt, and Os. As shown
in Figure 4a-c, Br shares a single ancient duplication event
Table 2
Comparison of the overall composition of annotated protein cod-
ing genes in the B. rapa sequence contigs and euchromatic coun-
terparts in the A. thaliana genome
Feature B. rapa A. thaliana*
Number of sequence contigs 410
Total sequence length (Mbp) 65.8 75.3
Transposons (%) 6 3
Number of protein coding genes 15,762 19,639
Number of exons per gene 4.7 5.5
Intron size (bp) 141 162
Exon size (bp) 225 230
Average gene size (kbp) 1.6 2.2
Average gene density (kbp/gene) 4.2 3.8
Overall G/C content (%) 35.2 35.8
Exons 46.3 44.6
Introns 32.6 32.0
Intergenic regions 31.3 31.8
*A. thaliana statistics are based on version TAIR7 annotation available
on the Arabidopsis Information Resource website [74].
Table 3
Comparison of repetitive sequences identified in the B. rapa
sequence contigs and euchromatic counterparts in the A. thaliana
genome
Genome coverage (%)*
Family B. rapa A. thaliana
SINEs 0.1 0.0
LINEs 1.3 0.3
LTRs 2.4 0.8
DNA transposons 2.2 1.6
Satellites 0.4 0.0
Low complexity repetitive sequences 4.4 1.0
Other
†
0.4 0.1
Total 11.2 3.8
*Genome coverage was calculated using 65.8 Mbp for B. rapa and 75.3
Mbp for the euchromatic counterpart of A. thaliana.
†
This refers to
simple sequence repeats and short tandem repeats. LINE, long
interspersed element; SINE, short interspersed element.
Genome Biology 2009, Volume 10, Issue 10, Article R111 Mun et al. R111.7
Genome Biology 2009, 10:R111
Figure 2 (see legend on next page)
Genome Biology 2009, Volume 10, Issue 10, Article R111 Mun et al. R111.8
Genome Biology 2009, 10:R111
(1R) with Os, Pt, and Mt as illustrated by single peaks at Ks
modes of 2.5 to 2.6, 2.2 to 2.3, and 1.8 to 1.9, respectively,
indicating successive splitting of the Br lineage from mono-
cots and eurosid I during the early and late Cretaceous period
around 60 to 120 MYA, depending on the neutral substitution
rate used [40]. The age distributions of At and Br yield clear
peaks corresponding to 2R at Ks = 1.7 to 1.8 and 1.8 to 1.9,
respectively, lower than that of the Br-Pt comparison but sim-
ilar to that of the Br-Mt comparison (Figure 4e, f). This sug-
gests that an ancient burst of gene duplications due to the 2R
event in At and Br must have occurred almost immediately
after divergence between eurosid I and eurosid II. Taken
together with recent studies of the Pt [9] and Mt genomes
[18], we conclude that genome duplication in rosids occurred
independently after the split from the last common rosid
ancestor, and that most polyploidy events (2R, 3R, and 4R) in
Brassicaceae postdate the eurosid I (Pt and Mt)-eurosid II (At
and Br) divergence.
The Ks distribution for At and Br orthologs displayed two
peaks at Ks = 0.3 to 0.4 and 2.0 to 2.1, corresponding to
shared duplication events (3R and 2R) and speciation
between the genomes at around 13 to 17 MYA (Figure 4d). As
reported before, the oldest duplication (1R) could not be seen
in the Ks distributions in both genomes. Surprisingly, a com-
parison of the Ks mode for the paralogs in At and Br identified
remarkable differences in the duplicated genes retained in the
two genomes. Furthermore, the At genome has two clear
peaks for 3R (mode Ks = 0.6 to 0.7) and 2R (mode Ks = 1.7 to
1.8). However, in the Br genome, two peaks representing 4R
(mode Ks = 0.2 to 0.3) and 2R (mode Ks = 1.8 to 1.9) are evi-
dent, but the 3R peak has collapsed (Figure 4e, f). The differ-
ence between the distributions for Br-Br versus Br-At (P =
1.65E
-8
) was significantly higher than that for At-At versus
Br-At (P = 0.001). Taken together, these findings suggest that
duplicated genes produced by the 3R event were widely lost in
the triplicated Br genome.
Because we used approximately 30% of the euchromatic
sequence of Br, we could have underestimated the 3R event
due to biased sampling. To test this possibility, we analyzed
the Ks distribution using ESTs. The age distribution of Br
based on approximately 120,000 ESTs showed a pattern
essentially identical to that obtained using the genome
sequence data, illustrating loss of the 3R peak (Figure 5a).
The additional peak for Ks = 0.10 to 0.15 may represent a very
recent segmental duplication event. Loss of the 3R event
appears to be specific to Br amongst Brassica genomes (Fig-
ure 5b-f); a Bo-Bo comparison yielded a Ks distribution dif-
ferent to that of Br-Br, with a clear peak corresponding to 3R
(mode Ks = 0.85 to 0.90). A similar pattern was observed in
the Bna-Bna comparison with underestimation of the peaks
for 3R. However, note that the Ks modes for ortholog compar-
ison between Br and Bo, Bo and Bna, and Br and Bna showed
very similar Ks distribution with the two peaks for 4R and 2R
at similar Ks modes as those in Br-Br paralog analyses, but
loss of a peak for 3R. In particular, when the interval of Ks for
the Br-Bo comparison was magnified, one additional peak,
lying slightly below that for 4R at Ks = 0.34 to 0.36, was iden-
tified at Ks = 0.22 to 0.24; this indicates the genome split at
around 8 MYA (Figure 5g).
Detection of a peak reflecting 3R in the Bo and Bna genomes
but absence of this peak in the Br genome and between the
other Brassica genomes strongly supports the hypothesis
that duplicated genes from the 3R event were lost in the Br
genome due to gradual deletion or suppression, presumably
due to functional redundancy in the polyploid genome. To
further explore this hypothesis, we compared the degree of
conservation of duplicated genes in the sister blocks resulting
from 3R and 4R. We found that 33 and 18 sister block pairs
were selected for in the 3R and 4R events in the Br genome,
respectively (Table S4 in Additional data file 1). The degree of
conservation of duplicated genes for 4R was 44%, almost the
same as that of the triplicated FLC region [20], but only 20%
for 3R, a value approximately twofold lower than that of Bo
based on calculations from published data [19]. This suggests
greater deletion of duplicated genes in Br than Bo (Table 4;
Tables S4 and S5 in Additional data file 1).
Discussion
A comparative genomics approach to target the
euchromatic gene space of a crop genome
Investigation of crop genomes not only offers information
that can be used for agricultural improvement, but also pro-
vides opportunities to understand angiosperm biology and
evolution. As of 2009, the genome sequences of only five eco-
Synteny between the B. rapa and A. thaliana genomesFigure 2 (see previous page)
Synteny between the B. rapa and A. thaliana genomes. (a) Percent coverage of individual chromosomes showing synteny between B. rapa and A. thaliana.
Coverage was calculated as the gene number of an individual chromosome per sum of genes with BLASTP hits. Note that the overall coverage of an
individual chromosome for the counterpart genome can exceed 100% because multiple best BLAST hits over the same region are counted. (b)
Chromosome correspondence between B. rapa and A. thaliana represented by a dot-plot. Each dot represents a reciprocal best BLASTP match between
gene pairs at an E-value cutoff of <E
-20
. Red dots show regions of synteny with more than 50% gene conservation as identified by DiagHunter. Some Br
chromosome orientations have been flipped (A1
f
, A3
f
, A7
f
) to visually correspond to At orientations. Both Br and At have been scaled to occupy the same
lengths. Color bars on the upper and left margins of the dot plot indicate individual chromosomes of At and Br, respectively. Black dots on the At
chromosomes are centromeres. The color-shaded boxes in the dot plots represent long-range synteny blocks along chromosome pairs. Boxes with the
same color are putative triplicated remnants. See Additional data file 3 and the URL cited in Materials and methods for all dot plots and related results,
including detailed close-ups of regions of synteny.
Genome Biology 2009, Volume 10, Issue 10, Article R111 Mun et al. R111.9
Genome Biology 2009, 10:R111
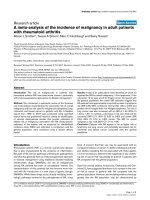
Comparison of the genome structures of B. rapa and A. thaliana based on 24 ancestral karyotype genome building blocksFigure 3
Comparison of the genome structures of B. rapa and A. thaliana based on 24 ancestral karyotype genome building blocks. The genome structure of At was
based on the reports of Schranz et al. [37] and Lysak et al. [38]. The position of genome blocks in the Br chromosome was defined by a comparison of Br-
At syntenic relationships and the At-AK mapping results. Br sequences were connected to form continuous sequences. Block boundaries, orientation, and
gaps between syntenic blocks are shown in Additional data file 4. Each color corresponds to a syntenic region between genomes. The Br genome is
triplicated and more thoroughly rearranged than the At genome.
At1 At2 At3 At4 At5
A. thaliana
A
B
C
E
D
G
H
I
J
K
F
L
M
N
P
O
T
U
R
Q
S
W
X
V
A10A1 A2 A3 A4 A6 A7 A8 A9A5
B. rapa
I
J
F
J
F
N
A
B
U
X
I
N
A
H
B
H
U
K
V
Q
O
V
L
E
A
R
Q
W
X
R
Q
W
X
E
N
V
C
A
L
B
Q
L
L
K
F
V
U
U
U
F
R
S
E
E
N
N
W
U
N
R
F
P
U
J
P
J
W
T
I
Genome Biology 2009, Volume 10, Issue 10, Article R111 Mun et al. R111.10
Genome Biology 2009, 10:R111
nomically important crop plants (rice, poplar, grape, papaya,
and sorghum) have been published [8-12], and whole genome
sequencing projects are currently underway for only a few
selected crop species. One hurdle faced when sequencing a
crop genome is genome obesity due to polyploidy and repeti-
tive DNA [41]. Therefore, a stepwise approach is required to
obtain genome-wide information from crop genomes, and
strategies for targeting gene-rich fractions are required. In
combination with EST sequencing, two approaches - methyl-
ation filtration [42] and Cot-based cloning and sequencing
[43] - were developed to capture euchromatic regions.
Although both methods enrich for gene-rich fractions, they
can exclude transcriptionally suppressed regions or euchro-
matic regions with abundant interspersed repetitive
sequences (tandem repeats). We applied a novel gene space
targeting method by allocating BAC clones to a closely related
model genome based on BAC end sequence (BES) matches;
this approach has not previously been reported in a genome
sequencing project. This method has several advantages.
First, gene-rich fractions of the crop genome can be obtained
successfully in silico without additional experiments. We col-
lected approximately 30% of the euchromatic region of B.
rapa in this study. If a greater overlap between the clones and
target region is allowed, and additional information in the
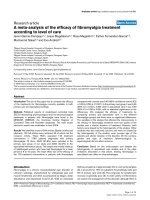
Traces of polyploidy events in plant genomesFigure 4
Traces of polyploidy events in plant genomes. (a-f) The distribution of Ks values obtained from comparisons of sets of putative orthologous genome
sequences between Br and the selected model plant species Os (a), Pt (b), Mt (c), and At (d), and from paralogous sequences in At (e) and Br (f) genomes.
The vertical axes indicate the frequency of paired sequences, while the horizontal axes denote Ks values with an interval of 0.1. The black bars depict the
positions of the modes of Ks distributions obtained from orthologous or paralogous gene pairs. At, A. thaliana; Br, B. rapa; Mt, Medicago truncatula; Os, O.
sativa; Pt, Populus trichocarpa.
Br-Os
(a)
Br-Pt
(b)
Br-Mt
(c)
At-At
(e)
Br-At
(d)
Br-Br
(f)
Ks
Frequency
Ks
FrequencyFrequency
0
700
1400
2100
2800
3500
0.1
0.4
0.7
1.0
1.3
1.6
1.9
2.2
2.5
2.8
3.1
3.4
3.7
4.0
4.3
4.6
4.9
0
400
800
1200
1600
2000
0.1
0.4
0.7
1.0
1.3
1.6
1.9
2.2
2.5
2.8
3.1
3.4
3.7
4.0
4.3
4.6
4.9
0
250
500
750
1000
1250
0.1
0.4
0.7
1.0
1.3
1.6
1.9
2.2
2.5
2.8
3.1
3.4
3.7
4.0
4.3
4.6
4.9
0
200
400
600
800
1000
0.1
0.4
0.7
1.0
1.3
1.6
1.9
2.2
2.5
2.8
3.1
3.4
3.7
4.0
4.3
4.6
4.9
0
160
320
480
640
800
0.1
0.4
0.7
1.0
1.3
1.6
1.9
2.2
2.5
2.8
3.1
3.4
3.7
4.0
4.3
4.6
4.9
0
400
800
1200
1600
2000
0.1
0.4
0.7
1.0
1.3
1.6
1.9
2.2
2.5
2.8
3.1
3.4
3.7
4.0
4.3
4.6
4.9
Genome Biology 2009, Volume 10, Issue 10, Article R111 Mun et al. R111.11
Genome Biology 2009, 10:R111
Traces of polyploidy events in the Brassica 'A' and 'C' genomesFigure 5
Traces of polyploidy events in the Brassica 'A' and 'C' genomes. (a-g) Distributions of Ks values were obtained from comparisons of sets of paralogous EST
sequences in Br (a), Bo (b), and Bna (c) and comparisons of putative orthologous EST sequences between the genomes (d-g). The vertical axes indicate the
frequency of paired sequences, and the horizontal axes denote Ks values at 0.05 (a-f) or 0.02 (g) intervals. The black bars indicate the positions of the
modes of Ks distributions obtained from comparisons of orthologous or paralogous gene pairs. Bna, B. napus; Bo, B. oleracea; Br, B. rapa.
Frequency
Br-Br
Br-Bo
0
70000
140000
210000
280000
350000
0.05
0.55
1.05
1.55
2.05
2.55
3.05
3.55
Frequency
Bo-Bo
Bo-Bna
Bna-Bna
Br-Bna
Frequency
0
14000
28000
42000
56000
70000
0.05
0.55
1.05
1.55
2.05
2.55
3.05
3.55
0
400
800
1200
1600
2000
0.05
0.55
1.05
1.55
2.05
2.55
3.05
3.55
0
80000
160000
240000
320000
400000
0.05
0.55
1.05
1.55
2.05
2.55
3.05
3.55
0
70000
140000
210000
280000
350000
0.05
0.55
1.05
1.55
2.05
2.55
3.05
3.55
0
1400
2800
4200
5600
7000
0.05
0.55
1.05
1.55
2.05
2.55
3.05
3.55
Br-Bo
Ks
Ks
0
6000
12000
18000
24000
30000
0.02
0.06
0.10
0.14
0.18
0.22
0.26
0.30
0.34
0.38
0.42
0.46
0.50
0.54
0.58
0.62
0.66
(a)
(b)
(c)
(g)
(d)
(e)
(f)
Frequency
Genome Biology 2009, Volume 10, Issue 10, Article R111 Mun et al. R111.12
Genome Biology 2009, 10:R111
form of genetic maps and physical contigs is used, the gene-
rich fraction recovered is likely to increase significantly. Sec-
ond, clone-by-clone strategies used in genome sequencing
can benefit directly from this method because of selection of
gene-rich seed BACs as well as the alignment of sequence
scaffolds. Quick selection of a sufficient number of gene-rich
seed BACs and directed ordering of the sequence scaffold will
likely accelerate clone-based whole genome sequencing at
reduced cost. The BAC clones selected in this study can be
used as seed BACs for the ongoing clone-by-clone genome
sequencing of Br [27,28]. Third, this analysis allows investi-
gation of syntenic relationships between wild and crop
genomes, thereby informing our understanding of crop evo-
lution. Integration of genomes based on sequence level com-
parisons can offer a platform for the correlation between
specific genes and phenotypes, which is important for further
improvement of crops. We anticipate that application of our
method will accelerate knowledge spreading from nodal
model species to closely related taxa. For example, genome
sequencing of other Brassica crops, particularly the construc-
tion of sequence assemblies and scaffolds of Bna, can benefit
from the information obtained from the Br genome; this
holds true even for next-generation sequencing. Thus, we
anticipate that this study will make a significant contribution
to structural and comparative genomic studies of crop spe-
cies.
Counterbalancing genome obesity after whole genome
triplication in B. rapa
A large-scale comparison of Br genomic sequences and the
whole euchromatic region of At demonstrated extensive syn-
teny between the genomes, and provided clear evidence of a
recent WGT event in the Brassica lineage. Our results signif-
icantly expand on previous observations of synteny between
At and Br based on comparative genetic mapping [23] and
small-scale comparisons of homologous regions [20] by deci-
phering the start-end points of macrosynteny blocks and elu-
cidating the fine-scale details of microsynteny within the
syntenic regions more accurately. Even though the Br
sequencing project is still underway and the sequences used
in this study are incomplete, the scale of synteny between the
two genomes at both the macro- and micro-levels is signifi-
cant. As the Br sequencing project moves forward, the availa-
bility of nearly complete coverage of the euchromatin will
enable more precise definition of syntenic blocks between At
and Br, which can be used to reconstruct ancestral chromo-
some sequences of Brassica.
Despite the WGT event, the total number of genes in the Br
genome was estimated to be approximately 53,000, which is
only a twofold increase compared with that of At. The usual
fate of a duplicate-gene pair in a polyploid genome is non-
functionalization or the deletion of one copy [44-46]. The
reduction in the overall number of genes in the triplicated Br
genome can be regarded as a result of a process that restores
the diploid state, thereby counterbalancing genome obesity.
This process seemed to be driven by the deletion of redundant
genome components at the level of both the chromosome and
the gene. A genome-wide synteny comparison between Br
and At revealed that some of the triplicated copies of Br seg-
ments were lost or reconstructed. In addition, microsynteny
analysis also indicated a relatively shrunken genome
throughout the entire euchromatic region of the Br genome,
with the Br gene space occupying a fraction 30% smaller than
that of At due to a higher frequency of deletion events in the
Br genome. A previous study reported that in the At genome,
genes with regulatory functions, such as those encoding tran-
scription factors or genes involved in signal transduction,
were retained significantly more often than genes with other
molecular functions [5]. However, we did not find differential
Table 4
Comparison of the degree of conservation between duplicated groups originating from different polyploidy events in B. rapa and B. oler-
acea
Number of groups produced Number of genes* Degree of conservation
Duplication event Total Unpaired Conserved (%)
†
B. rapa
3R event 33 2,017 1,623 394 19.5
4R event 18 (3) 651 (112) 367 (58) 284 (54) 43.6 (48.2)
Segmental duplication 1 (1) 24 (28) 4 (0) 20 (28) 83.3 (100)
B. oleracea
‡
3R event 9 310 196 114 36.8
4R event 6 217 81 136 62.7
Data in parentheses are those from the Flowering Locus C (FLC) regions [20]. *Tandem duplicated genes were considered to be a single homolog.
†
The
degree of conservation was calculated by dividing the number of conserved genes by the total number of genes.
‡
Information about the Bo genome
was obtained from the report of Town et al. [19].
Genome Biology 2009, Volume 10, Issue 10, Article R111 Mun et al. R111.13
Genome Biology 2009, 10:R111
retention of genes according to molecular function, which
suggests random deletion of redundant genes in triplicated
regions of the Br genome before functional diversification.
Several mechanisms responsible for post-polyploid changes
have been proposed. These include chromosome rearrange-
ments caused by unequal crossing-over, homologous recom-
bination, translocation, or other cytogenetic events [47-50]. A
tandem array with high sequence similarity would be a good
candidate for deletion, because it is more likely to recombine
and less likely to have a severe phenotype when one redun-
dant gene is deleted. Fewer tandem duplicate genes in the Br
genome may, therefore, be attributable to an increase in the
rate of deletion. Incidentally, because polyploidy itself is a
form of genomic 'disturbance,' it might induce a cellular
response such as epigenetic silencing by hypermethylation,
which may be especially relevant to genome evolution [48].
As a result, the epigenetic response itself may accelerate the
rate of mutation, thereby causing rapid genomic change as
seen in Br. In addition, polyploidy could increase transposa-
ble element activity, causing the deletion of genes or even
chromosome segments. Illegitimate recombination of TEs
has been demonstrated to have the ability to remove large
blocks of DNA in Arabidopsis, rice, [15,49] and wheat [51].
We speculate that the twofold increase in transposon accu-
mulation in the triplicated euchromatic regions of Br com-
pared to the euchromatic counterpart regions of At might be
correlated with the deletion of duplicated genes.
Evolution of the Brassica 'A' genome
Multiple rounds of polyploidy are thought to have occurred
during angiosperm evolution, although the number and tim-
ing of polyploidy events vary between plant groups [5,52].
Thus, most modern plant genomes harbor evidence of multi-
ple rounds of past polyploidization. The genome evolution of
Brassicaceae has been inferred mainly from studying Arabi-
dopsis. There is evidence from several studies for one round
of genome duplication after the eudicot divergence and addi-
tional rounds of polyploidization following the divergence of
Arabidopsis from its common ancestor with cotton [5]. In
this study, we refined inferences of the number and timing of
polyploidy events, and we now discuss the impact of these
events on the structure and evolution of the Brassica 'A'
genome (Figure 6). Ks estimates suggest that the Brassica
genome shared two genome duplication events (2R and 3R)
with Arabidopsis postdating the eurosid I (Pt and Mt) and
eurosid II (At and Br) divergence. The third polyploidy event
(4R) was a Brassica lineage-specific whole genome triplica-
tion after the split of Brassica from the common ancestor of
Brassica and Arabidopsis. The 227 synteny blocks identified
between Br and At can serve as a basis for reconstruction of
the ancestral genome and chromosomes of the Br-At ances-
tor, although a more complete genome sequence and addi-
tional evidence are still required. The mapping of ancestral
chromosome building blocks to the Br genome strongly sug-
gests that the Br genome evolved from a pre-triplicated
ancestor with a unique organization of the retracted AK,
which was different from that of At, by chromosomal rear-
rangement shortly after 3R but prior to 4R. This event might
have resulted in the divergence of the Arabidopsis and
Brassica lineages.
More importantly, differential gene loss following 4R in the
Brassica genome might be responsible for the diversification
of the genome, based on the finding that significantly more
genes duplicated as a result of 3R have been lost in Br than in
Bo. However, it is not clear if duplicated genes from the 3R
event that were retained in Bo have diverged functionally. It
appears that the split between Br
and Bo happened rapidly
(0.1 Ks interval) compared to the At-Brassica split (0.3 Ks
interval), perhaps due to differential retention of duplicated
genes and genome recombination in the ancestral Brassica
genome. These observations, along with the independent
accumulation of repetitive sequences, may have facilitated
speciation within the tribe Brassiceae, which contains
approximately 240 highly diverse species. Further analysis
and cross-comparisons of diploid and allopolyploid genomes
of Brassica will enhance our understanding of the fate of
duplicated genes in the Brassica genome. It appears that, as
a counterbalance to genome obesity, there was higher selec-
tion pressure on redundant genes in the triplicated Brassica
ancestor, accelerating gene loss in this triplicated ancestor
compared to the Arabidopsis-Brassica common ancestor.
Alternatively, differences in the life cycles of Brassica progen-
itors might have resulted in the differential deletion of dupli-
cated genes in Brassica genomes. Moreover, artificial
selection after domestication could also have had an impact
on differentiation of diploid Brassica genomes. Taken
together, the available evidence suggests that genome dupli-
cation and chromosomal diploidization are ongoing proc-
esses collectively driving the evolution of Brassica genomes.
Conclusions
Comparisons of large-scale genomic sequences of Br and the
whole euchromatic region of At revealed extensive synteny
between the genomes due to at least two shared genome
duplication events and a recent WGT event specific to the
Brassica lineage. The reduction of the number of genes in the
triplicated Br genome by approximately one-third can be
regarded to be the result of a process counterbalancing
genome obesity to regain the diploid state. Segmental loss of
triplicated genome blocks and differential deletion of dupli-
cated genes in Br along with less accumulation of transposons
appear to have resulted in the small size of the Br genome
(approximately 529 Mbp) compared to its sibling species, Bo
(approximately 696 Mbp) and Bn (approximately 632 Mbp)
[30]. The events proposed here indicate that genome dip-
loidization following polyploidy played an important role in
the radiation of Brassica. Our results clarify the orthology
between Br and At and establish a strong basis for the genome
evolution of Brassica. All the sequenced BAC clones investi-
Genome Biology 2009, Volume 10, Issue 10, Article R111 Mun et al. R111.14
Genome Biology 2009, 10:R111
Polyploidy events in the evolution of the Brassica genomeFigure 6
Polyploidy events in the evolution of the Brassica genome. Each star indicates a WGD (1R, 2R, and 3R) or WDT (4R) event on the branch. Estimation of
dates for polyploidy and speciation events are given in million years and are based on the Ks analysis performed in this study, except for the 1R event,
which was inferred from a previous report [1]. A geographic time-table is provided on the right border of the figure. At, A. thaliana; Bna, B. napus; Bo, B.
oleracea; Br, B. rapa; Mt, Medicago truncatula; Os, O. sativa; Pt, Populus trichocarpa.
Bna
OsPtMtAtBoBr
monocot-dicot split
90~120
eurosid I-II split
63~77
2R
3R
23-30
55-63
11-12
Br-Bo
split
8
Brassica-At
split
13-17
25
MYA
50
75
100
125
Hybridization
0.7~1 ?
Jurassic Cretaceous
Tertiary
Cenozoic era
Mesozoic era
Paleocene
Eocene
Oligocene
Miocene
Pliocene
120-150
4R
1R
Genome Biology 2009, Volume 10, Issue 10, Article R111 Mun et al. R111.15
Genome Biology 2009, 10:R111
gated in this study were provided to the B. rapa Genome
Sequencing Project as seed BACs for use as starting points for
chromosome sequencing.
Materials and methods
BAC selection, sequencing, and sequence contig
assembly
We previously published an efficient and novel clone selec-
tion method based on in silico BES matches to a model
genome, which we named the comparative tiling method
[29]. To select gene-rich Br BAC clones covering the entire At
euchromatic regions, a total of 92,000 BESs were allocated to
At chromosomes by using BLASTZ at a cutoff of <E
-6
with
both end matches at 30 to 500 kbp intervals. A total of 4,647
BAC clones were allocated to 92 Mbp of At euchromatic
regions and 589 minimally overlapping BAC clones (292
overlapping clones with an average of 41 kbp overlaps and
297 singleton clones) were finally selected and sequenced
using an ABI 3730xl sequencer. The minimal sequence goal
was five phase 2 (fully oriented and ordered sequence with
some small gaps and low quality sequences) contigs, but 18
clones (3%) were sequenced as phase 1 due to large repetitive
sequences (Table S1 in Additional data file 1). To anchor
clones, a combination of sequence-based genetic mapping
[53], fingerprint contig data [54], and fluorescent in situ
hybridization (FISH) was used (Table S2 in Additional data
file 1). The sequence contig assembly was created based on
overlapping sequences. BAC sequences were assembled into
big sequence contigs by first comparing paired BES matches
and BAC sequences sharing overlapping positions on the tar-
get At chromosomes using Pipmaker [55]. Then, sequence
contigs were assembled based on overlapping sequences
using Phred/Phrap/Consed programs [56-58]. The location
of sequence contigs or BAC singletons was determined prima-
rily by genetic marker anchors with fingerprint contig infor-
mation, paired BES, and FISH results providing additional
information about local contig and BAC ordering. Pseudo-
chromosome sequences were created by connecting sequence
assemblies with 10-kbp additions of anonymous sequences.
All the Br sequences used in this study are available at NCBI
and the URL cited below in the 'Data used in this study' sec-
tion and relevant reference sequence sources are listed in
Table S6 in Additional data file 1.
Estimation of genome coverage and genome
annotation
The sequence coverage of the Br genome by BACs was esti-
mated by calculating the proportions of Br EST unigenes and
conserved single-copy rosid genes with strong matches. For
EST comparisons, we considered unigenes to have a genome
match if more than 90% of unigenes matched with at least
95% identity in a BLAT [59] analysis. For the single-copy
rosid gene comparison, we created a list of 1,070 single-copy
At and Mt genes not included in the Br EST collections. They
were considered to have a genome match in Br if at least 50%
of the gene matched in a TBLASTN [60] search at a cutoff of
<E
-100
. The assembled sequences were masked using Repeat-
Masker [61] using a dataset combining the plant repeat ele-
ment database of the Munich Information Center for Protein
Sequence (MIPS) [62] and our specialized database of Br
repetitive sequences. Gene model prediction was performed
using EVidenceModeler [63]. Putative exons and open read-
ing frames were predicted ab initio using FGENESH [64] and
AUGUSTUS [65] programs with the parameters trained using
the Br matrix. To predict consensus gene structures, Br ESTs
plus full-length cDNAs, plant transcripts, and plant protein
sequences were aligned to the predicted genes using PASA
[66] and AAT [67] packages. The predicted genes and evi-
dence sequences were then assembled according to the
weight of each evidence type using EVidenceModeler. The
highest scoring set of connected exons, introns, and noncod-
ing regions was selected as a consensus gene model. Proteins
encoded by gene models were searched against the Pfam
database [68] and automatically assigned a putative name
based on conserved domain hits or similarity with previously
identified proteins. Annotated gene models were also
searched against a database of plant transposon-encoded
proteins [69]. Predicted proteins with a top match to transpo-
son-encoded proteins were excluded from the annotation and
gene counts.
Identification of syntenic blocks based on genome
comparisons
Syntenic regions of the genomes of Br and At were identified
by a proteome comparison based on BLASTP [60] analysis.
The entire proteomes of the two genomes were compared,
and only the top reciprocal BLASTP matches per chromo-
some pair were selected (minimum of 50% alignment cover-
age at a cutoff of <E
-20
). We chose to perform a BLASTP
similarity search because it is inherently more sensitive than
BLASTN [60]. Moreover, the BLASTP hit matrix contains
fewer BLAST hits that are due to repetitive nucleotide
sequences. Chromosome scale synteny blocks were inferred
by visual inspection of dot-plots using DiagHunter with
parameters as described in Cannon et al. [36]. Gene orienta-
tion, insertions/deletions, and inversions were considered,
and at least four genes with the same respective orientations
in both genomes were required to establish a primary candi-
date synteny block. To distinguish highly homologous real
synteny blocks from false positives due to multiple rounds of
polyploidy followed by genome rearrangement, we manually
checked all the primary candidate blocks. Previous studies
reported that the degree of gene conservation between At and
the Brassica genome in several selected syntenic regions was
>50%. Based on this result, 227 blocks showing a gene con-
servation index of >50% (twice the number of conserved
matches divided by the total number of non-redundant genes
in the blocks; tandem duplicated genes were collapsed to a
single homolog) were selected as real syntenic regions. For
microsynteny analysis, we manually broke the blocks if At
homologs of independent Br sequences in the syntenic blocks
Genome Biology 2009, Volume 10, Issue 10, Article R111 Mun et al. R111.16
Genome Biology 2009, 10:R111
were separated by more than 10 kbp. The synteny display is
available online at the URL cited in the 'Data used in this
study' section.
Ks analysis of homologous sequences
The timing of duplication events and the divergence of
homologous segments was estimated by calculating the
number of synonymous substitutions per synonymous site
(Ks) between homologous genes. For the model genome com-
parisons, annotated gene models were used, whereas for the
comparison between the Brassica genomes, ESTs were ana-
lyzed, even though they are error-prone. One drawback asso-
ciated with the analysis of paralogs derived from ESTs is that
multiple entries for the same gene can be included in the
dataset, leading to overestimation of redundant Ks measures
[5]. However, it is reasonable to assume that redundant Ks
measures are randomly distributed among all the Ks values;
thus. the effect of redundancy is likely to have been neutral.
Before comparing the Ks distribution for EST paralogs and
genome sequences of Br, we carefully checked the patterns of
Ks in the EST data; we did not find any significantly overesti-
mated bulges or peaks. To identify orthologs and paralogs,
the protein sequences of the gene models or ESTs were
aligned using the all-against-all alignment and the resulting
alignment was used as a reference to align the nucleotide
sequences. After removing gaps, the Ks values from pairwise
alignments of homologous sequences were determined using
the maximum likelihood method implemented in the
CODEML [70] program of the PAML [71] package under the
F3×4 model, similar to the analysis described by Blanc et al.
[25]. We compared the mode rather than the mean of Ks dis-
tributions, because the mode is not affected by bias due to
incorrectly defined homolog pairs, which is partly responsible
for unexpected overestimation of Ks. Only gene pairs with a
Ks estimate of <5 were considered for further evaluation and
their Ks age distribution was calculated using the interval
0.02 to 0.1. Divergence time calculations were based on the
neutral substitution rate of 1.5 × 10
-8
substitutions per site per
year for chalcone synthase (Chs) and alcohol dehydrogenase
(Adh) [40].
Gene conservation between sister blocks in the B. rapa
genome
Because Br BAC clones were selected to minimally overlap
the target At region, self comparison of Br sequences using
the DiagHunter program found few duplicated regions (Fig-
ure S4 in Additional data file 2). Instead, we manually identi-
fied sister blocks of duplication events by using synteny group
information between Br and At. Br sequence blocks were
defined as putative sister blocks of 3R if two different
sequence blocks showed high synteny with respect to At
regions known to be duplicated remnants of 3R [72], whereas
independent Br sequence blocks sharing the same syntenic
relationship with a single At region were selected as sister
blocks of 4R. For additional validation, we compared the Ks
distribution modes between the paralog gene pairs in the sis-
ter blocks.
Data used in this study
All the data used in this study can be accessed online at [73].
Abbreviations
AK: ancestral karyotype; At: Arabidopsis thaliana; BAC: bac-
terial artificial chromosome; Bc: Brassica carinata; BES:
BAC end sequence; Bj: Brassica juncea; Bn: Brassica nigra;
Bna: Brassica napus; Bo: Brassica oleracea; Br: Brassica
rapa; EST: expressed sequence tag; FISH: fluorescent in situ
hybridization; kbp, kilobase-pairs; Ks: substitutions per syn-
onymous site; LTR: long terminal repeat retrotransposon;
Mbp: megabase-pair; Mt: Medicago truncatula; MYA: mil-
lion years ago; NCBI: National Center for Biotechnology
Information; Os: Oryza sativa; Pt: Populus trichocarpa; TE:
transposable element; WGD: whole genome duplication;
WGT: whole genome triplication.
Authors' contributions
JHM designed research, performed the experiments, ana-
lyzed data, and wrote the manuscript. SJK and TJY designed
research and contributed analytic tools. SJK, MJ, JAK, MHL,
JSK, KBL, and SIL contributed to data acquisition. YJS and
SB developed the database and interfaces to display results on
the web. SB, BSC, HJY, DSK, NK, and JHH analyzed data.
HJY, IB, and YPL participated in manuscript preparation.
BSP conceived the project and supervised its execution.
Additional data files
The following additional data are available with the online
version of this paper: Tables S1, S2, S3, S4, S5 and S6 (Addi-
tional file 1); Figures S1, S2, S3 and S4 (Additional file 2); a
spreadsheets listing synteny blocks between Br and At
genomes (Additional file 3); spreadsheets describing genome
blocks and block boundaries of the ancestral karyotype (AK)
mapped on the B. rapa chromosomes based on Br-At synteny
and At-AK correspondences (Additional file 4).
Additional data file 1Tables S1, S2, S3, S4, S5 and S6Table S1: summary of B. rapa sequence contigs, constituent BAC associations, and targeting of homologous regions of A. thaliana based on BLASTZ matches. Table S2: location of sequence contigs on the B. rapa chromosomes according to a combination of genetic map position, FISH results, physical map contig, and positional information from A. thaliana counterparts. Table S3: statistics of microsynteny in the synteny blocks identified by a genome compar-ison of B. rapa and A. thaliana. Table S4: identification of sister blocks produced by the same polyploidy events in the Br genome based on At-At and At-Br relationships. Table S5: identification of sister blocks produced by the same polyploidy events in the Bo genome. Table S6: sources of genomic and transcript sequences used in this study.Click here for fileAdditional data file 2Figures S1, S2, S3 and S4Figure S1: comparison of homologous block end-point distances between 410 B. rapa sequence contigs and their Arabidopsis coun-terpart regions, indicating a genome shrinkage of approximately 30% in B. rapa. Figure S2: abundance of different transposable ele-ment types in the B. rapa genome. Figure S3: comparison of Brassica 'A' genome structures between B. rapa and B. napus. Genome blocks were defined based on 24 AK genome building blocks. The genome structure of Bna was obtained from the reports of Parkin et al. [23] and Schranz et al. [37]. Regions characterized by significant rearrangements (pink box) or insertions/deletions (gray box) between genomes are highlighted by colored boxes. Scale bars on the margins indicate megabase-pairs (Mbp) for Br or centi-Morgans (cM) for Bna. Blocks with the opposite orientation relative to AK are indicated by a gray upward-pointing arrow on the right side of the block. Figure S4: dot plot of B. rapa compared with itself. Each dot in the dot plot represents a reciprocal best BLASTP match between gene pairs at a cutoff value of <E
-20
. Red dots show the regions of synteny identified by DiagHunter.Click here for fileAdditional data file 3Synteny blocks between Br and At genomesThe data provided include two worksheets. Gene correspondence data for the 227 synteny blocks identified by DiagHunter are pro-vided in the worksheet entitled 'blocks.' The synteny quality of the blocks is included in the worksheet named 'quality'; tandem dupli-cated genes were considered to be single homologs. The quality of synteny was defined as described in the Materials and methods.Click here for fileAdditional data file 4Genome blocks and block boundaries of the ancestral karyotype (AK) mapped on the B. rapa chromosomes based on Br-At synteny and At-AK correspondencesThis dataset indicates the block order, orientation, and color-cod-ing used for each AK block. The synteny-defined block boundaries on the Br chromosomes identified by DiagHunter were defined according to the At locus name described by Schranz et al. [37]. Supporting data, including gene correspondences in all synteny blocks, are included in the worksheet 'At-Br matches in synteny blocks'. Mapping of AK blocks to the Br chromosomes, including block boundaries and orientation, is provided in the worksheet 'AK blocks to Br'. A summary table and graph of AK mapping to the Br chromosomes is provided in the worksheet 'Br chr. chart'.Click here for file
Acknowledgements
We thank the many participants in the Korea Brassica rapa Genome
Project. Collaborators meriting special note include Hyung Tae Kim of
Macrogen for BAC sequencing and Eu-Ki Kim of NIAB, RDA, and the
Korean Bioinformation Center, KRIBB, for bioinformatics support. This
work was supported by the National Academy of Agricultural Science (05-
1-12-2-1, 200901FHT020710397, and 200901FHT020508369) and by the
BioGreen 21 Program (20050301034438), Rural Development Administra-
tion, Korea.
References
1. De Bodt S, Maere S, Peer Y Van de: Genome duplication and the
origin of angiosperm. Trends Ecol Evol 2005, 20:591-597.
2. Sun G, Dilcher DL, Zheng Z, Zhou Z: In search of the first flower:
Genome Biology 2009, Volume 10, Issue 10, Article R111 Mun et al. R111.17
Genome Biology 2009, 10:R111
a Jurassic angiosperm, Archaefructus, from northeast China.
Science 1998, 282:1692-1695.
3. Sun G, Ji Q, Dilcher DL, Zheng S, Nixon KC, Wang X: Archaefruc-
taceae, a new basal angiosperm family. Science 2002,
296:899-904.
4. Leitch IJ, Soltis DE, Soltis PS, Bennett MD: Evolution of DNA
amounts across land plants (embryophyta). Ann Bot 2005,
95:207-217.
5. Blanc G, Wolfe KH: Widespread paleopolyploidy in model
plant species inferred from age distributions of duplicate
genes. Plant Cell 2004, 16:1667-1678.
6. Cui L, Wall PK, Leebens-Mack JH, Lindsay BG, Soltis DE, Doyle JJ,
Soltis PS, Carlson JE, Arumuganathan K, Barakat A, Albert VA, Ma H,
dePamphilis CW: Widespread genome duplications through-
out the history of flowering plants. Genome Res 2006,
16:738-749.
7. The Arabidopsis Genome Initiative: Analysis of the genome
sequence of the flowering plant Arabidopsis thaliana. Nature
2000, 408:796-815.
8. International Rice Genome Sequencing Project: The map-based
sequence of the rice genome. Nature 2005, 436:793-800.
9. Tuskan GA, Difazio S, Jansson S, Bohlmann J, Grigoriev I, Hellsten U,
Putnam N, Ralph S, Rombauts S, Salamov A, Schein J, Sterck L, Aerts
A, Bhalerao RR, Bhalerao RP, Blaudez D, Boerjan W, Brun A, Brunner
A, Busov V, Campbell M, Carlson J, Chalot M, Chapman J, Chen GL,
Cooper D, Coutinho PM, Couturier J, Covert S, Cronk Q, et al.: The
genome of black cottonwood, Populus trichocarpa (Torr. &
Gray). Science 2006, 313:1596-1604.
10. The French-Italian Public Consortium for Grapevine Genome Char-
acterization: The grapevine genome sequence suggests ances-
tral hexaploidization in major angiosperm phyla.
Nature 2007,
449:463-468.
11. Ming R, Hou S, Feng Y, Yu Q, Dionne-Laporte A, Saw JH, Senin P,
Wang W, Ly BV, Lewis KL, Salzberg SL, Feng L, Jones MR, Skelton RL,
Murray JE, Chen C, Qian W, Shen J, Du P, Eustice M, Tong E, Tang H,
Lyons E, Paull RE, Michael TP, Wall K, Rice DW, Albert H, Wang ML,
Zhu YJ, et al.: The draft genome of the transgenic tropical fruit
tree papaya (Carica papaya Linnaeus). Nature 2008,
452:991-996.
12. Paterson AH, Bowers JE, Bruggmann R, Dubchak I, Grimwood J,
Gundlach H, Haberer G, Hellsten U, Mitros T, Poliakov A, Schmutz J,
Spannagl M, Tang H, Wang X, Wicker T, Bharti AK, Chapman J, Feltus
FA, Gowik U, Grigoriev IV, Lyons E, Maher CA, Martis M, Narechania
A, Otillar RP, Penning BW, Salamov AA, Wang Y, Zhang L, Carpita
NC, et al.: The Sorghum bicolor genome and the diversification
of grasses. Nature 2009, 457:551-556.
13. Vitte C, Bennetzen JL: Analysis of retrotransposon structural
diversity uncovers properties and propensities in
angiosperm genome evolution. Proc Natl Acad Sci USA 2006,
103:17638-17643.
14. Blanc G, Wolfe KH: Functional divergence of duplicated genes
formed by polyploidy during Arabidopsis evolution. Plant Cell
2004, 16:1679-1691.
15. Devos KM, Brown JK, Bennetzen JL: Genome size reduction
through illegitimate recombination counteracts genome
expansion in Arabidopsis. Genome Res 2002, 12:1075-1079.
16. Paterson AH, Bowers JE, Peterson DG, Estill JC, Chapman BA:
Structure and evolution of cereal genomes. Curr Opin Genet
Dev 2003, 13:644-650.
17. Choi HK, Mun J-H, Kim DJ, Zhu H, Baek JM, Mudge J, Roe B, Ellis N,
Doyle J, Kiss GB, Young ND, Cook DR: Estimating genome con-
servation between crop and model legume species. Proc Natl
Acad Sci USA 2004, 101:15289-15294.
18. Cannon SB, Sterck L, Rombauts S, Sato S, Cheung F, Gouzy J, Wang
X, Mudge J, Vasdewani J, Schiex T, Spannagl M, Monaghan E, Nichol-
son C, Humphray SJ, Schoof H, Mayer KF, Rogers J, Quétier F, Old-
royd GE, Debellé F, Cook DR, Retzel EF, Roe BA, Town CD, Tabata
S, Peer Y Van de, Young ND: Legume genome evolution viewed
through the Medicago truncatula and
Lotus japonicus
genomes. Proc Natl Acad Sci USA 2006, 103:14959-14964.
19. Town CD, Cheung F, Maiti R, Crabtree J, Haas BJ, Wortman JR, Hine
EE, Althoff R, Arbogast TS, Tallon LJ, Vigouroux M, Trick M, Bancroft
I: Comparative genomics of Brassica oleracea and Arabidopsis
thaliana reveal gene loss, fragmentation, and dispersal after
polyploidy. Plant Cell 2006, 18:1348-1359.
20. Yang TJ, Kim JS, Kwon SJ, Lim KB, Choi BS, Kim JA, Jin M, Park JY, Lim
MH, Kim HI, Lim YP, Kang JJ, Hong JH, Kim CB, Bhak J, Bancroft I,
Park BS: Sequence-level analysis of the diploidization process
in the triplicated FLOWERING LOCUS C region of Brassica
rapa. Plant Cell 2006, 18:1339-1347.
21. Beilstein MA, Al-Shehbaz IA, Kellogg EA: Brassicaceae phylogeny
and trichome evolution. Am J Bot 2006, 93:607-619.
22. Economic Research Service, USDA: Vegetables and Melons
Outlook [ />World.pdf]
23. Parkin IA, Gulden SM, Sharpe AG, Lukens L, Trick M, Osborn TC,
Lydiate DJ: Segmental structure of the Brassica napus genome
based on comparative analysis with Arabidopsis thaliana.
Genetics 2005, 171:765-781.
24. Lukens L, Zou F, Lydiate D, Parkin I, Osborn T: Comparison of a
Brassica oleracea genetic map with the genome of Arabidopsis
thaliana. Genetics 2003, 164:359-372.
25. Blanc G, Hokamp K, Wolfe KH: A recent polyploidy superim-
posed on older large-scale duplications in the Arabidopsis
genome. Genome Res 2003, 13:137-144.
26. Lysak MA, Koch MA, Pecinka A, Schubert I: Chromosome triplica-
tion found across the tribe Brassiceae. Genome Res 2005,
15:516-525.
27. Brassica Genome Gateway. []
28.
The Korea Brassica rapa Genome Project [http://
www.brassica-rapa.org/BRGP/index.jsp]
29. Yang TJ, Kim JS, Lim KB, Kwon SJ, Kim JA, Jin M, Park JY, Lim MH, Kim
HI, Kim SH, Lim YP, Park BS: The Korea Brassica Genome
Projects: a glimpse of the Brassica genome based on compar-
ative genome analysis with Arabidopsis. Comp Funct Genomics
2005, 6:138-146.
30. Johnston JS, Pepper AE, Hall AE, Chen ZJ, Hodnett G, Drabek J, Lopez
R, Price HJ: Evolution of genome size in Brassicaceae. Ann Bot
2005, 95:229-235.
31. Meyers BC, Kozik A, Griego A, Kuang H, Michelmore RW:
Genome-wide analysis of NBS-LRR-encoding genes in Arabi-
dopsis. Plant Cell 2003, 15:809-834.
32. Mun J-H, Yu H-J, Park S, Park B-S: Genome-wide identification of
NBS-encoding resistance genes in Brassica rapa. Mol Genet
Genomics 2009. doi: 10.1007/s00438-009-0492-0
33. Zhang X, Wessler SR: Genome-wide comparative analysis of
the transposable elements in the related species Arabidopsis
thaliana and Brassica oleracea. Proc Natl Acad Sci USA 2004,
101:5589-5594.
34. Lim KB, Yang TJ, Hwang YJ, Kim JS, Park JY, Kwon SJ, Kim J, Choi BS,
Lim MH, Jin M, Kim HI, de Jong H, Bancroft I, Lim YP, Park BS: Char-
acterization of the centromere and peri-centromere retro-
transposons in Brassica rapa and their distribution in related
Brassica species. Plant J 2007, 49:173-183.
35. Kwon SJ, Kim DH, Lim MH, Long Y, Meng JL, Lim KB, Kim JA, Kim JS,
Jin M, Kim HI, Ahn SN, Wessler SR, Yang TJ, Park BS: Terminal
repeat retrotransposon in miniature (TRIM) as DNA mark-
ers in Brassica relatives. Mol Genet Genomics 2007, 278:361-370.
36. Cannon SB, Kozik A, Chan B, Michelmore R, Young ND: Diag-
Hunter and GenoPix2D: programs for genomic compari-
sons, large-scale homology discovery and visualization.
Genome Biol 2003, 4:
R68.
37. Schranz ME, Lysak MA, Mitchell-Olds T: The ABC's of compara-
tive genomics in the Brassicaceae: building blocks of crucifer
genomes. Trends Plant Sci 2006, 11:535-542.
38. Lysak MA, Berr A, Pecinka A, Schmidt R, McBreen K, Schubert I:
Mechanisms of chromosome number reduction in Arabidop-
sis thaliana and related Brassicaceae species. Proc Natl Acad Sci
USA 2006, 103:5224-5229.
39. Henry Y, Bedhomme M, Blanc G: History, protohistory and pre-
history of the Arabidopsis thaliana chromosome comple-
ment. Trends Plant Sci 2006, 11:267-273.
40. Koch MA, Haubold B, Mitchell-Olds T: Comparative evolutionary
analysis of chalcone synthase and alcohol dehydrogenase loci
in Arabidopsis, Arabis, and related genera (Brassicaceae). Mol
Biol Evol 2000, 17:1483-1498.
41. Paterson AH: Leafing through the genomes of our major crop
plants: strategies for capturing unique information. Nat Rev
Genet 2006, 7:174-184.
42. Rabinowicz PD, Schutz K, Dedhia N, Yordan C, Parnell LD, Stein L,
McCombie WR, Martienssen RA: Differential methylation of
genes and retrotransposons facilitates shotgun sequencing
of the maize genome. Nat Genet 1999, 23:305-308.
43. Peterson DG, Schulze SR, Sciara EB, Lee SA, Bowers JE, Nagel A, Jiang
N, Tibbitts DC, Wessler SR, Paterson AH: Integration of Cot anal-
ysis, DNA cloning, and high-throughput sequencing facili-
Genome Biology 2009, Volume 10, Issue 10, Article R111 Mun et al. R111.18
Genome Biology 2009, 10:R111
tates genome characterization and gene discovery. Genome
Res 2002, 12:795-807.
44. Lynch M, Conery JS: The evolutionary fate and consequences of
duplicate genes. Science 2000, 290:1151-1155.
45. Adams KL, Wendel JF: Novel patterns of gene expression in
polyploid plants. Trends Genet 2005, 21:539-543.
46. Buggs RJA, Doust AN, Tate JA, Koh J, Soltis K, Feltus FA, Paterson
AH, Soltis PS, Soltis DE: Gene loss and silencing in Tragopogon
miscellus (Asteraceae): comparison of natural and synthetic
allotetraploids. Heredity 2009, 103:73-81.
47. Song K, Lu P, Tang K, Osborn TC: Rapid genome change in syn-
thetic polyploids of Brassica and its implications for poly-
ploidy evolution. Proc Natl Acad Sci USA 1995, 92:7719-7723.
48. Wendel JF: Genome evolution in polyploids. Plant Mol Biol 2000,
42:225-249.
49. Bennetzen JL, Ma J, Devos KM: Mechanisms of recent genome
size variation in flowering plants. Ann Bot 2005, 95:127-132.
50. Gaeta RT, Pires JC, Iniguez-Luy F, Leon E, Osborn TC: Genomic
changes in resynthesized Brassica napus and their effect on
gene expression and phenotype. Plant Cell 2007, 19:3403-3417.
51. Chantret N, Cenci A, Sabot F, Anderson O, Dubcovsky J: Sequenc-
ing of the Triticum monococcum hardness locus reveals good
microcolinearity with rice. Mol Genet Genomics 2004,
271:377-386.
52. Adams KL, Wendel JF: Novel patterns of gene expression in
polyploid plants.
Trends Genet 2005, 21:539-543.
53. Kim JS, Chung TY, King GJ, Jin M, Yang TJ, Jin YM, Kim HI, Park BS: A
sequence-tagged linkage map of Brassica rapa. Genetics 2006,
174:29-39.
54. Mun J-H, Kwon SJ, Yang TJ, Kim HS, Choi BS, Baek S, Kim JS, Jin M,
Kim JA, Lim MH, Lee SI, Kim HI, Kim H, Lim YP, Park BS: The first
generation of a BAC-based physical map of Brassica rapa.
BMC Genomics 2008, 9:280.
55. Schwartz S, Zhang Z, Frazer KA, Smit A, Riemer C, Bouck J, Gibbs R,
Hardison R, Miller W: PipMaker-a web server for aligning two
genomic DNA sequences. Genome Res 2000, 10:577-586.
56. Gordon D, Abajian C, Green P: Consed: a graphical tool for
sequence finishing. Genome Res 1998, 8:195-202.
57. Ewing B, Hillier L, Wendl M, Green P: Base calling of automated
sequencer traces using phred. I. Accuracy assessment.
Genome Res 1998, 8:175-185.
58. Ewing B, Green P: Basecalling of automated sequencer traces
using phred. II. Error probabilities. Genome Res 1998,
8:186-194.
59. Kent WJ: BLAT - the BLAST-like alignment tool. Genome Res
2002, 12:656-664.
60. Altschul SF, Madden TL, Schäffer AA, Zhang J, Zhang Z, Miller W, Lip-
man DJ: Gapped BLAST and PSI-BLAST: a new generation of
protein database search programs. Nucleic Acid Res 1997,
25:3389-3402.
61. RepeatMasker. [ />62. Munich Information Center for Protein Sequence. [http://
mips.gsf.de/proj/plant/webapp/recat/]
63. Haas BJ, Salzberg SL, Zhu W, Pertea M, Allen JE, Orvis J, White O,
Buell CR, Wortman JR: Automated eukaryotic gene structure
annotation using EVidenceModeler and the Program to
Assemble Spliced Alignments. Genome Biol 2008, 9:R7.
64. FGENESH. []
65. Stanke M, Morgenstern B: AUGUSTUS: a web server for gene
prediction in eukaryotes that allows user-defined con-
straints. Nucleic Acid Res 2005, 33:W465-W467.
66. Haas BJ, Delcher AL, Mount SM, Wortman JR, Smith RK, Hannick LI,
Maiti R, Ronning CM, Rusch DB, Town CD, Salzberg SL, White O:
Improving the Arabidopsis genome annotation using maxi-
mal transcript alignment assemblies. Nucleic Acid Res 2003,
31:5654-5666.
67. Huang X, Adams MD, Zhou H, Kerlavage AR: A tool for analyzing
and annotating genomic sequences. Genomics 1997, 46:37-45.
68. Bateman A, Birney E, Cerruti L, Durbin R, Etwiller L, Eddy SR, Grif-
fiths-Jones S, Howe KL, Marshall M, Sonnhammer EL: The Pfam
protein families database. Nucleic Acid Res 2002, 30:276-280.
69. Plant Transposon-encoded Protein Database. [ftp://
ftp.tigr.org/pub/data/TransposableElements/transposon_db.pep]
70. Goldman N, Yang Z: A codon-based model of nucleotide sub-
stitution for protein-coding DNA sequences. Mol Biol Evol
1994, 11:725-736.
71. Yang Z: PAML 4: phylogenetic analysis by maximum likeli-
hood. Mol Biol Evol 2007, 24:1586-1591.
72. Bowers JE, Chapman BA, Rong J, Paterson AH: Unravelling
angiosperm genome evolution by phylogenetic analysis of
chromosomal duplication events. Nature 2003, 422:433-438.
73. Data used in this study. [ />74. The Arabidopsis Information Resource. [bidop
sis.org/portals/genAnnotation]