Báo cáo y học: " Regulatory interdependence of myeloid transcription factors revealed by Matrix RNAi analysis" docx
Bạn đang xem bản rút gọn của tài liệu. Xem và tải ngay bản đầy đủ của tài liệu tại đây (1.38 MB, 13 trang )
Genome Biology 2009, 10:R121
Open Access
2009Tomaruet al.Volume 10, Issue 11, Article R121
Research
Regulatory interdependence of myeloid transcription factors
revealed by Matrix RNAi analysis
Yasuhiro Tomaru
*†
, Christophe Simon
*
, Alistair RR Forrest
*‡
,
Hisashi Miura
*†
, Atsutaka Kubosaki
*
, Yoshihide Hayashizaki
*†
and
Masanori Suzuki
*†
Addresses:
*
RIKEN Omics Science Center, RIKEN Yokohama Institute 1-7-22 Suehiro-cho, Tsurumi-ku, Yokohama, Kanagawa 230-0045,
Japan.
†
International Graduate School of Arts and Sciences, Yokohama City University, 1-7-29 Suehiro-Cho, Tsurumi-Ku, Yokohama 230-
0045, Japan.
‡
The Eskitis Institute for Cell and Molecular Therapies, Griffith University, Brisbane Innovation Park, Don Young Road, Nathan,
QLD 4111, Australia.
Correspondence: Masanori Suzuki. Email:
© 2009 Tomaru et al.; licensee BioMed Central Ltd.
This is an open access article distributed under the terms of the Creative Commons Attribution License ( which
permits unrestricted use, distribution, and reproduction in any medium, provided the original work is properly cited.
Transcription factor interdependence<p>The knockdown of 78 transcription factors in differentiating human THP-1 cells using matrix RNAi reveals their interdependence</p>
Abstract
Background: With the move towards systems biology, we need sensitive and reliable ways to
determine the relationships between transcription factors and their target genes. In this paper we
analyze the regulatory relationships between 78 myeloid transcription factors and their coding
genes by using the matrix RNAi system in which a set of transcription factor genes are individually
knocked down and the resultant expression perturbation is quantified.
Results: Using small interfering RNAs we knocked down the 78 transcription factor genes in
monocytic THP-1 cells and monitored the perturbation of the expression of the same 78
transcription factors and 13 other transcription factor genes as well as 5 non-transcription factor
genes by quantitative real-time RT-PCR, thereby building a 78 × 96 matrix of perturbation and
measurement. This approach identified 876 cases where knockdown of one transcription factor
significantly affected the expression of another (from a potential 7,488 combinations). Our study
also revealed cell-type-specific transcriptional regulatory networks in two different cell types.
Conclusions: By considering whether the targets of a given transcription factor are naturally up-
or downregulated during phorbol 12-myristate 13-acetate-induced differentiation, we could classify
these edges as pro-differentiative (229), anti-differentiative (76) or neither (571) using expression
profiling data obtained in the FANTOM4 study. This classification analysis suggested that several
factors could be involved in monocytic differentiation, while others such as MYB and the
leukemogenic fusion MLL-MLLT3 could help to maintain the initial undifferentiated state by
repressing the expression of pro-differentiative factors or maintaining expression of anti-
differentiative factors.
Published: 2 November 2009
Genome Biology 2009, 10:R121 (doi:10.1186/gb-2009-10-11-r121)
Received: 7 July 2009
Accepted: 2 November 2009
The electronic version of this article is the complete one and can be
found online at /> Genome Biology 2009, Volume 10, Issue 11, Article R121 Tomaru et al. R121.2
Genome Biology 2009, 10:R121
Background
The importance of transcription factors (TFs) in regulating
gene expression and determining cellular states is well
known. However, in mammalian systems, the lists of target
genes and the interdependence of most TFs are still poorly
defined. Due to the connectivity of transcriptional regulatory
networks (TRNs), the activities of any given TF can be regu-
lated by many other factors. Approaches to identify TF-target
gene dependencies include TF binding site (TFBS) predic-
tions (for the 200 or so factors with well defined motifs) [1],
whole-genome chromatin immunoprecipitation (ChIP)
experiments [2,3] and perturbation experiments that use
overexpression [4], knockdown [5-7] or knockout [8,9] of a
TF in question followed by expression profiling to determine
TF-target gene dependencies.
Considering the short nature of most TFBSs, their prediction
is noisy, with large numbers of false positives. Most research-
ers focus on experimentally identified promoter regions
rather than the whole genome and use inter-species conser-
vation information to improve the signal-to-noise ratio of
TFBS predictions [10]. Another issue that affects the quality
of these predictions is that different TFBS position weight
matrices have different predictive power. This can be due to
the variable length of TFBSs, the variability in information
content along the length of the motif and the varying quality
(and depth of known true positives) of the data used to gener-
ate the matrices in the first place.
ChIP analysis, in particular ChIP-seq [2,11], is becoming a
gold standard for determining TF-target gene associations;
however, these are currently limited by the number of ChIP-
quality antibodies available. In addition, it is not entirely clear
if the binding of a factor to a genomic region is sufficient to
infer that the factor regulates genes within that region [12,13].
On the other hand, perturbation experiments using RNA
interference (RNAi) knockdown can be virtually applied to
any TF because specific small interfering RNAs (siRNAs)
should be available to silence the target TF genes. The effects
of decreasing the concentration of a given TF on the expres-
sion of other genes can be directly measured; if an effect is
observed, the factor either directly or indirectly regulates
expression of that particular target gene [7].
We have developed a systematic RNAi-perturbation analysis
system, named Matrix RNAi, in which siRNA knockdown and
quantitative real-time RT-PCR (qRT-PCR) are used in combi-
nation on the same set of TFs to determine their interdepend-
encies [7]. The Matrix RNAi approach has already been
proven to be very useful to identify TF-TF gene regulatory
relationships of a small set of regulators and the regulatory
regions of some of their target genes that are involved in com-
binatorial transcriptional regulation [14]. This prompted us
to assess in more detail the general applicability of the Matrix
RNAi experimental system to inter-TF TRN analysis, includ-
ing combinatorial regulation. Here we exploit the Matrix
RNAi analysis system to examine the interdependency of 78
TFs in the human acute myeloid leukemia (AML) cell line
THP-1 [15]. THP-1 cells can be induced to differentiate into
macrophage-like cells by activation with phorbol 12-myr-
istate 13-acetate (PMA) or vitamin D3 and are widely used as
the experimental model of monocytic differentiation [16].
The dynamic transcriptional network of THP-1 cells during
PMA-induced differentiation was recently analyzed inten-
sively by the FANTOM4 consortium [17]. The majority of fac-
tors targeted in the present study are known or suspected to
be TFs with roles in myeloid cell lineages and several are
implicated in leukemia. In addition, we include factors pre-
dicted by the FANTOM4 consortium as important in regulat-
ing monocytic differentiation [17]. Although these TF genes
have been implicated in myeloid cell functioning, how and
whether they work together has not been previously
addressed. In the present Matrix RNAi approach, we knocked
down these 78 TFs and then measured the perturbation
effects on a panel of 96 genes (91 TF and 5 non-TF genes),
including the original 78, by qRT-PCR.
This approach extracted 876 significant TF-TF gene candi-
date edges from a total of 7,488 possible combinations. Out of
these, 654 were activating edges (that is, knockdown of one
TF led to a decrease of expression of another) and 222 were
repressing edges (that is, knockdown of one TF led to an
increase of expression of another). Using TFBS predictions in
the proximal regulatory regions and targeted ChIP, we then
attempted to identify which of these edges were most likely to
be direct ones. This approach is successfully applied to build
the framework of an inter-TF TRN in the monocytic leukemia
cell and we discuss its structure in relation to leukemia, mye-
loid differentiation and maintenance of the undifferentiated
state.
Results and discussion
Target gene selection and optimization of siRNA
transfections
We carried out RNAi knockdown of individual TFs that were
predicted to play a role in PMA-mediated differentiation of
THP-1 cells to assess the impact on genome-wide gene
expression using Illumina whole genome microarrays. This
was used to experimentally confirm the gene dependency pre-
dicted using the expression-weighted TFBS predictions for
the TFs targeted (see [17] for analysis of the transcriptional
network of THP-1 cells during PMA-induced differentiation).
It also allowed us to explore the role of each factor in the dif-
ferentiation process, including those lacking currently availa-
ble information about their TFBS motifs. In the present
study, we focused on TF-TF gene dependencies (edges) and
for this purpose used qRT-PCR measurements, enabling us to
more precisely measure the responses or perturbations of a
panel of TF genes to the knockdown of individual TFs. The
TFs targeted include many of those previously reported to be
involved in differentiation and myeloid leukemia and others
Genome Biology 2009, Volume 10, Issue 11, Article R121 Tomaru et al. R121.3
Genome Biology 2009, 10:R121
predicted to play a role in differentiation from our TFBS anal-
yses [17]. We also supplemented this list with a set of nine siR-
NAs against TFs commonly expressed in THP-1 cells and
HepG2, a human hepatoma cell line, to explore network vari-
ation in different cellular systems (Additional data file 1).
To begin the Matrix RNAi experiments, we assessed the
knockdown efficiency and reproducibility of a panel of 91 siR-
NAs targeting 86 TF and 5 non-TF genes. Chemically modi-
fied 'stealth siRNAs' (Invitrogen, Carlsbad, CA, USA) that
were designed to reduce siRNA-induced interferon responses
and off-target effects were used in these experiments and sev-
eral were tested for each TF to select individual siRNAs caus-
ing at least 60% downregulation (as assessed by qRT-PCR).
For 83 TF genes we were able to find an siRNA that achieved
an average knockdown of more than 60%. We further filtered
these siRNAs according to two criteria - standard deviation
(SD) and P-value of the expression change (ΔΔC
T
; see
'Expression analysis' in Materials and methods) - for each TF
gene silenced: significant TF knockdown requires the average
ΔΔC
T
to be greater than 2 SDs, with a P-value of less than
0.05. These requirements excluded another five TFs and we
continued our analysis with the remaining 78 TFs (Additional
data file 1). We have also confirmed that the knockdown of a
random selection of 14 of these TF genes by specific siRNAs
resulted in significant reductions in the levels of the corre-
sponding TF proteins (Additional data file 2).
Matrix RNAi analysis
Using the 78 TF-specific siRNAs described above, we then
carried out a 78 × 96 matrix RNAi-perturbation analysis,
where the expression of 91 TF and 5 non-TF genes were
assessed by qRT-PCR. Each transfection was carried out in
quadruplicate and RNAs were harvested 48 hours after trans-
fection. RNAi knockdown efficiency and expression perturba-
tion of each TF gene were evaluated in a similar way to the
determination of the siRNA activities. The siRNA must pro-
duce at least 60% perturbation, and for an edge to be identi-
fied as significantly perturbed, the average expression change
(ΔΔC
T
) of each of the target TF genes needs to be greater than
2 SDs, with a P-value of less than 0.05 (Additional data file 3).
From a total of 7,488 possible edges from the 78 × 96 matrix
(Additional data file 4), we identified 876 putative edges that
were significantly perturbed in our analysis (Additional data
files 5 and 6 and Figure S1 in Additional data file 7). Out of
these, 654 were activating edges (that is, knockdown of one
factor led to a significant decrease in the expression of
another) and 222 were repressing edges (TF knockdown led
to an increase in the expression of another). The ratio of acti-
vating to repressing edges is similar to what we have observed
previously in the Matrix RNAi analysis of TFs enriched in
HepG2 cells [7]. In THP-1 cells, the majority of knockdowns
led to downregulation of target genes, indicating that these
TFs work as activators. On the other hand, knockdown of a
number of other TF genes, for example, MYB and NFE2L1,
led to upregulation of multiple genes. Such perturbations
biased in favor of upregulation suggest that these factors may
work primarily as repressors in THP-1 cells: MYB-specific
siRNA downregulated and upregulated 5 and 15 genes,
respectively, while NFE2L1 knockdown downregulated and
upregulated 4 and 16 genes, respectively.
The TF set examined in the present Matrix RNAi analysis con-
tains a number of redundant (paralogous) TFs - for example,
PPARD and PPARG, STAT1 and STAT3, RARA and RARG,
RXRA and RXRB - that could back up the other family mem-
ber knocked down, as observed in TF knockout budding yeast
[18]. If this is also the case in the RNAi knockdown and mam-
malian transcriptional regulatory system, knockdown of a TF
could be compensated by its paralogous TF(s), resulting in no
or little perturbation of expression of its target genes, which
would lead to underestimation of the perturbation results.
However, we found several examples that knockdown of each
of the redundant TFs leads to expression perturbations of
their common genes. For example, knockdown of PPARD and
PPARG, which are known to target the same recognition
sequence (a PPAR response element), were found to share
common target genes to be perturbed. All of the different
STATs bind to regulatory elements with the common core
motif [19] and our Matrix RNAi analysis includes two STAT
family members, STAT1 and STAT3. Their knockdown upreg-
ulated five common genes but also downregulated one gene
(EGR1). Knockdown of RXRA and RXRB, which also share
common sequence motifs, resulted in perturbation of four
common genes in the same direction. Moreover, in the knock-
down of these pairs of redundant TFs, no reciprocal rescue of
the paralogous counterparts was observed in our Matrix
RNAi study. These findings suggest that backup by redundant
paralogous TFs may not be a prevailing mechanism in the
Matrix RNAi system studied here. In the study on budding
yeast [18], backup by paralogous genes was mostly examined
in yeast cells in which the target genes had been knocked out
and functional compensation by their counterpart paralogs
had already been established. On the other hand, the knock-
down examined in the present study results in abrupt down-
regulation of each TF gene for which backup by a paralogous
counterpart may not have already been established. Perturba-
tion data from non-TFs may help to distinguish the effects of
transcriptional and non-transcriptional regulatory mecha-
nisms on the changes in gene expressions upon knockdown.
Our Matrix RNAi assays included five non-TF members
(BCL2, CR595360, FUS, NRAS, and PRPF31). RNAi knock-
down of BCL2 led to a slight change in the expression level of
only a single gene (SPI1) out of 78 TF genes (except self
knockdown). In contrast, knockdown of the other non-TF
genes, CR595360, FUS, NRAS, and
PRPF31, caused changes
in the expression of varying numbers of TF genes (7, 16, 12
and 12, respectively). These are clearly non-transcriptional
and/or indirect transcriptional regulatory effects.
Genome Biology 2009, Volume 10, Issue 11, Article R121 Tomaru et al. R121.4
Genome Biology 2009, 10:R121
In a similar fashion, these non-TF genes were also differen-
tially affected by knockdown of TFs: CR595360, BCL2 and
NRAS genes were significantly perturbed by 21, 13 and 12
TFs, respectively. In contrast, knockdown of only a single TF
affected the expression of the FUS and PRPF31 genes. These
non-TF genes were perturbed by 9.6 TFs on average. On the
other hand, 78 TF genes were significantly perturbed by
knockdown of 10.6 TFs (except self repression) on average.
This very small difference in the average number of TFs that
caused significant perturbations in the expression of TF and
non-TF genes is indicative of a small bias of perturbation by
TF knockdown toward TF genes.
It is interesting to note that CR595360 encodes an antisense
RNA against the GATA2 gene [20] but its function is unclear.
We found that GATA2 knockdown caused a significant down-
regulation of CR595360 expression, raising the possibility
that the TF may stimulate antisense RNA expression in grow-
ing THP-1 cells. In contrast, the regulation of GATA2 expres-
sion by CR595360 was not observed.
Characteristics of the perturbation network composed
of 876 TF-TF gene edges
From our perturbation analysis data identifying a total of 876
significant perturbation edges, the expression of 92 genes
were affected by knockdown of another factor, while the
expression of CTCF, HNF4G, MAZ and NFE2L1 was not
affected by any other TF gene knockdown. Knockdowns of 77
TF genes affected the expression of at least one other TF gene,
while knockdown of the gene SREBF1 did not affect the
expression of any other TF gene in the matrix.
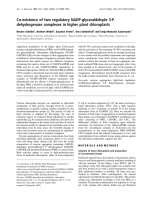
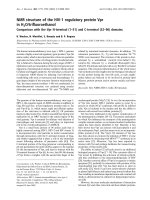
We would like to intend: Comparing the number of genes
affected by the knockdown of a given TF with the number of
other TFs whose knockdown affected the expression of the
given TF gene, we detected highly multiple input and output
nodes (Figure 1). The expression of each of the genes SNAI3,
RARG, ETS1, MAFB, PPARG, BCL6 and NFATC2 was
affected by knockdown of any TF of a set of more than 25 (the
sets of TFs used for each gene did not include the TF encoded
by that gene itself). Conversely, knockdown of MYB, MLLT3,
EGR1 TCF3, RREB1, STAT1, NFYA and NEF2L1 affected the
expression of more than 20 other TF genes. Notably, NFATC2
was both highly 'in-connected' and 'out-connected', suggest-
ing that it plays a role as a giant hub.
These numbers may be considered to be too high to explain
the direct transcriptional regulation by these TFs. Because
the process of enrichment or mining of potential candidates
for transcriptional regulatory edges intrinsically requires the
setting of appropriate thresholds for that purpose, the occur-
rence of false positives as well as false negatives may be inev-
itable; thus, the high number of positive edges may include a
considerable number of false positives.
Pro-differentiative and anti-differentiative edges in the
network
To further explore the network, we broke it down into two
sub-networks composed of pro-differentiative and anti-dif-
ferentiative edges using the FANTOM 4 data set. In the FAN-
TOM 4 data set, 64 and 34 TFs were most highly expressed in
the undifferentiated and differentiated states, respectively,
and thus categorized as anti-differentiative and pro-differen-
tiative [17]. Of our 96 target genes, 11 were classified as a pro-
differentiative TF gene and 13 as an anti-differentiative TF
gene (Additional data file 1). On the other hand, our matrix
RNAi analysis can discriminate activation from repression
among regulatory edges to target TF genes; we thus classified
the regulatory edges as pro-differentiative and anti-differen-
tiative. A pro-differentiative edge represents activation of a
pro-differentiative TF gene or repression of an anti-differen-
tiative TF gene. By contrast, an anti-differentiative edge rep-
resents activation of an anti-differentiative TF gene or
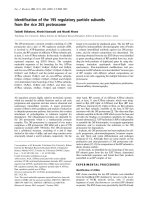
repression of a pro-differentiative TF gene. Figure 2 summa-
rizes the perturbation network composed of both pro-differ-
entiative and anti-differentiative edges.
Using the above definitions, we identified 229 pro-differenti-
ative edges from a total of 876 significant perturbation edges
revealed by knockdown of 65 factors and drew a perturbation
network composed of these pro-differentiative edges (see Fig-
ure S2 in Additional data file 7 for all the pro-differentiative
edges and Figure 3 for those identified among the 11 pro-dif-
ferentiative and the 13 anti-differentiative TFs and/or TF
genes). In this network, most edges detected were activating:
for example, BCL6, PRDM1, PPARG and MAFB levels were all
significantly reduced upon knockdown of multiple factors
and are normally upregulated during monocytic differentia-
Dot-plot showing the relationship between the number of input connections and output connectionsFigure 1
Dot-plot showing the relationship between the number of input
connections and output connections. The number of input and output
connections corresponds to that of TFs regulating a given TF gene and that
of TF genes regulated by a given TF, respectively. Only significant edges in
the perturbation network identified by the Matrix RNAi analysis are
counted.
Input
Output
NFATC2
NFYA
MYB
EGR1
STAT1
RREB1
MLLT3
TCF3
NFE2L1
BCL6
RARG
PPARG
MAFB
ETS1
SNAI3
50
45
40
35
30
25
20
15
10
5
0
302520151050
Genome Biology 2009, Volume 10, Issue 11, Article R121 Tomaru et al. R121.5
Genome Biology 2009, 10:R121
tion of THP-1 cells. However, some factors such as MYB and
TCFL5, which are both downregulated during differentiation,
appeared to be repressed by multiple factors. Of note,
HOXA13, CEBPB and CEBPD are restricted to the pro-differ-
entiative edge network, strongly suggesting their positive reg-
ulatory roles in THP-1 cellular differentiation.
We also drew a network composed of 76 anti-differentiative
edges generated by the knockdown of 44 factors (see Figure
S3 in Additional data file 7 for all the anti-differentiative
edges and Figure 4 for those identified among the 11 pro-dif-
ferentiative and the 13 anti-differentiative TFs and/or TF
genes). In this network, MYB appears to play in a central posi-
tion in repressing expression of BCL6, EGR2, SNAI3, PPARD,
PPARG, PRDM1 and MAFB, all of which are normally upreg-
ulated during PMA-induced differentiation. Of note, ID1 and
IRF8, which are known as negative transcriptional regulators
[21,22], are likely positively regulated by several TFs in the
anti-differentiative edge network, suggesting their involve-
ment in the maintenance of the undifferentiated (anti-differ-
entiative) state of monocytic cells.
MYB and MLLT3 synergistically function as anti-
differentiative factors in THP-1 cells
An siRNA targeting the leukemogenic fusion of MLL-MLLT3,
found in THP-1 cells [23], upregulated expression of MAFB
and downregulated that of both HOXA10 and HOXA13 (Fig-
ure S3 in Additional data file 7). Positive regulation of several
HOX genes (HOXA3, HOXA7 and HOXA10) by MLL-MLLT3
has been previously demonstrated using antisense oligonu-
cleotides [24]. HOXA10 overexpression results in AML and
prevents lymphomyelopoiesis [25,26] and HOXA13 is the
known target of another leukemogenic fusion related to AML
[27]. Our finding indicates that MLL-MLLT3 plays a role in
extensive positive regulation of HOXA genes highly con-
nected to AML pathology.
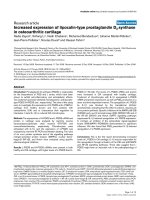
Perturbation networks of both pro-differentiative and anti-differentiative TF genes were selected as nodes for this networkFigure 2
Perturbation networks of both pro-differentiative and anti-differentiative TF genes were selected as nodes for this network. To depict the putative
network, only significant edges (mean of ΔΔC
T
> 2 SD and P < 0.05) were extracted based on Matrix RNAi data (Additional data file 5). The networks
were drawn by Cytoscape [41]. In these networks, TFs and TF genes regulated by them are not distinguished from each other, but the nodes emitting and
accepting an arrow represent putative regulators and regulated genes, respectively. Arrowheads and blue lines indicate stimulatory regulation. T-shaped
heads and red lines indicate repressive regulation. Line widths indicate perturbation magnitude.
MYC
IRX3
BCL6
HOXA13
ID1
NFATC1
MYB
SNAI3
TCFL5
PPARD
EGR2
IRF8
CEBPD
HOXA10
PPARG
CEBPB
RUNX1
PRDM1
NFE2L1
MAFB
TFPT
FLI1
UHRF1
Genome Biology 2009, Volume 10, Issue 11, Article R121 Tomaru et al. R121.6
Genome Biology 2009, 10:R121
The repression of the gene MAFB by both MYB and MLL-
MLLT3 is also of interest. MAFB overexpression induces
monocytic differentiation [28], and there is an antagonistic
relationship between MYB and MAFB, such that MYB is
thought to maintain the undifferentiated state by direct bind-
ing to sumoylated MAFB [29]. In our experiments, MYB also
affected the transcript level of MAFB, but to our knowledge,
this is the first report of a role for MLL-MLLT3 in the regula-
tion of MAFB expression level. Interestingly, MYB and
MLLT3 regulated both 'increased' and 'decreased' genes in
PMA-induced differentiation, but every edge was anti-differ-
entiative (Figure S3 in Additional data file 7). When MYB was
knocked down, THP-1 cells initiated similar changes to those
observed during PMA-induced differentiation, such as cell
adhesion to the culture dish. Although weaker than with MYB
knockdown, this change in the adherence property of THP-1
cells was also found with the knockdown of MLLT3, which is
constantly expressed during PMA-induced differentiation.
Based on the similarity of the regulatory and physiological
outcomes of knocking down MYB and MLLT3, we assumed
that these two factors might function synergistically. To
explore this possible synergistic effect, we performed a double
knockdown of MYB and MLLT3 in THP-1 cells. The effect of
the double knockdown on the cell adhesion ability was
slightly enhanced compared with that of single knockdown by
specific siRNA targeting of either MYB or MLLT3 (Figure S1
in Additional data file 8). Next, we searched for TF genes
commonly regulated by these two TFs and found that four
genes, including IRX3 and MAFB, were double-regulated by
them (Figure S2 in Additional data file 8). ETS1 and RARG
were also regulated by both of these TFs but in opposite direc-
tions, consistent with the result of the perturbation analysis
showing that MYB and MLLT3 work primarily as a repressor
and a transcriptional stimulator, respectively, in THP-1 cells
(Figure S3 in Additional data file 7). Although the functions of
IRX3 and RARG are unknown in myeloid cells, these TFs are
known to be involved in differentiation processes in neurons
[30] or in responses to retinoic acid, a potent differentiation
inducer in THP-1 cells [31]. Moreover, ETS1 is thought to play
significant roles in hematopoiesis [32]. In addition to the
important function of MAFB, synergistic regulation of these
three TF genes by MYB and MLLT3 suggests their possible
involvement in the regulation of THP-1 cellular differentia-
tion.
Identification of direct regulatory edges by X-ChIP/
qRT-PCR
To predict putative direct regulatory edges, we extracted the
tentative FANTOM4 TFBSs in the promoter regions of all 96
TF genes. Motifs were available for 28 out of 83 factors and a
total of 83 edges, which could potentially be directly regulated
by these factors. We also checked the sequences -5,000 bp to
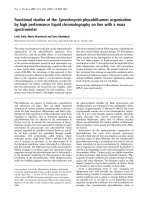
Perturbation network of pro-differentiative edgesFigure 3
Perturbation network of pro-differentiative edges. Only pro-differentiative
TF genes were selected as nodes for this network. See the legend of
Figure 2 for extraction of regulatory edges and network drawing.
FLI1
TFPT
RUNX1
PPARG
MYB
TCFL5
UHRF1
HOXA10
CEBPB
NFATC1
CEBPD
MAFB
EGR2
PRDM1
BCL6
PPARD
SNAI3
HOXA13
NFE2L1
Perturbation network of anti-differentiative edgesFigure 4
Perturbation network of anti-differentiative edges. Only anti-differentiative
TF genes were selected as nodes for this network. See the legend of
Figure 2 for extraction of regulatory edges and network drawing.
IRX3
HOXA10
BCL6
MAFB
MYB
ID 1
EGR2
PPARG
MYC
SNAI 3
PRDM1
IRF8
NFATC1
PPARD
TFPT
NFE2L1
Genome Biology 2009, Volume 10, Issue 11, Article R121 Tomaru et al. R121.7
Genome Biology 2009, 10:R121
+1,000 bp from the transcription start sites (TSSs) of all 96
TF genes with a TFBS data set from the TRANSFAC database.
As a result, TFBS motifs of 35 TFs were found and detected in
233 of the 417 edges representing the upstream regions of the
target genes.
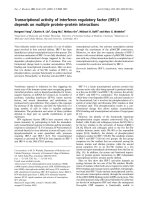
To experimentally identify direct regulatory edges in the TRN
predicted by the Matrix RNAi analysis, we carried out cross-
linking chromatin immunoprecipitation (X-ChIP)/qRT-PCR
analysis for 12 TFs: CBFB, NFKB, NFYA, MXI1, PCGF4,
RARA, RXRA, RXRB, SP1, SPI1, IRF8, and UHRF1. The
Matrix RNAi analysis identified a total of 113 target genes for
these 12 factors as components of significant edges, and
potential TFBSs were predicted in the proximal promoter
regions of all of these target genes. ChIP/qRT-PCR analysis
confirmed that 70 of these target genes were bound by a cor-
responding factor within 500 bp of their TSS. These direct
regulatory edges supported by perturbation and ChIP experi-
ments are summarized in Figure 5 (see Additional data file 9
for the positive TF binding data).
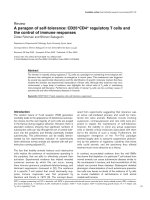
ChIP-validated networkFigure 5
ChIP-validated network. The genes predicted to be regulated by any of 12 TFs (CBFB, IRF8, NFKB, NYFA, MXI1, PCGF4, RARA, RXRA, SP1, SPI1, RXRB
and UHRF1) were examined for TF binding to their proximal promoter regions by X-ChIP/qPCR. Seventy out of 113 edges were validated as TF-binding
positives, strong candidates for direct regulatory edges.
LMO2
DDIT3
CEBPB
RUNX1
MXI1
MLLT3
MYBL2
ETS2
CR595360
TCFL5
NFYA
RXRB
SP1
RARG
RXRA
PPARD
PRDM1
CBFB
UHRF1
TRIM28
STAT1
CEBPD
ETS1
PCGF4
BCL6
CEBPG
NRAS
MAFB
NFATC2
RARA
PPARG
SMAD3
GATA2
SPI1
FOS
EGR1
MCM7
KLF10
IRF8
NFKB1
ZNF217
KLF4
BRCA1
Genome Biology 2009, Volume 10, Issue 11, Article R121 Tomaru et al. R121.8
Genome Biology 2009, 10:R121
We performed false discovery rate (FDR) analysis and calcu-
lated q-values of gene perturbations. Without considering the
SD values, we detected 1,684 edges with a P-value < 0.05 and
1,122 edges with a q-value less than 0.05 (not including edges
for auto-perturbation; Figure S1 in Additional data file 10).
We found 876 significant perturbation edges with a P-value <
0.05 and a mean > 2 × SD, and after FDR analysis 579 edges
with a q-value < 0.05 remained, indicating that the FDR anal-
ysis filtered out approximately 33.9% of the perturbation
edges (Figure S1 in Additional data file 10). This may reflect
the inclusion of a significant number of false positives in the
whole perturbation analysis.
Next, the validity of the filtering of significant edges using q-
values in reference to TF-binding data was assessed. We cal-
culated the ratio of TF binding-positive to TF binding-nega-
tive edges with a P-value < 0.05 and a mean > 2 × SD and the
ratio for those with a P-value < 0.05, a q-value < 0.05 and a
mean > 2 × SD; these were 0.619 and 0.588, respectively (Fig-
ures S2 and S3 in Additional data file 10). This difference in
the percentage of binding-positive edges by adoption of a q-
value threshold (< 0.05) may be less significant in terms of
statistics. The number of binding-positive edges was
decreased to 57.1% (from 70 to 40 edges) by adoption of a q-
value threshold and the decrease (42.9%) is significantly
larger than the decrease (33.9%; from 876 to 579) in the
number of edges with a P-value < 0.05 and a mean > 2 × SD
after the adoption of a q-value threshold (< 0.05). Moreover,
there is no significant difference in the distribution of q-val-
ues for gene perturbation between the binding-positive and
binding-negative edges (Figure S4 in Additional data file 10).
Taken together, filtering by the FDR threshold failed to result
in enrichment of perturbation- and binding-positive edges
and appears to generate many false negatives.
We have previously shown that validation of binding of TFs to
the proximal promoter regions of their potential gene targets
leads to successful reduction of the ratio of false positives to
false negatives [7]. In the Matrix RNAi assays of the relation-
ships between TFs in HepG2 cells, binding-positive edges
constitute 75% of the perturbation-positive edges, suggesting
that the filtering by TRF binding data obtained in ChIP assay
may enrich the significant edges. Based on the assumption
that edges that are both perturbation- and binding-positive
may be much more valid compared with the edges inferred by
only either of perturbation or binding assay, 70 perturbation
and binding positive edges appear to be highly reliable edges
(Figures S2 in Additional data file 10).
BCL6 was not significantly perturbed by 7 out of 12 TFs that
were used for the X-ChIP analysis and was slightly affected by
the knockdown of PCGF4. On the other hand, three (SPI1,
RARA and RXRA) out of the four TFs whose knockdown
greatly affected (downregulated) BCL6 gene expression were
demonstrated to bind the upstream region of BCL6 (Addi-
tional data file 9, X-ChIP/qPCR assay data). The considerable
overlap between BCL6 gene expression perturbations caused
by TFs and TF binding to the BCL6 proximal promoter region
strongly suggests that BCL6 is actually regulated by multiple
TFs in growing THP-1 cells. Moreover, the genes PPARG,
RARG, PRDM1 and MAFB
were bound and perturbed by 2, 4,
3 and 2 out of 12 TFs tested by ChIP analysis, respectively, but
were perturbed by only 2, 0, 1 and 0 TFs other than these
binding- and perturbation-positive TFs (Additional data file
9). The observed high concordance between TF-binding and
perturbation strongly suggests direct regulation of these
genes. Many TFs can cooperate to regulate transcription of a
mammalian gene by a combinatorial regulation mechanism.
Indeed, transcriptional regulation occurs through interaction
between multiple distantly located regulatory sites that are
bound by several different TFs [14,33,34], as represented by
enhanceosomes, in mammalian systems. Although the
number of edges evaluated by ChIP analysis in the present
study is rather small, the experimental results obtained sug-
gest that the perturbation data could be used to mine effi-
ciently the potential candidates for functional edges in
combinatorial transcriptional regulation.
Cell type-specific network
Previously, we used Matrix RNAi with 19 TFs and 21 TF genes
to study their inter-TF TRN in HepG2 cells [5]. Ten of these
TFs (HNF4G, CEBPA, CEBPD, PPARA, PPARD, PPARG,
RARA, RARG, RXRA and RXRB) were found to be also fully
expressed in THP-1 cells. To probe the differences in TRN
structure between the different cell type lineages, we com-
pared the regulatory edges observed in HepG2 cells with
those in THP-1 cells for the same set of TFs. CEBPA was
excluded from this analysis as we observed poor knockdown
of it in THP-1 cells. The relative expression levels of each of
the remaining nine TFs were similar between THP-1 and
HepG2 cells (Figure 6). Surprisingly, however, none of the
edges (TF-TF gene dependencies) were the same in both cell
lines (Figures 7 and 8). For example, HNF4G is repressed by
RXRB, CEBPD and RXRA in HepG2 cells, but we observed no
such dependence in THP-1 cells. On the other hand, RARA is
activated by CEBPD, PPARD and PPARG in THP-1 cells, but
we observed no such dependence in HepG2 cells. In addition,
the difference in the regulatory relationship does not appear
to be a function of the thresholds used for significance as less
stringent thresholds also did not reveal common edges (data
not shown). This suggests that the perturbation networks
revealed by systematic RNAi analysis are strongly cell type
dependent. It is intriguing to note that the stimulatory edges
are predominant in the perturbation network of THP-1 cells
and, in contrast, the repressive edges predominate in HepG2
cells, suggesting great differences in the functional roles of
these TFs between these two different types of cell. Moreover,
almost all of the TFs selected form regulatory circuitry and
most of the regulatory edges containing retinoic acid and
retinoid receptors (RARs and RXRs) are pro-differentiative
in THP-1 cells, consistent with the fact that THP-1 cells differ-
Genome Biology 2009, Volume 10, Issue 11, Article R121 Tomaru et al. R121.9
Genome Biology 2009, 10:R121
Comparison of expression levels and knockdown efficiencies for selected TFs common to THP-1 and HepG2 cellsFigure 6
Comparison of expression levels and knockdown efficiencies for selected TFs common to THP-1 and HepG2 cells. In our previous study, human
hepatoma cell line HepG2 was used to construct a Matrix RNAi experimental system for TRN analysis [7]. The Matrix RNAi data for nine TF genes
(HNF4G, CEBPD, PPARA, PPARD, PPARG, RARA, RARG, RXRA and RXRB) was used to depict the two types of perturbation networks. (a) Gene expression
levels in HepG2 (blue) and THP-1 (red) cells treated with negative control siRNA. (b) Gene expression levels in HepG2 (blue) and THP-1 (red) cells after
RNAi knockdown.
'
(a) (b)
0
2
4
6
8
10
12
14
16
Ct with GAPDH
THP-1
HepG2
Expression ratio (%)
CEBPD
HNF4G
PPARA
PPARD
PPARG
RARA
RARG
RXRA
RXRB
0
5
10
15
20
25
30
35
40
45
THP-1
HepG2
CEBPD
HNF4G
PPARA
PPARD
PPARG
RARA
RARG
RXRA
RXRB
THP-1 networkFigure 7
THP-1 network. Perturbation networks were constructed with only
significant edges (mean of ΔΔC
T
> 2 SD and P < 0.05). All of the regulatory
edges in this network are stimulatory.
RARGCEBPD
RARA
PPARG
RXRA
PPARD
HNF4G
RXRB
PPARA
HepG2 networkFigure 8
HepG2 network. Perturbation networks were constructed with only
significant edges (mean of ΔΔC
T
> 2 SD and P < 0.05). The regulatory edge
with an arrowhead and blue line indicate a stimulatory edge. T-shaped
heads and red lines indicate repressive regulation. Line widths indicate
perturbation magnitude.
PPARG
RXRA
PPARA
CEBPD
HNF4G
RARG
RARA
RXRB
PPARD
Genome Biology 2009, Volume 10, Issue 11, Article R121 Tomaru et al. R121.10
Genome Biology 2009, 10:R121
entiate into macrophages in response to all-trans retinoic acid
treatment [35,36].
Conclusions
Here, we present the first application of the large-scale Matrix
RNAi approach to TRN analysis in human cells. This analysis
provided a TRN of monocytic THP-1 cells growing in undif-
ferentiated conditions as a snapshot network. These data
could also be useful to find combinatorial regulatory regions
that are not only proximal but also distal to the TSSs as well
as the inter-TF TRN edges [14]. This network not only keeps
the balance and maintains stable undifferentiated conditions,
but also has the potential to initiate differentiation in
response to a stimulus such as PMA. Together with the data
of time-dependent changes in expression patterns of TF
genes during PMA-induced differentiation derived from the
FANTOM4 analysis, we have used a new approach to extract
pro-differentiative and anti-differentiative edges from the
significant perturbation network in static THP-1 cells that
were revealed by Matrix RNAi. As a result, we successfully
extracted 229 pro-differentiative and 76 anti-differentiative
edges. In the anti-differentiative network, MYB functions as a
key negative regulator, and in the pro-differentiative net-
work, MAFB, PPARG and BCL6 work as large hub nodes.
In this study, we identified 876 significant edges from 7,488
possible combinations in the 78 × 96 matrix, enabling us to
draw a significant perturbation network. Out of these signifi-
cant edges, 654 are activating edges and 222 repressing. The
average number of output and input edges for one TF were
11.3 and 9.5, respectively. In the FANTOM 4 data set, poten-
tial TFBSs were predicted around -300 bp from the TSSs in
the proximal regulatory regions of the target TF genes.
Eighty-three out of 394 edges were regulated by 28 TFs whose
DNA-binding motifs were available. Additionally, we pre-
dicted with the Transfac database and the Match program
that some TFBSs could be located in a region spanning -5,000
to + 500 bp from the TSS of each of the target TF genes. More
than half (233 edges) of the 417 edges regulated by 35 TFs
were supported by this analysis. Finally, we validated 70 out
of 113 significant edges by X-ChIP/qPCR with specific anti-
bodies against 12 selected TFs.
A comparison of the perturbation networks of nine TFs com-
mon to the hepatoma (HepG2) and monocytic (THP-1) cell
lines showed that these were surprisingly quite different from
each other, even though the expression levels of these TFs
were almost similar in these two types of cell. We should keep
in mind that the present TRN data might still contain false
positive edges as well as be missing false negative ones. Nev-
ertheless, this comparison suggests that TF gene expression
profile information and computational prediction of TFBSs
are not sufficient to unravel TRN architecture. Instead, the
present Matrix RNAi approach could be of great help to depict
a high quality tissue- or cell type-specific TRN. Although this
approach has been used here to depict a TRN in a stable state
as a snapshot, the Matrix RNAi analysis, if it were performed
at multiple time points, should also be a very powerful tool to
uncover even dynamically changing TRNs during differentia-
tion and development as a flipbook composed of a succession
of TRN snapshots.
Materials and methods
siRNA
Two stealth siRNAs (Invitrogen, Carlsbad, CA, USA) were
tested for each target gene and the one that gave the higher
level of knockdown was used for the Matrix RNAi. siRNAs
selected are listed in Additional data file 1. Stealth RNAi Neg-
ative universal control MED (Invitrogen) was used as the cal-
ibrator siRNA.
Cell culture, siRNA transfection and RNA extraction
THP-1 cells were cultured in RPMI1640 (Invitrogen), 10%
fetal bovine serum, penicillin/streptomycin (Invitrogen), 10
mM HEPES, 1 mM sodium pyruvate and 50 μM 2-mercap-
toethanol. Reverse transfection of 1 × 10
6
cells in each 60-mm
cell culture dish was performed with 20 nM (final concentra-
tion) of each stealth siRNA, Opti-MEM (Invitrogen) and 1.6
μg/ml (final concentration) of Lipofectamine 2000 (Invitro-
gen) according to the manufacturer's instructions. RNAs were
extracted 48 h after transfection with FastPure RNA kit
(TAKARA BIO, Kyoto, Japan) according to the manufac-
turer's instructions. RNA was quantified with NanoDrop
(NanoDrop Technologies, Wilmington, DE, USA). All siRNA
transfection experiments were performed in biological quad-
ruplicate and the siRNA-treated cells in two dishes were com-
bined as one lot to extract RNA samples.
Expression analysis
Expression levels of TF genes in the cells treated with the spe-
cific siRNAs or the calibrator negative control siRNA were
estimated by qRT-PCR in triplicate with the specific primer
sets (Additional data file 1). Glyceraldehyde-3-phosphate
dehydrogenase (GAPDH) mRNA level was determined with a
specific primer set as an internal expression control. A total of
four biological replicates were assayed. Reverse transcription
reaction was performed with PrimeScript RT-PCR Kit (Per-
fect Real Time, TAKARA BIO) and GeneAmp PCR System
9700 (Applied Biosystems, Foster City, CA, USA) according
to the manufacturer's instructions. qRT-PCR was done in 10-
μl reaction mixture with SYBR Premix Ex Taq™ (Perfect Real
Time, TAKARA BIO) on an ABI 7500 Fast real time PCR sys-
tem (Applied Biosystems). PCR parameters consisted of heat-
ing at 94°C for 5 s, followed by 40 cycles of 94°C for 5 s and
62.5°C for 20 s. The relative amount (expression ratio) of the
target gene mRNA was normalized to the endogenous
GAPDH mRNA using the 2
-ΔΔCT
method [37]. The difference
in the threshold cycle of a sample (ΔC
T
(sample)) was calcu-
lated by subtracting the threshold cycle of GAPDH mRNA
from that of the target TF mRNA in the RNA samples
Genome Biology 2009, Volume 10, Issue 11, Article R121 Tomaru et al. R121.11
Genome Biology 2009, 10:R121
extracted from THP-1 cells transfected with the target TF-
specific siRNA. The difference in the threshold cycle of the
calibrator (ΔC
T
(calibrator)) was calculated by subtracting the
threshold cycle of GAPDH mRNA from that of the target TF
mRNA in the RNA samples extracted from THP-1 cells trans-
fected with negative control siRNA. ΔΔC
T
was calculated by
subtracting ΔC
T
(sample) from ΔC
T
(calibrator) and 2
-ΔΔC
T
indicates the expression ratio. Standard deviation (SD) of
ΔΔC
T
in a total of four biological replicates was calculated and
the cutoff value was arbitrarily defined as 2 SD above the
mean. To evaluate the interferon response that might be
induced by siRNA administration, we examined the levels of
expression of several interferon-responsive genes, such as
OAS1. However, no significant changes in their expression
levels were detected.
Transcription factor binding assay by X-ChIP/qRT-PCR
The procedures for X-ChIP were essentially as described pre-
viously [5,7,14] with minor modifications. The soluble chro-
matin prepared from 1 × 10
7
cells was incubated with specific
antibody against each TF (Additional data file 11) for more
than 12 h at 4°C. The chromatin-antibody mixture was incu-
bated with Dynabeads Protein G (Dynal Biotech, Oslo, Nor-
way) for 1 h at 4°C and the immunoprecipitates were captured
by using magnets. The immunoprecipitates recovered were
washed once with IP wash buffer Low Salt (2 mM EDTA, 20
mM Tris-HCl pH 8.0, 150 mM NaCl, 1% Triton X-100, 0.1%
SDS), once with IP wash buffer High Salt (2 mM EDTA, 20
mM Tris-HCl pH 8.0, 500 mM NaCl, 1% Triton X-100, 0.1%
SDS), once with IP wash buffer LiCl (1 mM EDTA, 10 mM
Tris-HCl pH 8.0, 250 mM LiCl, 0.5% NP-40, 0.5% sodium
deoxycholate) and twice with TE buffer (10 mM Tris-HCl pH
8.0, 1 mM EDTA). The washed protein-DNA complexes were
released from Dynabeads Protein G twice with 250 μl of elu-
tion buffer (100 mM sodium bicarbonate, 1% SDS). NaCl was
added to the protein-DNA complexes in a final concentration
of 20 mM, then the mixture was incubated at 65°C for 3.5 h
for reversal of formaldehyde-induced cross-linking and
treated with 0.05 mg/ml RNase A (Nippon Gene, Tokyo,
Japan) at 65°C for 30 minutes. After the addition of Tris-HCl
(pH 6.8) and EDTA (pH 8.0) to final concentrations of 40 and
10 mM, respectively, the reversed samples were treated with
0.25 mg/ml protease K (Nippon Gene) at 45°C for 1 h. The
DNA released was then extracted with phenol and phe-
nol:chloroform:isoamylalcohol (25:24:1), isopropanol-pre-
cipitated with Ethachinmate (Nippon Gene), and then
dissolved in 250 μl of H
2
O. DNA samples obtained by ChIP
with each specific antibody and from the precipitates
obtained without any antibody and input DNA (total chroma-
tin DNA) were used as templates for qRT-PCR assay. The pro-
cedures of qRT-PCR were essentially the same as those
described in the section on qRT-PCR.
Expression analysis
Enrichment of the target DNA fragments was assessed with
ΔC
T
obtained by subtraction of the C
T
values observed for the
ChIP samples with specific antibody from the C
T
s observed
without any antibody. Sequences of the primers used for
ChIP/qRT-PCR were described in Additional data file 12.
ChIP experiments were performed in triplicate with each dif-
ferent batch of chromatin preparations and qRT-PCRs were
performed in triplicate with each primer set. The ΔC
T
values
obtained were averaged for each of the TF-TF gene edge pairs.
For evaluation of DNA fragment enrichment in the experi-
ments, we set the threshold to 1.0 ΔC
T
for all the triplicate
experiments.
Statistics
To evaluate the significance of RNAi knockdowns, perturba-
tions and enrichment of the specific DNA fragments that were
bound by each of the TF proteins, a two-tailed Student's t-test
was used for generating P-values. In all analyses the thresh-
old for statistical significance was P < 0.05. Because multiple
testing errors were expected, FDR analysis was performed
with the P-values computed from the Student t-tests by
applying the Storey correction approach [38] with the
QVALUE program [39] and the R software environment for
statistical computing [40]. In practice, a cutoff for null
hypothesis rejection was set to 0.05 to ensure a 5% FDR.
Abbreviations
AML: acute myeloid leukemia; ChIP: chromatin immunopre-
cipitation; FDR: false discovery rate; GAPDH: glyceralde-
hyde-3-phosphate dehydrogenase; PMA: phorbol 12-
myristate 13-acetate; qRT-PCR: quantitative real-time RT-
PCR; RNAi: RNA interference; SD: standard deviation;
siRNA: small interfering RNA; TF: transcription factor;
TFBS: transcription factor binding site; TRN: transcriptional
regulatory network; TSS: transcription start site.
Authors' contributions
YT designed the research, and performed whole knockdown
experiments, expression analysis, ChIP and overall analysis.
CS carried out whole knockdown experiments, expression
analysis and ChIP. HM carried out ChIP-qRT-PCR and ChIP
analysis. ARRF carried out computational analysis of TFBS
prediction. AK carried out the western blot confirmation of
knockdown. MS and YH were involved in the conceptualiza-
tion of this project. YT and ARRF wrote the manuscript. MS
edited the manuscript.
Additional data files
The following additional data are available with the online
version of this paper: a table listing primer and siRNA
sequences, TF knockdown and expression changing patterns
during PMA-induced THP-1 cellular differentiation (Addi-
tional data file 1); a figure showing assessment of knockdown
efficiency at the protein level (Additional data file 2); figures
showing overviews of significant and non-significant edges
Genome Biology 2009, Volume 10, Issue 11, Article R121 Tomaru et al. R121.12
Genome Biology 2009, 10:R121
(Additional data file 3); a table listing qRT-PCR data used for
the Matrix RNAi analysis before selection (Additional data
file 4); a table of all selected significant qRT-PCR data used
for Matrix RNAi analysis (Additional data file 5); tables listing
significant perturbation edges detected by Matrix RNAi anal-
ysis (Additional data file 6); figures showing perturbation
networks from all selected significant edges (Additional data
file 7); figures showing comparisons of double knockdown
and single knockdown of MYB and MLLT3 (Additional data
file 8); a table listing X/ChIP-qRT-PCR results (Additional
data file 9); Venn diagrams for comparison between several
criteria to extract potential regulatory edges (Additional data
file 10); a table listing antibodies for X/ChIP-qRT-PCR (Addi-
tional data file 11); a table listing primer sequences and posi-
tions for X/ChIP-qRT-PCR (Additional data file 12).
Additional data file 1TF knockdown and changes in expression patterns during PMA-induced THP-1 cellular differentiationThis table shows siRNA and primer sequences for the knockdown analysis, expression data (ΔC
T
value) and knockdown efficiencies of siRNAs targeting a TF gene in the Matrix RNAi analysis. Expres-sion patterns analyzed in FANTOM4 were classified into pro-dif-ferentiated, anti-differentiated, static, transient and dynamic according to the expression profiles of the TF genes examined in the present Matrix RNAi research: 'static', 'transient' and 'dynamic' represent the profiles in which the expression level of a given TF gene is constant or significantly unchanged, having one peak or val-ley, and having multiple peaks and/or valleys, respectively, during PMA-induced THP-1 differentiation.Click here for fileAdditional data file 2Assessment of knockdown efficiency at the protein levelWestern blotting with specific antibodies against each of the TFs and the protein extracts prepared from the THP-1 cells transfected with 20 nM negative control siRNA or each of the TF-specific siR-NAs was carried out to evaluate TF knockdown efficiency at the protein level. Control: protein extracts from THP-1 cells trans-fected with negative control siRNA. siRNA: protein extracts from THP-1 cells transfected with each TF-specific siRNA. The levels of actin and TATA binding protein (TBP) were also examined as inter-nal references (controls 1 and 2, respectively).Click here for fileAdditional data file 3Overview of significant and non-significant edgesFigure S1: distribution of perturbation magnitudes between signif-icant and non-significant edges. The 927 edges and 83 auto-pertur-bation edges that corresponded to 78 TF and 5 non-TF genes that were knocked down and had a low SD (mean > 2 SD) and a low P-value (P < 0.05) in Student's t-test were selected as significant edge candidates. The remaining 6,958 edges were grouped together as non-significant edges. The edges in each group were divided according to their perturbation magnitudes, which were calculated on the basis of the data from the qRT-PCR assay (see qRT-PCR in Expression analysis, Materials and methods for details). Perturba-tion magnitude was represented by absolute ΔΔC
T
, in every 0.2 absolute ΔΔC
T
and the percentages of the number of edges in each fraction to the total number of the edges were plotted. Red bars rep-resent the percentage of the number of significant perturbation edges, black bars non-significant ones and yellow bars TF genes knocked down. Figure S2: magnitude of perturbation for signifi-cant and non-significant groups. Mean and SD values of ΔΔC
T
s of high (< 2 SD and P > 0.05) and low (> 2 SD and P < 0.05) SD and P-value groups were calculated. ΔΔC
T
values for knockdown of the TF genes (siRNA) are much larger than perturbation magnitudes, indicating that the influence of knockdown of TF genes on their downstream TF genes tends to be attenuated.Click here for fileAdditional data file 4qRT-PCR data used for the Matrix RNAi analysisAll qRT-PCR data used for the Matrix RNAi analysis. ddCt indi-cates the average ddCt from four biological replicates. SD indicates the standard deviation of ddCt from four biological replicates. Ttest indicates the P-value of the dCt between the knockdown and con-trol siRNA transfected samples.Click here for fileAdditional data file 5Selected significant qRT-PCR data used for the Matrix RNAi anal-ysisThe 927 edges and 83 autoregulatory edges that showed a low SD (mean > 2 SD) and a low P-value (P < 0.05) in Student's-t-test were selected as significant edge candidates. The remaining 6,958 edges were removed from the qRT-PCR data.Click here for fileAdditional data file 6Significant perturbation edges detected by Matrix RNAi analysisTHP-1 cells (1 × 10
6
cells) were transfected with an individual siRNA species against each of the TF genes. The total RNA was extracted 48 h after the transfection and used for qRT-PCR. The changes in expression levels (perturbations) were evaluated by C
T
calculated according to the method described by Livak et al. [37]. Quadruplicated experiments were carried out to obtain the average C
T
, SD and P-value. Only the edges that gave a low SD (mean of ΔΔC
T
> 2 SD) and P-value (< 0.05) were selected as significant reg-ulatory TF-TF gene edges for preparing this table. 'Input gene' and 'target gene' indicates genes knocked down by a specific siRNA and genes perturbed significantly after siRNA transfection, respec-tively. 'Activate' and 'suppress' indicate that knockdown of one TF led to a significant decrease in the expression of another and to a significant increase in the expression of another, respectively. The actual data for RNAi perturbation are in Additional data file 4 (for all of the edges tested) and Additional data file 5 (for only signifi-cant edges).Click here for fileAdditional data file 7Perturbation networksFor depiction of the putative networks, only significant edges (> 2 SD and P < 0.05) were extracted based on the Matrix RNAi data in Additional data files 4 and 5. The network was drawn by Cytoscape [33]. In these networks, TFs and TF genes regulated by them are not distinguished from each other, but the nodes emitting and accepting an arrow represent the putative regulators and regulated genes, respectively. Figure S1: perturbation network of significant regulatory edges based on Matrix RNAi data. Figure S2: pro-differ-entiative edge network. Figure S3: anti-differentiative edge net-work.Click here for fileAdditional data file 8Comparison of double knockdown and single knockdown of MYB and MLLT3Figure S1: comparison of the extent of THP-1 cell adhesion between individual knockdown of either MYB or MLLT3 and their double knockdown. Blue bars indicate floating cells and red bars indicate attached cells counted 96 h after siRNA transfection. M & M indi-cates double knockdown. NC indicates cells transfected with siRNA negative control. Figure S2: Venn diagram of genes affected by knockdown of MYB and MLLT3 and their double knockdown.Click here for fileAdditional data file 9X-ChIP/qPCR assay dataOnly the data showing a positive TF binding (ΔC
T
> 1.0 correspond-ing to two-fold enrichment of the TF-specific DNA fragments and P < 0.05 in Student's t-test) in three separate X-ChIP/qPCR experi-ments are indicated.Click here for fileAdditional data file 10Venn diagram for comparison between several criteria to extract potential regulatory edgesFigure S1: comparison between P-value threshold (P < 0.05), q-value threshold (q-value < 0.05) and 2-SD threshold (a signal aver-age < 2 × SD). Figure S2: comparison between 2-SD/P-value threshold and 2-SD/P-value threshold and ChIP/qPCR confirma-tion. Figure S3: comparison between 2-SD/P-value/q-value threshold and 2-SD/P-value/q-value threshold and ChIP/qPCR confirmation. FDR (q-value) was calculated by using the QVALUE program and R software as described in Materials and methods. The number in parentheses indicates the number of edges exclud-ing auto-perturbation edges. Figure S4: accumulative number of TF-binding positive and negative edges with q-value. Regulatory edges tested for TF-binding were separated into two groups for sig-nificance in ChIP assay (ChIP-negative and -positive) and the num-bers determined together with the q-values for their perturbations.Click here for fileAdditional data file 11Antibodies used in western blotting and X-ChIP analysisAntibodies used in western blotting and X-ChIP analysis.Click here for fileAdditional data file 12Primers used in X-ChIP/qPCR analysisPrimers used in X-ChIP/qPCR analysis. Primer pairs were designed around 500 nt upstream from the TSSs of the respective genes, except for some genes that were difficult to design their primers in the very proximal region.Click here for file
Acknowledgements
This study was supported by the following: a research grant of RIKEN
Omics Science Center from MEXT to YH; a grant of the Genome Network
Project from the Ministry of Education, Culture, Sports, Science and Tech-
nology, Japan to YH [41]. We would like to thank Timo Lassmann for giving
us good suggestions about network analysis, Akihiro Ishiyama and Ryou-
suke Takai for assisting us with the qRT-PCR work, Rieko Shibasaki for
Western blotting and also all of the members of the FANTOM consortium
for their fruitful collaboration and cooperation. ARRF is supported by a CJ
Martin Fellowship from the Australian NHMRC (ID 428261).
References
1. Nilsson R, Bajic VB, Suzuki H, di Bernardo D, Bjorkegren J, Katayama
S, Reid JF, Sweet MJ, Gariboldi M, Carninci P, Hayashizaki Y, Hume
DA, Tegner J, Ravasi T: Transcriptional network dynamics in
macrophage activation. Genomics 2006, 88:133-142.
2. Loh YH, Wu Q, Chew JL, Vega VB, Zhang W, Chen X, Bourque G,
George J, Leong B, Liu J, Wong KY, Sung KW, Lee CW, Zhao XD,
Chiu KP, Lipovich L, Kuznetsov VA, Robson P, Stanton LW, Wei CL,
Ruan Y, Lim B, Ng HH: The Oct4 and Nanog transcription net-
work regulates pluripotency in mouse embryonic stem cells.
Nat Genet 2006, 38:431-440.
3. Zeitlinger J, Zinzen RP, Stark A, Kellis M, Zhang H, Young RA, Levine
M: Whole-genome ChIP-chip analysis of Dorsal, Twist, and
Snail suggests integration of diverse patterning processes in
the Drosophila embryo. Genes Dev 2007, 21:385-390.
4. Tomaru Y, Kondo S, Suzuki M, Hayashizaki Y: A comprehensive
search for HNF-3alpha-regulated genes in mouse hepatoma
cells by 60 K cDNA microarray and chromatin immunopre-
cipitation/PCR analysis. Biochem Biophys Res Commun 2003,
310:667-674.
5. Nakanishi M, Tomaru Y, Miura H, Hayashizaki Y, Suzuki M: Identifi-
cation of transcriptional regulatory cascades in retinoic acid-
induced growth arrest of HepG2 cells. Nucleic Acids Res 2008,
36:3443-3454.
6. Tanaka T, Tomaru Y, Nomura Y, Miura H, Suzuki M, Hayashizaki Y:
Comprehensive search for HNF-1beta-regulated genes in
mouse hepatoma cells perturbed by transcription regula-
tory factor-targeted RNAi. Nucleic Acids Res 2004, 32:2740-2750.
7. Tomaru Y, Nakanishi M, Miura H, Kimura Y, Ohkawa H, Ohta Y, Hay-
ashizaki Y, Suzuki M: Identification of an inter-transcription fac-
tor regulatory network in human hepatoma cells by Matrix
RNAi. Nucleic Acids Res 2009, 37:1049-1060.
8. Sato M, Taniguchi T, Tanaka N: The interferon system and inter-
feron regulatory factor transcription factors - studies from
gene knockout mice. Cytokine Growth Factor Rev 2001, 12:133-142.
9. Shivdasani RA, Fujiwara Y, McDevitt MA, Orkin SH: A lineage-
selective knockout establishes the critical role of transcrip-
tion factor GATA-1 in megakaryocyte growth and platelet
development. EMBO J 1997, 16:3965-3973.
10. Lenhard B, Sandelin A, Mendoza L, Engstrom P, Jareborg N, Wasser-
man WW: Identification of conserved regulatory elements by
comparative genome analysis. J Biol 2003, 2:13.
11. Robertson G, Hirst M, Bainbridge M, Bilenky M, Zhao Y, Zeng T,
Euskirchen G, Bernier B, Varhol R, Delaney A, Thiessen N, Griffith
OL, He A, Marra M, Snyder M, Jones S: Genome-wide profiles of
STAT1 DNA association using chromatin immunoprecipita-
tion and massively parallel sequencing. Nat Methods 2007,
4:651-657.
12. Balaji S, Iyer LM, Babu MM, Aravind L: Comparison of transcrip-
tion regulatory interactions inferred from high-throughput
methods: what do they reveal? Trends Genet 2008, 24:319-323.
13. Zhang X, Odom DT, Koo SH, Conkright MD, Canettieri G, Best J,
Chen H, Jenner R, Herbolsheimer E, Jacobsen E, Kadam S, Ecker JR,
Emerson B, Hogenesch JB, Unterman T, Young RA, Montminy M:
Genome-wide analysis of cAMP-response element binding
protein occupancy, phosphorylation, and target gene activa-
tion in human tissues. Proc Natl Acad Sci USA 2005,
102:4459-4464.
14. Miura H, Tomaru Y, Nakanishi M, Kondo S, Hayashizaki Y, Suzuki M:
Identification of DNA regions and a set of transcriptional
regulatory factors involved in transcriptional regulation of
several human liver-enriched transcription factor genes.
Nucleic Acids Res 2009, 37:778-792.
15. Tsuchiya S, Yamabe M, Yamaguchi Y, Kobayashi Y, Konno T, Tada K:
Establishment and characterization of a human acute mono-
cytic leukemia cell line (THP-1). Int J Cancer 1980, 26:171-176.
16. Lacraz S, Dayer JM, Nicod L, Welgus HG: 1,25-dihydroxyvitamin
D3 dissociates production of interstitial collagenase and 92-
kDa gelatinase in human mononuclear phagocytes. J Biol
Chem 1994, 269:6485-6490.
17. FANTOM Consortium, Suzuki H, Forrest AR, van Nimwegen E, Daub
CO, Balwierz PJ, Irvine KM, Lassmann T, Ravasi T, Hasegawa Y, de
Hoon MJ, Katayama S, Schroder K, Carninci P, Tomaru Y, Kanamori-
Katayama M, Kubosaki A, Akalin A, Ando Y, Arner E, Asada M, Asa-
hara H, Bailey T, Bajic VB, Bauer D, Beckhouse AG, Bertin N, Björke-
gren J, Brombacher F, Bulger E, Chalk AM, et al.: The
transcriptional network that controls growth arrest and dif-
ferentiation in a human myeloid leukemia cell line. Nat Genet
2009, 41:553-562.
18. Gitter A, Siegfried Z, Klutstein M, Fornes O, Oliva B, Simon I, Bar-
Joseph Z: Backup in gene regulatory networks explains differ-
ences between binding and knockout results. Mol Syst Biol
2009,
5:276.
19. Kraus J, Borner C, Hollt V: Distinct palindromic extensions of
the 5'-TTC GAA-3' motif allow STAT6 binding in vivo.
FASEB J 2003, 17:304-306.
20. GenBank: CR595360 [ />50476167]
21. Weisz A, Marx P, Sharf R, Appella E, Driggers PH, Ozato K, Levi BZ:
Human interferon consensus sequence binding protein is a
negative regulator of enhancer elements common to inter-
feron-inducible genes. J Biol Chem 1992, 267:25589-25596.
22. Norton JD: ID helix-loop-helix proteins in cell growth, differ-
entiation and tumorigenesis. J Cell Sci 2000, 113:3897-3905.
23. Odero MD, Zeleznik-Le NJ, Chinwalla V, Rowley JD: Cytogenetic
and molecular analysis of the acute monocytic leukemia cell
line THP-1 with an MLL-AF9 translocation. Genes Chromo-
somes Cancer 2000, 29:333-338.
24. Kawagoe H, Kawagoe R, Sano K: Targeted down-regulation of
MLL-AF9 with antisense oligodeoxyribonucleotide reduces
the expression of the HOXA7 and -A10 genes and induces
apoptosis in a human leukemia cell line, THP-1. Leukemia
2001, 15:1743-1749.
25. Buske C, Feuring-Buske M, Antonchuk J, Rosten P, Hogge DE, Eaves
CJ, Humphries RK: Overexpression of HOXA10 perturbs
human lymphomyelopoiesis in vitro and in vivo. Blood 2001,
97:2286-2292.
26. Thorsteinsdottir U, Sauvageau G, Hough MR, Dragowska W,
Lansdorp PM, Lawrence HJ, Largman C, Humphries RK: Overex-
pression of HOXA10 in murine hematopoietic cells perturbs
both myeloid and lymphoid differentiation and leads to
acute myeloid leukemia. Mol Cell Biol 1997, 17:495-505.
27. Taketani T, Taki T, Ono R, Kobayashi Y, Ida K, Hayashi Y: The chro-
mosome translocation t(7;11)(p15;p15) in acute myeloid
leukemia results in fusion of the NUP98 gene with a HOXA
cluster gene, HOXA13, but not HOXA9. Genes Chromosomes
Cancer 2002, 34:437-443.
28. Kelly LM, Englmeier U, Lafon I, Sieweke MH, Graf T: MafB is an
inducer of monocytic differentiation.
EMBO J 2000,
Genome Biology 2009, Volume 10, Issue 11, Article R121 Tomaru et al. R121.13
Genome Biology 2009, 10:R121
19:1987-1997.
29. Tillmanns S, Otto C, Jaffray E, Du Roure C, Bakri Y, Vanhille L, Sar-
razin S, Hay RT, Sieweke MH: SUMO modification regulates
MafB-driven macrophage differentiation by enabling Myb-
dependent transcriptional repression. Mol Cell Biol 2007,
27:5554-5564.
30. Perry P, Sauer S, Billon N, Richardson WD, Spivakov M, Warnes G,
Livesey FJ, Merkenschlager M, Fisher AG, Azuara V: A dynamic
switch in the replication timing of key regulator genes in
embryonic stem cells upon neural induction. Cell Cycle 2004,
3:1645-1650.
31. Chen Q, Ross AC: Retinoic acid regulates cell cycle progres-
sion and cell differentiation in human monocytic THP-1 cells.
Exp Cell Res 2004, 297:68-81.
32. Lulli V, Romania P, Morsilli O, Gabbianelli M, Pagliuca A, Mazzeo S,
Testa U, Peschle C, Marziali G: Overexpression of Ets-1 in
human hematopoietic progenitor cells blocks erythroid and
promotes megakaryocytic differentiation. Cell Death Differ
2006, 13:1064-1074.
33. Levine M, Tjian R: Transcription regulation and animal diver-
sity. Nature 2003, 424:147-151.
34. Ernst P, Smale ST: Combinatorial regulation of transcription. I:
General aspects of transcriptional control. Immunity 1995,
2:311-319.
35. Hemmi H, Breitman TR: Induction of functional differentiation
of a human monocytic leukemia cell line (THP-1) by retinoic
acid and cholera toxin. Jpn J Cancer Res 1985, 76:345-351.
36. Dawson MI, Elstner E, Kizaki M, Chen DL, Pakkala S, Kerner B, Koef-
fler HP: Myeloid differentiation mediated through retinoic
acid receptor/retinoic × receptor (RXR) not RXR/RXR path-
way. Blood 1994, 84:446-452.
37. Livak KJ, Schmittgen TD: Analysis of relative gene expression
data using real-time quantitative PCR and the 2(-Delta Delta
C(T)) Method. Methods 2001,
25:402-408.
38. Storey JD, Tibshirani R: Statistical significance for genomewide
studies. Proc Natl Acad Sci USA 2003, 100:9440-9445.
39. Q-VALUE [ />40. R: a Language and Environment for Statistical Computing
[]
41. GNP [ />42. Shannon P, Markiel A, Ozier O, Baliga NS, Wang JT, Ramage D, Amin
N, Schwikowski B, Ideker T: Cytoscape: a software environment
for integrated models of biomolecular interaction networks.
Genome Res 2003, 13:2498-2504.