Báo cáo y học: " Differential binding and co-binding pattern of FOXA1 and FOXA3 and their relation to H3K4me3 in HepG2 cells revealed by ChIP-seq" docx
Bạn đang xem bản rút gọn của tài liệu. Xem và tải ngay bản đầy đủ của tài liệu tại đây (2.32 MB, 16 trang )
Genome Biology 2009, 10:R129
Open Access
2009Motallebipouret al.Volume 10, Issue 11, Article R129
Research
Differential binding and co-binding pattern of FOXA1 and FOXA3
and their relation to H3K4me3 in HepG2 cells revealed by ChIP-seq
Mehdi Motallebipour
¤
*#
, Adam Ameur
¤
†**
, Madhu Sudhan Reddy Bysani
*
,
Kalicharan Patra
*††
, Ola Wallerman
*
, Jonathan Mangion
‡
,
Melissa A Barker
§
, Kevin J McKernan
¶
, Jan Komorowski
†¥
and
Claes Wadelius
*
Addresses:
*
Department of Genetics and Pathology, Uppsala University, Rudbeck Laboratory, Dag Hammarskjölds väg 20, Uppsala SE-75185,
Sweden.
†
Linnaeus Centre for Bioinformatics, Uppsala University, Biomedical Center, Husargatan 3, Uppsala SE-75124, Sweden.
‡
Applied
Biosystems UK, 120 Birchwood Boulevard, Warrington WA3 7QH, Cheshire, UK.
§
Life Technologies, 850 Lincoln Centre Drive, Foster City, CA
94404, USA.
¶
Life Technologies, 500 Cummings Center, Suite 2400, Beverly, MA 01915, USA.
¥
Interdisciplinary Centre for Mathematical and
Computer Modeling, Warsaw University, Krakowskie Przedmieœcie 26/28, Warszawa 00-927, Poland.
#
Current address: MRC Clinical
Sciences Centre, Faculty of Medicine, Imperial College London, Hammersmith Hospital Campus, Du Cane Road, London W12 0NN, UK.
**
Current address: Department of Genetics and Pathology, Rudbeck Laboratory, Uppsala University, Dag Hammarskjölds väg 20, Uppsala SE-
75185, Sweden.
††
Current address: Department of Development and Genetics, EBC, Uppsala University, Norbyvägen 18, Uppsala SE-75236,
Sweden.
¤ These authors contributed equally to this work.
Correspondence: Mehdi Motallebipour. Email: Claes Wadelius. Email:
© 2009 Motallebipour et al.; licensee BioMed Central Ltd.
This is an open access article distributed under the terms of the Creative Commons Attribution License ( which
permits unrestricted use, distribution, and reproduction in any medium, provided the original work is properly cited.
FOXA1 and FOXA3 binding patterns<p>FOXA1 and FOXA3 binding patterns in HepG2 cells, together with their possible molecular interactions with FOXA2 and each other, are revealed by ChIP-seq.</p>
Abstract
Background: The forkhead box/winged helix family members FOXA1, FOXA2, and FOXA3 are of high importance in
development and specification of the hepatic linage and the continued expression of liver-specific genes.
Results: Here, we present a genome-wide location analysis of FOXA1 and FOXA3 binding sites in HepG2 cells through
chromatin immunoprecipitation with detection by sequencing (ChIP-seq) studies and compare these with our previous
results on FOXA2. We found that these factors often bind close to each other in different combinations and consecutive
immunoprecipitation of chromatin for one and then a second factor (ChIP-reChIP) shows that this occurs in the same
cell and on the same DNA molecule, suggestive of molecular interactions. Using co-immunoprecipitation, we further
show that FOXA2 interacts with both FOXA1 and FOXA3 in vivo, while FOXA1 and FOXA3 do not appear to interact.
Additionally, we detected diverse patterns of trimethylation of lysine 4 on histone H3 (H3K4me3) at transcriptional start
sites and directionality of this modification at FOXA binding sites. Using the sequence reads at polymorphic positions,
we were able to predict allele specific binding for FOXA1, FOXA3, and H3K4me3. Finally, several SNPs associated with
diseases and quantitative traits were located in the enriched regions.
Conclusions: We find that ChIP-seq can be used not only to create gene regulatory maps but also to predict molecular
interactions and to inform on the mechanisms for common quantitative variation.
Published: 17 November 2009
Genome Biology 2009, 10:R129 (doi:10.1186/gb-2009-10-11-r129)
Received: 17 June 2009
Revised: 5 September 2009
Accepted: 17 November 2009
The electronic version of this article is the complete one and can be
found online at /> Genome Biology 2009, Volume 10, Issue 11, Article R129 Motallebipour et al. R129.2
Genome Biology 2009, 10:R129
Background
The forkhead box/winged helix (FOX) family of transcription
factors (TFs) is conserved from yeast to mammals, and in
humans consists of approximately 40 members [1-3]. A sub-
family of these factors is the FOXA family with the members
FOXA1 (formerly known as hepatocyte nuclear factor
(HNF)3α), FOXA2 (HNF3β), and FOXA3 (HNF3γ), involved
in development of the liver tissue and regulation of expres-
sion of the liver specific genes [4,5]. More specifically, FOXA1
and FOXA2 have been established as crucial for competence
of the liver in the foregut endoderm during development [4].
This is suggested to be due to the ability of FOXAs to act as
'pioneering' factors opening the compacted chromatin [6].
FOXAs are also able to induce nucleosome positioning in a
nucleosomal array, which has been demonstrated to occur in
the enhancer region of the mouse serum albumin gene [7]. In
an X-ray crystallographic study of FOXA3 bound to DNA, it
was suggested that these factors bind as monomers and that
the structure of FOXAs is similar to those of histones H1 and
H5 [8]. The latter is proposed to be the explanation for the
ability of FOXA to position nucleosomes and act as a pioneer-
ing factor [6].
FOXA1, -2, and -3 share great homology in the DNA binding
domain. FOXA1 shares 95% and FOXA2 90% sequence iden-
tity with FOXA3 within the forkhead domain [8]. While
FOXA1 and -2 are up to 39% identical outside of the forkhead
domain, FOXA3 has much less similarity with these factors
[2]. The FOXAs regulate genes involved in metabolism
[2,5,9], for example, those encoding transthyretin, and apoli-
poproteins. Moreover, FOXA2 autoregulates its own expres-
sion and that of other TFs - for example, HNF4α, HNF1, and
HNF6 - and has therefore been implicated as a master regu-
lator of gene expression in the liver [9-11]. In the study by
Duncan et al. [9], it was suggested that FOXA1 is a weaker
transcription enhancer than FOXA2. It was further proposed
that as FOXA1 and FOXA2 have the same recognition
sequence on DNA, they compete for the binding site and
FOXA1 may therefore exhibit an inhibitory effect.
There have been some chromatin immunoprecipitation
(ChIP)-chip and ChIP with detection by sequencing (ChIP-
seq) studies on members of the FOXA family published, spe-
cifically on FOXA1 (in MCF-7 and LNCaP cells) [12-14] and
FOXA2 (mouse liver and a limited study in human liver) [15-
17]. Although these studies have revealed interesting aspects
of FOXAs as TFs, none have examined the interrelationship
of the three members of this family. Additionally, several of
these studies have only investigated the FOXA binding sites at
the promoters of known genes and thus have not been truly
genome-wide, despite the evidence that, for example, FOXA2
binds at sites other than the transcriptional start sites (TSSs)
[16,18].
Modifications of the amino-terminal tails of the histones can
change the accessibility of the chromatin for TFs and the tran-
scriptional machinery and thereby regulate the expression of
genes. Although combinations of these modifications are
indicated as a prerequisite for activation or repression of the
transcriptional activity [19], genome-wide studies of all the
required modifications in every condition is not practical.
Therefore, one modification can be chosen as representative
for an active or inactive state of transcription. In this study,
we have selected trimethylation of lysine 4 on histone H3
(H3K4me3), a commonly studied histone modification, as an
indication of regions actively transcribed or poised to be tran-
scribed [20].
The new generation of sequencers, generally known as high
throughput sequencers, has made the detection of DNA
resulting from ChIP for genome-wide studies easier and more
cost-effective. In this study, we aimed to characterize the
genome-wide binding sites of FOXA1 and FOXA3, for the first
time, in the hepatocellular carcinoma cell line HepG2 through
ChIP and sequencing on the SOLiD platform. Furthermore,
we intended to examine their possible interactions with each
other, with FOXA2, and their correlation with H3K4me3 and
other TFs in vivo. We found that FOXA1 and FOXA3 have dis-
similar distributions of binding sites in HepG2. Intriguingly,
although there were sites of FOXA1 and FOXA3 co-binding
together with FOXA2, FOXA1 and FOXA3 did not seem to
interact in vivo. Furthermore, we discovered that trimethyla-
tion of lysine 4 at histone H3 reveals different patterns or 'sig-
natures' depending on the promoter structure and
transcriptional activity. Importantly, H3K4me3 was often
found at a distance of about 200 bases from the sites of
FOXA1-2-3 binding, frequently directed towards the nearest
TSS. Finally, we demonstrate that ChIP-seq can be used for
detecting allele-specific binding and candidate functional sin-
gle nucleotide polymorphisms (SNPs).
Results
Overall data analysis
For the genome-wide analysis of FOXA1 and FOXA3 binding
sites and regions of H3K4me3 in HepG2 cells, ChIPs and
detection by a high throughput sequencer was performed. In
order to get a detailed view of the regions of H3K4me3, we
decided to treat the chromatin with micrococcal nuclease
(MNase). MNase recognizes the naked DNA, which is not
tightly wrapped around the nucleosomes, and digests it. This,
in combination with the ChIP, will lead to nucleosome-sized
DNA (147 bp) that can be sequenced by high throughput
sequencers, resulting in a fine mapping of the H3K4me3 pat-
tern in the genome. After alignment of the raw reads and cal-
culation of overlap signals, we compared the results between
the different libraries prepared for sequencing and detected a
good correlation (Figure S1 in Additional data file 1). Thereaf-
ter, the aligned reads were merged, ordered on genomic posi-
tions, and extended by the average fragment size (Table S1 in
Additional data file 1). We also sequenced a fraction of the
input material, generated in the ChIPs, to use as a negative
Genome Biology 2009, Volume 10, Issue 11, Article R129 Motallebipour et al. R129.3
Genome Biology 2009, 10:R129
control for detection of regions where repeats may cause false
positive overlap signals. Then we identified peaks with signif-
icant ChIP-enrichment by considering both the ChIP- and
input signals.
We detected 8,175 peaks for FOXA1 and 4,598 peaks for
FOXA3 in the human genome in the HepG2 cells (Table 1;
files with information on peak positions for upload in the
UCSC genome browser are available as Additional data files 2,
3, and 4). Out of these, only 465 (5.7%) and 562 (12.2%),
respectively, were located within 1 kb of a TSS (Figure S2 in
Additional data file 1), emphasizing the importance of true
genome-wide studies for these factors. A majority of the puta-
tive binding sites were, as expected, located in intragenic and
intergenic regions. Genes with a FOXA binding within 1 kb of
their TSS demonstrated significantly higher expression than
all genes (Figure S3 in Additional data file 1). A search with
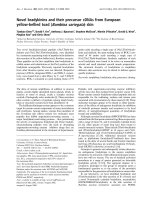
the de novo motif finding program BCRANK [21] resulted in
different motifs with variations of TGTTTAC as the top three
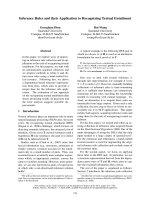
for FOXA1 and top eight for FOXA3 (Figure 1).
As mentioned, members in the FOXA family regulate com-
mon pathways. This was supported by our Gene Ontology
(GO) analysis, where some categories were recurrent for
FOXA1 and FOXA3 (Figure S4A, B in Additional data file 1).
Here, we consider a gene to be regulated by FOXA1 or FOXA3
when it contains a binding site within 1 kb of the TSS. There-
fore, we analyzed the data for possible co-binding sites for
these two factors. As presented in Table 1, more than 3,000
peaks were found in both data sets.
In a genome-wide study of FOXA1 binding sites in the human
breast adenocarcinoma cell line (MCF-7), 12,904 regions
have been found at a 1% false discovery rate [14]. Of these,
2,093 (16%) overlap with the putative binding sites found in
HepG2 cells in our study. In a similar way, 2,178 (27%) of our
regions were reciprocally found in the MCF-7-data. This indi-
cates that around 2,000 FOXA1 binding sites are common
between the HepG2 and MCF-7 cell lines, while 6,000 bind-
ing sites are unique to HepG2.
We found 41,780 H3K4me3 regions in the HepG2 genome
(Table 1). This would approximately correspond to 160,000
nucleosomes with trimethylation of lysine 4 on histone H3.
This number is calculated by multiplying the 41,780 regions
by 764, which is the average peak length (Table S1 in Addi-
tional data file 1), and then dividing the product by 200, the
assumed average distance in base-pairs between the start of
two nucleosomes in these regions. Of the H3K4me3 regions,
42% are within 1 kb and an additional 15% within 5 kb of the
TSS of a known gene, and 4.2% within 1 kb of a 3'-end (Figure
S2 in Additional data file 1). Furthermore, 11% of these
regions are intragenic, leaving 28% of the H3K4me3 not in
the vicinity of a known gene.
Distinct H3K4me3 at bidirectional and other promoter
structures
Next, we aimed to discover patterns of H3K4me3 that could
be indicative of different types of promoters. Therefore, we
extracted the H3K4me3 signals around the TSSs of about
24,000 genes for which the expression measurements in
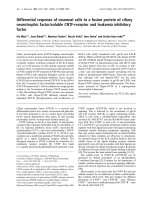
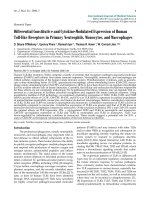
HepG2 are available. We then performed k-means clustering
of the H3K4me3 signals to partition the genes into seven clus-
ters, each with its individual H3K4me3 signature (Figure 2a,
c). Nearly all clusters seem to differ in the level of expression
of the downstream genes from the other clusters (Figure 2b;
Table S2 in Additional data file 1). Furthermore, comparison
of the expression levels in each cluster to the expression of all
24,000 genes using a two-tailed t-test showed that all but
cluster V have significantly higher expression than the aver-
age (P < 0.0001). Instead, cluster V has significantly lower
Table 1
Number of regions and overlaps with putative FOXA binding and
H3K4me3
FOXA1 FOXA2 FOXA3 H3K4me3
FOXA1 8,175 4,042 (49%) 3,065 (38%) 2,947 (36%)
FOXA2 4,025 (56%) 7,153 2,820 (39%) 2,796 (39%)
FOXA3 3,009 (65%) 2,775 (60%) 4,598 2,207 (48%)
H3K4me3 2,849 (7%) 2,560 (6%) 2,181 (5%) 41,780
Results of de novo motif searchFigure 1
Results of de novo motif search. FOXA1 and FOXA3 data were analyzed
using BCRANK as described in the Materials and methods. To the right of
each motif is the assigned BCRANK score, which gives an indication of the
quality of the motif. (a) Top ten predicted motifs for FOXA1. (b) Top ten
predicted motifs for FOXA3.
(a) (b)
353
343
326
178
165
162
161
161
156
155
716
716
709
696
691
666
659
397
189
152
Genome Biology 2009, Volume 10, Issue 11, Article R129 Motallebipour et al. R129.4
Genome Biology 2009, 10:R129
expression than the average (P < 0.0001). Genes with the
highest expression in HepG2 (cluster I with 596 genes; Table
S3) tend to be more enriched for H3K4me3 than any other
cluster. Opposed to this is cluster V (12,776 genes), which
contains the lowest expressed genes with no or very low
enrichment for H3K4me3. The common feature of the six
clusters with high H3K4me3 levels is that a nucleosome with
this modification was centered at approximately 125 bp
downstream of the TSS. Furthermore, these six clusters also
contained genes from different GO categories than those of
cluster V, which had GO categories overrepresented for genes
involved in development (Table S4 in Additional data file 1).
Considering clusters I, II, and III with high enrichments for
H3K4me3 upstream of the TSS, we suspected the existence of
bidirectional transcription in these regions. Therefore, the
clusters were compared with the data for CAGE tags [22-24]
in HepG2. CAGE (cap-analysis of gene expression) is a meas-
urement of the expression of the TSSs of a gene. Consistent
with our expectation, over 30% of the genes in each of these
three clusters were in the vicinity of CAGE tags on the other
strand compared to the TSS, that is, they were part of a bidi-
rectional promoter (Table S3 in Additional data file 1). For
cluster II, with a high and broad peak upstream of the TSS,
this fraction exceeded 60%. Another significant finding was
that 11% of the genes in cluster I, which had the highest
expression, also had a FOXA3 binding site within 1 kb of their
TSS (Table S3 in Additional data file 1).
Previous studies have suggested that bidirectional promoters
occur in CpG-rich sequences [22,23]. Thus, we examined the
frequency of different sequence elements at the TSSs of the
genes in the seven clusters (Table S5 in Additional data file 1).
Promoters for all clusters - except cluster V, which had the
least number of bidirectional promoters - were highly
enriched for CpG-rich sequences. As expected, cluster V con-
tained a higher number of TATA- and CAAT-boxes.
Thus, by unsupervised clustering of enrichment signals
around the TSSs, we detected different H3K4me3 signatures
depending on the structure of the promoter, sequence ele-
ments present in the promoter, and the level of expression of
H3K4me3 signals around the transcriptions start sites of 23,849 genesFigure 2
H3K4me3 signals around the transcriptions start sites of 23,849 genes. (a) Enrichment of H3K4me3 in a window surrounding the TSSs. The genes were
grouped into seven clusters (I to VII) by their H3K4me3 patterns as described in the Materials and methods section. The enrichment scale is from high
(yellow) to low (blue), and the red vertical line represents the TSS position. Negative x-coordinates are upstream of the TSS and positive are downstream.
(b) Box plots indicating the distributions of expression levels in the seven clusters. The white box represents the expression for all genes. (c) Average
H3K4me3 signal footprints for the seven clusters. The colors are as in (b).
(a) (b)
(c)
I
II
III
IV
V
VI
VII
I II III IV V VI VII All
Expression
0101520
−1500 −1000 −500 0 500 1000 1500
Average fragment overlap
806040200
Genome Biology 2009, Volume 10, Issue 11, Article R129 Motallebipour et al. R129.5
Genome Biology 2009, 10:R129
the downstream gene. A similar type of analysis was also per-
formed for H3K4me3 at the 3'-end of genes (Figure S5 in
Additional data file 1). Some of the clusters with higher sig-
nals at the 3'-ends were associated with high expression of the
gene, suggesting a reciprocal H3K4me3 signal at the begin-
ning and the end of some genes. These clusters also have
higher frequency of CAGE tags at the 3'-ends (Table S10 in
Additional data file 1). For further comments, see the supple-
mentary results in Additional data file 1.
FOXA interactions detected by co-
immunoprecipitation and ChIP-reChIP
We have previously examined the genome-wide location of
FOXA2 binding in HepG2 cells, where we found 7,253 bind-
ing sites for this factor [25]. Comparison of the FOXA2 data
with that for FOXA1 and FOXA3 revealed 2,304 regions in
common for all three factors. Here, a common binding is
reported when the distance between the peak centers is less
than 1 kb. Furthermore, when the genomic localization of dif-
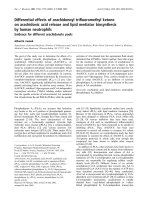
ferent combinations of these factors was examined, we found
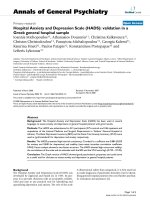
around 100 regions of common binding for each pair (Figure
Genomic localization of common binding regions for FOXA1, FOXA2, and FOXA3Figure 3
Genomic localization of common binding regions for FOXA1, FOXA2, and FOXA3. (a) FOXA1-2, (b) FOXA2-3, (c) FOXA1-3, and (d) FOXA1-2-3.
Each region was mapped to all UCSC gene coordinates and sequentially matched to the categories 500 bp from TSS, 500 bp to 1 kb from TSS, 1 to 5 kb
from TSS, 1 kb from 3'-end, 1 to 5 kb from 3'-end and intragenic. The intergenic group consists of those regions not matching any of the mentioned
categories.
TSS, 500
TSS, 500-1k
TSS, 1-5k
3' END, 1k
3' END, 1-5k
Intragenic
Intergenic
14
5
29
54
27
6
16
2
11
34
134
63
308
53
146
868
732
2
1
9
1
6
49
53
FOXA1-2, 121 regions FOXA2-3, 96 regions
FOXA1-3, 102 regions FOXA1-2-3, 2304 regions
(a) (b)
(c) (d)
Genome Biology 2009, Volume 10, Issue 11, Article R129 Motallebipour et al. R129.6
Genome Biology 2009, 10:R129
3). While 12 of 121 (10%) FOXA1-2 regions were within 5 kb
of a TSS of a known gene (Figure 3a), 49 of 96 (51%) FOXA2-
3 regions were within the same distance (Figure 3b). For
FOXA1-3, 14 of 102 (14%) regions are within 5 kb, although
there are no common binding sites for this pair within the
first kilobase of a TSS (Figure 3c). The corresponding number
for all three factors together is 22% (505 of 2,304; Figure 3d).
Based on these data, we assumed that FOXA1, FOXA2, and
FOXA3 interact with each other in vivo. Therefore, we
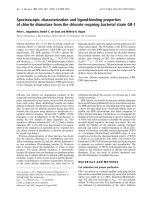
employed co-immunoprecipitation (Co-IP) to examine the
existence of these complexes in HepG2. For this, we immuno-
precipitated the three endogenous factors and immunoblot-
ted with the same antibodies, testing all six possible
combinations. We found that FOXA2 interacts with FOXA1
and the data suggest an interaction between FOXA2 and
FOXA3 as well (Figure 4a). We could not detect any direct
protein-protein interaction between FOXA1 and FOXA3.
The lack of evidence for a direct FOXA1 and FOXA3 interac-
tion could be for technical reasons with regard to the Co-IP
protocol. Therefore, to detect and verify possible co-bindings
and to further understand whether these are due to binding of
different FOXA molecules at the same site in different cells or
due to co-binding in the same cell, we employed the ChIP-
reChIP method in combination with semiquantitative PCR.
With this method, crosslinked protein-DNA complexes are
immunoprecipitated first with the antibody for one protein in
the complex, followed by immunoprecipitation with the anti-
body for the second protein. We immunoprecipitated the
chromatin from HepG2 cells with any of the three FOXA anti-
bodies (FOXA1, FOXA2, and FOXA3) and reimmunoprecipi-
tated the material with another of the three antibodies. The
sequence of the pairs was then reversed in independent repli-
cates in order to verify the results from the first round. The
resulting DNA was then analyzed by PCR with primers ampli-
fying a region containing enriched peaks for both factors in
the complex. As a negative control, we used primers for
regions containing a binding site for only one of the factors in
the pair and primers for a region with no binding site for any
of the factors. Theoretically, if two of the factors co-bind in a
region, that sequence should be enriched in the ChIPed DNA,
while sequences with a single binding should not be enriched
as they are selected against by the serial immunoprecipita-
tion. As demonstrated in Figure 4b, we could find that each of
the factors FOXA1, FOXA2, and FOXA3 bind in close vicinity
of any of the other two FOXAs on the same DNA molecule in
the same cell.
With these results, we demonstrate regions of pair-wise bind-
ing for FOXA1, FOXA2, and FOXA3, where these factors co-
bind in close proximity and, as indicated by the Co-IP data,
some of these factors may even interact at the site of binding.
Correlation of FOXA binding and H3K4me3
FOXA TFs are known to be involved in opening of compacted
chromatin. Accordingly, we examined the H3K4me3 foot-
print pattern in the regions with FOXA1-2-3, FOXA1-2,
FOXA2-3, and FOXA1-3 binding. Regions with FOXA1-2 and
FOXA1-3 binding seem to have a lower enrichment for
H3K4me3 than FOXA2-3 regions (Figure 5a-c, e-g). This was
expected, as only 32% of FOXA1 binding sites had a region
with H3K4me3 within 1 kb, compared to 44% for FOXA3
(Table 1). The more interesting finding is the pattern of his-
tone trimethylation in regions with FOXA1-2-3 binding,
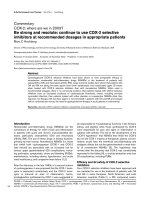
Co-immunoprecipitation and ChIP-reChIP of FOXAs reveals interaction and co-binding among FOXAsFigure 4
Co-immunoprecipitation and ChIP-reChIP of FOXAs reveals interaction
and co-binding among FOXAs. (a) Immunoprecipitations were performed
with indicated antibodies on nuclear extracts of HepG2 cells and the
immunocomplexes were detected with FOXA1, FOXA2, and FOXA3
antibodies. IP, immunoprecipitation; IgG, the antibody was replaced by
normal IgG; Nuc, total nuclear extract; ID, immunodepleted fraction
obtained after IP. The blots are representative of two or three replicates.
None of the proteins was overexpressed. (b) ChIP-reChIP of FOXA1,
FOXA2, and FOXA3 tested by semiquantitative PCR. The order of
antibodies used to immunoprecipitate the protein-DNA complex is
indicated to the left. In each pair of bands, the left one is for the IP and the
right for input. Pairs 1, 5, and 9: a primer amplifying a region with binding
site for both proteins; pairs 2 and 6: regions with binding sites for FOXA1,
but not FOXA2 or FOXA3, respectively; pairs 3 and 10: regions with
binding sites for FOXA2, but not FOXA1 or FOXA3, respectively; pairs 7
and 11: regions with binding sites for FOXA3, but not FOXA1 or FOXA2,
respectively; pairs 4, 8, and 12: a region with no FOXA binding. FOXA2-
FOXA1, FOXA3-FOXA1, and FOXA3-FOXA2 were performed as
independent experiments from the other three ChIP-reChIPs.
1
23
4
56
78
9
10
11
12
(a)
(b)
Genome Biology 2009, Volume 10, Issue 11, Article R129 Motallebipour et al. R129.7
Genome Biology 2009, 10:R129
where a double peak surrounds the peak of TF binding (Fig-
ure 5d, h).
We looked further into this double peak by k-means cluster-
ing of the signal for H3K4me3 in four different clusters (Fig-
ure 6a, b). Two of these clusters, clusters I and II, revealed
patterns that resembled those at the TSS (Figure 2c), with
each of the curves on either side of the FOXA1-2-3 binding.
Due to the observed pattern, we decided to look for TSSs
within a 5 kb distance from the combined FOXA1-2-3 binding
Enrichment signals in regions of pair-wise co-binding for FOXA1, FOXA2, and FOXA3Figure 5
Enrichment signals in regions of pair-wise co-binding for FOXA1, FOXA2, and FOXA3. For each FOXA co-binding site, enrichment signals for FOXA1
(red), FOXA2 (orange), FOXA3 (blue), H3K4me3 (black), HNF4α (olive green), and GABP (turquoise) are plotted, centered on the putative FOXA
binding site. (a-d) Graphs of the non-normalized data. (e-h) Graphs for each factor normalized to their number of aligned reads. Numbers in brackets for
(a-d) are the number of sites with co-binding, as presented in Figure 3.
Genome Biology 2009, Volume 10, Issue 11, Article R129 Motallebipour et al. R129.8
Genome Biology 2009, 10:R129
site. Of the 2,304 regions with triple binding, 505 contained a
known TSS within this distance (Figure 3d), with a similar
number of TSSs on the two strands (Table S6 in Additional
data file 1). A majority of regions in clusters I and II were
within 5 kb of a TSS and these clusters showed the highest lev-
els of H3K4me3. The H3K4me3 peaks in these clusters are
located at opposite sides of the FOXA1-2-3 binding, and this
would suggest that the H3K4me3 signals are biased towards
the direction of transcription (Figure 6b; Table S6 in Addi-
tional data file 1).
In the next step, we correlated these clusters with CAGE tags
from HepG2 within the same distance as above. This compar-
ison revealed a higher percentage of TSSs near the combined
FOXA binding sites (Table S7 in Additional data file 1). When
considering CAGE-tags within 1 kb, the difference in direc-
tionality for clusters I and II became more evident, with more
CAGE tags in the plus direction for cluster I and in the minus
direction for cluster II. Furthermore, by creating separate
footprints of H3K4me3 around the FOXA1-2-3 regions with
or without a TSS within 5 kb, we observed that both groups
exhibit a double peak, each peak with its centre at a distance
of approximately 200 bp from the binding site (Figure 6c).
The H3K4me3 pattern around FOXA1-2-3 binding sites, as
presented in our study, correlates well with the hypothesis
that FOXAs position nucleosomes at their binding site [7],
which is best supported by FOXA1-2-3 regions with a TSS
within 5 kb (Figure 6c).
Correlation of FOXA binding with other transcription
factors
As mentioned previously, FOXAs are involved in auto- and
feed-forward regulation of FOXA genes and other TF genes in
the liver. Therefore, we examined the binding pattern at the
FOXA genes and compared this with our data on upstream
stimulatory factor (USF)1 and USF2 [26], and HNF4α and
GABP (GA binding protein; NRF2) [25]. While FOXA1 and
FOXA2 had binding sites for all three factors, FOXA3 does
H3K4me3 signals around 2,303 FOXA1-2-3 regionsFigure 6
H3K4me3 signals around 2,303 FOXA1-2-3 regions. (a) Enrichment of H3K4me3 in a window surrounding the center of FOXA1-2-3 regions. The regions
were grouped into four clusters (I to IV) by their H3K4me3 patterns. The enrichment scale is from high (yellow) to low (blue), and the red vertical line
represents the FOXA1-2-3 centers. Negative x-coordinates are upstream of the centers and positive are downstream. (b) Average H3K4me3 signal
footprints for the four clusters in (a). (c) Average H3K4me3 signal footprints for regions with a TSS within 5 kb independent of direction (green) and
regions lacking a TSS within this distance (purple).
(a) (b)
IV
III
II
I
(c)
Cluster I
Cluster II
Cluster III
Cluster IV
Average fragment overlap
020 6040 80
−1500 −1000 −500 0 500 1000 1500
TSS within 5kb (703)
Other regions (1600)
Average fragment overlap
02040
3010
150010005000−500−1000−1500
Genome Biology 2009, Volume 10, Issue 11, Article R129 Motallebipour et al. R129.9
Genome Biology 2009, 10:R129
not seem to be regulated by any of the FOXAs (Figure S6 in
Additional data file 1). Moreover, FOXA1 and FOXA3 both
seem to co-bind with the other factors at a similar rate (Table
2). When we examined the co-binding of GABP with FOXA1-
2, FOXA2-3, and FOXA1-3, we found that only the second
complex had co-binding with it (Table 2 and Figure 5a-c, e-g).
In our ChIP-seq study of GABP, we found that 85% of its puta-
tive binding sites were located at TSSs.
Another interesting observation was that FOXA1-2 and
FOXA1-3 regions were more related to HNF4α binding than
FOXA2-3 (Table 2 and Figure 5a-c, e-g). In addition, FOXA1-
2-3 binding is highly correlated with HNF4α binding in
HepG2 cells (Table 2 and Figure 5d, h).
Allele-specific DNA-protein interactions
Monoallelic expression of genes can be due to imprinting,
allelic exclusion or sex chromosome dosage compensation.
SNPs in combination with the ChIP-seq could prove to be a
powerful method for detection of allele-specific binding that
could lead to monoallelic or preferential expression from one
allele in the studied genome. With a high enough number of
sequence reads at a locus with a heterozygous SNP, one can
detect whether the majority of reads are from one allele or the
other. If TF binding or active histone marks are predomi-
nantly found on only one of the alleles, one can suspect pref-
erential binding to that particular allele of the gene.
Previously, we have interrogated the genome of HepG2 cells
for SNPs by the Infinium assay and Human-1M array (Illu-
mina) in 1,000,000 positions (data not shown). Among these,
220,000 were heterozygous SNPs (Additional data file 5),
which we screened in the ChIP-seq data for allele-specific
binding. After taking multiple testing into account as
described in the Materials and methods section, we found
three examples for FOXA1, two for FOXA3, and six for
H3K4me3 (Table S8 in Additional data file 1).
A detailed view of the most significant SNP for FOXA1,
rs7248104, located in an intronic region of the insulin recep-
tor precursor gene (INSR), revealed some interesting results
(Figure 7). rs7248104 is a heterozygous (C/T) SNP in HepG2
located in a DNA sequence that exactly matches the top motif
found for FOXA1 (Figure 1a). The motif predicts binding of
FOXA1 to the T-allele, but not the C-allele, which was
reflected in the ChIP-seq data as all 15 reads that cover the
SNP contain the T-allele (Figure 7). This could indicate
rs7248104 as a functional SNP, due to its effect on FOXA1
binding to the DNA, although experimental data are required
to confirm this.
Combining ChIP-seq and SNP association data
Several genome-wide association studies have identified
SNPs associated with various traits. Combining such data
with our genome-wide DNA-protein interaction maps could
offer a possibility to find functional SNPs. Here, we compared
our data for FOXA1, FOXA3, and H3K4me3 with previously
published genome-wide association studies for plasma levels
of liver enzymes and metabolic traits, for example, lipid and
fasting glucose levels [27-32]. We searched for these reported
SNPs in all our positive regions and identified those that were
associated with a specific trait and that were included in our
significant peaks for TF binding or H3K4me3 (Table 3; Table
S9 in Additional data file 1). Locating these SNPs in the regu-
latory regions is an important first step towards identification
of functional SNPs and a possible hint on the effect of this
nucleotide variation.
Discussion
In this paper, we present the first true genome-wide location
analysis of FOXA1 and FOXA3 binding sites in the human
HepG2 cell line through ChIP-seq and their internal associa-
tion. Our analysis demonstrates that among the FOXA family,
FOXA1 is the more frequent binder with a majority of binding
sites far from known genes, while FOXA3 binds least fre-
quently and preferentially at sites near a known gene. Addi-
tionally, from Co-IP analyses we found that FOXA2 interacts
with both other FOXAs, while FOXA1 and FOXA3 do not
seem to interact. Through ChIP-reChIP experiments, we
demonstrated pair-wise co-binding of the FOXA factors to the
Table 2
Overlap between putative FOXA binding sites and the binding of other factors
Number of regions HNF4α*GABP
†
USF1
‡
USF2
FOXA1 8,175 5,043 (62%) 47 (0.6%) 232 (2.8%) 288 (3.5%)
FOXA2 7,153 3,838 (54%) 158 (2.2%) 257 (3.6%) 274 (3.8%)
FOXA3 4,598 2,536 (55%) 147 (3.2%) 186 (4.0%) 227 (4.9%)
(FOXA1+FOXA2)-FOXA3 121 75 (62%) 0 (0%) 3 (2.5%) 3 (2.5%)
(FOXA2+FOXA3)-FOXA1 96 16 (17%) 22 (22.9%) 4 (4.2%) 4 (4.2%)
(FOXA1+FOXA3)-FOXA2 102 27 (26%) 0 (0%) 2 (2%) 3 (3%)
FOXA1+FOXA2+FOXA3 2,304 1,762 (76%) 31 (1.3%) 99 (4.3%) 140 (6.1%)
*Hepatocyte nuclear factor 4a.
†
GA binding protein.
‡
Upstream stimulatory factor.
Genome Biology 2009, Volume 10, Issue 11, Article R129 Motallebipour et al. R129.10
Genome Biology 2009, 10:R129
same sites of DNA in the same cell. These data were further
substantiated by the differential binding pattern of these
complexes and their interactions with other TFs located
either at TSSs or at distant sites.
Out of the ten top-ranked motifs found for FOXA1 and
FOXA3, only the few top motifs are canonical and the rest are
either variations of the top-motif or other motifs. We have
previously suggested that these non-canonical bindings
might be due to interactions of FOXAs with other TFs and
that these motifs might in fact be canonical motifs for the
binding partners of FOXAs [18]. A recent report implies that
different sequences at binding sites might affect the binding
and regulatory activity of the interacting TF [33].
We did not find any evidence of protein-protein interaction
between FOXA1 and FOXA3, but we cannot yet completely
exclude a direct/indirect interaction. If there are any interac-
tions between these two factors, they might be transient and
rapid in the cells. These interactions might also be very weak
and therefore easily lost during the treatments and washes,
and hence not detected by Co-IP. Instances where FOXA1,
FOXA2, and FOXA3 are found together could be due to two
molecules of FOXA2 binding at the site and each recruiting
one of the other two factors. Another possibility is the involve-
ment of other factors, such as HNF4α, in engaging the differ-
ent participants of the complex. Indeed, we demonstrate here
that 76% of FOXA1-2-3 bindings coincide with HNF4α-bind-
ing. Previously, we have also detected that HNF4α co-immu-
noprecipitates with FOXA2 in HepG2 cells [25].
Based on the X-ray crystallographic structure of FOXA3, it
was postulated that FOXAs bind DNA as monomers [8]. This
is not in conflict with our results, as most of the binding sites
Preferential binding of FOXA1 at a heterozygous SNPFigure 7
Preferential binding of FOXA1 at a heterozygous SNP. SNP rs7248104 is located in a FOXA1 binding sequence and FOXA1 is preferentially bound to one
allele. At the top is the FOXA1 motif, predicted by the BCRANK method, followed by the sequence found in HepG2 with the alleles of the heterozygous
SNP (T/C) in brackets. These are followed by the sequence in the reference genome and the sequence found in the FOXA1-reads. At the SNP position,
the T-allele corresponds to the FOXA1 motif, which is found in all 15 FOXA1 reads, while the C-allele in the reference genome is not detected at all. The
raw data for individual FOXA1 reads in the region are presented at the bottom, viewed in the SOLiD™ Alignment Browser tool. The positions marked in
green correspond to bases (in the SOLiD™ two-base encoding) that align to the reference genome. In gray are the bases with a match error. The yellow
bases correspond to positions with valid adjacent mismatches, indicating the locations of SNPs. The vertical hatched lines enclose the position of the motif.
7175408
7175416
7175424717543271754407175448717545675464
GGGTCTCGTGTTTGTCTCCGCACGTCGCTTCATTTGTGCCCTTCGAGACTTTTGGGTAAGTA
CCCAGAGCACAAACAGAGGCGTGCAGCGAAGTAAACAC
GGGAAGCTCTGAAAACCCATTCAT
00012223111001122203311312310022300111300200222
311100112220331131211002130011110020
0322212000100
00
01222
3
1
11
101
12
133113123
10021300111300202
022212000100130213
000122231110011222033100202322212000100130213
000122231110011222033111123
1
00213
10
00023311312310021300111300202322222000100130113
000122231110011222033113
000122231110011222033113123100223301111
00012223111001122
331131231
0001300011300202322212000100130213
0001222311100112220331131231
0021300111
02222212000100130213
0
20122231110011222033113123
100213001112212100100130213
0001222311100112220331131231002130011130
000122231110011222033113123100213001113002
1110011222033113133
1
00213003113002023222120001001
100112220331131231
00213001
1130
020232
2
21200
0
100130
3311312310021300111300202322212000100130213
31231
0021300111300202322212000100130213
302202322212000100130213
CGTGTTTACTT[T/C]HepG2 genomic DNA:
FOXA1 ChIP DNA: CGTGTTTACTTT
Reference genome: CGTGTTTACTTC
FOXA1 top motif:
Genome Biology 2009, Volume 10, Issue 11, Article R129 Motallebipour et al. R129.11
Genome Biology 2009, 10:R129
for the FOXAs seem to contain only one motif for the FOXA
factors. Regions with binding of two or all three factors could
be through binding of one to the main motif and the second
and/or third factor to other motifs. This is less likely as at the
sites of interaction we mostly find a single peak for each of the
factors, all in nearly the same position. We therefore hypoth-
esize that each of the factors bind DNA as monomers at differ-
ent positions and then may interact in diverse constellations
through long-range interactions. Further studies are required
to understand the nature of these interactions and the inter-
relationship of the FOXA factors.
In this study, we have also mapped the histone modification
H3K4me3 genome-wide in HepG2 cells. As in other studies,
we find this modification mainly around the TSS of genes
[34]. However, by clustering of data by k-means in these
regions, we were able to discover several different patterns of
H3K4me3, few of them highly correlated with the expression
level of the gene and the surrounding promoter structure.
Using the same approach, we could also detect five clusters at
the 3'-end of genes. Again, here we found patterns that could
be related to the structure of the DNA at these sites. Conver-
gent or tail-to-tail genes, for example, exhibited other pat-
terns than tail-to-head genes or genes without any other
transcription units in the vicinity. Our results clearly demon-
strate the importance of cautious interpretation of histone
mark signals, as the average signal, usually displayed by foot-
prints, is composed of a number of diverse patterns from sub-
groups of genes with different features.
FOXA TFs are demonstrated to act as pioneering factors, that
is, they are able to bind to compacted chromatin and facilitate
opening of the chromatin and recruitment of other TFs. We
found here that binding of FOXA2-3 correlates more often
with H3K4me3 than FOXA1-2 and that FOXA3 binding was
associated with high expression and high enrichment for tri-
methylation of K4 on histone H3. Additionally, sites with tri-
ple binding of FOXAs had one or two peaks of H3K4me3 on
either side of the binding site, with directionality towards a
TSS. This can be interpreted as the binding of FOXAs
upstream of a TSS positioning the nucleosomes in between,
regardless of the distance, and recruiting the histone methyl-
transferases that methylate the first nucleosome adjacent to
the FOXA binding site. This mark may then be propagated to
some extent between the binding site and the TSS.
Preferential binding of TFs and histone modifications to one
allele of a SNP can easily be detected through ChIP-seq if
there is a sufficient number of overlapping reads at hetero-
zygous SNPs. Specifically, the preferred binding/modifica-
tion can occur in regulatory elements with SNPs that are
associated with common disorders. We found several exam-
ples of SNPs that were related to a preferential binding/mod-
ification in this study. Examination of these SNPs and their
possible effect on the expression of nearby genes can offer
mechanistic insights into inherited variation in gene expres-
sion and pathogenesis of common disorders.
Conclusions
ChIP-seq is a powerful strategy that can be used for purposes
other than to create gene regulatory maps. By combining data
for several TFs, we predicted protein-protein interactions and
sites of co-binding, which were validated in Co-IP and ChIP-
reChIP experiments. By reading the sequence in ChIP-DNA at
polymorphic sites, we find many instances of allele-specific
DNA-protein interactions, which are important data to
understand the mechanisms of allelic imbalance in gene
expression. SNPs associated with diseases and common phe-
notypes are also frequently found in the enriched regions.
This means that ChIP-seq is an additional high-throughput
Table 3
Comparison of ChIP-seq data with genome-wide association studies for identification of functional SNPs
Chr. Position SNP Nearest/affected gene Factor Trait Study
1 109,619,113 rs12740374 CELSR2, PSRC1, SORT1 FOXA1 LDL*/Dyslipidemia Kathiresan et al.
10 101,851,425 rs11597390 CPN1 FOXA1, FOXA3 Plasma levels of liver
enzymes (ALT
†
)
Yuan et al.
1 109,620,053 rs646776 CELSR2-PSRC1-SORT1 H3K4me3 TC
‡
/LDL Aulchenko et al., Sabatti et al.
2 43,918,594 rs6756629 ABCG5 H3K4me3 TC/LDL Aulchenko et al.
11 47,226,831 rs2167079 NR1H3 H3K4me3 HDL
§
Sabatti et al.
11 61,353,788 rs174570 FADS2/3 H3K4me3 TC/LDL Aulchenko et al.
19 11,063,306 rs6511720 LDLR H3K4me3 LDL/Dyslipidemia Kathiresan et al.
19 50,087,106 rs157580 TOMM40-APOE, APO cluster H3K4me3 TC/TG/LDL Aulchenko et al., Sabatti et al.
19 50,087,459 rs2075650 TOMM40-APOE H3K4me3 TC/LDL Aulchenko et al.
22 23,320,213 rs4820599 GGT1 H3K4me3 Plasma levels of liver
enzymes (GGT
¥
)
Yuan et al
*LDL, low density lipoproteins.
†
ALT, alanine-aminotransferase.
‡
TC, total cholestrol.
§
HDL, high density lipoproteins. TG, triglycerides.
¥
GGT,
gamma-glutamyl transferase.
Genome Biology 2009, Volume 10, Issue 11, Article R129 Motallebipour et al. R129.12
Genome Biology 2009, 10:R129
method to generate systematic data on the molecular basis of
quantitative human variation.
Materials and methods
Chromatin immunoprecipitation - ChIP and ChIP-
reChIP
The human hepatocellular carcinoma cell line HepG2 was
cultured in RPMI-1640 with non-inactivated fetal bovine
serum and penicillin-streptomycin at 37°C with 5% CO
2
. For
the ChIP-assay, cells were washed and serum-free medium
was added before incubation with formaldehyde in a final
concentration of 0.37% for 10 minutes. Cells were then lysed
and the nuclei were resuspended in RIPA-buffer (1× phos-
phate-buffered saline (PBS), 1% NP-40, 0.5% Na-deoxycho-
late, 0.1% SDS, 0.004% Na-azide) for sonication with a
Bioruptor (Diagenode, Liège, Belgium) to obtain fragments
with a size range between 150 and 300 bp. Sonicated chroma-
tin was then pre-cleared and incubated with the antibody
overnight. After a short incubation with Protein-G agarose
(Roche, Mannheim, Germany), the chromatin-antibody-bead
complex was washed four times with RIPA-buffer, once with
0.01 M Tris-HCl (pH 8), 0.25 M LiCl, 0.001 M EDTA, 1% NP-
40 and 1% Na-deoxycholate, and once with TE-buffer. Then
the chromatin was eluted with 1% SDS and 0.1 M NaHCO
3
before RNase-treatment and reversal of the cross-linking at
65°C for 6 hours and Proteinase-K treatment overnight. The
DNA was eluted with phenol-chloroform and precipitated
with ethanol. Enrichment for each antibody was tested by
semiquantitative PCR with primers for known binding sites.
ChIP-reChIP was performed as described in [35], except that
after the first elution the material was diluted five times.
Antibodies used in this study were for FOXA1 (ab5089,
Abcam, Cambridge, UK), FOXA2 (sc-6554, Santa Cruz Bio-
technology, Santa Cruz, CA, USA), FOXA3 (sc-5361, Santa
Cruz Biotechnology), and tri-methylation-histone H3 (K4)
(05-745 (CL MC315100), Upstate, Temecula, CA, USA).
Micrococcal nuclease-ChIP
Pelleted HepG2 cells were resuspended in ice-cold buffer A
containing 320 mM sucrose, 15 mM HEPES pH 7.9, 60 mM
KCl, 2 mM EDTA, 0.5 mM EGTA, 0.5% bovine serum albu-
min, 0.5 mM spermidine, 0.15 mM spermine, and 0.5 mM
DTT. After a short incubation on ice, cells were homogenized
with a Dounce homogenizer. The homogenate was then lay-
ered on an equal volume of buffer B, which was the same
buffer as A except that it did not contain bovine serum albu-
min and the sucrose concentration was 30%. Collected nuclei
were washed once with and resuspended in 0.34 mM sucrose,
15 mM HEPES pH 7.5, 60 mM KCl, 15 mM NaCl, 0.5 mM
spermidine, 0.15 mM spermine, and 0.15 mM β-mercap-
toethanol. After adjustment of CaCl
2
concentration to 3 mM,
the suspension was aliquoted to have 30 × 10
6
cells per millili-
ter. These were incubated at 37°C for 5 minutes before addi-
tion of 300 U of micrococcal nuclease to each aliquot, after
which the incubation was continued for another 5 minutes.
To stop the reaction 90 mM HEPES pH 7.9, 220 mM NaCl, 10
mM EDTA, 2% Triton X-100, 0.2% Na-deoxycholate, 0.2%
SDS, 0.5 mM PMSF, and 2 μg/ml aprotinin was added. The
solution was centrifuged and the supernatant was used to set
up the ChIP-assay as described above.
Library preparation and sequencing
All preparations of libraries for sequencing and the sequenc-
ing itself were according to the SOLiD™ System 2.0 Fragment
Library Preparation: Lower Input DNA and User Guide
standard protocols, with the following modifications.
For the FOXA1 library three ChIPs were performed, resulting
in five immunoprecipitations, which were pooled. The major-
ity of the fragments were in the size range of 150 to 300 bp
after sonication during the ChIP. Therefore, to obtain a
homogeneous fragment size and to avoid biased fragment
amplification, we decided to prepare three fragment libraries.
After ligation of adapters and purification, the DNA was sep-
arated by PAGE and three fragment size ranges selected: 150
to 200 bp, 200 to 250 bp, and 250 to 300 bp including the
adapters. These were used for 15 cycles of in-gel PCR. For the
FOXA3 library 0.5 μg of immunoprecipitation material and 4
μg of input were used as the starting material. Here, three
fragment sizes were also chosen for the immunoprecipitation
material, but only the 250- to 300-bp fragment size was cho-
sen from the input. The in-gel PCR was performed for 13
cycles. Amplified fragments were sequenced with 50-bp read
lengths for FOXA1 and 35-bp read lengths for FOXA3. For
H3K4me3, five immunoprecipitations from independent
MNase-ChIP assays were pooled and used as the starting
material. For this library preparation only one fragment size
was chosen, as the sizes of fragments were uniform due to
micrococcal nuclease treatment. The library was sequenced
with a 35-bp read length.
Co-immunoprecipitation
Cells were grown as described for ChIP. These were washed
twice with cold 1× PBS, resuspended in a buffer containing
100 mM Tris-HCl (pH 8.0), 100 mM NaCl, 0.2% NP-40, and
protease inhibitor cocktail for 30 minutes on ice and centri-
fuged in cold to collect nuclei in the pellet. The pellet contain-
ing intact nuclei was washed once with RIPA and
resuspended in the same buffer, followed by homogenization
in a Dounce homogenizer. Precleared nuclear lysate was incu-
bated with antibody or IgG at a concentration of 1 μg per
approximately 500 μg of total protein and 50 μl Protein G-
agarose at 4°C overnight. Immune complexes were washed
twice with RIPA buffer and eluted in NuPAGE
®
LDS sample
buffer (Invitrogen, Temecula, CA, USA) containing reducing
agent (Invitrogen) at 70°C for 10 minutes. Samples were sep-
arated on NuPAGE
®
4-12% for western blotting and detection
with ECL detection system (GE Healthcare, Chalfont St Giles,
UK). In order to verify the equal loading and as a negative
Genome Biology 2009, Volume 10, Issue 11, Article R129 Motallebipour et al. R129.13
Genome Biology 2009, 10:R129
control for the Co-IP experiments, one blot was stripped with
1× PBS, 0.1% Tween-20, and 0.2% SDS for 30 minutes at
65°C and incubated with GAPDH antibody (data not shown).
Alignment, data management, and peak detection
ChIP-seq data were aligned using the SOLiD™ matching
pipeline [36]. Three match errors in color space were allowed
for the data sets with 35-bp reads (H3K4me3, FOXA3, and
input). For the 50-bp reads in the FOXA1 experiment, four
errors were allowed.
For FOXA1 and FOXA3, only reads starting at unique points
were considered as those fragments were randomly sonicated
and therefore expected to start at different positions.
H3K4me3 ChIP-DNA had been sheared with MNase and the
fragments were thus expected to be of defined lengths. There-
fore, we did not merge H3K4me3 reads starting at the same
position. Input reads were not merged either. Reads were
then extended to represent the average fragment length in
each of the samples (Table S1 in Additional data file 1) and
genome-wide signals were created for reads on the forward
strand, reads on the reverse strand, and overlapping frag-
ments.
Peaks were then detected by first calculating a cutoff on the
overlap signal. This cutoff was estimated in the following way.
Assuming that a fragment of length l
f
is placed randomly onto
a genome of length l
g
, the probability that one single base in
the genome is covered by that fragment is l
f
/l
g
. If n reads are
placed independently, the probability of having a certain
number of overlaps at one position will follow the binomial
distribution:
In this way, we can calculate P-values for observing at least k
overlapping reads at any given position. These tests are then
performed for each base in the genome. Because of the high
number of reads in these experiments, and since the fraction
l
f
/l
g
is very small, the binomial distribution can be effectively
approximated by Poisson (
λ
) in this analysis where
λ
= l
f
/l
g
.
So, in practice, this part of our peak finding method will yield
the same results as other approaches that are based on the
Poisson distribution [37]. Nevertheless, we chose to use the
binomial distribution since it is a general and intuitive model
for randomly placing millions of reads onto the genomic
sequence. The Bonferroni method was used to correct for
multiple hypothesis testing, a very stringent P-value correc-
tion.
Cutoffs were then obtained by selecting the lowest overlap
value that gives a corrected P-value below 0.01: 15 for FOXA1,
21 for FOXA3, 15 for H3K4me3 and 16 for input. Peaks were
defined by consecutive positions with overlap at least as high
as the cutoff. In the next step, FOXA1, FOXA3, and H3K4me3
peaks that were also significantly enriched for input were
removed. Examples of such regions are demonstrated in Fig-
ure S7 in Additional data file 1. High signals both in input and
ChIP DNA are mostly found in regions close to centromeres
where repeats are abundant. Such signals can arise when the
reference genome has not been properly assembled. In the
final step, we keep only regions with a significant number of
overlapping forward reads upstream of the peak, or a signifi-
cant number of reverse reads downstream. To take the for-
ward and reverse reads into account is a commonly used
strategy in ChIP-seq analysis [38,39]. We calculated cutoffs
for forward and reverse peaks in the same way as for the over-
lap signal with l
f
now being the read length instead of frag-
ment length as before. We allowed the forward or reverse
peak to be at most a fragment length distance from the peak
center. The reason why we do not require both a forward and
a reverse peak is that repetitive elements immediately
upstream or downstream of a peak can make it impossible to
get uniquely aligned reads there.
Motif search
We used the Bioconductor package BCRANK [21] for de novo
motif searches in FOXA1 and FOXA3 data. BCRANK takes a
ranked list as regions and works best on lists containing many
regions, where the sequences at the bottom are not always
bound directly by the TF. Therefore, we created ranked lists
with FOXA1 and FOXA3 regions using more relaxed cutoffs
than the ones described above by not applying the cutoffs for
forward and reverse peaks. This resulted in 16,578 relaxed
regions for FOXA1 and 22,066 for FOXA3.
Annotations and Gene Ontology analysis
We annotated our regions to two types of transcripts. For
well-characterized genes, we downloaded the UCSC Genes
table from the UCSC Genome Browser [40], which contains
predictions based on RefSeq, Genbank, CCDS, and UniProt.
For less well-annotated transcripts, we downloaded the
CAGE tag database from the FANTOM3 site [41], and
extracted the 45,093 CAGE tag clusters found in HepG2 cells.
In our analysis, all transcripts with a TSS within 1 kb of a peak
are considered as bound by that factor. GO analysis was per-
formed by applying the DAVID [42] functional annotation
tools to sets of UCSC Genes. CpG island coordinates were
downloaded from the UCSC Genome Browser.
Expression analysis
Expression data were downloaded from Gene Expression
Omnibus [43], accession number [GEO:GDS2213]. In the
experiment, mRNA levels in HepG2 cells were measured in
four replicates on the Affymetrix U133 Plus 2.0 array [44].
The expression level for each probe was calculated as the
mean of the four replicates, and the probes were mapped to
the corresponding UCSC Genes using the
knownToU133Plus2 table from the UCSC Genome Browser.
In this way, we obtained expression levels for 23,898 genes.
prob overlap k
n
i
ll ll
fg
i
fg
ni
ik
n
≥
()
=
⎛
⎝
⎜
⎞
⎠
⎟
()
−
()
−
=
∑
1
Genome Biology 2009, Volume 10, Issue 11, Article R129 Motallebipour et al. R129.14
Genome Biology 2009, 10:R129
Clustering of H3K4me3 patterns
For all 23,898 genes with expression levels in HepG2, we
extracted the H3K4me3 signals in a 4-kb window surround-
ing the TSSs. The H3K4me3 signals were stored in numerical
vectors with one value for each base in the window. k-means
clustering was then applied to the 23,898 vectors. In this way,
genes with similar H3K4me3 patterns around TSSs could be
identified in an unsupervised manner. The same clustering
strategy was performed for H3K4me3 signals at the 3'-end of
the genes.
Statistical analysis of allele-specific binding
Around 220,000 SNPs, heterozygous in HepG2, were identi-
fied by genotyping 1,000,000 SNPs on an Illumina array
(data not shown). In the next step, we filtered out SNPs that
were covered by at least ten reads. This resulted in three het-
erozygous SNPs for FOXA1, two for FOXA3, and six for
H3K4me3. Among these heterozygous SNPs, we aimed to
detect instances where ChIP-seq data were significantly
biased towards one of the alleles. For this, we used SNP call-
ing results from the SOLiD™ SNP calling pipeline [36] for
each of H3K4me3, FOXA1, and FOXA3. We then assumed
that both alleles should be equally represented if there is no
allelic preference for the binding, and used a binomial model
to test for the hypothesis. SNPs with a P-value < 0.001 were
considered significant. To reach the significance threshold, a
SNP must be covered by at least ten reads and, in that case, all
reads must contain the same allele. For SNPs with even
higher coverage, both alleles can be present but one signifi-
cantly more often than the other. By multiplying the number
of tested heterozygous SNPs (Table S8 in Additional data file
1) with the P-value significance threshold 0.001, we obtain
the number of expected false positive allele-specific binding
events for each factor. A comparison with the number of
observations reveals that the false discovery rate is about 0.1
in our results, indicating that about one of the 11 identified
SNPs in Table S8 in Additional data file 1 is expected to be a
false positive.
Data accession
The raw ChIP-seq data are freely accessible at the European
Read Archive [45] with the accession number [ERA:000074].
The coordinates for our identified positive regions for FOXA1,
FOXA3, and H3K4me3 are available as Additional data files
2, 3, and 4 and can be uploaded and viewed in the UCSC
Genome Browser.
Abbreviations
CAGE: cap-analysis of gene expression; ChIP: chromatin
immunoprecipitation; ChIP-seq: ChIP with detection by
sequencing; Co-IP: co-immunoprecipitation; FOX: Forkhead
box/winged helix; GABP: GA binding protein; GO: Gene
Ontology; H3K4me3: trimethylation of lysine 4 on histone
H3; HNF: hepatocyte nuclear factor; MNase: micrococcal
nuclease; PBS: phosphate-buffered saline; SNP: single nucle-
otide polymorphism; TF: transcription factor; TSS: transcrip-
tional start site; USF: upstream stimulatory factor.
Authors' contributions
CW and MM conceptualized the study; MM, MSRB, KP,
MAB, and KM performed the experiments, library prepara-
tion, and the sequencing; AA, MM, JM, and JK conducted the
analyses; OW provided data on FOXA2; MM, AA, and CW
wrote the manuscript.
Additional data files
The following additional data are available with the online
version of this paper: a PDF file with supplementary results,
materials and methods, Figures S1 to S8, and Tables S1 to S14
(Additional data file 1); a BED file with positions of FOXA1 in
the HepG2 genome (Additional data file 2); a BED file with
positions of FOXA3 in the HepG2 genome (Additional data
file 3); a BED file with positions of H3K4me3 in the HepG2
genome (Additional data file 4); a text file containing data on
heterozygous SNPs in HepG2 with position, ID, and alleles of
each SNP (Additional data file 5).
Additional data file 1Supplementary results, materials and methods, Figures S1 to S8, and Tables S1 to S14Supplementary results, materials and methods, Figures S1 to S8, and Tables S1 to S14.Click here for fileAdditional data file 2Positions of FOXA1 in the HepG2 genomeThis file can be uploaded in the UCSC genome browser.Click here for fileAdditional data file 3Positions of FOXA3 in the HepG2 genomeThis file can be uploaded in the UCSC genome browser.Click here for fileAdditional data file 4Positions of H3K4me3 in the HepG2 genomeThis file can be uploaded in the UCSC genome browser.Click here for fileAdditional data file 5Data on heterozygous SNPs in HepG2 with position, ID, and alleles of each SNPThis file can be viewed with MS Excel.Click here for file
Acknowledgements
We thank people at Applied Biosystems in Foster City and Beverly, USA,
and Uppsala Genome Center at Rudbeck laboratory, Uppsala University,
Sweden for performing the sequencing. A special thanks to Jussi Vanhatalo
at the Nordic AB for his skill and technical support in these studies. CW
was supported by the Swedish Research Council for Science and Technol-
ogy, the Diabetes association, the Cancer Foundation, the Markus Borg-
ström Foundation, the Family Ernfors Fund, Novo Nordisk, and a grant for
sequencing from the Knut and Alice Wallenberg Foundation, via the Center
for Metagenomic Sequencing. JK was supported by the Swedish Foundation
for Strategic Research, The Knut and Alice Wallenberg Foundation, Upp-
sala University and the Swedish University for Agricultural Sciences.
References
1. Kaestner KH, Knochel W, Martinez DE: Unified nomenclature for
the winged helix/forkhead transcription factors. Genes Dev
2000, 14:142-146.
2. Friedman JR, Kaestner KH: The Foxa family of transcription fac-
tors in development and metabolism. Cell Mol Life Sci 2006,
63:2317-2328.
3. Carlsson P, Mahlapuu M: Forkhead transcription factors: key
players in development and metabolism. Dev Biol 2002,
250:1-23.
4. Lee CS, Friedman JR, Fulmer JT, Kaestner KH: The initiation of
liver development is dependent on Foxa transcription fac-
tors. Nature 2005, 435:944-947.
5. Schrem H, Klempnauer J, Borlak J: Liver-enriched transcription
factors in liver function and development. Part I: the hepato-
cyte nuclear factor network and liver-specific gene expres-
sion. Pharmacol Rev 2002, 54:129-158.
6. Cirillo LA, Lin FR, Cuesta I, Friedman D, Jarnik M, Zaret KS: Opening
of compacted chromatin by early developmental transcrip-
tion factors HNF3 (FoxA) and GATA-4. Mol Cell 2002,
9:279-289.
7. Shim EY, Woodcock C, Zaret KS: Nucleosome positioning by
the winged helix transcription factor HNF3. Genes Dev 1998,
12:5-10.
8. Clark KL, Halay ED, Lai E, Burley SK: Co-crystal structure of the
HNF-3/fork head DNA-recognition motif resembles histone
H5. Nature 1993, 364:412-420.
9. Duncan SA, Navas MA, Dufort D, Rossant J, Stoffel M: Regulation
Genome Biology 2009, Volume 10, Issue 11, Article R129 Motallebipour et al. R129.15
Genome Biology 2009, 10:R129
of a transcription factor network required for differentiation
and metabolism. Science 1998, 281:692-695.
10. Odom DT, Dowell RD, Jacobsen ES, Nekludova L, Rolfe PA, Danford
TW, Gifford DK, Fraenkel E, Bell GI, Young RA: Core transcrip-
tional regulatory circuitry in human hepatocytes. Mol Syst Biol
2006, 2:. 2006.0017
11. Kyrmizi I, Hatzis P, Katrakili N, Tronche F, Gonzalez FJ, Talianidis I:
Plasticity and expanding complexity of the hepatic transcrip-
tion factor network during liver development. Genes Dev
2006, 20:2293-2305.
12. Carroll JS, Liu XS, Brodsky AS, Li W, Meyer CA, Szary AJ, Eeckhoute
J, Shao W, Hestermann EV, Geistlinger TR, Fox EA, Silver PA, Brown
M: Chromosome-wide mapping of estrogen receptor binding
reveals long-range regulation requiring the forkhead protein
FoxA1. Cell 2005, 122:33-43.
13. Laganiere J, Deblois G, Lefebvre C, Bataille AR, Robert F, Giguere V:
From the Cover: Location analysis of estrogen receptor
alpha target promoters reveals that FOXA1 defines a
domain of the estrogen response. Proc Natl Acad Sci USA 2005,
102:11651-11656.
14. Lupien M, Eeckhoute J, Meyer CA, Wang Q, Zhang Y, Li W, Carroll
JS, Liu XS, Brown M: FoxA1 translates epigenetic signatures
into enhancer-driven lineage-specific transcription. Cell 2008,
132:958-970.
15. Odom DT, Dowell RD, Jacobsen ES, Gordon W, Danford TW,
MacIsaac KD, Rolfe PA, Conboy CM, Gifford DK, Fraenkel E: Tissue-
specific transcriptional regulation has diverged significantly
between human and mouse. Nat Genet 2007, 39:730-732.
16. Wederell ED, Bilenky M, Cullum R, Thiessen N, Dagpinar M, Delaney
A, Varhol R, Zhao Y, Zeng T, Bernier B, Ingham M, Hirst M, Robert-
son G, Marra MA, Jones S, Hoodless PA: Global analysis of in vivo
Foxa2-binding sites in mouse adult liver using massively par-
allel sequencing. Nucleic Acids Res 2008, 36:4549-4564.
17. Tuteja G, Jensen ST, White P, Kaestner KH: Cis-regulatory mod-
ules in the mammalian liver: composition depends on
strength of Foxa2 consensus site. Nucleic Acids Res 2008,
36:4149-4157.
18. Rada-Iglesias A, Wallerman O, Koch C, Ameur A, Enroth S, Clelland
G, Wester K, Wilcox S, Dovey OM, Ellis PD, Wraight VL, James K,
Andrews R, Langford C, Dhami P, Carter N, Vetrie D, Ponten F,
Komorowski J, Dunham I, Wadelius C: Binding sites for metabolic
disease related transcription factors inferred at base pair
resolution by chromatin immunoprecipitation and genomic
microarrays. Hum Mol Genet 2005, 14:3435-3447.
19. Wang Z, Zang C, Rosenfeld JA, Schones DE, Barski A, Cuddapah S,
Cui K, Roh TY, Peng W, Zhang MQ, Zhao K: Combinatorial pat-
terns of histone acetylations and methylations in the human
genome. Nat Genet 2008, 40:897-903.
20. Guenther MG, Levine SS, Boyer LA, Jaenisch R, Young RA: A chro-
matin landmark and transcription initiation at most promot-
ers in human cells. Cell 2007, 130:77-88.
21. Ameur A, Rada-Iglesias A, Komorowski J, Wadelius C: Identifica-
tion of candidate regulatory SNPs by combination of tran-
scription-factor-binding site prediction, SNP genotyping and
haploChIP. Nucleic Acids Res 2009, 37:e85.
22. Sandelin A, Carninci P, Lenhard B, Ponjavic J, Hayashizaki Y, Hume
DA: Mammalian RNA polymerase II core promoters:
insights from genome-wide studies. Nat Rev Genet 2007,
8:424-436.
23. Carninci P, Sandelin A, Lenhard B, Katayama S, Shimokawa K, Ponjavic
J, Semple CA, Taylor MS, Engstrom PG, Frith MC, Forrest AR, Alkema
WB, Tan SL, Plessy C, Kodzius R, Ravasi T, Kasukawa T, Fukuda S,
Kanamori-Katayama M, Kitazume Y, Kawaji H, Kai C, Nakamura M,
Konno H, Nakano K, Mottagui-Tabar S, Arner P, Chesi A, Gustincich
S, Persichetti F, et al.: Genome-wide analysis of mammalian
promoter architecture and evolution. Nat Genet 2006,
38:626-635.
24. Carninci P, Kasukawa T, Katayama S, Gough J, Frith MC, Maeda N,
Oyama R, Ravasi T, Lenhard B, Wells C, Kodzius R, Shimokawa K,
Bajic VB, Brenner SE, Batalov S, Forrest AR, Zavolan M, Davis MJ,
Wilming LG, Aidinis V, Allen JE, Ambesi-Impiombato A, Apweiler R,
Aturaliya RN, Bailey TL, Bansal M, Baxter L, Beisel KW, Bersano T,
Bono H, et al.: The transcriptional landscape of the mamma-
lian genome. Science 2005, 309:1559-1563.
25. Wallerman O, Motallebipour M, Enroth S, Patra K, Bysani MS,
Komorowski J, Wadelius C: Molecular interactions between
HNF4a, FOXA2 and GABP identified at regulatory DNA
elements through ChIP-sequencing.
Nucleic Acids Res 2009 in
press.
26. Rada-Iglesias A, Ameur A, Kapranov P, Enroth S, Komorowski J, Gin-
geras TR, Wadelius C: Whole-genome maps of USF1 and USF2
binding and histone H3 acetylation reveal new aspects of
promoter structure and candidate genes for common
human disorders. Genome Res 2008, 18:380-392.
27. Yuan X, Waterworth D, Perry JR, Lim N, Song K, Chambers JC,
Zhang W, Vollenweider P, Stirnadel H, Johnson T, Bergmann S, Beck-
mann ND, Li Y, Ferrucci L, Melzer D, Hernandez D, Singleton A, Scott
J, Elliott P, Waeber G, Cardon L, Frayling TM, Kooner JS, Mooser V:
Population-based genome-wide association studies reveal
six loci influencing plasma levels of liver enzymes. Am J Hum
Genet 2008, 83:520-528.
28. Sabatti C, Service SK, Hartikainen AL, Pouta A, Ripatti S, Brodsky J,
Jones CG, Zaitlen NA, Varilo T, Kaakinen M, Sovio U, Ruokonen A,
Laitinen J, Jakkula E, Coin L, Hoggart C, Collins A, Turunen H, Gabriel
S, Elliot P, McCarthy MI, Daly MJ, Jarvelin MR, Freimer NB, Peltonen
L: Genome-wide association analysis of metabolic traits in a
birth cohort from a founder population. Nat Genet 2009,
41:35-46.
29. Aulchenko YS, Ripatti S, Lindqvist I, Boomsma D, Heid IM, Pramstaller
PP, Penninx BW, Janssens AC, Wilson JF, Spector T, Martin NG, Ped-
ersen NL, Kyvik KO, Kaprio J, Hofman A, Freimer NB, Jarvelin MR,
Gyllensten U, Campbell H, Rudan I, Johansson A, Marroni F, Hayward
C, Vitart V, Jonasson I, Pattaro C, Wright A, Hastie N, Pichler I, Hicks
AA, et al.: Loci influencing lipid levels and coronary heart dis-
ease risk in 16 European population cohorts. Nat Genet 2009,
41:47-55.
30. Kathiresan S, Willer CJ, Peloso GM, Demissie S, Musunuru K, Schadt
EE, Kaplan L, Bennett D, Li Y, Tanaka T, Voight BF, Bonnycastle LL,
Jackson AU, Crawford G, Surti A, Guiducci C, Burtt NP, Parish S,
Clarke R, Zelenika D, Kubalanza KA, Morken MA, Scott LJ, Stringham
HM, Galan P, Swift AJ, Kuusisto J, Bergman RN, Sundvall J, Laakso M,
et al.: Common variants at 30 loci contribute to polygenic
dyslipidemia. Nat Genet 2009, 41:56-65.
31. Prokopenko I, Langenberg C, Florez JC, Saxena R, Soranzo N, Thor-
leifsson G, Loos RJ, Manning AK, Jackson AU, Aulchenko Y, Potter
SC, Erdos MR, Sanna S, Hottenga JJ, Wheeler E, Kaakinen M, Lyssenko
V, Chen WM, Ahmadi K, Beckmann JS, Bergman RN, Bochud M, Bon-
nycastle LL, Buchanan TA, Cao A, Cervino A, Coin L, Collins FS,
Crisponi L, de Geus EJ, et al.: Variants in MTNR1B influence fast-
ing glucose levels. Nat Genet 2009, 41:77-81.
32. Lyssenko V, Nagorny CL, Erdos MR, Wierup N, Jonsson A, Spegel P,
Bugliani M, Saxena R, Fex M, Pulizzi N, Isomaa B, Tuomi T, Nilsson P,
Kuusisto J, Tuomilehto J, Boehnke M, Altshuler D, Sundler F, Eriksson
JG, Jackson AU, Laakso M, Marchetti P, Watanabe RM, Mulder H,
Groop L:
Common variant in MTNR1B associated with
increased risk of type 2 diabetes and impaired early insulin
secretion. Nat Genet 2009, 41:82-88.
33. Meijsing SH, Pufall MA, So AY, Bates DL, Chen L, Yamamoto KR:
DNA binding site sequence directs glucocorticoid receptor
structure and activity. Science 2009, 324:407-410.
34. Barski A, Cuddapah S, Cui K, Roh TY, Schones DE, Wang Z, Wei G,
Chepelev I, Zhao K: High-resolution profiling of histone meth-
ylations in the human genome. Cell 2007, 129:823-837.
35. Bernstein BE, Mikkelsen TS, Xie X, Kamal M, Huebert DJ, Cuff J, Fry
B, Meissner A, Wernig M, Plath K, Jaenisch R, Wagschal A, Feil R, Sch-
reiber SL, Lander ES: A bivalent chromatin structure marks key
developmental genes in embryonic stem cells. Cell 2006,
125:315-326.
36. SOLiD™ Software Development Community [http://solid
softwaretools.com]
37. Robertson G, Hirst M, Bainbridge M, Bilenky M, Zhao Y, Zeng T,
Euskirchen G, Bernier B, Varhol R, Delaney A, Thiessen N, Griffith
OL, He A, Marra M, Snyder M, Jones S: Genome-wide profiles of
STAT1 DNA association using chromatin immunoprecipita-
tion and massively parallel sequencing. Nat Methods 2007,
4:651-657.
38. Jothi R, Cuddapah S, Barski A, Cui K, Zhao K: Genome-wide iden-
tification of in vivo protein-DNA binding sites from ChIP-Seq
data. Nucleic Acids Res 2008, 36:5221-5231.
39. Valouev A, Johnson DS, Sundquist A, Medina C, Anton E, Batzoglou
S, Myers RM, Sidow A: Genome-wide analysis of transcription
factor binding sites based on ChIP-Seq data. Nat Methods
2008, 5:829-834.
40. UCSC Genome Browser []
41. FANTOM3 []
42. DAVID Bioinformatics Resources 2008 [http://
Genome Biology 2009, Volume 10, Issue 11, Article R129 Motallebipour et al. R129.16
Genome Biology 2009, 10:R129
david.abcc.ncifcrf.gov]
43. Gene Expression Omnibus [ />44. Dannenberg LO, Edenberg HJ: Epigenetics of gene expression in
human hepatoma cells: expression profiling the response to
inhibition of DNA methylation and histone deacetylation.
BMC Genomics 2006, 7:181.
45. European Read Archive [ />