Báo cáo y học: "Mining for coexpression across hundreds of datasets using novel rank aggregation and visualization methods" pptx
Bạn đang xem bản rút gọn của tài liệu. Xem và tải ngay bản đầy đủ của tài liệu tại đây (1.17 MB, 11 trang )
Genome Biology 2009, 10:R139
Open Access
2009Adleret al.Volume 10, Issue 12, Article R139
Software
Mining for coexpression across hundreds of datasets using novel
rank aggregation and visualization methods
Priit Adler
¤
*
, Raivo Kolde
¤
†‡
, Meelis Kull
†‡
, Aleksandr Tkachenko
†‡
,
Hedi Peterson
*‡
, Jüri Reimand
†
and Jaak Vilo
†‡
Addresses:
*
Institute of Molecular and Cell Biology, Riia 23, 51010 Tartu, Estonia.
†
Institute of Computer Science, University of Tartu, Liivi 2-
314, 50409 Tartu, Estonia.
‡
Quretec, Ülikooli 6a, 51003 Tartu, Estonia.
¤ These authors contributed equally to this work.
Correspondence: Jaak Vilo. Email:
© 2009 Adler et al.; licensee BioMed Central Ltd.
This is an open access article distributed under the terms of the Creative Commons Attribution License ( which
permits unrestricted use, distribution, and reproduction in any medium, provided the original work is properly cited.
Multiple-experiment matrix<p>The MEM web resource allows users to search for co-expressed genes across all microarray datasets in the ArrayExpress database.</p>
Abstract
We present a web resource MEM (Multi-Experiment Matrix) for gene expression similarity
searches across many datasets. MEM features large collections of microarray datasets and utilizes
rank aggregation to merge information from different datasets into a single global ordering with
simultaneous statistical significance estimation. Unique features of MEM include automatic
detection, characterization and visualization of datasets that includes the strongest coexpression
patterns. MEM is freely available at />Rationale
During the last decade, the gene expression microarrays have
become a standard tool in studying a large variety of biologi-
cal questions [1]. Beginning from the first experiments [2],
microarrays have been used for pinpointing disease-specific
genes and drug targets [3,4], uncovering signaling networks
[5], describing cellular processes [6], among many other
applications. While the methods for single experiment analy-
sis are well established and popular [7], it is clear that infor-
mation extracted from a single experiment is constrained by
details of experimental design such as conditions and cell
types. Integrating data from different experiments widens the
spectrum of biological conditions and increases the power to
find subtler effects.
Coexpression is one of the central ideas in gene expression
analysis. The 'Guilt by association' principle states that gene
coexpression might indicate shared regulatory mechanisms
and roles in related biological processes. The validity of the
principle is proved in several studies, see for example [8-10].
The idea can be applied in many tasks of computational biol-
ogy, such as inferring functions to poorly characterized genes
[9,11,12], discovering new putative members for metabolic
pathways [12], or predicting and validating of protein-protein
interactions [13,14]. Many de novo regulatory motif discovery
methods use gene expression similarity information as a pri-
mary input for identifying co-regulated genes [15,16]. More
recently, gene expression similarity search has been utilized
in a pathway reconstruction study [17].
Multi-experiment coexpression analysis can be a labour-
intensive and computationally challenging task. First steps
involve collecting suitable datasets, data downloads, preproc-
essing, normalization, and gene annotation management.
Then, methodological and technical questions arise, namely
the integration of different datasets, merging cross-platform
Published: 4 December 2009
Genome Biology 2009, 10:R139 (doi:10.1186/gb-2009-10-12-r139)
Received: 13 August 2009
Revised: 25 October 2009
Accepted: 4 December 2009
The electronic version of this article is the complete one and can be
found online at /> Genome Biology 2009, Volume 10, Issue 12, Article R139 Adler et al. R139.2
Genome Biology 2009, 10:R139
data, and handling ambiguous mappings between genes and
probesets. Finally, the sheer size of targeted data requires
efficient computational strategies or caching of pre-calcu-
lated results. The complexity of multi-experiment microarray
analysis is likely its main limitation, as researchers often lack
the time and resource to take on such a task. Consequently,
there is a clear need for services that provide coexpression
information in an easy and accessible format.
Surprisingly, the resources and tools for finding genes with
similar expression profiles in multiple experiments are still
rather scarce.
Microarray databases ArrayExpress [18] and Gene Expres-
sion Omnibus (GEO) [19] have implemented a data mining
layer for finding and analyzing most relevant datasets, but
neither yet provides a comprehensive gene coexpression
search over many datasets simultaneously. Gemma is a web
based resource that utilizes a global inference strategy to
detect genes that have similar expression profiles in all cov-
ered datasets [20]. However, global coexpression analysis is
likely to miss similarities that occur in a tissue or condition
specific manner [21]. SPELL is a resource that puts a strong
emphasis on selecting the appropriate datasets for the query
[22]. The method identifies the subset of most relevant data-
sets by analyzing the coexpression of a user-defined list of
genes, and uses the subset to find additional genes. Unfortu-
nately, detecting relevant datasets relies on the user's knowl-
edge of genes that are likely to have similar expression
profiles. Furthermore, it currently features relatively small
number of datasets, all of them describing yeast.
We have developed the query engine MEM that detects coex-
pressed genes in large platform-specific microarray collec-
tions. The Affymetrix microarray data originates from
ArrayExpress and also includes datasets submitted to GEO
and automatically uploaded to ArrayExpress. MEM encom-
passes a variety of conditions, tissues and disease states and
incorporates nearly a thousand datasets for both human and
mouse, as well as hundreds of datasets for other model
organisms.
MEM coexpression search requires two types of input: first,
the user types in a gene ID of interest, and second, chooses a
collection of relevant datasets. The user may pick the datasets
manually by browsing their annotations, or allow MEM to
make an automatic selection based on statistical criteria such
as gene variability. MEM performs the coexpression analysis
individually for each dataset and assembles the final list of
similar genes using a novel statistical rank aggregation algo-
rithm. Efficient programming guarantees rapid performance
of the computationally intensive real-time analysis that does
not rely on precomputed or indexed data. The results are pre-
sented in highly interactive graphical format with strong
emphasis on further data mining. Query results and datasets
can be ordered by significance or clustered. The MEM visual-
ization method helps highlights datasets with highest coex-
pression to input gene and helps the user distinguish
evidence with poor or negative correlation. Datasets are addi-
tionally characterized with automatic text analysis of experi-
ment descriptions, and represented as word clouds that
highlight predominant terms. With MEM we aim to make
multi-experiment coexpression analysis accessible to a wider
community of researchers.
MEM web interface
Input
Primary input
The primary input of MEM is a single query gene that acts as
the template pattern for the coexpression search. The tool
recognizes common gene identifiers and automatically
retrieves corresponding probesets, the conversion is based on
g: Profiler [23] and Ensembl [24] ID mappings. When several
probesets link to a gene, the user needs to choose one of the
probesets for further analysis.
Second, the user needs to select the collection of datasets
where similarities between expression profiles are detected
(the search space). ArrayExpress datasets are organized into
platform-specific collections and the user may choose per-
form the search over all datasets of a specific platform. The
search space may be further narrowed by browsing dataset
annotations and composing a collection that covers a specific
disease or tissue type.
Dataset selection
In multi-experiment coexpression analysis, some individual
datasets may produce noisy or even entirely random results
that are either caused by poor data quality or low expression
levels of the query gene. The quality of the analysis can be
improved considerably by eliminating the datasets that create
a noise bias for the query gene. Low dataset-wide variability
of expression levels is one of the key indicators of spurious
results. Minute changes in gene expression are often caused
by experimental noise rather than cellular mechanics. There-
fore, corresponding similarity searches are likely to be less
informative about gene function.
We have included a standard deviation filter in the MEM
interface that allows the users to detect and disregard data-
sets where the variability of the query gene is low. Based on
extensive simulations detailed in the Methods section, we
conclude that the standard deviation
σ
= 0.29 is a reasonable
threshold for distinguishing informative datasets. The above
filter holds for the entire analysis since all related datasets are
normalized and preprocessed using the same algorithm.
Search algorithm parameters
The first step of MEM multi-experiment coexpression analy-
sis detects the most similar candidate genes for each individ-
ual dataset. The most important parameter for this stage is
Genome Biology 2009, Volume 10, Issue 12, Article R139 Adler et al. R139.3
Genome Biology 2009, 10:R139
the distance measure that defines the similarity between
expression profiles and has a significant impact on the con-
tents and interpretation of results. Pearson correlation is the
default distance measure in MEM. It evaluates the dynamic
similarity of expression profiles and has become a standard
method of measuring coexpression [25]. Another useful
measure is the anti-correlation distance that detects inverse
expression patterns, such as genes responding to repressor
activity. For example, anti-correlation queries have been used
to validate predicted micro RNA targets [26]. Absolute corre-
lation distance is a combination of the above measures, as it
detects both direct and inverse similarity.
After detecting the most similar genes in individual datasets,
we apply a novel rank aggregation algorithm that merges can-
didates of different datasets and creates the final list of coex-
pressed genes. The rank aggregation algorithm assigns a P-
value to each gene, in order to evaluate its similarity to the
query gene across the given collection of datasets. Statisti-
cally, the P-value reflects the likelihood of the gene appearing
with certain observed ranks in the datasets if the similarity
lists were shuffled randomly. Selecting the expression profiles
with most significant P-values accurately retrieves genes with
high expression similarity and functional relevance to the
query gene (Figure 1).
Output
The principal output of MEM is a ranked list of genes that are
coexpressed with the query gene in the provided datasets. For
each resulting gene, MEM provides a P-value that reflects the
significance of its expression similarity to the query gene
across the collection on analyzed datasets. A wealth of inter-
esting information is presented in the graphical rank matrix
(Figure 1). Each column of the matrix stands for a dataset,
each row represents a gene, and each matrix element reflects
the individual similarity rank for the given gene in the given
dataset. Visual inspection of the rank matrix allows the
researcher to detect patterns of correlation across datasets
and spot significantly stronger coexpression profiles. The
rank aggregation algorithm provides a natural cutoff between
informative and non-informative ranks for each gene. Colors
and cell size is used to highlight datasets where the given gene
was particularly similar to the query gene and hence contrib-
uted significantly to the final P-value.
Genes with the greatest similarity rankings are frequently in
strong correlation only within a relatively small fraction of
datasets that are biologically relevant to gene function. If the
contributing datasets can be related in the context of experi-
mental design, one may learn additional information about
the query gene and its association to the resulting genes. Col-
umns of the rank matrix are clustered hierarchically, so that
datasets with similar correlation patterns are grouped
together using a tree visualization, and datasets with most
impact are aligned to the left. While the default policy is to fil-
ter datasets based on the standard deviation criterion, one
may take advantage of the high contribution of few datasets
and manually remove experiments that have little impact on
the final list of correlated genes. Single clicks on datasets or
tree nodes toggle whether selected experiments or entire
experiment groups are regarded in downstream analysis.
A text mining technique called word cloud gives a compact
semantic overview of a selected group of datasets through the
descriptions of experimental designs. The word cloud detects
keywords that are enriched in the experimental descriptions
of the group, and uses different font sizes to highlight terms
with strong statistical significance. One may study the exper-
iment descriptions of single datasets and dataset clusters by
moving the mouse over the dataset clustering tree.
Additional features of the tool reveal finer details of underly-
ing data and create multiple pointers for further analysis.
Besides coexpression associations in the rank matrix, MEM
also displays standard heat maps with expression profiles and
experimental details of individual datasets. The heat maps
provide an easy visual validation of detected coexpression
patterns. MEM includes filters that constrain the output to
certain genes and allow the researcher to seek answers to
interesting problems. For instance, one may study the associ-
ation of the query gene in relation to a certain pathway or bio-
logical process, by comparing the expression patterns of its
members. The URLMap feature provides easy access to exter-
nal resources, as it automatically links resulting genes to mul-
tiple genomic databases [27]. Coexpressed genes can be
directed to the g: Profiler toolset for functional enrichment
analysis of Gene Ontology terms, pathways and cis-regulatory
motifs [23].
Case studies
MEM query with embryonic stem cell regulator
NANOG retrieves ES cells related genes and datasets
The homeobox transcription factor NANOG is a key regulator
of differentiation and pluripotency maintenance in mamma-
lian embryonic stem cells [28,29]. NANOG forms a complex
circuitry together with the factors OCT4 and SOX2 and is
involved in the combinatorial regulation of a range of down-
stream developmental processes.
We demonstrate the power of the MEM toolset by analyzing
the genes that show strong coexpression patterns with
NANOG across multiple datasets (see Figure 1). We chose a
collection of 487 mouse datasets of the Affymetrix 430-2 plat-
form, as the platform includes the largest amount of ES cells
related experiments. After applying the default standard devi-
ation filter (
σ
= 0.29), MEM automatically removed 419 data-
sets where the expression level of NANOG was insufficient for
coexpression analysis. As the role of NANOG role is believed
to be restricted to embryonic stem cells only, datasets cover-
ing other tissues and conditions are expectedly uninformative
and provide no results of statistical significance (data not
Genome Biology 2009, Volume 10, Issue 12, Article R139 Adler et al. R139.4
Genome Biology 2009, 10:R139
shown). On the other hand, datasets considered relevant by
MEM appear to be related to the role of NANOG. Keyword
analysis of experimental annotations reveals enriched terms
like 'embryonic', 'pluripotent', 'stem cell' and so on (see word
cloud, Figure 1a).
In response to the NANOG query, MEM retrieves a list of
coexpressed genes that appear to be functionally related to
embryonic stem cells. Enrichment analysis with top 50
probesets reveals important functional terms from Gene
Ontology (for example, stem cell development P < 10
-12
and
regulation of transcription P < 10
-6
). The top list includes key
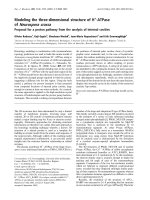
MEM user interface and results for the transcription factor NANOGFigure 1
MEM user interface and results for the transcription factor NANOG. The top of the page contains controls for the query: gene input field, dataset selection
and advanced options. Bottom of the page shows the results of the query. The genes, which are displayed as rows, are ordered by multi-experiment
similarity to the query gene. Additionally, the single experiment similarity ranks are displayed as a matrix of colored squares, where red and blue denote
small and large ranks, respectively. The larger squares indicate the ranks that contributed to the final P-value. Each element corresponds to a experiment
and the columns are clustered. Hovering over the results brings up context specific information: (a) word cloud that characterizes the corresponding
experiments; (b) single dataset annotations; (c) gene names with short descriptions. The row of links above the results facilitates the further analysis of
results. For example, the user can visualize the expression of selected datasets (marked with green ticks) as a heat map (d).
!"#$
%
&"'(
')
*
+,-
.
/
.
0
1
%
2
3
4
-
4
4
5
-
5
6
/
7
8
9
1
8
0
:
9
-
9
9
;
<
-
8
9
1
8
0
:
9
5
9
9
%
3
%
%
5
8
9
1
8
0
:
9
4
9
9
4
<
2
8
9
1
8
0
:
9
%
9
9
*
%%
3
2
;
8
9
=
9
9
8
>
?
9
%
9
9
<
%
%
%
5
%
%
8
9
1
8
0
:
9
;
9
9
;
5
4
8
9
1
8
0
:
9
5
9
9
*
3
2
8
9
7
9
9
/
@
=
9
-
9
9
;
-
8
9
1
8
0
:
9
A
9
9
*
;
4
8
9
1
8
0
:
9
%
9
9
*
%
%
5
A
%
8
9
1
8
0
:
9
;
99
4
-
-
8
9
=
9
9
8
>
?
9
%
9
9
-
%
%
A
<
8
9
1
8
0
:
9
%
9
9
*
%%
5
*
;
8
9
1
8
0
:
9
4
9
9
<
;
-
8
9
1
8
0
:
9
%
9
9
*
%%
3
%
*
%
%
8
9
1
8
0
:
9
<
9
9
;
A
%
8
9
1
8
0
:
9
2
9
9
4
-
;
8
9
1
8
0
:
9
<
9
9
4
A
;
8
9
1
8
0
:
9
2
9
9
-
*
5
8
9
1
8
0
:
9
-
9
9
2
;
-
8
9
1
8
0
:
9
4
9
9
2
2
-
8
9
=
9
9
8
>
?
9
2
9
9
<
2
8
9
1
8
0
:
9
%
9
9
%
%
%
%
%
%
3
%
%
5
8
9
1
8
0
:
9
;
9
9
5
5
3
8
9
1
8
0
:
9
4
9
9
A
;
*
8
9
1
8
0
:
9
%
9
9
*
%%
4
%
3
%
%
8
9
1
8
0
:
9
;
99
5
5
%
8
9
1
8
0
:
9
A
9
9
3
A
<
8
9
1
8
0
:
9
;
99
*
A
5
8
9
1
8
0
:
9
2
9
9
A
5
;
8
9
1
8
0
:
9
%
99
-
%
%
2 2
-
8
9
1
8
0
:
9
%
99
%
%%
*
%
%
<
;
8
9
1
8
0
:
9
%
9
9
*
%%
-
2
-
8
9
1
8
0
:
9
%
9
9
*
%%
A
;
<
8
9
1
8
0
:
9
%
9
9
*
%%
3
%
2
%
%
8
9
1
8
0
:
9
-
9
9
<
<
2
8
9
1
8
0
:
9
<
9
9
3
2
<
8
9
1
8
0
:
9
%
9
9
%
%
%
%
%
%
;
%%
<
8
9
1
8
0
:
9
2
9
9
*
<
%
8
9
1
8
0
:
9
<
9
9
-
-
5
8
9
=
9
9
8
>
?
9
%
9
9
%
%%
-
%
%
A
8
9
=
9
9
8
>
?
9
%
9
9
<
%
%
%
%
%
%
8
9
1
8
0
:
9
4
9
9
5
%
3
%
%
8
9
1
8
0
:
9
%
9
9
-
%
%
-
*
;
8
9
1
8
0
:
9
<
9
9
3
4
5
8
9
1
8
0
:
9
4
9
9
;
3
4
8
9
1
8
0
:
9
%
9
9
*
%
%
3
%
;
%
%
8
9
1
8
0
:
9
%
9
9
%
%
%
-
%
%
2
-
8
9
1
8
0
:
9
A
9
9
A
;
A
8
9
1
8
0
:
9
%
9
9
-
%
%
%
*
%
%
2
8
9
1
8
0
:
9
2
99
-
*
A
8
9
1
8
0
:
9
%
9
9
%
%
%
-
%
%
<
5
8
9
1
8
0
:
9
%
9
9
-
%
%
2
3
%
8
9
1
8
0
:
9
%
9
9
2
%
%
-
<
8
9
1
8
0
:
9
A
99
3
3
<
8
9
1
8
0
:
9
A
99
-
*
4
8
9
1
8
0
:
9
4
9
9
*
2
2
8
9
7
9
9
/
@
=
9
2
9
9
%
%
%
%
8
9
1
8
0
:
9
%
9
9
%
%
%
%
%
%
;
%%
%
8
9
1
8
0
:
9
4
9
9
3 2
A
8
9
1
8
0
:
9
%
9
9
3
%
%
;
4
2
8
9
1
8
0
:
9
%
9
9
%
%
%
*
%
%
2
*
8
9
=
9
9
B
=
B
B
C
9
2
9
9
3
8
9
1
8
0
:
9
%
9
3
<
?
0
D
0
<
E
%
2
F
;
5
;
;
G
9
3
;
%
2
%
A
4
2
4
4
<
6
"
(
H
E
?
2
3
;
F
3
4
G
4
4
9
3
<
%
2
%
5
-;
3
;
;
6
"
(
I
%
2
<
A
-
%
-
-
2
6
"
(
J
3
F
3
-
G
-
-
9
3
2
%
2
<
A
-
%
2
6
"
(
:
?
?
/
3
3
F
55
G
9
3
2
%
2
<
-
3
-
3
-
6
-
-
'
6
"
(
:
?
?
/
<
/
3
F
*
2
*
*
G
9
3
3
%
2
%
;
<<
;
;
3
6
"
(
H
B
K
-
K
K
%
F
55
G
9
3
%
%
2
3
-
2
-
3
2
6
"
(
L
0
L
L
>
0
0
3
5
F
<
A
G
9
3
%
%
2
%
;
4
;
;
;
4
4
A
;
;
6
"
(
:
?
?
/
2
3
F
*
3
*
*
G
9
3
*
%
2
3
4
<
4
4
4
A
4
4
6
"
(
7
:
M
-
F
<
<
G
9
3
*
%
2
2
4
*
44
;
*
*
2
;
;
6
"
(
8
1
2
-
<
-
-
4
A
4
4
*
2
F
2
-
G
-
-
9
%
4
%
2
2
-
5
-
4
3
4
4
6
"
(
E
/
L
4
F
4
4
2
-
G
9
%
4
%
2
<
2
4*
2
*
*
6
"
(
:
?
?
/
-
%
F
<
2
G
9
%
5
%
2
3
2
3
4
<
4
4
6
"
(
E
/
L
%
F
;
3
;;
G
9
%
5
%
2
-
2
-
3
5
*
6
*
*
"
(
:
?
?
/
3
3
F
%
A
G
9
%
5
%
2
3
4
;
44
<
;
;
2
6
"
(
1
:
E
-
%
F
*-
G
-
-
9
%
A
%
2
2
4
3
44
5
5
6
"
(
=
0
C
00
K
%
K
K
%
F
<
2
G
9
%A
%
2
%
4
2
44
%
5
6
"
6
"
(
E
/
L
3
F
5
-
G
9
%
A
%
2
-
2
-
3
A
4
6
4
4
"
(
0
7
0
0
7
=
D
L
1
**
F
F
-
F
;
%
;
;
G
9
%
A
%
2
-
5
-
3
-
A
-
6
"
(
H
B
K
-
K
K
-
F
4
3
4
4
G
9
%
A
%
2
-
5
-
A
-
A
-
6
"
(
D
7
E
%
2
F
3
3
G
9
%
A
%
2
%
;
5
;
;
44
6
44
"
(
7
K
E
/
?
3
K
;
F
3
3
G
9
%
A
%
2
-;-4
3
44
6
'
6
"
(
L
/
LL
N
N
%
A
G
9
%
A
%
2
-
A
-
4
5
4
4
-
6
-
-
"
(
?
C
:
=
%
2
%
F
3
4
G
4
4
9
%
;
%
2
2
2
-4*
6
**
"
(
7
:
1
E
%
%
F
<5
G
9
%
;
%
2
<
*4
5
4
4
4
6
44
"
(
L
N
K
A
K
K
/
-
3
F
5
G
9
%
;
%
2
%
A
*
3
*
*
3
6
"
(
E
@
>
0
%
0
0
<
2
F
<
;
G
;;
9
%
;
%
2
3
A
3
-
5
-
6
"
(
=
=
D
9
=
BC
9
3
F
F
<
F
*
A
*
G
9
%
;
%
2
2
2
3
4
3
44
6
"
(
H
L
K
/
K
K
.
%
*
%
F
-
5
-
G
9
%
<
%
2
-
5
-
A
5
A
6
"
(
7
C
B
=
;
%
F
A
2
G
9
%
<
%
2
3
2
2
2
5
6
"
(
N
B
?
M
3
F
;;
G
;;
9
%
<
%
2
<
A
*
3
*
*
;
6
;
;
"
(
C
.
E
%
A
-
F
2
;
G
;
;
9
%
<
%
2
-
55
-
3
*
6
*
*
"
(
?
K
L
O
L
L
%
.
;
F
4
A
4
4
G
9
%
<
%
2
<
;
<
;
;
%
%
6
P
6
"
(
E
1
E
2
A
F
5<
G
9
%
<
%
2
3
*
*
*
*
5
*
<
6
"
(
.
0
:
0
0
/
N
5
F
2
;
G
;
;
9
%
<
%
2
3
3
*
<
*
5
6
"
(
?
M
E
%
A
%
F
%
2
G
9
%
2
%
2
3
;
A
;
;
<
3
6
"
(
8
L
C
L
L
C
@
%
F
3
3
G
9
%
2
%
2
-;4
3
4
4
;
6
;
;
"
(
N
CC
K
-
K
K
2
-
%
F
<
;
G
;
;
9
%
2
%
2
3
4
-
4
4
;;
-
6
;
;
"
(
E
/
L
%
F
4
%
4
4
G
9
%
2
%
2
-
2
-
3
A
5
6
"
(
:
=
C
7
%
-
F
;-
G
-
-
9
%
2
%
2
3
-
<5
3
6
"
(
7
K
E
/
?
3
K
-
F
A
2
G
9
%
2
%
2
%
5
%
2A
6
"
(
7
1
B
E
%
2
F
A
-
G
9
%
2
%
2
3
3
3
5
;
6
;
;
"
6
"
(
3
2
%
*
*
*
*
*-
*
*
Q
-
-
*
F
F
<
F
%%
G
9
%
2
%
2
3
4
A
44
*
%
*
*
6
"
(
E
1
E
2
5
F
%
5
G
9
%
2
%
2
3
*
*
*
*
5
*
;
6
;
;
P
6
"
(
:
.
:
%
4
F
4
4
3
%
G
9
%
2
%
2
<
<
-
;
-
A
;;
6
"
(
I
%
2
-4*;
<
;
;
6
P
6
"
(
J
4
F
4
4
A
G
9
%
2
%
2
-4*;
<
;
;
6
P
6
"
(
H
=
R
=
%
%
F
;
5
;;
G
9
%
-
%
2
3
5
*
<
*
3
6
"
6
"
(
8
1
;
<
;;
-
*
%
*
*
;
3
F
-
3
-
G
9
%
-
%
2
<
;
3
;;
2
3
6
"
(
:
.
=
7
-
N
3
F
2
;
G
;
;
9
%
-
%
2
3
<
*-
<
-
-
6
'
6
"
(
7
K
N
%
3F
<
;
G
;
;
9
%
-
%
2
3
3
2
<5
6
"
(
H
B
B
K
<
3
3
F
;
;
<
;
;
G
G
9
9
%
%
-
%
2
<
;
%
;
;
2
*
6
**
"
(
| Help | Intro |
MEM - Multi Experiment Matrix
Enter gene ID(s)
nanog
(for example: Jun, 203325_s_at, ENSG00000204531, ) [?]
1 NANOG 1.1
1429388_AT (NANOG) Homeobox protein NANOG (Homeobox transcription factor Nanog) (Early embryo specific expression NK-type homeobox protein) (ES cell- associate
d
Select collection
A ymetrix GeneChip® Mouse Genome 430 2.0 [Mouse430_2] (487 datasets)
[?]
Submit query
Options: Similarity Output Gene filters Dataset filters
[?] | GO annotations | ExpressView | URLMap link | Static URL | Query details |
Results
Handpicked datasets :
: : : : reset all | 419 datasets excluded by filters
(b)
(a)
(c)
(d)
(b)
(c)
(a)
(d)
Genome Biology 2009, Volume 10, Issue 12, Article R139 Adler et al. R139.5
Genome Biology 2009, 10:R139
transcription factors OCT4 (position 1) and SOX2 (position 7)
as well as other genes with known roles in stem cell regulation
and maintenance of pluripotency. For instance, UTF1 is a ES
cell specific transcriptional coactivator [30], while DPPA2/3/
4/5A are nuclear factors with a role in regulating pluripotency
[31]. NODAL is a member of the TGF-beta superfamily whose
signaling is required for maintaining pluripotency in human
embryonic stem cells [32]. Signaling of TDGF (Cripto) in a
NODAL-dependent manner directs the differentiation and
fate determination of ES cells [33]. TGF3 is another growth
factor that has been shown to involve in the patterning of the
anterior-posterior axis and exhibit signaling similar to
NODAL [34].
In a previous study, Sharov et al. inferred direct targets of
NANOG by computational integration of gene expression and
chromatin immunoprecipitation data [35]. 14 of the 281 tar-
gets of the above study are also detected by MEM among top-
50 most significant genes (P < 10
-13
). To put this result into
context, we performed a similarity search in each of the 487
datasets individually, and found that each dataset yielded a
smaller number of targets than the composite MEM query
(Figure 2). To show the utility of the standard deviation based
filter, we highlighted the datasets that passed the filter. Only
20 out of 487 datasets had overlap larger then 4 and only two
of them did not pass the standard deviation filter, confirming
the accuracy of the filter in selecting relevant datasets.
Analysis of MEM coexpression network reveals
functional modules of cell cycle, proteasome and the
immune system
Coexpression information can be used to reconstruct biologi-
cal networks and regulatory pathways [36-38]. In such a net-
work, genes act as network nodes, that are associated via
edges if their expression patterns are in strong correlation.
Coexpression networks have been shown to contain densely
connected modules that include genes of related function
[10].
We used MEM to build a coexpression network of the mouse
genome, using a collection of 89 datasets (Additional file 1) of
the Affymetrix U74Av2 platform as the search space. In the
first stage, we retrieved the list of coexpressed genes for every
mouse gene, and constructed the network by connecting gene
pairs where both genes of the pair had significant MEM sim-
ilarity scores with one another. After applying a Bonferroni
multiple testing correction, we ended up with a dense net-
work with 115664 edges between 5440 genes with statistical
significance below 0.001. In the second stage, we applied the
Markov Cluster (MCL) algorithm [39] via the GraphWeb tool
[40] to prune the network and find gene modules. The MCL
algorithm simulates a stochastic flow in the expression graph
and removes edges that are visited infrequently, resulting in a
collection of densely connected groups of genes. In the third
stage, we assessed the functional relevance of detected mod-
ules with GraphWeb, by finding significantly enriched Gene
Ontology terms (GO), Kyoto Encyclopedia of Genes and
Genomes (KEGG) and Reactome biological pathways, and
cis-regulatory motifs.
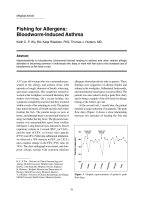
NANOG targets among first 50 MEM resultsFigure 2
NANOG targets among first 50 MEM results. MEM query with transcription factor NANOG retrieves more of its targets among top 50 genes, than queries
on any one dataset individually. Each point represents the overlap between NANOG targets and top 50 query results in one of the 487 datasets. The
datasets are sorted by variation and the ones that pass standard deviation filter are highlighted. Most of the datasets that retrieve high number of NANOG
targets pass the filter, which shows the specificity of the filter.
NANOG targets in MEM query results
Datasets sorted by variation of NANOG
Number of NANOG targets in top 50
0
2
4
6
8
10
12
14
100 200 300 400
Standard deviation
filter
passed (sd > 0.29)
not passed
Targets in MEM results
Genome Biology 2009, Volume 10, Issue 12, Article R139 Adler et al. R139.6
Genome Biology 2009, 10:R139
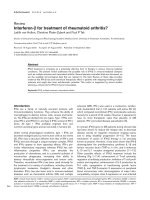
The size, density and functional descriptions of the six largest
modules can be seen on Figure 3a. All have strong and clear
functional annotations, that is, proteasome (KEGG, P < 10
-11
),
mitochondria (GO, P < 10
-146
), cell cycle (GO, P < 10
-50
), bio-
logical adhesion (GO, P < 10
-18
), immune system process (GO,
P < 10
-21
) and protein transport (GO, P < 10
-5
). Several
smaller modules with interesting functional annotations are
also detected, for instance one related to T-cell generation
(Figure 3b, P < 10
-12
) and one related to regulation of heart
contraction (Figure 3c, P < 10
-7
).
MCM complex of DNA replication initiation shows
consistent expression patterns with ORC, GMNN and
CDC6L/45L
Stable protein complexes are made up of several physically
interacting proteins. In order to keep essential complexes
intact, corresponding subunits need to have consistent
expression patterns across many diverse conditions and tis-
sues. Hence, a MEM query with a selected complex subunit
should retrieve the remaining complex subunits with high
ranks. Queries with different subunits are expected to retrieve
similar lists of well-correlated genes whose functional role is
related to that of the complex in question. In order to validate
MEM performance on protein complexes, we studied the
Functional descriptions of the modules found in the mouse coexpression network constructed with MEMFigure 3
Functional descriptions of the modules found in the mouse coexpression network constructed with MEM. Annotations of the six largest modules are
shown in (a). Two smaller modules are shown in the Figure, along with their functional annotations in (b) and (c).
CD28
TCF7
ZAP70
TRAC
CD8B1
ITK
LCK
TXK
CD3G
CD3E
TRBC1
CD3D
SH2D2A
CD8A
CD6
LTB
CD5
CD2
CD27
CHRNG
MYOG
MYH3
ANKRD1
RRAD
CHRNA1
TNNT2
MYL4
MYH6
NPPA
MYL7
TNNI3
RYR2
SLC8A1
# 1 978 41189 8.60%
4.90E-29 GO:BP biopolymer metabolic process
1.03E-71 GO:CC intracellular part
5.08E-21 GO:MF protein binding
6.44E-12 KEGG Proteasome
3.86E-10 REACTOME Formation of Exon Junction
# 2 291 4512 10.70%
1.68E-19 GO:BP cofactor metabolic process
2.72E-147 GO:CC mitochondrion
1.60E-22 GO:MF oxidoreductase activity
9.57E-30 KEGG Oxidative phosphorylation
1.46E-16 REACTOME Electron Transport Chain
# 3 246 3052 10.10%
3.30E-19 GO:BP biological adhesion
4.94E-30 GO:CC proteinaceous extracellular
1.11E-18 GO:MF extracellular matrix structural
1.92E-14 KEGG Focal adhesion
4.02E-08 REACTOME Hemostasis
# 4 145 3008 28.80%
6.53E-51 GO:BP cell cycle
1.38E-42 GO:CC nucleus
8.46E-13 GO:MF DNA binding
4.69E-25 KEGG Cell cycle
7.76E-28 REACTOME Cell Cycle, Mitotic
# 5 114 1437 22.30%
1.29E-22 GO:BP immune system process
1.76E-08 GO:CC lytic vacuole
6.78E-07 GO:MF cytokine binding
1.07E-05 KEGG B cell receptor signaling pathway
1.46E-08 REACTOME Signaling in Immune system
# 20 19 56 32.70%
1.29E-13
GO:BP T cell differentiation
3.30E-11
GO:CC external side of plasma membrane
3.72E-08
GO:MF non-membrane spanning protein
2.19E-11
KEGG T cell receptor signaling pathway
1.77E-09
REACTOME TCR complex interacts with
# 24 14 25 27.50%
1.85E-08
GO:BP regulation of heart contraction
9.49E-10
GO:CC sarcomere
1.23E-06
GO:MF calmodulin binding
3.08E-04
KEGG Tight junction
# 6 97 511 11%
3.07E-06 GO:BP
protein transport
3.32E-08
GO:CC cytoplasm
3.71E-09
GO:MF binding
(a) (b)
(c)
Genome Biology 2009, Volume 10, Issue 12, Article R139 Adler et al. R139.7
Genome Biology 2009, 10:R139
expression patterns of the essential MCM (Mini Chromosome
Maintenance) complex that is conserved in eukaryotes from
yeast to human. MCM is involved in the regulation of DNA
replication during cell cycle, a complex multistep process that
involves the cooperation of a number of proteins [41]. MCM
is a helicase of six subunits (MCM2-MCM7) that forms the
Pre-Replicative Complex (preRC) together with the Origin
Recognition Complex (ORC1-ORC6) and cell division cycle
proteins (CDC6, CDC45) [42]. The preRC binds to the origins
of recognition on the DNA and initiates replication during the
G1 phase of the cell cycle. The MCM complex acts as the
licensing factor of replication, ensuring that DNA is synthe-
sized only once per cell cycle [43]. Besides initializing DNA
replication, MCM also has a later role during DNA synthesis
in strand elongation. The presence of the complex appears to
be correlated with cell proliferation and suggests roles in can-
cer [44-46].
We composed a compendium of 145 cancer-related microar-
ray datasets (Additional file 2) of the human Affymetrix
U133A platform from ArrayExpress to analyze the expression
profiles of MCM complex subunits MCM2-MCM7. For each of
the MCM subunits, we used MEM to retrieve a ranked list of
100 probesets with most correlation relative to the subunit,
referred to its cohort. In case of multiple probesets corre-
sponding to a subunit, we picked the probeset whose cohort
contained most cell cycle related genes. We excluded MCM7,
as the corresponding probeset also maps to several unrelated
genes.
The subunits of the MCM complex have extremely consistent
expression profiles across the compendium of cancer-related
datasets. Among the cohorts of MCM subunits, other MCM
probesets are always delivered with a high rank (median rank
17.5). The MCM cohorts are generally very similar, as on aver-
age, a pair of MCM subunits shares 65 probesets of the 100-
element cohorts and the six 100-probeset cohorts contain a
total of 116 probesets that occur in more than two cohorts
(Additional file 3). These overlaps are very unlikely to occur
by random chance, as even the protein pair with least com-
mon probesets has a highly significant P-value (MCM5 and
MCM6, 47 common probesets, P < 10
-87
).
MEM coexpression patterns are functionally well reflected in
the cohorts. The probesets have strong enrichments that are
related to the role of the MCM complex as well as the cancer-
specific context of the analyzed datasets. g: Profiler reveals
enrichments of generic terms such as the cell cycle (GO, P <
10
-42
) and DNA replication (GO, P < 10
-37
), as well as more
specific functions like DNA replication pre-initiation (Reac-
tome, P < 10
-11
) and DNA strand elongation (Reactome, P <
10
-21
). The promoters of coexpressed genes have enrichments
for the binding site of E2F1, a transcription factor with a rec-
ognized role in replication regulation and oncogenesis (for
example, Transfac, M00427, consensus sequence TTTS-
GCGS, P < 10
-6
) [47,48]. The enrichment in the P53 pathway
(KEGG, P = 10
-4
) suggests a link with the well-identified
tumor suppressor gene [49]. Moreover, the cohorts contain
microRNAs as well as enrichments for microRNA target sites
that may have cancer-specific roles. For instance, the coex-
pressed genes have a greater than expected proportion of tar-
get sites for the microRNA miR-142-5p (miRBase, P < 10
-4
), a
regulatory RNA that has been detected in the context of
leukemia [50].
In order to investigate the advantage of MEM analysis for
coexpression over multiple datasets, we conducted a compu-
tational experiment where varying numbers of datasets were
incorporated for delivering MCM cohorts (Figure 4). For each
of the sample sizes ranging from 2 to 125, we used 300 rand-
omized collections of input datasets from the above cancer
compendium to measure the median distance between MCM
subunits in individual cohorts. As expected, adding more
datasets into MEM analysis brings MCM subunits closer in
resulting ranked gene lists. According to the Kolmogorov-
Smirnov one-sided test, using MEM queries over several
datasets always gives significantly better results (for example,
increased similarity between MCM subunits) than correlation
over any of the datasets individually. The advantage of MEM
analysis appears to increase exponentially in relation to ana-
Increasing the number of datasets for MEM queries improves prediction of Mini Chromosome Maintenance (MCM) subunitsFigure 4
Increasing the number of datasets for MEM queries improves prediction of
Mini Chromosome Maintenance (MCM) subunits. As additional datasets
are incorporated for MEM analysis, MCM complex subunits show more
consistent expression patterns as measured by median distance between
subunits in MEM ranked lists of most correlated genes (decreasing bar
height). According to one-sided Kolmogorov-Smirnov tests, MEM analysis
with different numbers of datasets (left bars) significantly outperforms
correlation (rightmost bar). In addition, MEM analysis for all the 145
selected datasets gives improved results compared to plain correlation
across the concatenated dataset (light blue and orange lines).
MEM outperforms correlation in predicting MCM subunits
MEM: number of incorporated datasets
Median rank distance between MCM subunits
2
5
10
25
50
75
100
125
cor
10
10
2
10
3
10
4
P=1
10
−−100
One−sided KS−test between cor and MEM
17.5
22.5
MEM, all 145 datasets
Correlation, composite dataset
Genome Biology 2009, Volume 10, Issue 12, Article R139 Adler et al. R139.8
Genome Biology 2009, 10:R139
lyzed datasets. Importantly, the MEM query over all 145 can-
cer-specific datasets provides a smaller median distance
between MCM subunits (m = 17.5), compared to the correla-
tion over the concatenation of corresponding datasets (m =
22.5).
Conclusions
As the amount of publicly available microarray data grows,
methods that extract useful information from multiple data-
sets become ever more valuable. However, without special-
ized tools, the task of analyzing hundreds of datasets can be
very labour-intensive. With the development of the MEM
resource we have solved many of the technical challenges and
aim to make high-throughput coexpression mining accessible
for a larger audience.
MEM includes a large collection of up-to-date microarray
datasets from the ArrayExpress database. We have developed
a flexible strategy for coexpression analysis that puts great
emphasis on selecting the most appropriate datasets for the
query and uses a novel statistical algorithm to detect signifi-
cant correlation patterns. Finally, MEM results are presented
in an interactive graphical user interface that opens up sev-
eral paths for further data analysis.
Still the MEM analysis has some limitations and possibilities
for further development. The main limitation of the tool is the
lack of across-platform similarity search, that is due to the
complexity of mappings between probesets of different plat-
forms, and comparability of normalizations. Fortunately, the
number of various platforms for each model organism is rel-
atively low and the bulk of experiments is often available in a
single platform. In a number of network reconstruction appli-
cations, one might be interested in the coexpression of units
of multiple genes such as protein complexes. Therefore, pro-
viding methods that allow comparison of groups of genes
would be a natural development of MEM.
Methods
Rank aggregation
Rank aggregation is the heart of MEM coexpression analysis.
It uses the statistical distribution of orderings to integrate
individual lists of similar genes into final lists with signifi-
cance P-values for each gene. The rank aggregation problem
has been studied mainly in the context of voting and social
choice, but there are also several bioinformatics applications,
for example, [51,52].
Most classical methods assume that each individual ranking
is reasonable and should be taken into account in composing
the final ordering. However, in the case of gene coexpression
analysis, some rankings include considerable amounts of
noise as they are derived from genes and conditions with low
variation. In order to overcome this, we first identify reliable
gene lists that are based on sufficient variation, and then com-
pute the rank aggregation based on the limited set of lists.
The input of rank aggregation is a collection of ordered lists,
where every element in a list corresponds to a gene in a spe-
cific experiment, showing the rank of similarity to the query
gene g*, relative to all other genes in the organism. We nor-
malize the lists into the range [0.1], by dividing each individ-
ual rank by the maximal rank, that is, the number of genes in
the microarray platform. We transform the ranks so that for
each gene g
i
, we have a rank vector r(g*, g
i
) = [ , , ]
where corresponds to the position of g
i
in the query on
dataset j.
A straightforward solution for rank aggregation involves reor-
dering the genes g
i
based on their arithmetic means of indi-
vidual ranks r(g*, g
i
). Unfortunately this approach is rather
sensitive to noise, since the mean is heavily influenced by
large ranks that indicate no strong correlation. Geometric
mean is more sensitive to small ranks and robust to fluctua-
tions among large uninformative ranks. An alternative and
empirically more successful approach uses trimmed mean
that only considers k smallest elements, but requires the esti-
mation of the parameter k.
We developed a statistical strategy for robust rank aggrega-
tion that overcomes the problems of mean-based methods
and allows us to evaluate the statistical significance of
detected similarity. As a null hypothesis, we consider a model
ranking where similar genes are permuted randomly and the
distribution of each rank vector r(g*, g
i
) is approximately uni-
form. In the biological case of strong coexpression, we
observe an unexpectedly large amount of small ranks
between genes with correlated expression patterns, so that
the distribution of r(g*, g
i
) is skewed towards small values
and significantly different from a uniform distribution. We
can reorder the rank vector r(g*, g
i
) increasingly to gain the
vector of order statistics which range from the
smallest to the largest value of r(g*, g
i
). Assuming the null
hypothesis, we can use the binomial distribution to calculate
the probability that k or more ranks are smaller than , for
every k:
The final similarity score
ρ
between g* and g
i
is defined as
follows:
r
i
1
r
m
i
r
j
i
rr
i
m
i
() ( )
,,
1
…
r
k
i
()
p
m
j
rr
kk
ij
k
imj
jk
m
=
⎛
⎝
⎜
⎞
⎠
⎟
−
−
=
∑
()( ) .
() ()
1
(1)
Genome Biology 2009, Volume 10, Issue 12, Article R139 Adler et al. R139.9
Genome Biology 2009, 10:R139
In other words, for every value of k, we compute the P-value
for each rank statistic r
(k)
being randomly as small as
observed in the dataset, and as a final score we use the mini-
mal P-value.
The final
ρ
score itself is not a P-value, since it is a minimum
of P-values. Still, we may use a multiple testing correction to
remove false positives that occur due to several independent
tests. As we calculate the
ρ
scores for each gene, we actually
find a P-value corresponding to each rank matrix element.
According to Bonferroni correction for multiple testing, an
individual P-value is significant if it is smaller than the
desired significance level after multiplication by the number
of rows and columns of the rank matrix. We cannot use any
less stringent criteria for correction, since P-values for the
same gene are strongly correlated.
As a byproduct of the above computation, we gain informa-
tion about the datasets that contain significant coexpression
between any two genes. A dataset with a ranking that is
smaller than the ranking that gave rise to
ρ
(g*, g
i
) can be con-
sidered significant. This feature allows us to highlight the
contributions of different datasets into the final similarity
ranking, and observe interesting patterns between related
datasets. The score
ρ
also has the advantage of being non-par-
ametric, as it makes no requirements on the number of input
datasets or the magnitude of relevant ranks. In a way our
ρ
-
score represents a natural balance between two scenarios: a
gene that strongly correlates with the query gene in a small
number of samples, and a gene that shows weak correlation in
a large range of samples.
Microarray data
All data used in the analyses has been obtained from ArrayEx-
press and it also includes datasets that were originally sub-
mitted to GEO. We only included Affymetrix datasets where
raw data was available, and performed a uniform Robust
Multi-array Average (RMA) normalization [53] with the Bio-
conductor affy package [54] using the default parameters.
MEM also includes biological annotations of the datasets as
annotated according to the Minimum Information About a
Microarray Experiment (MIAME) standard [1]. The annota-
tions are used for building word clouds and annotation tracks
in heat map visualization of gene expression data.
Standard deviation threshold selection
We performed a simulation study to find the threshold for
query gene variation that would best identify the datasets
where the gene has meaningful expression patterns. All the
experiments in MEM are normalized and preprocessed the
same way, so we may compute a uniform threshold that
applies to all datasets. In the simulation, we chose random
sets of 2000 genes and 140 experiments on human Affyme-
trix platform HG-U133A, and calculated the standard devia-
tion for each gene in each experiment. We also performed a
MEM query with each of the genes and used similarity score
cutoff that yielded on average 20 genes per query. Now we
tried several thresholds for the standard deviation and in each
case we calculated correlation between the number of experi-
ments exceeding the threshold and the number of genes in the
result of the query. We achieved strongest coexpression pat-
terns between the query genes and the resulting genes when
using a standard deviation cutoff between 0.25 and 0.39,
while the peak performance was observed at the threshold
0.29 (Additional file 4).
Dataset annotation word cloud
MEM uses word clouds to display aggregated annotations of
multiple datasets. As a first step in generating the word
clouds, we process textual annotations of each dataset to
extract words and multi-word expressions. Out of all the
words present in the dataset description we pick only nouns,
adjectives and some other matching predefined patterns.
Selected words are then normalized to ignore inflected forms
(for example, gene, genes) using WordNet lemmatiser [55].
Besides single words, we also extract noun and adjective
phrases. Syntactic analysis is performed using MedPost part-
of-speech tagger [56].
Next, for a given group of datasets, we figure out a set of
descriptive terms (words and phrases) that are over-repre-
sented in this group, compared to all the available datasets.
We use hypergeometric P-value to identify such group-spe-
cific terms. The word cloud is then composed out of the terms
with the lowest P-value. Within the word cloud, font size
depicts their extent of over-representation of the term in the
corresponding group of datasets.
Abbreviations
ES: embryonic stem; GEO: gene expression omnibus; GO:
gene ontology; KEGG: Kyoto Encyclopedia of Genes and
Genomes; MCL: Markov cluster; MCM: mini chromosome
maintenance; MEM: multi experiment matrix; MIAME: min-
imum information about a microarray experiment; ORC: ori-
gin recognition complex; preRC: pre-replicative complex;
RMA: robust multi-array average.
Authors' contributions
PA and MK implemented the resource. RK and PA developed
the methods for the query. AT provided the annotation word
clouds. PA, RK and JR performed the case studies. RK and JR
drafted the manuscript. JV and HP conceived the study and
provided general guidance. All authors read and approved the
final manuscript.
ρ
(*,)min{,, }.gg p p
im
=
1
…
(2)
r
j
i
Genome Biology 2009, Volume 10, Issue 12, Article R139 Adler et al. R139.10
Genome Biology 2009, 10:R139
Additional files
The following additional data are available with the online
version of this paper. Additional file 1 is a table listing data-
sets used for network reconstruction. The datasets were all on
mouse platform Affymetrix U74Av2. In addition the analysis
included an unpublished dataset that cannot be found in
databases. Additional file 2 is a table listing datasets used for
MCM complex study. Additional file 3 is a table listing the 116
genes that occur in more than two of the six cohorts of subu-
nits MCM1-MCM6, where each cohort contains 100 probesets
with most correlation relative to the corresponding subunit.
Additional file 4 is a figure describing the selection of stand-
ard deviation cutoff. The figure shows correlation between
number of significant query results and the number of data-
sets where the query gene standard deviation exceeds certain
threshold. The maximal correlation is achieved when the
threshold is 0.29.
Additional file 1A table listing datasets used for network reconstructionThe datasets were all on mouse platform Affymetrix U74Av2. In addition the analysis included an unpublished dataset that cannot be found in databases.Click here for fileAdditional file 2A table listing datasets used for MCM complex studyA table listing datasets used for MCM complex study.Click here for fileAdditional file 3A table listing the 116 genes that occur in more than two of the six cohorts of subunits MCM1-MCM6A table listing the 116 genes that occur in more than two of the six cohorts of subunits MCM1-MCM6, where each cohort contains 100 probesets with most correlation relative to the corresponding subunit.Click here for fileAdditional file 4A figure describing the selection of standard deviation cutoffThe figure shows correlation between number of significant query results and the number of datasets where the query gene standard deviation exceeds certain threshold. The maximal correlation is achieved when the threshold is 0.29.Click here for file
Acknowledgements
Authors wish to thank Tambet Arak for technical ingenuity and support,
Sven Laur for proofreading, Toomas Neuman for initial biological setup and
Misha Kapushesky for help in ArrayExpress data download. The financial
support was provided by EU FP6 grants (ENFIN LSHG-CT-2005-518254
and COBRED LSHB-CT-2007-037730), ERDF through the Estonian Centre
of Excellence in Computer Science project and Estonian Science Founda-
tion ETF7427. JR acknowledges funding from Ustus Agur and Artur Lind
foundations.
References
1. Brazma A, Hingamp P, Quackenbush J, Sherlock G, Spellman P,
Stoeckert C, Aach J, Ansorge W, Ball CA, Causton HC, Gaasterland
T, Glenisson P, Holstege FC, Kim IF, Markowitz V, Matese JC, Parkin-
son H, Robinson A, Sarkans U, Schulze-Kremer S, Stewart J, Taylor R,
Vilo J, Vingron M: Minimum information about a microarray
experiment (MIAME)-toward standards for microarray
data. Nat Genet 2001, 29:365-371.
2. Schena M, Shalon D, Davis RW, Brown PO: Quantitative monitor-
ing of gene expression patterns with a complementary DNA
microarray. Science 1995, 270:467-470.
3. Zhang L, Zhou W, Velculescu VE, Kern SE, Hruban RH, Hamilton SR,
Vogelstein B, Kinzler KW: Gene expression profiles in normal
and cancer cells. Science 1997, 276:1268-1272.
4. Welsh JB, Sapinoso LM, Su AI, Kern SG, Wang-Rodriguez J, Moskaluk
CA, Frierson HF, Hampton GM: Analysis of gene expression
identifies candidate markers and pharmacological targets in
prostate cancer. Cancer Res 2001, 61:5974-5978.
5. Segal E, Shapira M, Regev A, Pe'er D, Botstein D, Koller D, Friedman
N: Module networks: identifying regulatory modules and
their condition-specific regulators from gene expression
data. Nat Genet 2003, 34:166-176.
6. Spellman PT, Sherlock G, Zhang MQ, Iyer VR, Anders K, Eisen MB,
Brown PO, Botstein D, Futcher B: Comprehensive identification
of cell cycle-regulated genes of the yeast Saccharomyces cer-
evisiae by microarray hybridization. Mol Biol Cell 1998,
9:3273-3297.
7. Allison DB, Cui X, Page GP, Sabripour M: Microarray data analy-
sis: from disarray to consolidation and consensus. Nat Rev
Genet 2006, 7:55-65.
8. Wolfe CJ, Kohane IS, Butte AJ: Systematic survey reveals gen-
eral applicability of "guilt-by-association" within gene coex-
pression networks. BMC Bioinformatics 2005, 6:227.
9. Hughes TR, Marton MJ, Jones AR, Roberts CJ, Stoughton R, Armour
CD, Bennett HA, Coffey E, Dai H, He YD, Kidd MJ, King AM, Meyer
MR, Slade D, Lum PY, Stepaniants SB, Shoemaker DD, Gachotte D,
Chakraburtty K, Simon J, Bard M, Friend SH: Functional discovery
via a compendium of expression profiles. Cell 2000,
102:109-126.
10. Stuart JM, Segal E, Koller D, Kim SK: A gene-coexpression net-
work for global discovery of conserved genetic modules. Sci-
ence 2003, 302:249-255.
11. Wilson BJ, Giguère V: Identification of novel pathway partners
of p68 and p72 RNA helicases through Oncomine meta-anal-
ysis. BMC Genomics 2007, 8:419.
12. Basso K, Margolin AA, Stolovitzky G, Klein U, Dalla-Favera R, Califano
A: Reverse engineering of regulatory networks in human B
cells. Nat Genet 2005, 37:382-390.
13. Rhodes DR, Tomlins SA, Varambally S, Mahavisno V, Barrette T, Kaly-
ana-Sundaram S, Ghosh D, Pandey A, Chinnaiyan AM: Probabilistic
model of the human protein-protein interaction network.
Nat Biotechnol 2005, 23:951-959.
14. Kemmeren P, van Berkum NL, Vilo J, Bijma T, Donders R, Brazma A,
Holstege FCP: Protein interaction verification and functional
annotation by integrated analysis of genome-scale data. Mol
Cell 2002, 9:1133-1143.
15. Pennacchio LA, Loots GG, Nobrega MA, Ovcharenko I: Predicting
tissue-specific enhancers in the human genome. Genome Res
2007, 17:201-211.
16. Brazma A, Jonassen I, Vilo J, Ukkonen E: Predicting gene regula-
tory elements in silico on a genomic scale. Genome Res 1998,
8:1202-1215.
17. Adler P, Peterson H, Agius P, Reimand J, Vilo J: Ranking genes by
their co-expression to subsets of pathway members. Ann NY
Acad Sci 2009, 1158:1-13.
18. Parkinson H, Kapushesky M, Shojatalab M, Abeygunawardena N,
Coulson R, Farne A, Holloway E, Kolesnykov N, Lilja P, Lukk M, Mani
R, Rayner T, Sharma A, William E, Sarkans U, Brazma A: ArrayEx-
press - a public database of microarray experiments and
gene expression profiles. Nucleic Acids Res 2007, 35:D747-D750.
19. Barrett T, Troup DB, Wilhite SE, Ledoux P, Rudnev D, Evangelista C,
Kim IF, Soboleva A, Tomashevsky M, Edgar R: NCBI GEO: mining
tens of millions of expression profiles - database and tools
update. Nucleic Acids Res 2007, 35:
D760-D765.
20. Lee HK, Hsu AK, Sajdak J, Qin J, Pavlidis P: Coexpression analysis
of human genes across many microarray data sets. Genome
Res 2004, 14:1085-1094.
21. Huttenhower C, Hibbs M, Myers C, Troyanskaya OG: A scalable
method for integration and functional analysis of multiple
microarray datasets. Bioinformatics 2006, 22:2890-2897.
22. Hibbs MA, Hess DC, Myers CL, Huttenhower C, Li K, Troyanskaya
OG: Exploring the functional landscape of gene expression:
directed search of large microarray compendia. Bioinformatics
2007, 23:2692-2699.
23. Reimand J, Kull M, Peterson H, Hansen J, Vilo J: g: Profiler - a web-
based toolset for functional profiling of gene lists from large-
scale experiments. Nucleic Acids Res 2007, 35:W193-W200.
24. Hubbard TJP, Aken BL, Ayling S, Ballester B, Beal K, Bragin E, Brent S,
Chen Y, Clapham P, Clarke L, Coates G, Fairley S, Fitzgerald S, Fern-
andez-Banet J, Gordon L, Graf S, Haider S, Hammond M, Holland R,
Howe K, Jenkinson A, Johnson N, Kahari A, Keefe D, Keenan S, Kin-
sella R, Kokocinski F, Kulesha E, Lawson D, Longden I, et al.: Ensembl
2009. Nucleic Acids Res 2009, 37:D690-D697.
25. Hardin J, Mitani A, Hicks L, Vankoten B: A robust measure of cor-
relation between two genes on a microarray. BMC
Bioinformatics 2007, 8:220.
26. Gennarino VA, Sardiello M, Avellino R, Meola N, Maselli V, Anand S,
Cutillo L, Ballabio A, Banfi S: MicroRNA target prediction by
expression analysis of host genes. Genome Res 2009, 19:481-490.
27. Vilo J, Kapushesky M, Kemmeren P, Sarkans U, Brazma A: Expres-
sion profiler. In The Analysis of Gene Expression Data: Methods and
Software New York: Springer; 2003.
28. Boyer LA, Lee TI, Cole MF, Johnstone SE, Levine SS, Zucker JP, Guen-
ther MG, Kumar RM, Murray HL, Jenner RG, Gifford DK, Melton DA,
Jaenisch R, Young RA: Core transcriptional regulatory circuitry
in human embryonic stem cells. Cell 2005, 122:947-956.
29. Loh YH, Wu Q, Chew JL, Vega VB, Zhang W, Chen X, Bourque G,
George J, Leong B, Liu J, Wong KY, Sung KW, Lee CWH, Zhao XD,
Chiu KP, Lipovich L, Kuznetsov VA, Robson P, Stanton LW, Wei CL,
Ruan Y, Lim B, Ng HH: The Oct4 and Nanog transcription net-
work regulates pluripotency in mouse embryonic stem cells.
Nat Genet 2006, 38:431-440.
30. Okuda A, Fukushima A, Nishimoto M, Orimo A, Yamagishi T,
Nabeshima Y, Kuro-o M, i Nabeshima Y, Boon K, Keaveney M, Stun-
nenberg HG, Muramatsu M: UTF1, a novel transcriptional coac-
tivator expressed in pluripotent embryonic stem cells and
extra-embryonic cells. EMBO J 1998, 17:2019-2032.
Genome Biology 2009, Volume 10, Issue 12, Article R139 Adler et al. R139.11
Genome Biology 2009, 10:R139
31. Maldonado-Saldivia J, Bergen J van den , Krouskos M, Gilchrist M, Lee
C, Li R, Sinclair AH, Surani MA, Western PS: Dppa2 and Dppa4 are
closely linked SAP motif genes restricted to pluripotent cells
and the germ line. Stem Cells 2007, 25:19-28.
32. James D, Levine AJ, Besser D, Hemmati-Brivanlou A: TGFbeta/
activin/nodal signaling is necessary for the maintenance of
pluripotency in human embryonic stem cells. Development
2005, 132:1273-1282.
33. Parisi S, D'Andrea D, Lago CT, Adamson ED, Persico MG, Minchiotti
G: Nodal-dependent Cripto signaling promotes cardiomyo-
genesis and redirects the neural fate of embryonic stem
cells. J Cell Biol 2003, 163:303-314.
34. Chen C, Ware SM, Sato A, Houston-Hawkins DE, Habas R, Matzuk
MM, Shen MM, Brown CW: The Vg1-related protein Gdf3 acts
in a Nodal signaling pathway in the pre-gastrulation mouse
embryo. Development 2006, 133:319-329.
35. Sharov AA, Masui S, Sharova LV, Piao Y, Aiba K, Matoba R, Xin L,
Niwa H, Ko MSH: Identification of Pou5f1, Sox2, and Nanog
downstream target genes with statistical confidence by
applying a novel algorithm to time course microarray and
genome-wide chromatin immunoprecipitation data. BMC
Genomics 2008, 9:269.
36. Zhou XJ, Kao MCJ, Huang H, Wong A, Nunez-Iglesias J, Primig M,
Aparicio OM, Finch CE, Morgan TE, Wong WH: Functional anno-
tation and network reconstruction through cross-platform
integration of microarray data. Nat Biotechnol 2005, 23:238-243.
37. Soinov LA, Krestyaninova MA, Brazma A: Towards reconstruction
of gene networks from expression data by supervised
learning. Genome Biol 2003, 4:R6.
38. Guthke R, Möller U, Hoffmann M, Thies F, Töpfer S: Dynamic net-
work reconstruction from gene expression data applied to
immune response during bacterial infection. Bioinformatics
2005,
21:1626-1634.
39. van Dongen S: Graph clustering by flow simulation. In PhD thesis
University of Utrecht; 2000.
40. Reimand J, Tooming L, Peterson H, Adler P, Vilo J: GraphWeb:
mining heterogeneous biological networks for gene modules
with functional significance. Nucleic Acids Res 2008,
36:W452-W459.
41. Kelly TJ, Brown GW: Regulation of chromosome replication.
Annu Rev Biochem 2000, 69:829-880.
42. Tye BK: MCM proteins in DNA replication. Annu Rev Biochem
1999, 68:649-686.
43. Blow JJ, Dutta A: Preventing re-replication of chromosomal
DNA. Nat Rev Mol Cell Biol 2005, 6:476-486.
44. Davies RJ, Freeman A, Morris LS, Bingham S, Dilworth S, Scott I, Las-
key RA, Miller R, Coleman N: Analysis of minichromosome
maintenance proteins as a novel method for detection of
colorectal cancer in stool. Lancet 2002, 359:1917-1919.
45. Feng D, Tu Z, Wu W, Liang C: Inhibiting the expression of DNA
replication-initiation proteins induces apoptosis in human
cancer cells. Cancer Res 2003, 63:7356-7364.
46. Gonzalez MA, Pinder SE, Callagy G, Vowler SL, Morris LS, Bird K, Bell
JA, Laskey RA, Coleman N: Minichromosome maintenance pro-
tein 2 is a strong independent prognostic marker in breast
cancer. J Clin Oncol 2003, 21:4306-4313.
47. Johnson DG, Cress WD, Jakoi L, Nevins JR: Oncogenic capacity of
the E2F1 gene. Proc Natl Acad Sci USA 1994, 91:12823-12827.
48. DeGregori J, Kowalik T, Nevins JR: Cellular targets for activation
by the E2F1 transcription factor include DNA synthesis- and
G1/S-regulatory genes. Mol Cell Biol 1995, 15:4215-4224.
49. Hollstein M, Sidransky D, Vogelstein B, Harris CC: p53 mutations
in human cancers. Science 1991, 253:49-53.
50. Kasashima K, Nakamura Y, Kozu T: Altered expression profiles of
microRNAs during TPA-induced differentiation of HL-60
cells. Biochem Biophys Res Commun 2004, 322:403-410.
51. Pihur V, Datta S, Datta S: Finding common genes in multiple
cancer types through meta-analysis of microarray experi-
ments: a rank aggregation approach. Genomics 2008,
92:400-403.
52. Lin S, Ding J: Integration of ranked lists via cross entropy
Monte Carlo with applications to mRNA and microRNA
studies. Biometrics 2009, 65:9-18.
53. Irizarry RA, Bolstad BM, Collin F, Cope LM, Hobbs B, Speed TP:
Summaries of Affymetrix GeneChip probe level data. Nucleic
Acids Res 2003, 31:e15.
54. Gautier L, Cope L, Bolstad BM, Irizarry RA: Affy-analysis of
Affymetrix GeneChip data at the probe level. Bioinformatics
2004, 20:307-315.
55. Miller G, Beckwith R, Fellbaum C, Gross D, Miller K: Five papers on
WordNet. In CSL Report 43 Cognitive Science Laboratory, Prince-
ton University; 1990.
56. Smith L, Rindflesch T, Wilbur WJ: MedPost: a part-of-speech tag-
ger for bioMedical text. Bioinformatics 2004, 20:2320-2321.