Báo cáo y học: " Rapid chromosome territory relocation by nuclear motor activity in response to serum removal in primary human fibroblasts" ppt
Bạn đang xem bản rút gọn của tài liệu. Xem và tải ngay bản đầy đủ của tài liệu tại đây (4.47 MB, 17 trang )
Mehta et al. Genome Biology 2010, 11:R5
/>
Open Access
RESEARCH
Rapid chromosome territory relocation by nuclear
motor activity in response to serum removal in
primary human fibroblasts
Research
Ishita S Mehta1, Manelle Amira1,2, Amanda J Harvey2 and Joanna M Bridger*1
utes of myosin 1β-dependent within
chromosome positioning human cells.
Nuclearserum starvation indynamics 15 minChromosome territories occursrepositioning of
Abstract
Background: Radial chromosome positioning in interphase nuclei is nonrandom and can alter according to
developmental, differentiation, proliferation, or disease status. However, it is not yet clear when and how chromosome
repositioning is elicited.
Results: By investigating the positioning of all human chromosomes in primary fibroblasts that have left the
proliferative cell cycle, we have demonstrated that in cells made quiescent by reversible growth arrest, chromosome
positioning is altered considerably. We found that with the removal of serum from the culture medium, chromosome
repositioning took less than 15 minutes, required energy and was inhibited by drugs affecting the polymerization of
myosin and actin. We also observed that when cells became quiescent, the nuclear distribution of nuclear myosin 1β
was dramatically different from that in proliferating cells. If we suppressed the expression of nuclear myosin 1β by using
RNA-interference procedures, the movement of chromosomes after 15 minutes in low serum was inhibited. When high
serum was restored to the serum-starved cultures, chromosome repositioning was evident only after 24 to 36 hours,
and this coincided with a return to a proliferating distribution of nuclear myosin 1β.
Conclusions: These findings demonstrate that genome organization in interphase nuclei is altered considerably when
cells leave the proliferative cell cycle and that repositioning of chromosomes relies on efficient functioning of an active
nuclear motor complex that contains nuclear myosin 1β.
Background
Within interphase nuclei, individual chromosomes are
organized within their own nuclear space, known as
chromosome territories [1,2]. These interphase chromosome territories are organized in a nonrandom manner in
the nuclei of human cells and cells from other species [3].
Chromosomes in different species are positioned radially,
according to either their gene density [4-9] or their size
[10-12] or both [11,13-16]. The nuclear microenvironment within which a chromosome is located could affect
its gene regulation, and it has been proposed that whole
chromosomes or regions of chromosomes are shifted
around the nucleus to control gene expression [17,18].
Active genes appear to come together in a common
nuclear space, possibly to be co-transcribed [19-21]. This
* Correspondence:
1
Centre for Cell and Chromosome Biology, Division of Biosciences, School of
Health Sciences and Social Care, Brunel University, Kingston Lane, Uxbridge,
UB8 3PH, UK
fits with the increasing number of observations made of
chromosome loops, containing active areas of the
genome, coming away from the main body of the chromosome territory, such as regions containing FLNA on
the X chromosome [22]; major histocompatibility complex (MHC) genes [23], specific genes on chromosome 11
[24]; β- globin-like genes [25], epidermal differentiation
complex genes [26], specific genes within the Hox B cluster [27,28], and genes inducing porcine stem cell differentiation into adipocytes [29]. Chromatin looping is
apparently associated with gene expression, because inhibition of RNA polymerase II transcription affects the outward movement of these chromosome loops [30].
Repositioning of whole chromosome territories has
been observed in erythroid differentiation [25], adipogenesis [31], T-cell differentiation [32], porcine spermatogenesis [33], and after hormonal stimulus [34]. Even
more studies revealed genomic loci being repositioned
during differentiation (see [35], for comprehensive
© 2010 Mehta et al., licensee BioMed Central Ltd. This is an open access article distributed under the terms of the Creative Commons
Attribution License (http://http:/creativecommons.org/licenses/by/2.0), which permits unrestricted use, distribution, and reproduction
in any medium, provided the original work is properly cited.
Mehta et al. Genome Biology 2010, 11:R5
/>
review). We demonstrated previously that interphase
chromosomes occupy alternative nuclear positions when
proliferating cells become quiescent or senescent [5,7,9].
For example, chromosomes 13 and 18 move from a
peripheral nuclear location to an internal nuclear location in serum-starved or senescent fibroblast cells [5,9].
From these early studies, it was not clear how other chromosomes behaved after induction of growth arrest, and
so we have now positioned all human chromosomes in
cells made quiescent by serum starvation. We found that
just less than half of the chromosomes alter their nuclear
location. The ability to control, temporally, the entry of
cells to quiescence through serum starvation allows the
determination of a response time of nuclear architecture
to the change in environment. In this study, we demonstrate that chromosome repositioning in interphase
nuclei occurs within 15 minutes.
The presence of actin [36] and myosin [37-41] have
been reported in nuclei, and an increasing body of evidence suggests that they cooperate to form a nuclear
myosin-actin motor [42]. Actin and myosin have been
shown to be involved in the intranuclear movement of
chromosomal regions [43,44] and whole chromosomes
[34]. Further, nuclear actin and myosin are involved in
RNA polymerase I transcription [37,40], RNA polymerase II transcription [37-41], and RNA polymerase III
transcription [45]. In a model put forward by Hoffman
and colleagues [42], myosin I could bind through its tail
to the nuclear entity that requires movement, with actin
binding to the globular head of the nuclear myosin I molecule. This nuclear motor would then translocate the
nuclear entity along highly dynamic tracks of nuclear
actin [42]. In this study, we demonstrated that the rapid
movement of chromosome territories in response to
serum deprivation is dependent on the function of both
actin and myosin, probably nuclear myosin 1β.
Results
Interphase chromosome positioning in proliferating and
nonproliferating cells
To determine the nuclear location of specific chromosomes, human dermal fibroblasts (HDFs) were harvested
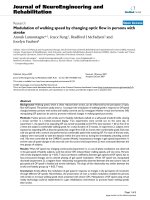
and fixed for standard 2D-fluorescence in situ hybridization (FISH). Representative images of chromosome territories in proliferating cells are displayed in Figure 1a-d.
Digital images were subjected to erosion analysis [46,8,9], whereby the images of 4',6-diamidino-2-phenylindole (DAPI)-stained flattened nuclei are divided into five
concentric shells of equal area, and the intensity of the
DAPI signal and probe signal is measured in each shell.
The chromosome signal is then normalized by dividing it
by the percentage of DAPI signal. The data for each chromosome are then plotted as a histogram with error bars,
with the x-axis displaying the nuclear shells from 1 to 5,
Page 2 of 17
representing the nuclear periphery to the nuclear interior,
respectively (Figure 1e-h).
In young proliferating fibroblasts, interphase chromosomes are positioned nonrandomly in a radial pattern
within nuclei [3]. In our 2D studies, we consistently found
gene-poor chromosomes, such as chromosomes X, 13,
and 18, located at the nuclear periphery [5,9], which fits
with their having more lamina-associated domains than
gene-poor chromosomes (see [46]). In this study, we
recapitulated the interphase chromosome positioning
with our present cultures and demonstrated that these
chromosomes are located at the nuclear periphery in
young proliferating cells (Figure 1b-d, f-h). Proliferating
cells within the primary cultures were identified by using
the proliferative marker, anti-pKi-67, which is distributed
in a number of different patterns within proliferating
human fibroblasts [47]. Its distribution is mainly nucleolar and is shown in red (Figure 1a-d). Figure 1a and e
demonstrate the nuclear location of chromosome 10,
unlike chromosomes 13, 18, and X it is found in an intermediate position in proliferating fibroblasts. The relative
interphase positions of chromosomes 10 and X have been
confirmed in 3D-FISH analyses (Figure 1i-k), whereby
HDFs were fixed to preserve their three-dimensionality
with 4% paraformaldehyde and subjected to 3D-FISH
[48]. Measurements in micrometers from the geometric
center the chromosome territories to the nearest nuclear
periphery, as determined by the DAPI staining, were
taken in at least 20 nuclei. The data were not normalized
for size measurements, so that actual measurements in
micrometers can be seen. However, all data were normalized by a size measurement, and this not does alter the
relative positioning of the chromosomes.
We have evidence from prior studies that chromosomes such as chromosomes 13 [9] and 18 [5,9] alter their
nuclear position when primary fibroblasts exit the proliferative cell cycle and that chromosome X remains at the
nuclear periphery [9]. However, this is only two chromosomes of 24, and so to determine which other chromosomes reposition after cell-cycle exit into quiescence
(G0), elicited through serum removal, we positioned all
human chromosomes in G0 cells (Figures 2 and 3).
To make cells quiescent, young, HDFs were grown in
10% NCS for 48 hours, and then the cells were washed
twice with serum-free medium and placed in 0.5% NCS
medium for 168 hours (7 days). However, when the positioning analysis was performed on the quiescent nuclei,
we found that certain chromosomes were in very different positions from those in which they were found in proliferating nuclei, that is, chromosomes 1, 6, 8, 10, 11, 12,
13, 15, 18, and 20 (Table 1).
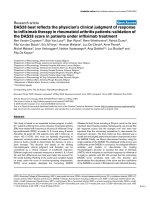
The data demonstrated in Figure 3 and Table 1 reveal
that a number of chromosomes alter their nuclear positions when cells become quiescent; as shown before, both
Mehta et al. Genome Biology 2010, 11:R5
/>
Page 3 of 17
2D FISH
Chromosome 10
Chromosome 13
Chromosome 18
Chromosome X
(a)
(b)
(c)
(d)
(e)
(f)
(g)
(h)
Periphery
Interior
Periphery
Interior
Periphery
Interior
Periphery
Interior
3D FISH
Chromosome X
Chromosome 10
(i)
(j)
(k)
Chromosome positioning in proliferating interphase nuclei
Figure 1 Chromosome positioning in proliferating interphase nuclei. Proliferating human dermal fibroblasts (HDFs) cultures were subjected to
2D- or 3D-fluorescence in situ hybridization (FISH) to delineate and analyze the nuclear location of chromosomes 10, 13, 18, and X. In panels (a-d), the
chromosome territories are revealed in green with a single chromosome territory for chromosome X, because the HDFs are male in origin. The red
antibody staining is the nuclear distribution of the proliferative marker anti-pKi-67, the presence of which denotes a cell in the proliferative cell cycle.
DAPI (4',6-diamidino-2-phenylindole) in blue is a DNA intercalator dye and reveals the nuclear DNA. Scale bar = 10 μm. The histograms in panels (eh) display the distribution of the chromosome signal in 50 to 70 nuclei for each chromosome for 2D FISH, as analyzed with erosion analysis. This analysis divides each nucleus into five concentric shells of equal area, with shell 1 being the most peripheral shell, and shell 5 being the most interior shell
[4-6,9]. The percentage of chromosome signal measured in each shell was divided by the percentage of DAPI signal in that shell. Bars represent the
mean normalized proportion (percentage) of chromosome signal for each human chromosome. Error bars represent the standard error of the mean
(SEM). Panels i and j display 3D projections of 0.2-μm optical sections through 3D preserved nuclei subjected to 3D-FISH and imaged with confocal
laser scanning microscopy. The chromosome territories are displayed in red, and proliferating cells also were selected with positive anti-pKi-67 staining (not shown in reconstruction). Scale bar = 10 μm. The line graph in panel (k) displays a frequency distribution of micrometers from the geometric
center of the chromosome territories to the nearest nuclear periphery, as defined by DAPI staining. Images for 20 nuclei were analyzed.
Mehta et al. Genome Biology 2010, 11:R5
/>
Page 4 of 17
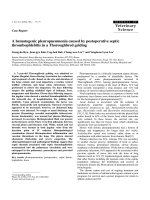
Chromosome positioning in quiescent interphase nuclei
Figure 2 Chromosome positioning in quiescent interphase nuclei. Representative images displaying nuclei prepared for fluorescence in situ hybridization (2D-FISH), with whole-chromosome painting probes (green), and nuclear DNA is counterstained with 4',6-diamidino-2-phenylindole (DAPI) (blue). The cells were subjected to indirect immunofluorescence with anti-pKi-67 antibodies, and negative cells were selected. Cells were placed
in low serum (0.5%) for 7 days, before fixation with methanol:acetic acid (3:1). The numbers (or letters) on the left side of each panel indicate the chromosome that has been hybridized. Scale bar = 10 μm.
chromosomes 13 and 18 move from a peripheral nuclear
location to an interior location (Figure 3m and r). Chromosome 10 is one of a number of chromosomes that
move from an intermediate nuclear location to the
nuclear periphery (Figure 3j, Table 1), whereas chromosome X does not change its location at the nuclear
periphery (Figure 3w), and chromosomes such as 17 and
19 do not change their interior location (Figure 3q and s,
respectively).
It certainly appears that the chromosome positioning in
quiescent G0 cells is correlated with size. However, it is
not clear why a repositioning of chromosomes occurs
after serum removal and when and how it is elicited.
The movement of chromosomes when normal fibroblasts
exit the cell cycle is rapid, active, and requires myosin and
actin
To determine when the genome is reorganized on exit
from the cell cycle and the speed of the response to the
removal of growth factors, we took actively proliferating
young cultures of primary HDFs and replaced 10% NCS
medium with 0.5% NCS medium. Samples were taken at
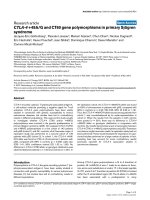
0, 5, 10, 15, and 30 minutes after serum starvation for fixation, and chromosome position in interphase was determined with 2D-FISH and erosion analysis (Figure 4 and
Additional file 1). Chromosomes 13 and 18 relocated
from the nuclear periphery to the nuclear interior within
15 minutes (Figure 4h and l), with an intermediate-type
nuclear positioning visible in the intervening time points
(5 and 10 minutes; Figure 4f, g, j, and k). In addition,
chromosome 10 moved from an intermediate location to
a peripheral location in the same time window (15 minutes; Figure 4d). Chromosome X did not relocalize at all,
as was reported previously [9] (Figure 4m-o), apart from
some slight difference at 15 minutes (Figure 4p).
In a previous study, we demonstrated that relocation of
chromosome 18 from the nuclear interior in G0 cells to
the nuclear periphery in serum-restimulated cells took
30+ hours and appeared to require cells to rebuild their
nuclear architecture after a mitotic division [5]. We
Mehta et al. Genome Biology 2010, 11:R5
/>
(b)
1.2
0.8
0.4
2
1.6
1.2
0.8
0.4
2
3
4
1
5
2
(f)
Chromosome 5
3
4
1.2
0.8
0.4
4
2
1.2
0.8
0.4
2
3
2
1.2
0.8
0.4
0
3
4
2
1.2
0.8
0.4
1.2
0.8
0.4
2
4
2
3
(n)
3
4
4
5
Chromosome 8
2
1.6
1.2
0.8
0.4
1
2
3
(l)
Chromosome 12
2.4
2
1.2
0.8
0.4
1
2
3
4
2
1.6
1.2
0.8
0.4
0
5
1
2
3
Shell No.
(o)
Chromosome 14
5
Shell No.
1.6
5
4
0
5
Chromosome 11
Shell No.
Chromosome 13
3
0
1
2
(h)
2.4
Shell No.
(m)
1
Shell No.
2
(k)
Chromosome 10
1.6
5
0.4
Shell No.
0
2
0.8
5
1.6
5
% of C hromos om e Signa l / % of DAPI
% of C hromos om e Signa l / % of D API
% of C hromos om e Sig nal / % of DA PI
4
2.4
1.6
1.2
2.4
1
(j)
Chromosome 9
4
Chromosome 7
Shell No.
2.4
1
3
0
1
(i)
2
2.4
0
Shell No.
1.6
0
(g)
Chromosome 6
1.6
5
2
Shell No.
0
3
0.4
5
% of C hromos om e Signa l / % of DAPI
% of C hromos om e Signa l / % of DAPI
2
1.6
2
0.8
1
2.4
2.4
1
1.2
Shell No.
Shell No.
(e)
2
1.6
% of C hromos om e Signa l / % of DAPI
1
Chromosome 4
2.4
0
0
0
(d)
Chromosome 3
2.4
% of C hromos om e Signa l / % of DAPI
% of C hromos om e Signa l / % of D API
% of Chr om os om e Signa l / % of DAP I
2
1.6
% of C hromos om e Signa l / % of DA PI
(c)
Chromosome 2
2.4
% of C hromos om e Signa l / % of DA PI
Chromosome 1
2.4
% of C hromos om e Signa l / % of D API
(a)
Page 5 of 17
4
5
4
5
4
5
4
5
Shell No.
(p)
Chromosome 15
Chromosome 16
2.4
1.2
0.8
0.4
0
3
4
0.8
0.4
1
2
3
Shell No.
(q)
(r)
Chromosome 17
1
5
1.2
0.8
0.4
4
(s)
Chromosome 18
2
1.6
1.2
0.8
0.4
(v)
2
3
4
1.2
0.8
0.4
0
3
4
5
(t)
2
1.2
0.8
0.4
3
4
2
1.6
1.2
0.8
0.4
1.2
0.8
0.4
1
2
4
5
Shell No.
3
Shell No.
(x)
Chromosome X
Chromosome Y
2.4
2
1.6
1.2
0.8
0.4
2
1.6
1.2
0.8
0.4
0
0
3
2
1.6
5
2.4
2
Chromosome 20
0
2
(w)
Chromosome 22
1
3
Shell No.
Shell No.
0
Shell No.
2
2.4
1
% of C hromos om e Signa l / % of DA PI
% of C hromos om e Signa l / % of DAPI
2
0.4
0
5
1.6
5
2.4
1.6
4
Chromosome 19
Shell No.
Chromosome 21
2
3
0
1
5
2.4
1
2
2.4
Shell No.
(u)
0.8
1
0
3
1.2
Shell No.
% of C hromos om e Signa l / % of DAPI
% of C hromos om e Signa l / % of DAPI
% of C hromos om e Signa l / % of DAPI
2
1.6
0
% of C hromos om e Signa l / % of DAPI
4
2.4
2
0.4
Shell No.
2.4
1
0.8
2
1.6
0
0
5
1.2
% of C hromos om e Signa l / % of DAPI
2
1.2
2
1.6
% of C hromos om e Signa l / % of DA PI
1
2
1.6
2.4
% of C hromos om e Signa l / % of DAPI
2
1.6
% of C hromos om e Sig nal / % of DAPI
2.4
% of C hromos om e Sig nal / % of DA PI
% of C hromos om e Signa l / % of DAPI
2.4
1
2
3
Shell No.
4
5
1
2
3
Shell No.
Analysis of radial chromosome positioning in quiescent cell nuclei
Figure 3 Analysis of radial chromosome positioning in quiescent cell nuclei. Histograms displaying chromosome positions in primary human
quiescent fibroblast nuclei. The 50 to 70 nuclei per chromosome were subjected to erosion analysis, which divides each nucleus into five concentric
shells of equal area, with shell 1 being the most peripheral shell, and shell 5 being the most interior shell [4-6,9]. The percentage of chromosome signal
measured in each shell was divided by the percentage of 4',6-diamidino-2-phenylindole (DAPI) signal in that shell. Bars represent the mean normalized
proportion (percentage) of chromosome signal for each human chromosome. Error bars represent the standard error of mean (SEM).
Mehta et al. Genome Biology 2010, 11:R5
/>
Page 6 of 17
Table 1: The position of all chromosome territories in primary human dermal fibroblasts as determined by 2D FISH, image
acquisition, and erosion analysis
Chromosome by size
Proliferating
HDFs
Quiescent
HDFs
1
IMb
P
2
Pb
P
3
Pd
P
4
Pcd
Pc
5
IMd
IM
6
IMb
P
7
P^
P
X
Pab
Pc
8
IMb
P
9
Pd
P
10
IMd
P
11
IMd
P
12
Pb
I
13
Pa
Ic
14
Ib
I
15
Pb
I
16
Ib
I
17
Ib
I
18
Pac
Iac
19
Ia
Ia
20
Id
IM
22
Ib
I
21
Ib
I
Y
I^
I
This table summarizes the locations of all the chromosomes in quiescent and proliferating nuclei of human dermal fibroblasts (HDFs). The
positions of chromosomes shown without a symbol have been determined for this study. aData derived from [5]. bData derived from [4]. cData
derived from [9]. dData derived from [7].
showed here that the same is true for chromosome 10,
with a return to an intermediate nuclear location 24 to 36
hours after restimulation of G0 cells with 10% NCS (Figure 5d-f). We again showed that chromosome 18 requires
similar times to return to the nuclear periphery (that is,
36 hours; Figure 5l). Although chromosome X remains at
the nuclear periphery, a slight change in the distribution
of chromosome X occurs at 32 to 36 hours (Figure 5q-r).
From these data, it seems that a rapid response to the
removal of growth factors reorganizes the whole genome
within the interphase nucleus, and this reorganization is
corrected in proliferating cells only after 24+ hours in
high serum, presumably after the cells have passed
through mitosis, as indicated by the peak of mitotic cells
at 24 to 36 hours after serum restimulation (0 hours,
none; 8 hours, none; 24 hours, 0.3%; 32 hours, 2.6%; and
36 hours, 1.2%).
Such rapid movement of large regions of the genome in
response to low serum implies an active process, perhaps
requiring ATP/GTP. When inhibitors of ATPase and/or
GTPase, ouabain, and AG10, were incubated with proliferating cell cultures in combination with low serum,
chromosome 10 did not change nuclear location (Figure
6a-d, and see Additional file 3). The relocation to the
nuclear interior of chromosome 18 territories after incubation of cells in low serum also was perturbed by these
Mehta et al. Genome Biology 2010, 11:R5
/>
Page 7 of 17
(m)
(c)2.4
(b)
2.4
% of C hromos om e Signa l / % of DAP I
2.4
2
1.6
1.2
0.8
0.4
2
1.6
1.2
0.8
0.4
0
3
4
0.4
2
3
4
5
1.6
1.2
0.8
0.4
2
3
4
1.6
1.2
0.8
0.4
2
3
4
1.2
0.8
0.4
0.8
0.4
1
2
3
1.2
0.8
0.4
4
% of C hromos om e Sig nal / % of DAP I
2
1.6
1.2
0.8
0.4
0
2
3
4
3
Shell No.
4
5
4
4
5
4
5
0.8
0.4
1
5
2
3
Shell No
2
1.6
1.2
0.8
0.4
5
2.4
2
1.6
1.2
0.8
0.4
1
2
3
4
1.6
1.2
0.8
0.4
2.8
2
1.6
1.2
0.8
0.4
0
3
4
5
Shell No.
3
(p)
2.4
2
2
2
Shell No.
(o)
2.4
1
1
5
Shell No.
0
2
5
1.2
0
% of C hromos om e Signa l / % of D AP I
(n)
2.4
3
(l)
Shell No.
2.8
4
2
1.6
0
1
5
Shell No
1
2
2.4
1.6
5
0
1
(k)
2
4
2.4
Shell No
2.4
3
(h)
1.2
0
0
2
Shell No.
1.6
5
% of C hromos om e Signa l / % of DAP I
% of C hromos om e Sig nal / % of DA PI
1.6
1
5
2
Shell No
2
0.4
0
1
(j)
4
2.4
2
5
3
(g)
2.4
Shell No
2.4
0.8
Shell No.
0
0
1
2
% of C hromos om e Signa l / % of DA PI
2
1.2
0
1
% of C hromos om e Signa l / % of DA PI
(f)
% of C hromos om e Signa l / % of DA PI
% of C hromos om e Signa l / % of DAP I
0.8
Shell No
2.4
% of C hromos om e Sig nal / % of DAP I
1.2
2
1.6
0
1
Shell No.
% of C hromos om e Signa l / % of D AP I
1.6
0
5
2.4
% of C hromos om e Sig nal / % of DAP I
2
(d)
2
% of C hromos om e Signa l / % of D AP I
1
15 Minutes
% of C hromos om e Signa l / % of DA PI
(i)
(i)
10 Minutes
% of C hromos om e Sig nal / % of D AP I
Chromosome 13
Chromosome 18
5 Minutes
(e)
% of C hromos om e Signa l / % of DAP I
Chromosome 10
(a)
Chromosome X
0 Minutes
2.4
2
1.6
1.2
0.8
0.4
0
1
2
3
Shell No.
4
5
1
2
3
Shell No.
Rapid repositioning of chromosomes after removal of serum
Figure 4 Rapid repositioning of chromosomes after removal of serum. Chromosomes move rapidly in proliferating cells placed in low serum.
The nuclear locations of human chromosomes 10 (a-d), 13 (e-h), 18 (i-l), and X (m-p) were analyzed in normal fibroblast cell nuclei fixed for 2D-FISH
(fluorescence in situ hybridization) after incubation in medium containing low serum (0.5%) for 0, 5, 10, and 15 minutes. The filled-in squares indicate
significance difference (P < 0.05) when compared with control proliferating fibroblast cell nuclei.
inhibitors (Figure 6a-d). The control chromosome, chromosome X, remained at the nuclear periphery (Figure 6
and Additional file 3). Because other studies suggest that
nuclear motors move genomic regions around the
nucleus by actin and/or myosin [42,44] we decided to use
inhibitors of actin and myosin polymerization to attempt
to block any chromosome movement elicited by these
nuclear motors when serum was removed. Latrunculin A,
an inhibitor of actin polymerization, inhibited the movement of both chromosomes 10 and 18 when cells were
placed in low serum (Figure 7a and Additional file 3). In
contrast, phalloidin oleate, another inhibitor of actin
polymerization did not prevent relocalization of either
chromosome 10 or 18, when cells were placed in low
serum (Figure 7b and Additional file 3). However, two
inhibitors of myosin polymerization (BDM) and function
Mehta et al. Genome Biology 2010, 11:R5
/>
Page 8 of 17
Chromosome X
Chromosome 10
(b)
(h)
(n)
(i)
(o)
(d)
(j)
(p)
(e)
(k)
(q)
(f)
Proliferating cells
(m)
(c)
0 hour s
(quiescent cells)
(g)
(l)
(r)
36 hours
32 hours
24 hours
8 hours
(a)
Restoration of proliferative chromosome position after restimulation of G0 cells
Figure 5 Restoration of proliferative chromosome position after restimulation of G0 cells. The relocation of chromosomes to their proliferative
nuclear location takes 24+ hours for chromosome 10 and 36 hours for chromosome 18. Proliferating cells (a, g, m) were placed in low serum (0.5%)
for 7 days (b, h, n) and then restimulated to enter the proliferative cell cycle with the readdition of high serum. Samples were taken at 8 hours (c, i, o),
24 hours (d, j, p), 32 hours (e, k, q), and 36 hours (f, l, r) after restimulation. The graphs display the normalized distribution of chromosome signal in
each of the five shells. Shell 1 is the nuclear periphery, and shell 5 is the innermost region of the nucleus. The solid squares represent a significant
difference (P < 0.05) for that shell when compared with the equivalent shell for the time 0 data (G0 data) for the erosion analysis.
Mehta et al. Genome Biology 2010, 11:R5
/>
(a)
Chromosome 10
Page 9 of 17
Chromosome 18
Chromosome X
(b)
Chromosome 10
2.4
2.4
Chromosome 18
Chromosom X
e
2.4
2.4
2.4
1
2
3
0.8
0.4
0
2
1.2
0.8
0.4
3
4
5
1
2
3
Shell No.
4
2
1.2
0.8
0.4
1
5
0.8
0.4
2
1.6
1.2
0.8
0.4
3
4
5
1
2
Shell No.
3
4
0.8
0.4
2
1.6
1.2
0.8
0.4
1
3
4
5
2
3
4
% of C hromos om e Signa l / % of D API
0.4
(d)
1.2
0.8
0.4
0
0
5
1
2
3
4
1
5
2
3
4
5
4
5
Shell No.
Shell No.
2.4
2
1.6
1.2
0.8
0.4
0
2.4
2
1.6
1.2
0.8
0.4
0
1
2
3
4
5
Shell No.
Chromosome 10
1
2
3
4
5
Shell No.
Chromosome 18
2
1.6
1.2
0.8
0.4
0
1
2
3
Shell No.
Chromosome X
0.8
0.4
1
2
3
4
5
4
5
Shell No.
0
0
2
1.2
2.4
% of C hromos om e Sig nal / % of DAPI
% of Chr omos om e Signa l / % o f DAPI
2
1.2
5
1.6
5
2.4
1.6
4
2
Shell No.
2.4
1
3
0
0
2
0.8
2
1.6
2.4
% of C hromos om e Sig nal / % of DAPI
1.2
1
2
Shell No.
2.4
1.6
1.2
Shell No.
Chromosome 18 Chromosome X
2.4
2
1
5
1.6
Shell No.
Chromosome 10
4
0
0
2
3
2.4
% of C hromos om e Sig nal / % of D API
% of C hromos om e Signa l / % of DA PI
1.2
1
2
Shell No.
1.6
% of C hromos om e Sig nal / % of D API
% of C hromos om e Sig nal / % of DA PI
2
1.6
% of C hromos om e Sig nal / % of D API
1
2.4
0
Ouabain+ Ag10
+ Low Serum
5
Shell No.
2.4
% of C hromos om e Sig nal / % of DAPI
Ouabain
+ Low Serum
Ouabain
+ Ag10
(c)
4
0.4
0
0
0
5
0.8
% of C hromos om e Sig nal / % of DA PI
4
1.2
2
1.6
% of C hromos om e Sig nal / % of D API
3
Shell No.
1.6
Proliferating
cells
2
0.8
0.4
0
1
1.2
% of C hromos om e Signa l / % of DA PI
0.4
Ag10
0.8
% of C hromos om e Signa l / % of D API
0.4
% of C hromos om e Signa l / % of D API
0.8
1.2
1.6
Ag10
+ Low Serum
1.2
1.6
2
2
3
4
5
Shell No.
Shell No.
2
1.6
1.2
0.8
0.4
0
1
2
3
Shell No.
Proliferating
cells+ low serum
1.6
2
% o f C hr om os om e Sig nal / % o f DAPI
% of C hromos om e Sig nal / % of DAPI
% of C hromos om e Sig nal / % of DAPI
Ouabain
2
2
Chromosome repositioning requires energy
Figure 6 Chromosome repositioning requires energy. The relocation of human chromosomes 10 and 18 after incubation in low serum is energy
dependent. The nuclear location of human chromosomes 10, 18, and X in were determined in normal human proliferating cell nuclei treated with
ouabain (ATPase inhibitor) (a), AG10 (GTPase inhibitor) (b), or a combination of both (c) before and during incubation in low serum for 15 minutes.
Normal control analysis data without any treatment is displayed in (d). The error bars show the standard error of the mean. The stars indicate a significant difference (P < 0.05) from cells treated only with the inhibitor.
(Jasplakinolide; also affects actin polymerization) did
inhibit movements of both these chromosomes upon
serum removal (Figure 7c, d, and Additional file 3). Figure
7e provides a comparison for the rapid change in chromosome position when no inhibitors are used. These data
imply that rapid chromosome movement observed in
cells as they respond to removal of growth factors is due
to an energy-driven process involving a nuclear
actin:myosin motor function.
Nuclear myosin 1β is required for chromosome territory
repositioning in HDFs placed in low serum
In an effort to elucidate which myosin isoform was
involved in chromosome movement after serum removal
in culture, we used suppression by RNA interference with
small interfering RNAs (siRNAs). An siRNA pool for the
gene MYO1C was selected because it encodes for a cytoplasmic myosin 1C and the nuclear isoform nuclear myosin 1β, a major candidate myosin for chromatin
relocation [39,49]. mRNA analysis had revealed insufficient differences in sequence for suppression of myosin
1β alone (data not shown). With a double transfection of
the siRNA, we observed 93% of cells displaying no
nuclear myosin staining at all (Figure 8k, q, and s) but still
with some cytoplasmic staining, whereas in the control
cells and the cells transfected with the control construct,
>95% of cells displayed a nuclear distribution of antinuclear myosin 1β, which was distributed in proliferating
cells as accumulations at the inner nuclear envelope, the
nucleoli, and throughout the cytoplasm (Figure 8g-j, mp). These numbers did not change significantly after
serum removal for 15 minutes, as per the chromosomemovement assay (data not shown).
After siRNA suppression of nuclear myosin, the chromosome-movement assay was repeated by placing the
double-transfected cells into low serum for 15 minutes.
The graphs in Figure 9 show that chromosomes 10, 18,
and X behave as expected after removal of serum in the
control cells (Figure 9a-f) and in the cells transfected with
the control construct (Figure 9g-l), with chromosome 10
becoming more peripheral, chromosome 18 becoming
more interior, and chromosome X remaining at the
nuclear periphery. However, in the cells that had been
transfected with MYO1C-targeting siRNA, chromosome
movement was much less dramatic, with the chromo-
Mehta et al. Genome Biology 2010, 11:R5
/>
0.8
0.4
3
4
2
1.6
1.2
0.8
0.4
2
3
4
2
1.2
0.8
0.4
1
5
0.8
0.4
2
1.6
1.2
0.8
0.4
0
1.6
1.2
0.8
0.4
3
4
0
5
1
2
Sh e ll N o.
3
4
5
1
1.2
0.8
0.4
0
2
3
Sh e ll N o.
4
5
4
5
2.4
% of Chromosom e Signal / % of DAPI
% of Chromosom e Signal / % of DAPI
2
1.6
3
Sh e ll N o.
2.4
1
2
Sh e ll N o.
2.4
2
1.6
1.2
0.8
0.4
0
2
1.6
1.2
0.8
0.4
0
1
2
3
1
4
Sh e ll N o.
2
1
2
3
4
5
4
5
1.6
1.2
0.8
0.4
% of Chromosom e Signal / % of DAPI
2
3
4
3
4
1
2
1.2
0.8
0.4
2
3
4
1.2
0.8
0.4
0.4
2
3
S h l No.
el
Chromosome X
2.4
2
1.6
1.2
0.8
0.4
5
5
0.8
1
0
4
4
2
Chromosome 18
0
5
1.2
5
2.4
1.6
4
0
1
Chromosome 10
3
1.6
Sh e ll N o.
2
3
2
Sh e ll N o.
1.6
5
2.4
2
0.4
2.4
Sh e ll N o.
1
0.8
5
0
0
2
1.2
Sh e ll N o.
2
1
1.6
0
1
2
1.6
1.2
0.8
0.4
0
1
2
Sh e ll N o.
3
4
5
1
2
She ll N o.
3
4
5
4
5
Sh e ll N o.
2.4
2.4
2
1.6
1.2
0.8
0.4
2
1.6
1.2
0.8
0.4
0
0
1
2
3
4
5
1
Sh e ll no.
Sh e ll N o.
Chromosome 10
3
2
2
3
S h l No.
el
4
5
2
1.6
1.2
0.8
0.4
0
1
2
3
Sh e ll N o.
Chromosome 18 Chromosome X
Proliferatin
g
cells + low serum
Proliferatin
g
cells
(e)
5
0.4
2.4
(d)
2
0
2
5
2.4
% of Chromosom e Signal / % of DAPI
1.2
4
Chromosome X
Chromosome 18
% of Chromosom e Signal / % of DAPI
1.6
3
Sh e ll N o.
2.4
1
2
0.8
Sh e ll N o.
0
1
Chromosome 10
5
1.6
Sh e ll N o.
2
4
2.4
5
2.4
3
1.2
0
Sh e ll N o.
0
2
2
1.6
% of Chromosom e Signal / % of DAPI
1.2
1
% of Chromosom e Signal / % of DAPI
1
5
% of Chromosom e Signal / % of DAPI
2
1.6
0
% of Chromosom e Signal / % of DAPI
4
2.4
% of Chromosom e Signal / % of DAPI
% of Chromosom e Signal / % of DAPI
Latrunculin A
+ Low Serum
2.4
Sh e ll N o.
BDM
3
Sh e ll N o.
2
% of Chromosom e Signal / % of DAPI
2
0.4
% of Chromosom e Signal / % of DAPI
1
0.8
% of Chromosom e Signal / % of DAPI
5
1.2
% of Chromosom e Signal / % of DAPI
4
% of Chromosom e Signal / % of DAPI
3
1.6
0
% of Chromosom e Signal / % of DAPI
2
0
Sh e ll N o.
BDM
+ Low Serum
0.4
0
1
(c)
0.8
% of Chromosom e Signal / % of DAPI
0
1.2
2
% of Chromosom e Signal / % of DAPI
0.4
1.6
Chromosome X
2.4
2.4
% of Chromosom e Signal / % of DAPI
0.8
% of Chromosom e Signal / % of DAPI
1.2
Phalloidin
Oleate
0.4
1.6
PhalloidinOleate
+ Low Serum
0.8
2
Jasplakinolide Jasplakinolide
+ Low Serum
1.2
% of Chromosom e Signal / % of DAPI
% of Chromosom e Signal / % of DAPI
1.6
2
Chromosome 18
Chromosome 10
2.4
2.4
2.4
2
(b)
Chromosome X
Chromosome 18
Chromosome 10
2.4
% of Chromosom e Signal / % of DAPI
Latrunculin A
(a)
Page 10 of 17
Chromosome repositioning requires nuclear myosin and actin
Figure 7 Chromosome repositioning requires nuclear myosin and actin. The relocation of human chromosomes 10 and 18 after incubation in
low serum is myosin and actin dependent. The nuclear locations of chromosomes 10, 18, and X were determined in normal human proliferating cell
nuclei treated with latrunculin A and phalloidin oleate (inhibitors of actin polymerisation) (a, b) and BDM and jasplakinolide (inhibitors of myosin polymerization) (c, d) before and during incubation in low serum for 15 minutes. The error bars show the standard error of the mean. The stars indicate
a significant difference (P < 0.05) from cells treated only with the inhibitor. Normal control analysis data without any treatment is displayed in (e).
somes still residing in similar nuclear compartments
before and after the serum removal (Figure 9m-r).
The distribution of the nuclear myosin 1β is very interesting in these cells, because it gives a nuclear envelope
distribution, a nucleolar distribution, and a nucleoplasmic distribution (Figure 10a-c). These distributions,
although revealing, are not so surprising, because nuclear
myosin has a binding affinity for the integral nuclear
membrane protein emerin [50] and is involved in RNA
polymerase I transcription [37,40,51]. The distribution in
quiescent cells is quite different, with large aggregates of
NM1β within the nucleoplasm and is missing from the
nuclear envelope and nucleoli. This distribution is similar
to that observed in senescent human dermal fibroblasts
(Mehta, Kill, and Bridger, unpublished data). With
respect to chromosome movement back to a proliferating
position after incubation in low serum, we showed that it
does not occur until 24 to 36 hours after repeated addition of serum to a quiescent culture (Figure 5) [5]. Correlating with this is the rebuilding of daughter nuclei after
mitosis and the return of a proliferating distribution of
NM1β to the nuclear envelope, nucleoli, and nucleoplasm
(Figure 10g, j, p).
Discussion
This study completes the nuclear positioning of all 24
chromosomes in quiescent (serum-starved) normal primary HDFs, as assessed with 2D-FISH and erosion analysis, with a number of chromosomal positions confirmed
in 3D-preserved nuclei. This study, which was performed
Mehta et al. Genome Biology 2010, 11:R5
/>
Page 11 of 17
Immunofluoroscence staining for nuclear myosin1 beta
(a)
(b)
(c)
(d)
(e)
(f)
S
Colu mn 1
% of NMIβ positive nuc le i
Control 0 mins
(g)
(h)
(i)
(j)
(k)
(l)
99.3
Control 15 mins
99.6
NC 0 mins
99.1
NC 15 mins
99.6
Myo1C 0 mins
(m)
(n)
(o)
(p)
(q)
6.9
Myo1C 15 mins
5.4
(r)
Suppression of nuclear myosin expression by short interference RNAs (siRNAs)
Figure 8 Suppression of nuclear myosin expression by short interference RNAs (siRNAs). Normal human dermal fibroblasts (HDFs) were transfected with negative control or MYO1C targeting siRNA (double transfection) and samples for immunofluorescence staining and 2D-FISH (fluorescence in situ hybridization) were fixed 48 hours after the final transfection. Representative images of nuclei stained for anti-NMIβ (red) in control (g, h,
m, n) cells transfected with negative control siRNA (i, j, o, p) and in cells transfected with MYO1C siRNA (k, l, q, r) after 0 and 15 minutes of serum
starvation are displayed. The percentage of nuclei that are positive for NM1β in controls, in cells transfected with negative control siRNA, and in cells
transfected with MYO1C siRNA are displayed in the adjacent table (s).
on similar cell cultures and in the same way as previous
studies, highlighted that some considerable difference
exists in chromosomal nuclear locations between proliferating and quiescent cells. This difference cannot be due
to change in nuclear size or shape, because some chromosomes move toward the nuclear interior, some, to the
nuclear periphery, and some do not alter their location at
all; no significant difference is found between nuclear
shape and size before and after 15 minutes in low serum
(data not shown). Some suggestion exists of a size-correlated distribution in quiescent cells (Table 1), with large
chromosomes toward the nuclear periphery, and small
chromosomes toward the nuclear interior. These results
also confirm the data previously presented, whereby
small chromosomes 13 and 18 had differential nuclear
locations with respect to proliferating and nonproliferating cells [5,9].
How and when the alterations to chromosome positioning occur are two fundamental questions in understanding the role of genome organization in cell cyclerelated events. The genome is probably anchored and
influenced through a number of interactions with nuclear
architecture [52,53], and so any signalled alterations/
modifications to these structures could enable a reorganization of the position of chromosome territories. We
know that when cells are made quiescent (for 7 days) and
are restimulated to enter the cell cycle by the repeated
addition of serum, chromosome 18 is not relocated back
to the nuclear periphery until the cells have been through
mitosis [5].
The question remained open as to when chromosomes
were repositioned after serum removal. We found that
repositioning of chromosomes was very rapid and complete by 15 minutes. The types of repositioning (a) requiring a rebuilding of the nucleus after mitosis, and (b) the
rapid response without a nuclear envelope breakdown,
imply that these processes follow different pathways and
mechanisms, and the latter is consistent with an energydependent mechanism. This rapid movement of chromosomes after growth factor removal may be elicited
through a nuclear motor such as the actin/myosin motorcomplex, containing nuclear actin and nuclear myosin I,
previously shown to be involved in intranuclear movements of chromatin [42-44]. This hypothesis was supported by experiments using inhibitors of ATPase and
GTPase, as well as inhibitors of actin and myosin polymerization. The actin polymerization inhibitor phalloidin
oleate did not inhibit chromosome movement on
removal of high serum. This is important because phalloidin has been shown not to bind to nuclear actin unless
the cells are treated with DMSO [54], which we had not
done.
These data support other literature describing nuclear
motors being involved in chromatin behavior [44]. These
drugs have an effect on a broad range of myosins, and so
we wanted to assess whether specific myosins were
involved; thus we used an siRNA sequence that successfully suppressed the levels of nuclear myosin 1β, as shown
by indirect immunofluorescence. This is the only nuclear
myosin that would have been affected, but we cannot rule
Mehta et al. Genome Biology 2010, 11:R5
/>
Page 12 of 17
I) Control
(c)
(e)
(f)
(h)
(i)
(k)
(g)
(j)
15 minutes
15 minutes
(d)
Chromosome X
Chromosome 18
Chromosome 10
(l)
0 minutes
(b)
0 minutes
(a)
II) Negative control transfection
Chromosome X
Chromosome 18
Chromosome 10
III) MYO1C transfection
(n)
(o)
(q)
(r)
15 minutes
0 minutes
(m)
Chromosome X
Chromosome 18
Chromosome 10
(p)
Chromosome repositioning is inhibited by short interference RNA (siRNA) that suppresses nuclear myosin1β
Figure 9 Chromosome repositioning is inhibited by short interference RNA (siRNA) that suppresses nuclear myosin1β. Chromosome positioning was determined with 2D-FISH (fluorescence in situ hybridization) and erosion analysis, and the normalized position data plotted as histograms
in control cells, in cells transfected with the negative control, and in cells transfected with the MYO1C siRNA construct. In control human dermal fibroblasts (HDFs) and in HDFs transfected with negative control, siRNA chromosome 10 is repositioned from an intermediate nuclear location (a and g,
respectively) to the nuclear periphery (d, j) after 15 minutes of incubation in low serum. Chromosome 18 territories, conversely, are repositioned
from the nuclear periphery (b, h) to the nuclear interior (e, k) after 15 minutes of incubation in low serum in control HDFs and in HDFs transfected
with negative control siRNA. In HDFs transfected with the MYO1C siRNA construct, chromosomes 10 (m, p) and 18 (n, q) do not show repositioning
after 15 minutes of incubation in low serum. Chromosome X remains at the nuclear periphery at all times (c, f, i, l, o, r). Unpaired, unequal variances
two-tailed Students t tests were performed to assess statistical differences. The solid squares indicate a significant difference (P < 0.05) from cells not
incubated in, and the solid circles indicate a significant difference (P < 0.05) from control HDFs.
out that other myosins located within the cytoplasm
(such as myosin 1A and 1C), which may be suppressed as
well, could have a long-range interaction with chromatin,
through the nuclear envelope, possibly through nesprins
and SUN domain proteins [55,56].
However, the distribution of nuclear myosin 1β that we
observe in proliferating cells correlates with its properties
and functions, as described in the literature, and implicates the nuclear envelope in chromosome/chromatin
movement. In previous studies, we analyzed chromosome position in cells that have defects of the nuclear
lamina, through mutations in nuclear lamin A or emerin,
both nuclear envelope proteins. These cells displayed a
nonproliferating distribution of chromosomes even
though they were proliferating [9,57]. The behavior of
nuclear motor proteins in these cells must be addressed.
Further, the distribution of NM1β from aggregates in quiescent cells to the nuclear envelope, nucleoli, and nucleoplasm is not observed until more than 24 hours after
serum readdition, which correlated with when specific
chromosomes become relocated from their quiescent
position to their proliferating location.
Conclusions
We demonstrated that some chromosomes occupy different nuclear compartments in proliferating and serumstarved quiescent cells. Most interestingly, this repositioning of chromosomes is very rapid, taking less than 15
minutes, and requires energy and active actin and myosin
function. The myosin involved could be nuclear myosin
1β, which has dramatically different distribution in quiescent nuclei as compared with proliferating cell nuclei.
Mehta et al. Genome Biology 2010, 11:R5
/>
Page 13 of 17
(a)
(d)
(g)
(j)
(m)
(b)
(e)
(h)
(k)
(n)
(c)
(f)
(i)
(l)
(o)
(p)
Anti-nuclear myosin 1b (NM1β) staining patterns in proliferating cells, quiescent cells, and after restimulation
Figure 10 Anti-nuclear myosin 1b (NM1β) staining patterns in proliferating cells, quiescent cells, and after restimulation. Normal 2DD human dermal fibroblasts (HDFs) were serum starved for 7 days to induce quiescence. The cells were then restimulated with fresh serum, and samples
were collected at 0, 24, 36 and 48 hours after serum restoration. Samples were also collected before serum withdrawal (proliferating cells). The samples
were then fixed with methanol/acetone (1:1), and the distribution of NMIβ was assessed by performing an indirect immunofluorescence assay for
NMIβ. Images in (a, c) display the distribution of NMIβ in proliferating cells, whereas those in (d and f) show the distribution of NMIβ after 0, 24, 36 and
48 hours after restimulation of quiescent fibroblasts. The table (p) displays the percentage of cells displaying various patterns of NMIβ staining after
restimulation. Error is indicated by standard deviation. Scale bar = 10 μm.
Cell culture
Inhibitors of ATPase, GTPase, myosin, and actin
polymerization
Human dermal fibroblasts (HDFs), 2DD [58] were grown
in Dulbecco's Modified Eagles Medium (DMEM) containing 10% newborn calf serum (vol/vol NCS), glutamine, and antibiotics, at 37°C. Cells were passaged
twice a week and seeded at a density of 3 × 10³/cm2. Cells
were made quiescent by incubation in 10% NCS DMEM
for 2 days, washing in serum-free medium, followed by
incubation in DMEM containing 0.5% NCS (vol/vol) for 7
days.
To inhibit the activity of ATPase or GTPase, cells were
treated with 100 μmol/L ouabain (Calbiochem-Novabiochem, Beeston, Nottingham, UK) for 30 minutes [59] or
with 100 μmol/L AG10 (Calbiochem) for 20 or 30 minutes before serum withdrawal [60,61], respectively. To
inhibit the polymerization of actin, cells were treated
with 1 μmol/L either Latrunculin A (Calbiochem) [62,63]
or phalloidin oleate (Calbiochem) [64] for 30 minutes.
Myosin polymerization was inhibited by treating cells
Materials and methods
Mehta et al. Genome Biology 2010, 11:R5
/>
either with 10 mmol/L 2,3-butanedione 2-monoxime
(Calbiochem) for 15 minutes [65-67] or 1 μmol/L Jasplakinolide (Calbiochem) for 60 minutes [68]. See Additional file 5.
Fluorescence in situ hybridization
For the two-dimensional FISH assay, fibroblasts were harvested and placed in hypotonic buffer (0.075 mol/L KCl,
wt/vol) for 15 minutes at room temperature. After centrifugation at 400 g, cells were fixed in 3:1 (vol/vol) methanol/acetic acid (vol/vol) for 1 hour on ice. The fixation
step was repeated between 5 and 7 times before cells were
dropped onto humidified glass microscope slides. The
slides were aged at room temperature for 2 days or for an
hour at 70°C before being subjected to dehydration
through an ethanol series of 70%, 90%, and 100%, for 5
minutes each. The cells were denatured in 70% formamide, 2 × sodium saline citrate buffer (SSC), pH 7, at 70°C
for 2 minutes. After denaturation, the slides were immediately plunged into ice-cold 70% ethanol for 5 minutes
and then taken through the ethanol series and air-dried.
For three-dimensional FISH assay, fibroblasts were
washed in 1 × PBS and then fixed in 4% paraformaldehyde (wt/vol) in 1 × PBS for 10 minutes. The cells were
then permeabilized with 0.5% Triton-X100 (vol/vol) and
0.5% saponin (wt/vol) in 1 × PBS solution for 20 minutes.
The cells were then incubated in 20% glycerol, 1 × PBS
solution for at least 30 minutes before being snap-frozen
in liquid nitrogen. The cells were repeatedly frozen and
thawed for up to 5 times. After the freeze/thaw cycles, the
cells were then washed in 1 × PBS for at least 30 minutes
and then incubated in 0.1 N HCl for 10 minutes for
depurination. The cells were then washed in 2 × SSC for
15 minutes, with three changes of the buffer, and incubated in 50% formamide, 2 × SSC, at pH 7.0, overnight.
For denaturation, cells were incubated at 73°C to 76°C in
70% formamide, 2 × SSC, pH 7 solution for 3 minutes and
then were immediately transferred to 50% formamide, 2 ×
SSC, pH 7 solution for 1 minute at the same temperature.
Chromosome paints for HSA 10, 13, 18, and X were
amplified from flow-sorted whole-chromosome templates and labelled with biotin-dUTP by DOP-PCR [69].
The 200- to 400-μg chromosome paints, 7 μg of C0t-1
DNA, and 3 μg of herring sperm were used per slide. All
other chromosome territories were delineated with
directly labelled whole human chromosome paints
(Qbiogene, Cambridge, UK). Probes were denatured at
70°C for 10 minutes with reannealing of repetitive
sequences at 37°C for 30 to 120 minutes. Hybridization
was performed in a humified chamber for 18 to 24 hours
at 37°C. The slides were washed in three changes of 50%
formamide, 2 × SSC, pH 7, at 45°C over a 15-minute
period, followed by three changes of 0.1 × SSC prewarmed to 60°C over a 15-minute period at 45°C.
Page 14 of 17
The slides were then transferred to 4 × SSC at room
temperature. Slides hybridized with the in-house biotinlabelled probes were then incubated with a blocking solution of 4% bovine serum albumin (BSA; Sigma Aldrich) of
4 × SSC followed by detection with streptavidin-cyanine
3 (Amersham Life Science Ltd; 1:200 dilution in 0.1%
BSA/4 × SSC). The slides were washed in three changes
of 4 × SSC/0.05% Tween 20 (vol/vol) for 5 minutes each.
Suppressing the expression of nuclear myosin 1β by
interference RNA
To suppress nuclear myosin 1β expression, young proliferating HDFs were seeded at 1 × 10⁴ cells per well in a 12well plate. Transfection efficiency was previously determined with siGLO-labelled siRNA to be more than 95%.
The siRNA transfection was carried out with 2 μl Dharmafect 1 and 50 μl of either negative control (2 μmol/L
ON-TARGETplus Non-targeting Pool; Thermo Scientific) or myosin-targeting siRNA (2 μmol/L ON-TARGETplus SMART pool, human MYO1C; Thermo
Scientific Cat number L-015121-00) in 200 μl serum-free
medium. Complete medium was added to the transfection mix to ensure that transfections were carried out in
serum-containing medium with a final siRNA concentration of 100 nmol/L per well/dish. Six hours after transfection, the medium in the well was replaced with normal
growth medium. At 24 hours after the first transfection, a
second identical transfection was performed to increase
the amount of suppression. Samples were collected at 48
hours after final transfection and fixed for 2D FISH and
indirect immunofluorescence.
Indirect immunofluorescence
Diluted rabbit anti-Ki-67 antibody (Dako; 1:1,500 dilution in PBS/1% NCS), 40 μl, was placed on the slides after
FISH for 1 hour at 37°C. Slides were washed in PBS for 15
minutes, with three changes. The slides were incubated
with 40 μl of swine anti-rabbit secondary antibody conjugated either to fluorescein isothiocynate (FITC, Dako) or
to tetrarhodamine isothiocynate (TRITC, Dako) (1:30
dilution in 1% NCS/PBS) for 1 hour at 37°C.
For anti-nuclear myosin 1β staining, cells were grown
on glass coverslips and fixed in 1:1 (vol/vol) methanol/
acetone for 10 minutes on ice. Rabbit anti-NM1β (SigmaAldrich) was diluted in PBS/1% NCS (1:200) and incubated with the fixed cells at room temperature for 1 hour
after washing thrice in PBS swine anti-rabbit conjugated
to tetrarhodamine isothiocyanate was incubated for 1
hour at room temperature.
Thereafter the slides were washed in PBS with three
changes over a 15-minute period and mounted in selfsealing Vectashield mounting medium (Vector Laboratories) containing the counterstain 4, 6-diamidino-2-phe-
Mehta et al. Genome Biology 2010, 11:R5
/>
nylindole (DAPI).
Image capture and analysis
Two-dimensional FISH
Digital grey-scale images of random nuclei were captured
by using a Photometrics cooled charged-coupled device
(CCD) camera, pseudocolored, and merged by using Digital Scientific software, the Quips Pathvysion, Smart Capture VP V1.4, a Leica fluorescence microscope (Leitz
DMRB) with Plan Fluotar 100 × oil-immersion lens. The
images were run through a simple erosion script in IPLab
spectrum software, as described in [4]. The DAPI image
of the nucleus is outlined and divided into five concentric
shells of equal area, the first shell being most peripheral,
and the innermost denoting the interior of the nucleus.
The script measures the pixel intensity of DAPI and the
chromosome probe in these five shells. The probe signal
was normalized by dividing the percentage of the probe
by the percentage of DAPI signal in each shell. Histograms were plotted with standard error bars representing
the standard error of the mean (± SEM). Simple statistical
analyses were performed by using the unpaired twotailed Student's t test with Microsoft Excel.
Page 15 of 17
Additional material
Additional data file 1
The chromosome position of chromosomes 10, 13, 18, and X 30 minutes
after serum removal from a proliferating culture of human dermal fibroblasts in a 2D study (1A-D), and the 3D analysis of the nuclear position of
chromosomes 10 and X after 15 minutes after serum removal from a proliferating culture (1E).
Additional data file 2
Treating cells with 0.1% DMSO, in which the drugs are dissolved, does not
interfere with the chromosome-repositioning response.
Additional data file 3
3D analyses of chromosome position for chromosomes 10 and X after
treatment with GTPase inhibitor AG10 and serum removal (3A), after treatment with phalloidin oleate and serum removal (3B) and after treatment
with BDM and serum removal (3C).
Additional data file 4
The DAPI distribution with each shell of the 2D erosion analysis script for
each experiment performed, revealing that the DNA content did not alter
after any of the treatments (4).
Additional data file 5
Three-dimensional FISH
The images of nuclei prepared by three-dimensional
FISH were captured by using a Nikon confocal laser scanning microscope (TE2000-S) equipped with a 60 ×/1.49
Nikon Apo oil-immersion objective. The microscope was
controlled by Nikon confocal microscope C1 (EZ-C1)
software, version 3.00. Stacks of optical sections with an
axial distance of 0.2 μm were collected from 20 random
nuclei. Stacks of eight-bit grey-scale 2D images were
obtained with a pixel dwell of 4.56, and eight averages
were taken for each optical image. The positioning of
chromosomes in relation to the nuclear periphery was
assessed by performing measurements with Imaris Software (Bitplane Scientific Solutions), whereby the distance
in micrometers between the geometric center of each
chromosome territory and the nearest nuclear periphery,
as determined with DAPI staining, in three dimensions.
These data were not normalized for size, but when the
data were normalized by dividing by the length of the
major axis + the length of the minor axis divided by 2, or
the length of the major axis alone, the relative positions of
the individual chromosomes in frequency distributions
did not change.
Frequency distribution curves were plotted with the
distance between the geometric center of chromosome
territory and the nearest nuclear periphery on the x-axis
in actual micrometers, and the frequency, on the y-axis.
A table describing the inhibitors and drugs used in this study.
Abbreviations
BDM: 2,3-butanedione 2-monoxime; FITC: fluorescein isothiocyanate; G0: quiescence; HDF: human dermal fibroblast; I: interior; IM: intermediate; NCS: newborn calf serum; NMIβ: nuclear myosin Iβ; P: peripheral; TRITC: tetrarhodamine
isothiocyanate.
Authors' contributions
ISM provided material, experimentation, data collection and analysis, writing
manuscript, and intellectual input. MA provided some data for nuclear shape
and size and some intellectual input for siRNA. AH provided intellectual input
for siRNA experimentation and writing of the manuscript. JMB participated in
data analysis, writing the manuscript, and intellectual input.
Acknowledegments
We are grateful to Prof. Wendy Bickmore and Dr. Paul Perry for the simple erosion script for analysis of 2D-FISH data. We also thank Dr. Julio Masabanda for
providing whole-chromosome flow-sorted templates. The authors also thank
Drs. Ian Kill and Karen Meaburn for helpful suggestions concerning the manuscript.
Author Details
1Centre for Cell and Chromosome Biology, Division of Biosciences, School of
Health Sciences and Social Care, Brunel University, Kingston Lane, Uxbridge,
UB8 3PH, UK and
2Brunel Institute for Cancer Genetics and Pharmacogenomics, Division of
Biosciences, School of Health Sciences and Social Care, Brunel University,
Kingston Lane, Uxbridge, UB8 3PH, UK
Received: 25 September 2009 Revised: 23 November 2009
Accepted: 13 January 2010 Published: 13 January 2010
© properly cited.2010, 11:R5 distributed under the terms of the Creative
This is anBiologyaccess article Commons Attribution License (http://http:/creativecommons.org/licenses/by/2.0), which permits unrestricted use, distribution, and reproduction in any medium, provided the original work
Genome open
is 2010 Mehta et al., licensee BioMed Central Ltd.
article is available from:
Mehta et al. Genome Biology 2010, 11:R5
/>
References
1. Cremer T, Cremer C: Rise, fall and resurrection of chromosome
territories: a historical perspective; part II: fall and resurrection of
chromosome territories during the 1950s to 1980s; part III:
chromosome territories and the functional nuclear architecture:
experiments and models from the 1990s to the present. Eur J
Histochem 2006, 50:223-272.
2. Meaburn KJ, Misteli T: Cell biology: chromosome territories. Nature
2007, 445:379-781.
3. Foster HA, Bridger JM: The genome and the nucleus: a marriage made
by evolution: genome organisation and nuclear architecture.
Chromosoma 2005, 114:212-229.
4. Boyle S, Gilchrist S, Bridger JM, Mahy NL, Ellis JA, Bickmore WA: The spatial
organization of human chromosomes within the nuclei of normal and
emerin-mutant cells. Hum Mol Genet 2001, 10:211-219.
5. Bridger JM, Boyle S, Kill IR, Bickmore WA: Re-modelling of nuclear
architecture in quiescent and senescent human fibroblasts. Curr Biol
2000, 10:149-152.
6. Croft JA, Bridger JM, Boyle S, Perry P, Teague P, Bickmore WA: Differences
in the localization and morphology of chromosomes in the human
nucleus. J Cell Biol 1999, 145:1119-1131.
7. Meaburn KJ, Newbold RF, Bridger JM: Positioning of human
chromosomes in murine cell hybrids according to synteny.
Chromosoma 2008, 117:579-591.
8. Meaburn KJ, Levy N, Toniolo D, Bridger JM: Chromosome positioning is
largely unaffected in lymphoblastoid cell lines containing emerin or Atype lamin mutations. Biochem Soc Trans 2005, 33:1438-1440.
9. Meaburn KJ, Cabuy E, Bonne G, Levy N, Morris GE, Novelli G, Kill IR, Bridger
JM: Primary laminopathy fibroblasts display altered genome
organization and apoptosis. Aging Cell 2007, 6:139-153.
10. Bolzer A, Kreth G, Solovei I, Koehler D, Saracoglu K, Fauth C, Muller S, Eils R,
Cremer C, Speicher MR, Cremer T: Three-dimensional maps of all
chromosomes in human male fibroblast nuclei and prometaphase
rosettes. PLoS Biol 2005, 3:e157.
11. Mora L, Sanchez I, Garcia M, Ponsa M: Chromosome territory positioning
of conserved homologous chromosomes in different primate species.
Chromosoma 2006, 115:367-375.
12. Sun HB, Shen J, Yokota H: Size-dependent positioning of human
chromosomes in interphase nuclei. Biophys J 2000, 79:184-190.
13. Habermann FA, Cremer M, Walter J, Kreth G, von Hase J, Bauer K, Wienberg
J, Cremer C, Cremer T, Solovei I: Arrangements of macro- and
microchromosomes in chicken cells. Chromosome Res 2001, 9:569-584.
14. Mayer R, Brero A, von Hase J, Schroeder T, Cremer T, Dietzel S: Common
themes and cell type specific variations of higher order chromatin
arrangements in the mouse. BMC Cell Biol 2005, 6:44.
15. Neusser M, Schubel V, Koch A, Cremer T, Muller S: Evolutionarily
conserved, cell type and species-specific higher order chromatin
arrangements in interphase nuclei of primates. Chromosoma 2007,
116:307-320.
16. Tanabe H, Habermann FA, Solovei I, Cremer M, Cremer T: Non-random
radial arrangements of interphase chromosome territories:
evolutionary considerations and functional implications. Mutat Res
2002, 504:37-45.
17. Fraser P, Bickmore W: Nuclear organization of the genome and the
potential for gene regulation. Nature 2007, 447:413-417.
18. Parada L, Misteli T: Chromosome positioning in the interphase nucleus.
Trends Cell Biol 2002, 12:425-432.
19. Osborne CS, Chakalova L, Brown KE, Carter D, Horton A, Debrand E,
Goyenechea B, Mitchell JA, Lopes S, Reik W, Fraser P: Active genes
dynamically colocalize to shared sites of ongoing transcription. Nat
Genet 2004, 36:1065-1071.
20. Osborne CS, Chakalova L, Mitchell JA, Horton A, Wood AL, Bolland DJ,
Corcoran AE, Fraser P: Myc dynamically and preferentially relocates to a
transcription factory occupied by IgH. PLoS Biol 2007, 5:e192.
21. Spilianakis CG, Lalioti MD, Town T, Lee GR, Flavell RA: Interchromosomal
associations between alternatively expressed loci. Nature 2005,
435:637-645.
22. Scheuermann MO, Tajbakhsh J, Kurz A, Saracoglu K, Eils R, Lichter P:
Topology of genes and nontranscribed sequences in human
interphase nuclei. Exp Cell Res 2004, 301:266-279.
Page 16 of 17
23. Volpi EV, Chevret E, Jones T, Vatcheva R, Williamson J, Beck S, Campbell
RD, Goldsworthy M, Powis SH, Ragoussis J, Trowsdale J, Sheer D: Largescale chromatin organization of the major histocompatibility complex
and other regions of human chromosome 6 and its response to
interferon in interphase nuclei. J Cell Sci 2000, 113:1565-1576.
24. Mahy NL, Perry PE, Gilchrist S, Baldock RA, Bickmore WA: Spatial
organization of active and inactive genes and noncoding DNA within
chromosome territories. J Cell Biol 2002, 157:579-589.
25. Galiova G, Bartova E, Kozubek S: Nuclear topography of beta-like globin
gene cluster in IL-3-stimulated human leukemic K-562 cells. Blood Cells
Mol Dis 2004, 33:4-14.
26. Williams RR, Broad S, Sheer D, Ragoussis J: Subchromosomal positioning
of the epidermal differentiation complex (EDC) in keratinocyte and
lymphoblast interphase nuclei. Exp Cell Res 2002, 272:163-175.
27. Chambeyron S, Da Silva NR, Lawson KA, Bickmore WA: Nuclear reorganisation of the Hoxb complex during mouse embryonic
development. Development 2005, 132:2215-2223.
28. Chambeyron S, Bickmore WA: Chromatin decondensation and nuclear
reorganization of the HoxB locus upon induction of transcription.
Genes Dev 2004, 18:1119-1130.
29. Szczerbal I, Foster HA, Bridger JM: The spatial repositioning of
adipogenesis genes is correlated with their expression status in a
porcine mesenchymal stem cell adipogenesis model system.
Chromosoma 2009, 118:647-663.
30. Heard E, Bickmore W: The ins and outs of gene regulation and
chromosome territory organisation. Curr Opin Cell Biol 2007,
19:311-316.
31. Kuroda M, Tanabe H, Yoshida K, Oikawa K, Saito A, Kiyuna T, Mizusawa H,
Mukai K: Alteration of chromosome positioning during adipocyte
differentiation. J Cell Sci 2004, 117:5897-5903.
32. Kim SH, McQueen PG, Lichtman MK, Shevach EM, Parada LA, Misteli T:
Spatial genome organization during T-cell differentiation. Cytogenet
Genome Res 2004, 105:292-301.
33. Foster HA, Abeydeera LR, Griffin DK, Bridger JM: Non-random
chromosome positioning in mammalian sperm nuclei, with migration
of the sex chromosomes during late spermatogenesis. J Cell Sci 2005,
118:1811-1820.
34. Hu Q, Kwon YS, Nunez E, Cardamone MD, Hutt KR, Ohgi KA, Garcia-Bassets
I, Rose DW, Glass CK, Rosenfeld MG, Fu XD: Enhancing nuclear receptorinduced transcription requires nuclear motor and LSD1-dependent
gene networking in interchromatin granules. Proc Natl Acad Sci USA
2008, 105:19199-19204.
35. Bartova E, Kozubek S: Nuclear architecture in the light of gene
expression and cell differentiation studies. Biol Cell 2006, 98:323-336.
36. Bettinger BT, Gilbert DM, Amberg DC: Actin up in the nucleus. Nat Rev
Mol Cell Biol 2004, 5:410-415.
37. Fomproix N, Percipalle P: An actin-myosin complex on actively
transcribing genes. Exp Cell Res 2004, 294:140-148.
38. Grummt I: Life on a planet of its own: regulation of RNA polymerase I
transcription in the nucleolus. Genes Dev 2003, 17:1691-1702.
39. Pestic-Dragovich L, Stojiljkovic L, Philimonenko AA, Nowak G, Ke Y,
Settlage RE, Shabanowitz J, Hunt DF, Hozak P, de Lanerolle P: A myosin I
isoform in the nucleus. Science 2000, 290:337-341.
40. Philimonenko VV, Zhao J, Iben S, Dingova H, Kysela K, Kahle M, Zentgraf H,
Hofmann WA, de Lanerolle P, Hozak P, Grummt I: Nuclear actin and
myosin I are required for RNA polymerase I transcription. Nat Cell Biol
2004, 6:1165-1172.
41. Vreugde S, Ferrai C, Miluzio A, Hauben E, Marchisio PC, Crippa MP, Bussi M,
Biffo S: Nuclear myosin VI enhances RNA polymerase II-dependent
transcription. Mol Cell 2006, 23:749-755.
42. Hofmann WA, Johnson T, Klapczynski M, Fan JL, de Lanerolle P: From
transcription to transport: emerging roles for nuclear myosin I.
Biochem Cell Biol 2006, 84:418-426.
43. Dundr M, Ospina JK, Sung MH, John S, Upender M, Ried T, Hager GL,
Matera AG: Actin-dependent intranuclear repositioning of an active
gene locus in vivo. J Cell Biol 2007, 179:1095-1103.
44. Chuang CH, Carpenter AE, Fuchsova B, Johnson T, de Lanerolle P, Belmont
AS: Long-range directional movement of an interphase chromosome
site. Curr Biol 2006, 16:825-831.
45. Cavellan E, Asp P, Percipalle P, Farrants AK: The WSTF-SNF2h chromatin
remodeling complex interacts with several nuclear proteins in
transcription. J Biol Chem 2006, 281:16264-16271.
Mehta et al. Genome Biology 2010, 11:R5
/>
46. Guelen L, Pagie L, Brasset E, Meuleman W, Faza MB, Talhout W, Eussen BH,
de Klein A, Wessels L, de Laat W, van Steensel B: Domain organization of
human chromosomes revealed by mapping of nuclear lamina
interactions. Nature 2008, 453:948-951.
47. Bridger JM, Kill IR, Lichter P: Association of pKi-67 with satellite DNA of
the human genome in early G1 cells. Chromosome Res 1998, 6:13-24.
48. Bridger JM, Herrmann H, Munkel C, Lichter P: Identification of an
interchromosomal compartment by polymerization of nucleartargeted vimentin. J Cell Sci 1998, 111:1241-1253.
49. Gillespie PG, Albanesi JP, Bahler M, Bement WM, Berg JS, Burgess DR,
Burnside B, Cheney RE, Corey DP, Coudrier E, de Lanerolle P, Hammer JA,
Hasson T, Holt JR, Hudspeth AJ, Ikebe M, Kendrick-Jones J, Korn ED, Li R,
Mercer JA, Milligan RA, Mooseker MS, Ostap EM, Petit C, Pollard TD, Sellers
JR, Soldati T, Titus MA: Myosin-I nomenclature. J Cell Biol 2001,
155:703-704.
50. Holaska JM, Wilson KL: Multiple roles for emerin: implications for EmeryDreifuss muscular dystrophy. Anat Rec A Discov Mol Cell Evol Biol 2006,
288:676-680.
51. Percipalle P, Fomproix N, Cavellan E, Voit R, Reimer G, Kruger T, Thyberg J,
Scheer U, Grummt I, Farrants AK: The chromatin remodelling complex
WSTF-SNF2h interacts with nuclear myosin 1 and has a role in RNA
polymerase I transcription. EMBO Rep 2006, 7:525-530.
52. Bridger JM, Foeger N, Kill IR, Herrmann H: The nuclear lamina: both a
structural framework and a platform for genome organization. FEBS J
2007, 274:1354-1361.
53. Mehta IS, Figgitt M, Clements CS, Kill IR, Bridger JM: Alterations to nuclear
architecture and genome behavior in senescent cells. Ann N Y Acad Sci
2007, 1100:250-263.
54. Sanger JW, Sanger JM, Kreis TE, Jockusch BM: Reversible translocation of
cytoplasmic actin into the nucleus caused by dimethyl sulfoxide. Proc
Natl Acad Sci USA 1980, 77:5268-5272.
55. Starr DA: A nuclear-envelope bridge positions nuclei and moves
chromosomes. J Cell Sci 2009, 122:577-586.
56. Haque F, Lloyd DJ, Smallwood DT, Dent CL, Shanahan CM, Fry AM,
Trembath RC, Shackleton S: SUN1 interacts with nuclear lamin A and
cytoplasmic nesprins to provide a physical connection between the
nuclear lamina and the cytoskeleton. Mol Cell Biol 2006, 26:3738-3751.
57. Mehta IS, Elcock LS, Amira M, Kill IR, Bridger JM: Nuclear motors and
nuclear structures containing A-type lamins and emerin: Is there a
functional link? Biochem Soc Trans 2008, 36:1384-1388.
58. Bridger JM, Kill IR, O'Farrell M, Hutchison CJ: Internal lamin structures
within G1 nuclei of human dermal fibroblasts. J Cell Sci 1993,
104:297-306.
59. Senol M, Ozerol IH, Patel AV, Skoner DP: The effect of Na+-K+ ATPase
inhibition by ouabain on histamine release from human cutaneous
mast cells. Mol Cell Biochem 2007, 294:25-29.
60. Moriya M, Linder MC: Vesicular transport and apotransferrin in
intestinal iron absorption, as shown in the Caco-2 cell model. Am J
Physiol Gastrointest Liver Physiol 2006, 290:G301-G309.
61. Soltoff SP: Evidence that tyrphostins AG10 and AG18 are mitochondrial
uncouplers that alter phosphorylation-dependent cell signaling. J Biol
Chem 2004, 279:10910-10918.
62. Munter S, Enninga J, Vazquez-Martinez R, Delbarre E, David-Watine B,
Nehrbass U, Shorte SL: Actin polymerisation at the cytoplasmic face of
eukaryotic nuclei. BMC Cell Biol 2006, 7:23.
63. Schoenenberger CA, Buchmeier S, Boerries M, Sutterlin R, Aebi U,
Jockusch BM: Conformation-specific antibodies reveal distinct actin
structures in the nucleus and the cytoplasm. J Struct Biol 2005,
152:157-168.
64. Laudadio RE, Millet EJ, Fabry B, An SS, Butler JP, Fredberg JJ: Rat airway
smooth muscle cell during actin modulation: rheology and glassy
dynamics. Am J Physiol Cell Physiol 2005, 289:C1388-C1395.
65. Cramer LP, Mitchison TJ: Myosin is involved in postmitotic cell
spreading. J Cell Biol 1995, 131:179-189.
66. Fabian L, Troscianczuk J, Forer A: Calyculin A, an enhancer of myosin,
speeds up anaphase chromosome movement. Cell Chromosome 2007,
6:1.
67. Soeno Y, Shimada Y, Obinata T: BDM (2,3-butanedione monoxime), an
inhibitor of myosin-actin interaction, suppresses myofibrillogenesis in
skeletal muscle cells in culture. Cell Tissue Res 1999, 295:307-316.
68. McDonald D, Carrero G, Andrin C, de Vries G, Hendzel MJ: Nucleoplasmic
beta-actin exists in a dynamic equilibrium between low-mobility
Page 17 of 17
polymeric species and rapidly diffusing populations. J Cell Biol 2006,
172:541-552.
69. Telenius H, Pelmear AH, Tunnacliffe A, Carter NP, Behmel A, FergusonSmith MA, Nordenskjold M, Pfragner R, Ponder BA: Cytogenetic analysis
by chromosome painting using DOP-PCR amplified flow-sorted
chromosomes. Genes Chromosomes Cancer 1992, 4:257-263.
doi: 10.1186/gb-2010-11-1-r5
Cite this article as: Mehta et al., Rapid chromosome territory relocation by
nuclear motor activity in response to serum removal in primary human fibroblasts Genome Biology 2010, 11:R5