Báo cáo y học: "A fuzzy gene expression-based computational approach improves breast cancer prognostication" doc
Bạn đang xem bản rút gọn của tài liệu. Xem và tải ngay bản đầy đủ của tài liệu tại đây (1.46 MB, 18 trang )
Haibe-Kains et al. Genome Biology 2010, 11:R18
/>
Open Access
METHOD
A fuzzy gene expression-based computational
approach improves breast cancer prognostication
Method
Benjamin Haibe-Kains1,2, Christine Desmedt1, Franỗoise Rothé1, Martine Piccart1, Christos Sotiriou*1 and
Gianluca Bontempi2
prognosis
order to
into account several molecular breast cancer
A fuzzy provide more approach that takes
GENIUS computationalaccuratesubtypes in
Abstract
Early gene expression studies classified breast tumors into at least three clinically relevant subtypes. Although most
current gene signatures are prognostic for estrogen receptor (ER) positive/human epidermal growth factor receptor 2
(HER2) negative breast cancers, few are informative for ER negative/HER2 negative and HER2 positive subtypes. Here
we present Gene Expression Prognostic Index Using Subtypes (GENIUS), a fuzzy approach for prognostication that
takes into account the molecular heterogeneity of breast cancer. In systematic evaluations, GENIUS significantly
outperformed current gene signatures and clinical indices in the global population of patients.
Background
Early gene expression studies [1-6] classify breast cancer
into at least three clinically relevant molecular subtypes:
basal-like (predominantly estrogen receptor (ER) negative
and human epidermal growth factor receptor 2 (HER2) negative), HER2-positive, and luminal-like (ER-positive)
tumors. Although this classification has changed the way
clinicians perceive the disease, it has been difficult to use
the initial microarray-based clustering models in clinical
practice. The reason is that these models suffer from the
drawbacks of the hierarchical clustering method itself,
namely its instability and the difficulty associated with
using it for new data [7]. To address these concerns, we
recently used model-based clustering to introduce an alternative model able to identify different molecular subtypes
[8,9]. We have shown that this model is capable of fuzzy
classification [10,11]: a patient's tumor belongs simultaneously to each molecular subtype with some probability
(degree of membership) in a way that is reproducible and
robust because clinically relevant molecular subtypes are
identified in several public datasets using different populations of breast cancer patients and different microarray
technologies. However, we observe that a significant pro-
* Correspondence:
1
Functional Genomics and Translational Research Unit, Medical Oncology
Department, Jules Bordet Institute, Boulevard de Waterloo, Brussels, 1000,
Belgium
†
Contributed equally
portion of tumors are elusive with respect to subtype, their
phenotype lying between several molecular subtypes.
During recent years, several research groups have used
gene expression profiling technology to develop prognostic
signatures (reviewed in [12]). These signatures add prognostic information to commonly used clinico-pathological
criteria and consequently may help to reduce the current
over-treatment of patients by better identifying those
patients who will most benefit from treatment. Given this
tremendous clinical potential, two of these signatures are
now being evaluated in large clinical trials to confirm their
prognostic value [13,14].
We demonstrated in a recent meta-analysis of publicly
available gene-expression and clinical data from almost
3,000 breast cancer patients that the majority of these prognostic signatures showed similar performance despite the
limited overlap of genes [8,9]. Interestingly, we also
observed that the proliferation-related genes drove the performance of these signatures, which were useful in classifying ER+/HER2- patients as being at low or high risk for
recurrence, but were less informative for the ER-/HER2(often referred to as the 'triple-negative' subtype due to
absence of estrogen, progesterone and HER2 receptors) and
HER2+ subgroups of patients whose tumors are mostly
highly proliferative and considered, therefore, to be high
risk. In addition, clinico-pathological criteria revealed independent prognostic information, suggesting that both
genomic and clinical variables could be combined in a common prognostic decision algorithm.
© 2010 Haibe-Kains et al.; licensee BioMed Central Ltd. This is an open access article distributed under the terms of the Creative Commons Attribution License ( which permits unrestricted use, distribution, and reproduction in any medium, provided the original work is properly cited.
Haibe-Kains et al. Genome Biology 2010, 11:R18
/>
In short, although these signatures provide prognostic
information that supplements the currently used clinicopathological criteria, there is still room for improvement,
since they add only minimal value to triple-negative and
HER2-positive disease. In this article, we propose a novel,
fuzzy computational approach for breast cancer prognostication that makes it possible to combine risk prediction
models specific to each molecular breast cancer subtype.
We refer to this approach as fuzzy since the risk prediction
for a patient is computed by considering their tumor to
belong simultaneously to each of the breast cancer molecular subtypes with some probability.
Results
Development of the risk prediction model GENIUS
The novel, fuzzy computational approach we designed for
breast cancer prognostication enabled us to build a new risk
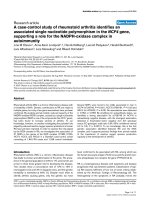
prediction model, called GENIUS (Gene Expression progNostic Index Using Subtypes). This three-step model is
illustrated in Figure 1. Basically, the first step is fuzzy subtype identification by assessing the probability of a patient
belonging to each of the three breast cancer molecular subtypes (ER-/HER2-, HER2+ and ER+/HER2-); the second
step identifies the prognostic gene signatures specific to
each subtype and/or uses existing signatures; and the third
step combines the probabilities with the corresponding subtype signature scores, which then results in the final
GENIUS risk prediction score. We focused our survival
analysis on untreated node-negative patients in order to
build a prognostic model for early stage breast cancer and
to avoid any confounding factors due to treatment effects
on survival (untreated).
Identification of the breast cancer molecular subtypes
To assess the probability of a patient belonging to each of
the three molecular subtypes, we used model-based clustering in a two-dimensional space [8,9]. These two dimensions
were defined by the ESR1 and ERBB2 module scores (representing the ER and HER2 phenotypes, respectively),
since these genes were shown to be the main discriminators
for breast cancer subtyping as confirmed by Kapp et al. [2].
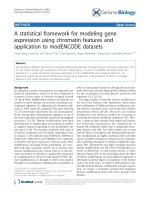
In a database of more than 3,300 primary breast tumors
retrieved from multiple public datasets (Figure S1 and
Table S1 in Additional file 1), we observed a high proportion of well characterized ER+/HER2- subtype (48%) and
lower proportions of well characterized ER-/HER2- (20%)
and HER2+ (12%) subtypes (Figure 2), which concurs with
the literature [15-17]. However, we also found that the
tumor subtype for a significant proportion of patients is elusive (Figure 2). For example, we observed that the tumor
phenotype lay between the ER+/HER2- and HER2+ molecular subtypes for 13% of the population. The probabilities
of patients belonging to each of the breast cancer molecular
subtypes are provided in Table S2 in Additional file 1 and
Additional file 2.
Page 2 of 18
Identification of the subtype prognostic signatures
We used VDX (a breast cancer microarray dataset introduced by Wang, Minn et al. [18,19]) as a training set since
this population contained the largest sets of ER-/HER2(99), HER2+ (54) and ER+/HER2- (191) tumors from
node-negative patients who had not received any systemic
treatment (referred to as 'untreated/').
Many prognostic gene signatures have already been published in the global breast cancer population, and it was
shown in a large comprehensive meta-analysis of publicly
available expression data that these signatures are informative in the ER+/HER2- subtype and that proliferationrelated genes are their common denominator [8]. Given the
considerable level of prognostic evidence in this subtype,
we did not generate a new prognostic signature for ER+/
HER2- tumors, but considered instead the proliferation
module (AURKA) [8] as the subtype signature. In contrast,
since the ER-/HER2- and HER2+ subtypes represent only
small proportions of breast tumors, very few prognostic signatures have been reported thus far for these two subtypes
[8,19,20]. Therefore, here we developed a gene selection
approach taking into account the probability of a patient
belonging to these two subtypes in order to make full use of
the available microarray and survival data ('Identification of
prognostic genes' in Figure 1 and Additional file 1). We
were able to identify two stable signatures composed of 63
and 22 genes for the ER-/HER2- and HER2+ subtypes,
respectively (Figure S2 in Additional file 1). The two gene
lists selected for each subtype signature are reported in
Table S3 in Additional file 1 and in Additional file 3. Their
functional analysis is provided in section 4 of Additional
file 1.
Evaluation of the performance of GENIUS
To quantify the risk of relapse of an individual patient, we
computed the 'subtype risk scores' for each subtype separately and combined them in a final GENIUS risk score
('Combination'; Figure 1). We then assessed the performance of GENIUS in a validation set, which includes 745
node-negative untreated patients from five publicly available datasets (Table S1 in Additional file 1).
We evaluated the performance of GENIUS in the global
population and in the three molecular subtypes in our validation set, the molecular subtype of a patient's tumor being
defined by its maximum posterior probability.
Risk score predictions
To assess the performance of risk score predictions, we considered the predictions of GENIUS to be continuous scores.
We showed that GENIUS was significantly associated with
prognosis in the global breast cancer population, as well as
in each molecular subtype. In the global population,
GENIUS yielded a concordance index (C-index) of 0.71,
Haibe-Kains et al. Genome Biology 2010, 11:R18
/>
Page 3 of 18
(a)
(b)
Training set
Validation set
Fuzzy subtype
cation
P(1)
P(2)
P(3)
ER-/HER2-
P(1)
cation of
prognostic genes
Step 2
HER2+
{ P(1),P(2),P(3)}
Step 1
ER+/HER2-
P(2)
cation of
prognostic genes
AURKA
subtype
signature
subtype
signature
subtype
signature
Model
building
Model
building
Model
building
subtype
risk score
subtype
risk score
subtype
risk score
Step 3
Combination
GENIUS
GENIUS model
cutoff
risk score
cutoff
risk group
risk group
risk score
Performance
assessment and
comparison
Figure 1 Risk prediction model design (GENIUS). Design of the fuzzy approach used to build the new risk prediction model, called GENIUS (Gene
Expression progNostic Index Using Subtypes): (a) training phase to build GENIUS; (b) validation phase to test GENIUS in the independent dataset of
untreated breast cancer patients. For the sake of clarity, we denoted P(ER-/HER2-), P(HER2+) and P(ER+/HER2-) by P(1), P(2) and P(3), respectively.
which may be interpreted as saying that, for any time t, the
probability was at least 71% that a patient who relapsed at
time t had a risk score greater than a patient who had not
relapsed at time t. In the ER+/HER2-, ER-/HER2- and
HER2+ subtypes, GENIUS reached a C-index value of
0.70, 0.66 and 0.66, respectively (all P-values < 0.001;
detailed results are available in Table S4 in Additional file
1). Time-dependent receiver operating characteristic (ROC)
curve analysis confirmed these results (Figure 3b-e).
Haibe-Kains et al. Genome Biology 2010, 11:R18
/>
ER-/HER2-
Page 4 of 18
HER2+
1%
20%
12%
2%
4%
As expected, the proportions of patients in the low-risk
group differed with respect to the subtypes (Table S5 in
Additional file 1). Indeed, we observed lower proportions
in the ER-/HER2- (40%) and HER2+ (47%) subtypes than
in the ER+/HER2- subtype (74%), these patients being generally at lower risk of relapse.
Benefit of the fuzzy approach
13%
48%
ER+/HER2Figure 2 Proportion of subtypes in primary breast tumors. Venn
diagram of proportions of the three molecular subtypes identified in a
database of 3,537 breast cancer patients. We considered a threshold of
1% for the uncertainty of a patient belonging to a specific subtype.
Therefore, patients have a tumor of a unique subtype if the posterior
probability of belonging to that subtype exceeds 99%.
Risk group predictions
Risk group predictions (binary variable representing the
low- and high-risk groups) were computed by applying a
cutoff to the continuous risk scores. Although the categorization of individual risk scores into a small set of risk
groups may introduce a bias [21], this approach is intuitive,
which must be the case if the risk prediction model is to be
used in clinical practice.
The cutoff for the GENIUS risk score was selected so that
GENIUS yielded better prognostic performance than the
proliferation module (AURKA) in the training set (VDX)
using the time-dependent ROC curves (Figure 3a). This
choice was made since proliferation-related genes were
shown to drive the prognostic value of several prognostic
signatures [8,9].
The superiority of GENIUS with the selected cutoff was
confirmed in the validation set (Figure 3b-e). We observed
a significant difference between the survival curves of lowand high-risk groups predicted by GENIUS for both the
global population (hazard ratio 3.7; 95% confidence interval (CI) [2.7,5]; P = 1E-16) and all the subtypes: hazard
ratios of 3.7 (95% CI [2.5,5.5]; P = 1E-10), 2.7 (95% CI
[1.3,5.6]; P = 7E-3) and 3.9 (95% CI [1.8,8.8]; P = 8E-4) in
the ER+/HER2-, ER-/HER2- and HER2+ subtypes, respectively (Figure 4). The probability of distant metastasis or
relapse free survival of the low-risk group at 5 years was
estimated at 91% in the global population, and 92%, 83%
and 89% in the ER+/HER2-, ER-/HER2- and HER2+ subtypes, respectively.
We sought to further investigate the benefit of the fuzzy
computational approach, which assumes that risk prediction
can be improved by considering that a patient's tumor
belongs simultaneously to each subtype with some probability. Therefore, we developed an alternative risk prediction model - GENIUS CRISP - in order to emphasize this
benefit.
The design of GENIUS CRISP is identical to that of
GENIUS, except that the probabilities of a patient's belonging to each subtype are not taken into account: a patient is
unequivocally assigned to the subtype having the maximum
posterior probability (section 7 of Additional file 1). In contrast to the fuzzy approach, this 'crisp' approach is characterized by rough discontinuities at the subtype cluster
boundaries, which might introduce undesired effects
(increased variance) into the overall risk prediction performance [22,23].
GENIUS CRISP was fitted using the same training set
(VDX) as GENIUS. We identified two subtype signatures
composed of 10 and 23 genes for the ER-/HER2- and
HER2+ subtypes, respectively. Although these subtype signatures were very similar to those identified for GENIUS,
up to 15% of the prognostic genes were different in both
lists (data not shown). We then computed GENIUS CRSIP
risk predictions in our validation set. Although GENIUS
and GENIUS CRISP risk scores were highly correlated (0.9
in the global population), GENIUS yielded significantly
better performance than GENIUS CRISP, both in the global
patient population and in the ER-/HER2- subtype (Figure
5a). The superiority of GENIUS is even clearer for risk
group prediction (Figure 5b).
Comparison with current prognostic gene signatures
Furthermore, in order to determine whether GENIUS
would add prognostic information beyond what is provided
by already published gene expression signatures, we compared its performance with several signatures shown to be
associated with prognosis in the global breast cancer population or in a specific molecular subtype: GGI (gene expression grade index) [24] to represent the initially published
prognostic signatures for the global population of breast
cancer patients (that is, the GENE70 [25] and GENE76 [19]
signatures), since we had previously shown that they all
performed similarly [26]; IRMODULE (immune response
module) identified by Teschendorff et al. [20,27] in the ERnegative breast cancers; SDPP (stroma derived prognostic
Haibe-Kains et al. Genome Biology 2010, 11:R18
/>
(a)
Page 5 of 18
0.6
0.4
0.2
sensitivity
0.8
1.0
Time dependent ROC curves at 5 years
ALL
ALL
0.0
GENIUS (AUC=0.789)
AURKA (AUC=0.595)
0.0
0.2
0.4
0.6
0.8
1.0
1 - specificity
(b)
(c)
0.6
0.2
0.4
sensitivity
0.8
0.8
0.6
0.4
0.2
sensitivity
Time dependent ROC curves at 5 years
ER+/HER2ER+/HER2
1.0
1.0
Time dependent ROC curves at 5 years
ALL
ALL
0.0
0.2
0.4
0.6
0.8
GENIUS (AUC=0.752)
AURKA (AUC=0.751)
0.0
0.0
GENIUS (AUC=0.749)
AURKA (AUC=0.699)
1.0
0.0
0.2
1 - specificity
(d)
Time dependent ROC curves at 5 years
ER-/HER2ER /HER2
0.6
0.8
1.0
Time dependent ROC curves at 5 years
HER2+
HER2+
0.6
sensitivity
0.6
0.2
0.4
0.4
0.8
0.8
1.0
1.0
(e)
0.0
GENIUS (AUC=0.687)
AURKA (AUC=0.455)
0.0
0.2
0.4
0.6
1 - specificity
0.8
1.0
GENIUS (AUC=0.688)
AURKA (AUC=0.566)
0.0
0.2
sensitivity
0.4
1 - specificity
0.0
0.2
0.4
0.6
0.8
1.0
1 - specificity
Figure 3 Time-dependent ROC curves at 5 years for the risk score predictions computed by GENIUS and AURKA. Training set: in the (a) global
population of breast cancer patients, to illustrate the cutoff selected for risk group prediction (green lines). Validation set: in the (b) global population,
the (c) ER+/HER2-, (d) ER-/HER2- and (e) HER2+ subtypes. AUC, area under the curve.
Haibe-Kains et al. Genome Biology 2010, 11:R18
/>
(a)
Page 6 of 18
(b)
2
3
4 5 6 7
Time (years)
(c)
0.8
1.0
1
0.6
0.2
HR=3.6, 95%CI [2.7,4.9], p-value = 2.9E-16
0
Low
High
0.0
0.0
Low
High
8
9
10
No. at risk
Low 472 461 448 435 416 397 352 314 273 244 213
High 252 237 206 178 159 143 135 120 107 100 85
HR=3.9, 95%CI [2.6,5.8] p-value = 6.6E-11
0
1
2
3
4 5 6 7
Time (years)
8
9
10
No. at risk
Low 374 370 363 354 338 323 282 247 213 191 166
High 129 125 111 97 88 79 75 66 64 62 51
(d)
HR=2.6, 95%CI [1.3,5.5], p-value = 9.2E-0.3
1
2
3
No. at risk
Low 48
High 68
46
63
42
50
40
44
4 5 6 7
Time (years)
39
40
37
35
37
32
36
29
0.6
0.4
Low
High
0.0
0.0
Low
High
0
0.8
1.0
HER2+
0.2
0.4
0.6
Probability of survival
0.8
1.0
ER-/HER2-
0.2
Probability of survival
ER+/HER2-
0.4
Probability of survival
0.8
0.6
0.4
0.2
Probability of survival
1.0
ALL
8
9
31
23
27
20
10
21
16
HR=4.1, 95%CI [1.8,9.2], p-value = 7.7E-0.4
0
1
2
3
No. at risk
Low 50
High 55
47
51
45
47
43
39
4 5 6 7
Time (years)
41
33
39
31
35
30
32
27
8
9
31
22
28
20
10
26
18
Figure 4 Survival curves for GENIUS risk group predictions. Kaplan-Meier survival curves for GENIUS risk group predictions in the (a) global population, the (b) ER+/HER2-, (c) ER-/HER2- and (d) HER2+ subtypes of the validation set.
predictor) representing the stroma-derived prognostic predictor identified by Finak et al. [28] and shown to perform
well with ER+ and HER2+ tumors; and the in silico derived
PLAU and STAT1 modules, since our group [8] showed
that the immune response module (STAT1) was prognostic
in the ER-/HER2- and HER2+ subtypes, while the tumor
invasion module (PLAU) was prognostic in the HER2+
subtype only.
Risk score predictions
GENIUS performed significantly better than all the evaluated gene signatures in the global population of patients
(Figure 6a; Table S4 in Additional file 1). However,
depending on the signature, the superiority of GENIUS was
not always significant in the subtypes in which a particular
signature was originally shown to be prognostic. For example, STAT1 and IRMODULE were highly prognostic in the
ER-/HER2- and HER2+ subtypes, while SDPP was associated with prognosis in the ER+/HER2- and HER2+ sub-
Haibe-Kains et al. Genome Biology 2010, 11:R18
/>
Page 7 of 18
Test for GENIUS
superiority
(a)
ALL:
ALL:
GENIUS
GENIUS CRISP
4E-4
ER+/HER2 : GENIUS
GENIUS CRISP
0.31
ER /HER2 : GENIUS
GENIUS CRISP
0.0011
HER2+:
0.2
0.3
0.5
0.6
0.7
7E-4
0.073
ER /HER2 : GENIUS
GENIUS CRISP
0.016
0.2
0.4
GENIUS
GENIUS CRISP
ER+/HER2 : GENIUS
GENIUS CRISP
HER2+:
GENIUS
GENIUS CRISP
Test for GENIUS
superiority
(b)
GENIUS
GENIUS CRISP
0.018
0.3 0.4 0.5 0.6 0.7 0.8 0.9
0.8
1
concordance index
concordance index
Figure 5 Forest plot of the concordance indices for GENIUS and GENIUS CRISP. Forest plot of the concordance indices for GENIUS and GENIUS
CRISP risk predictions, with respect to the subtypes in the validation set: (a) risk score predictions; (b) risk group predictions. The P-values at the righthand side of the forest plot were computed from the statistical test of superiority of GENIUS.
(a)
ALL:
Test for GENIUS
superiority
(b)
ALL:
Test for GENIUS
superiority
GENIUS
AURKA
GGI
STAT1
PLAU
IRMODULE
SDPP
0.012
0.018
5E-12
9E-14
1E-4
0.015
GENIUS
AURKA
GGI
STAT1
PLAU
IRMODULE
SDPP
ER+/HER2 : GENIUS
AURKA
GGI
STAT1
PLAU
IRMODULE
SDPP
0.25
0.27
2E-6
5E-9
0.065
0.094
ER+/HER2 : GENIUS
AURKA
GGI
STAT1
PLAU
IRMODULE
SDPP
0.073
0.12
1E-6
6E-8
0.076
0.035
ER /HER2 : GENIUS
AURKA
GGI
STAT1
PLAU
IRMODULE
SDPP
0.0051
0.016
0.1
0.0037
0.44
0.028
ER /HER2 : GENIUS
AURKA
GGI
STAT1
PLAU
IRMODULE
SDPP
0.0016
0.02
0.43
0.0033
0.63
0.14
HER2+:
HER2+:
GENIUS
AURKA
GGI
STAT1
PLAU
IRMODULE
SDPP
0.2
0.3
0.25
0.039
0.15
0.10
0.62
0.39
0.4
0.5
0.6
0.7
concordance index
0.8
1E-4
5E-4
6E-11
2E-16
7E-5
0.0038
GENIUS
AURKA
GGI
STAT1
PLAU
IRMODULE
SDPP
0.0044
0.037
0.15
0.015
0.091
0.064
0.3 0.4 0.5 0.6 0.7 0.8 0.9 1
concordance index
Figure 6 Forest plot of the concordance indices for GENIUS and the state-of-the-art prognostic signatures. Forest plot of the concordance
indices for GENIUS and the current prognostic signatures (AURKA, GGI, STAT1, PLAU, IRMODULE and SDPP) risk predictions, with respect to the subtypes in the validation set: (a) risk score predictions; (b) risk group predictions. The P-values at the right-hand side of the forest plot were computed
from the statistical test of superiority of GENIUS.
Haibe-Kains et al. Genome Biology 2010, 11:R18
/>
types. We further computed the time-dependent ROC
curves at 5 years of the risk score predictions of GENIUS
and the existing gene signatures (Figure S5 in Additional
file 1) and observed results similar to that of the C-index.
The correlation between GENIUS risk score predictions
and the current gene signatures are provided in Figure S4
and section 6.1, respectively, in Additional file 1.
Risk group predictions
The risk group predictions for the other signatures were
computed by applying a cutoff such that the proportions of
patients in the low- and high-risk groups were respected as
defined by GENIUS. We then compared the performance of
GENIUS with the existing gene signatures and observed
results similar to that of the risk score predictions (Figure
6b and Table S6 in Additional file 1). Indeed, GENIUS performed significantly better than the other evaluated signatures in the global population of patients. In contrast, in the
ER-/HER2- and HER2+ subtypes, STAT1 and IRMODULE
were particularly competitive, as was SDPP in the HER2+
subtype only.
In addition to the comparison to individual gene signatures, we sought to further compare GENIUS to SUBCLASSIF, a prognostic model that mimics the use of the
best current prognostic gene signatures according to molecular subtype. This crisp risk prediction model is similar to
GENIUS CRISP, except that the gene signatures used to
compute the subtype risk scores are those already published, that is, the IRMODULE, SDPP and AURKA signatures for the ER-/HER2-, HER2+ and ER+/HER2subtypes, respectively. It is worth noting that we used different combinations of existing signatures in this framework and obtained similar results (data not shown).
We assessed the performance of SUBCLASSIF in our
validation set and observed that it was outperformed by
GENIUS, this superiority being significant in the global
population of patients for risk score and group prediction
(Figures 7a and 7b, respectively). This result suggests that
combining novel subtype signatures that take into account
the probabilities of belonging to different subtypes yields a
better risk prediction model than the one using existing
prognostic gene signatures and crisp subtype identification.
The correlation between GENIUS and SUBCLASSIF risk
score predictions are provided in section 6.1 in Additional
file 1.
Comparison of GENIUS with clinical prognostic indices
In order to evaluate the potential complementarity of
GENIUS with the routinely used clinico-pathological
parameters, we compared the performance of GENIUS with
the Nottingham Prognostic Index (NPI) [29] and Adjuvant!
Online (AOL) [30]. We computed NPI risk scores from
clinical information, NPI being a simple linear combination
of nodal status, histological grade and tumor size. We used
Page 8 of 18
the Adjuvant! Online website [31] to compute AOL risk
scores.
Risk score predictions
The comparison of GENIUS risk scores with those of AOL
and NPI yielded correlations of 0.27 and 0.39, respectively,
in the global population (Figure S3 in Additional file 1).
The correlations were even lower within the ER-/HER2and HER2+ subtypes. It is worth noting that NPI gave high
scores to the great majority of ER-/HER2- and HER2+
tumors.
We also computed the C-indices of AOL and NPI risk
score predictions (Table S4 in Additional file 1) and compared them to GENIUS, as shown in Figure 8a. Although
GENIUS performed better in the global population, its
superiority did not reach significance in all molecular subtypes. In the ER+/HER2- and HER2+ subtypes, for
instance, NPI appeared slightly better than GENIUS for
high sensitivities, as illustrated in the time-dependent ROC
curves at 5 years (Figure S5 in Additional file 1).
Risk group predictions
The risk group predictions for AOL and NPI were computed by applying a cutoff that respected the proportions of
patients in the low- and high-risk groups as defined by
GENIUS. The difference in the survival curves of high- and
low-risk patients as defined by AOL and NPI was statistically significant only in the global population and the ER+/
HER2- subtype (Figure S6 in Additional file 1). GENIUS
significantly outperformed NPI and AOL in the global population of patients and in all subtypes, except for AOL in
the ER-/HER2- subtype and NPI in the ER+/HER2- subtype, where GENIUS was not significantly superior (P-values for GENIUS superiority of 0.052 and 0.23 respectively;
Figure 8b).
Combination of GENIUS and clinical prognostic indices
The low correlation of the risk score predictions of AOL
and NPI with GENIUS raised the question of whether the
gene expression and clinical classifiers have complementary value. We therefore drew the Kaplan-Meier survival
curves of GENIUS risk group predictions stratified by AOL
and NPI classifications (Figure 9). In the global population
of breast cancer patients, AOL and NPI seemed to provide
additional prognostic information to GENIUS. In the ER+/
HER2- subtype, this information seemed to be limited to
the patients classified as low-risk by GENIUS. Although
we did not observe clear improvement due to the smaller
sample sizes of the ER-/HER2- and HER2+ subtypes, AOL
and NPI were also correctly able to stratify the patients
identified as high-risk patients by GENIUS. Moreover, the
combination of GENIUS and NPI seems to be attractive for
identifying low-risk HER2+ patients (95% and 90% disease-free at 5 and 10 years, respectively). In order to assess
Haibe-Kains et al. Genome Biology 2010, 11:R18
/>
Page 9 of 18
Test for GENIUS
superiority
(a)
ALL:
GENIUS
SUBCLASSIF
0.018
0.31
ER+/HER2 -: GENIUS
SUBCLASSIF
0.073
0.22
ER /HER2-: GENIUS
SUBCLASSIF
GENIUS
SUBCLASSIF
0.4
GENIUS
SUBCLASSIF
ER /HER2 -: GENIUS
SUBCLASSIF
0.22
0.04
ER+/HER2 - : GENIUS
SUBCLASSIF
HER2+:
Test for GENIUS
superiority
(b)
0.39
0.5
0.6
0.7
ALL:
HER2+:
0.8
GENIUS
SUBCLASSIF
0.3
0.048
0.4
concordance index
0.5 0.6 0.7 0.8 0.9
concordance index
1
Figure 7 Forest plot of the concordance indices for GENIUS and SUBCLASSIF. Forest plot of the concordance indices for GENIUS and GENIUS
CRISP risk predictions, with respect to the subtypes in the validation set: (a) risk score predictions; (b) risk group predictions. The P-values at the righthand side of the forest plot were computed from the statistical test of superiority of GENIUS.
the impact of the cutoff on the combination, we sought to
apply the standard cutoffs for NPI [32] and AOL that had
been suggested in the TRANSBIG validation studies
[33,34]. In these settings, AOL did not add significant
information to the ER+/HER2- subtype, whereas NPI
exhibited complementarity similar to that observed with the
cutoff used for the risk group predictions (Figure S7 in
Additional file 1).
Case studies
In previous sections, we showed that GENIUS significantly
outperformed current prognostic gene signatures and clinical indices, especially in the global population of patients.
We used the TRANSBIG dataset [34] to illustrate the benefit of using GENIUS when compared to clinical prognostic
indices (NPI and AOL) and three official gene signatures
(GGI, GENE70, and GENE76). Figures 10a-f and 11a,b
(a)
Test for GENIUS
superiority
ALL:
describe eight cases of breast cancer with corresponding
clinical information and outcome, subtype identification,
and official classification computed from prognostic clinical models and gene signatures. Each figure represents a
specific case of interest. Figure 10a illustrates the case of a
high proliferative large ER+/HER2- tumor correctly classified as high risk by all the risk prediction models. In Figure
10b-f, we illustrate cases that highlight the benefit of using
GENIUS over clinical indices and existing gene signatures
to identify low-risk breast cancer patients. We observed that
GENIUS otperformed clinical indices when there was discordance between ER status assessed by immunohistochemistry and subtype identification using gene
expression, especially with elusive tumor subtypes (Figure
10a,b,e10a,b,e). Moreover, for patients whose tumors
belonged to the ER-/HER2- and HER2+ subtypes,
GENIUS consistently outperformed the prognostic gene
(b)
ALL:
GENIUS
AOL
NPI
0.0013
0.02
Test for GENIUS
superiority
GENIUS
AOL
NPI
5E-5
0.0031
ER+/HER2 : GENIUS
AOL
NPI
0.043
0.19
ER+/HER2 : GENIUS
AOL
NPI
0.035
0.23
ER /HER2 : GENIUS
AOL
NPI
0.037
0.03
ER /HER2 : GENIUS
AOL
NPI
0.052
0.037
HER2+:
0.2
HER2+:
GENIUS
AOL
NPI
0.3
0.4
0.082
0.077
0.5
0.6
0.7
concordance index
0.8
GENIUS
AOL
NPI
0.043
0.0049
0.3 0.4 0.5 0.6 0.7 0.8 0.9 1
concordance index
Figure 8 Forest plot of the concordance indices for GENIUS and the clinical prognostic indices. Forest plot of the concordance indices for GENIUS and the clinical prognostic indices (AOL and NPI) risk predictions with respect to the subtypes in the validation set: (a) risk score predictions; (b)
risk group predictions. The P-values at the right-hand side of the forest plot were computed from the statistical test of superiority of GENIUS.
Haibe-Kains et al. Genome Biology 2010, 11:R18
/>
Page 10 of 18
(a)
(b)
GENIUS/NPI
1
328
134
132
106
2
322
127
121
86
3
316
120
105
74
4
5
6
Time (years)
302
116
93
67
294
104
87
57
258
95
82
53
7
228
87
75
46
8
197
77
66
42
9
178
67
63
37
0
No. At Risk
GENIUS Low / NPI Low 346
GENIUS Low / NPI High 114
GENIUS High / NPI Low 116
GENIUS High / NPI High 132
1
343
107
111
123
2
336
101
104
99
3
332
94
88
87
4
5
6
Time (years)
317
90
79
78
304
84
72
69
265
79
68
65
7
237
69
58
60
8
205
60
50
55
9
183
54
48
50
10
158
47
37
46
1.0
0.8
0.6
0.2
GENIUS Low / NPI Low
GENIUS Low / NPI High
GENIUS High / NPI Low
GENIUS High / NPI High
0.0
0.0
0.2
GENIUS Low / AOL Low
GENIUS Low / AOL High
GENIUS High / AOL Low
GENIUS High / AOL High
0.4
Probability of survival
0.6
0.4
Probability of survival
0.8
1.0
(d)
0
No. At Risk
GENIUS Low / AOL Low 285
GENIUS Low / AOL High 89
GENIUS High / AOL Low 73
GENIUS High / AOL High 56
1
284
87
72
54
2
281
83
70
43
3
277
78
61
37
4
5
6
Time (years)
265
75
53
36
259
65
49
31
224
59
46
29
7
196
52
43
24
8
169
46
41
24
9
153
39
39
23
10
130
36
33
18
0
No. At Risk
GENIUS Low / NPI Low 314
GENIUS Low / NPI High 49
GENIUS High / NPI Low 73
GENIUS High / NPI High 54
1
312
48
72
52
2
306
47
68
42
3
302
44
58
38
4
5
6
Time (years)
288
42
52
35
276
39
47
31
238
37
45
29
7
210
30
38
27
8
180
27
37
26
9
160
25
35
26
10
138
21
27
23
(f)
0.6
0.8
0
No. At Risk
GENIUS Low / AOL Low
GENIUS Low / AOL High
GENIUS High / AOL Low
GENIUS High / AOL High
0.2
GENIUS Low / NPI Low
GENIUS Low / NPI High
GENIUS High / NPI Low
GENIUS High / NPI High
0.0
0.0
0.2
GENIUS Low / AOL Low
GENIUS Low / AOL High
GENIUS High / AOL Low
GENIUS High / AOL High
0.4
Probability of survival
0.6
0.4
Probability of survival
0.8
1.0
1.0
(e)
17
31
32
36
1
17
30
30
34
2
15
29
24
27
3
13
28
22
23
4
5
6
Time (years)
13
27
20
21
13
25
19
17
13
25
18
15
7
13
24
16
14
8
11
21
12
12
9
10
18
12
9
10
7
14
9
7
0
No. At Risk
GENIUS Low / NPI Low
GENIUS Low / NPI High
GENIUS High / NPI Low
GENIUS High / NPI High
10
37
18
49
1
10
35
17
46
2
10
32
16
34
3
10
30
13
31
4
5
6
Time (years)
10
29
12
29
10
27
11
25
10
27
10
23
7
10
26
9
21
8
9
22
6
18
9
9
18
6
15
10
6
14
2
14
0.8
0.6
0.2
GENIUS Low / NPI Low
GENIUS Low / NPI High
GENIUS High / NPI Low
GENIUS High / NPI High
0.0
0.0
0
No. At Risk
GENIUS Low / AOL Low
GENIUS Low / AOL High
GENIUS High / AOL Low
GENIUS High / AOL High
0.4
Probability of survival
0.6
0.4
GENIUS Low / AOL Low
GENIUS Low / AOL High
GENIUS High / AOL Low
GENIUS High / AOL High
0.2
Probability of survival
0.8
1.0
(h)
1.0
(g)
HER2+
0.6
0.2
10
153
60
54
31
(c)
ER-/HER2-
GENIUS Low / NPI Low
GENIUS Low / NPI High
GENIUS High / NPI Low
GENIUS High / NPI High
0.0
0.0
0
No. At Risk
GENIUS Low / AOL Low 331
GENIUS Low / AOL High 141
GENIUS High / AOL Low 138
GENIUS High / AOL High 114
ER+/HER2-
0.4
Probability of survival
0.6
0.4
GENIUS Low / AOL Low
GENIUS Low / AOL High
GENIUS High / AOL Low
GENIUS High / AOL High
0.2
ALL
Probability of survival
0.8
0.8
1.0
1.0
GENIUS/AOL
29
21
33
22
Figure 9 (See figure legend on next page.)
1
29
19
32
20
2
29
17
30
18
3
28
16
24
16
4
5
6
Time (years)
26
16
22
12
24
16
21
11
23
13
20
11
7
20
13
18
10
8
19
13
15
8
9
17
12
14
7
10
16
10
12
6
0
No. At Risk
GENIUS Low / NPI Low
GENIUS Low / NPI High
GENIUS High / NPI Low
GENIUS High / NPI High
22
28
25
29
1
22
26
24
27
2
22
24
22
25
3
22
22
19
20
4
5
6
Time (years)
21
21
17
16
20
20
16
15
19
17
15
15
7
19
14
13
14
8
18
14
9
13
9
16
13
9
11
10
14
12
8
9
Haibe-Kains et al. Genome Biology 2010, 11:R18
/>
Page 11 of 18
(See figure on previous page.)
Figure 9 Survival curves for the combination of GENIUS and the clinical prognostic indices risk group predictions. Kaplan-Meier survival
curves for the combination of GENIUS and AOL/NPI predictions in the (a) AOL and (b) NPI global population, the (c) AOL and (d) NPI ER+/HER2-, the
(e) AOL and (f) AOL ER-/HER2- and the (g) AOL and (h) NPI HER2+ subtypes of the validation set.
signatures (Figure 10a,c,e) and clinical indices in most
cases (Figure 10a,c,f). Figures 11a,b represent cases where
GENIUS failed to predict clinical outcome. In Figure 11a,b
combination of GENIUS and clinical information such as
age and tumor size might lead to correct risk assessment for
this low proliferative ER+/HER2- tumor, relapsing after 4
years. In Figure 11b, the patient relapsed after 7.3 years
(late relapse), making her clinical outcome particularly difficult to predict. These two cases do highlight possible
drawbacks from using GENIUS, that is, the absence of age
and tumor size information in the model and the potentially
poor prediction for late relapses given the different biology
for these tumors [35]. Additional comments in Figures 10
and 11 further highlight the potential improvements and
drawbacks associated with GENIUS.
Discussion
In this paper, we introduce a new approach for breast cancer
prognostication using gene expression profiling data and
taking into account the molecular heterogeneity of breast
cancer. This fuzzy computational approach was developed
to respond to the major criticism raised with regard to the
great majority of gene signatures reported so far, namely
that these are only able to identify high- and low-risk
patients within ER-positive disease [8,9]. While it is clear
that patients with HER2+ and ER-/HER2- breast cancer
have an overall prognosis that is worse than that of patients
with ER+ disease, some of the former do have a better clinical outcome. However, only few studies have so far
attempted to consider the molecular heterogeneity of
HER2+ and ER-/HER2- breast cancer and to derive a prognostic predictor for these subtypes [8,20,28].
In 2005, Wang and colleagues [19] were the first to propose the development of a prognostic model by dividing the
global population of patients into subgroups based on their
ER status. Although the approach seemed appealing and
their GENE76 signature performed well, there was still
room for improvement. First, the authors considered only
two subgroups of patients (ER- and ER+) without taking
into account the heterogeneity of HER2+ tumors. Second,
the prognostic model specifically developed for ER- tumors
was trained on few samples (35) and performed poorly in
validation studies [34,36].
In the meta-analyses recently published by our group we
observed that the subtype for many breast tumors remains
elusive, their phenotype being intermediate between several
subtypes. Taking into account this observation, we developed a novel, fuzzy computational approach to build the
risk prediction model GENIUS, which is able to determine
the prognosis of individual breast cancer patients.
The first step of our approach, the fuzzy subtype identification, consists in assessing the probability that a patient
belongs to each of the molecular subtypes (ER-/HER2-,
HER2+ or ER+/HER2-). We demonstrated that our twodimensional clustering model, which considered gene
expression modules representing the ER and HER2 phenotypes more precisely than ER and HER2 mRNA levels, was
consistently able to identify the different molecular subtypes across 20 publicly available data sets. Although
molecular subtype was clearly identified for the majority of
patients, one-fifth of patients have elusive tumor subtypes,
rendering their cases difficult for risk prediction.
The second step involves identifying prognostic genes
through a selection procedure that takes into account the
probabilities that a patient belongs to each molecular subtype, and/or uses current gene signatures. We used the proliferation module AURKA for the ER+/HER2- subtype
since we had shown previously that this set of proliferationrelated genes was highly prognostic in this subtype [8] and
was the common denominator of most of published prognostic gene signatures [8,9]. In contrast to the ER+/HER2subtype, the prognosis of the ER-/HER2- and HER2+ subtypes has been the subject of only few studies, which is why
we developed new signatures for these subtypes. Interestingly, our HER2+ subtype signature appeared to be strongly
correlated to the immune response modules developed by
Teschendorff et al. [20] and by our own group [8]. The
immune response information contained in this subtype signature was further confirmed by the functional analysis we
performed using Ingenuity Pathways. Our ER-/HER2- subtype signature also correlated with the immune response
modules [8,20], although to a lesser extent than the HER2+
signature did. These results suggest that studying the
immune response mechanisms in these particular subgroups
of patients might help us to better understand their tumors
and to develop efficient novel targeted therapies.
The third step to our approach consists in combining the
probabilities that a patient belongs to each molecular subtype with the corresponding subtype prognostic signature in
order to derive a final GENIUS risk prediction score. We
showed that GENIUS was highly prognostic in the global
population and in all breast cancer subtypes, both when
considering GENIUS as a continuous or binary variable.
GENIUS was able to identify a significant proportion of
low-risk patients within the high-risk breast cancer subtypes ER-/HER2- and HER2+. When we compared
GENIUS with SUBCLASSIF, the risk prediction model
Haibe-Kains et al. Genome Biology 2010, 11:R18
/>
(a)
Page 12 of 18
Distant metastasis
1.4 years after diagnosis
Prediction
Id: VDXIGRU_172086
Age: 47 years
Tumor size: 3cm
Grade 3
ER+ (IHC)
Node-
(b)
Free of distant metastasis
until 16.3 years of follow-up
Outcome
AOL:
NPI:
GGI:
GENE70:
High risk
High risk
High risk
High risk
GENE76: High risk
GENIUS: High risk
Prediction
Id: VDXIGRU_171558
Age: 35 years
Tumor size: 3.2cm
Grade 2
ER- (IHC)
Node-
(c)
High risk
High risk
Low risk
Low risk
Low risk
GENIUS: Low risk
cation: ER+/HER2- with Pr > 0.994
cation: ER+/HER2- with Pr > 0.991
Comments:
- Early relapse due to high proliferative large ER+/
HER2- tumor.
ed at high risk by all the risk
prediction models.
AOL:
NPI:
GGI:
GENE70:
GENE76:
Outcome
Comments:
- Discordance between ER status by IHC and subtype
cation using gene expressions.
ed as high
risk by clinical models due to wrong ER status.
(d)
Free of distant metastasis
until 15.6 years of follow-up
Prediction
Id: VDXIGRU_219490
Age: 44 years
Tumor size: 3cm
Grade 3
ER+ (IHC)
Node-
Free of distant metastasis
until 15.6 years of follow-up
Outcome
High risk
High risk
High risk
GENE70: High risk
GENE76: High risk
AOL:
NPI:
GGI:
GENIUS: Low risk
Prediction
Id: VDXKIU_15E8
Age: 38 years
Tumor size: 2cm
Grade 3
ER+ (IHC)
Node-
cation: HER2+ with Pr > 0.992
Comments:
- ER+ by IHC but intermediate level of ESR1 module
score by gene expression.
- High proliferative tumor with low risk predicted by
HER2+ subtype signature.
(e)
AOL:
NPI:
GGI:
Outcome
High risk
High risk
High risk
GENE70: High risk
GENE76: High risk
GENIUS: Low risk
cation: ER-/HER2- with Pr > 0.999
Comments:
- Discordance between ER status by IHC and subtype
cation using gene expressions.
- High proliferative tumor but low risk predicted by
ER-/HER2- subtype signature.
(f)
Free of distant metastasis
until 10.2 years of follow-up
Prediction
Id: VDXIGRU_307506
Age: 45 years
Tumor size: 2.6cm
Grade 1
ER+ (IHC)
Node-
AOL:
NPI:
GGI:
Outcome
Low risk
Low risk
High risk
GENE70: High risk
GENE76: High risk
GENIUS: Low risk
cation: ER-/HER2- with Pr > 0.905
Comments:
- Discordance between ER status by IHC and subtype
cation using gene expressions.
- High proliferation but low risk predicted by ER-/
HER2- subtype signature.
- Low proliferative tumor by histological grade but high
proliferation measured by current gene signatures.
ed by clinical models (probably due
to erroneous assessment of histological grade) and
GENIUS but not by current gene signatures.
Figure 10 (See figure legend on next page.)
Free of distant metastasis
until 17.8 years of follow-up
Prediction
AOL:
NPI:
Id: VDXGUYU_4033
Age: 58 years
Tumor size: 2cm
Grade 2
ER+ (IHC)
Node-
Outcome
High risk
High risk
GGI:
Low risk
GENE70: Low risk
GENE76: Low risk
GENIUS: Low risk
cation: HER2+ with Pr > 0.821
Comments:
- Elusive tumor subtype, maximum probability of
belonging to HER2+ subtype but non negligible
probability to belong to ER+/HER2- subtype (Pr =
0.176).
- Intermediate histological grade but low proliferative
tumor according to gene expressions.
Haibe-Kains et al. Genome Biology 2010, 11:R18
/>
Page 13 of 18
(See figure on previous page.)
Figure 10 Study of six breast cancer cases highlighting benefits of using GENIUS. (a-f) Six cases of breast cancer patients from TBG dataset
(breast cancer microarray dataset introduced by Desmedt et al. [34]) where prognostic clinical indices and gene signatures are compared to GENIUS.
The boxes contain relevant comments highlighting the benefits of using GENIUS
using the best existing gene signatures according to subtype, we observed that the fuzzy approach used for
GENIUS yielded significantly better performance. Moreover, we showed that GENIUS CRISP, the version of
GENIUS that is not fuzzy because it does not take into
account the probabilities of a patient belonging to each subtype, yielded poorer performance. All of these results
strongly support the benefits of our fuzzy approach for
breast cancer prognostication. However, although GENIUS
was validated in a large retrospective dataset of 745
untreated patients, a randomized clinical trial such as MINDACT [37] would be required to properly evaluate the benefit from using GENIUS in clinical practice.
A criticism raised in recent years with respect to the existing prognostic gene signatures is that they may add little
information beyond what is available when using the classic clinico-pathologic parameters according the optimal
clinical guidelines. To that end, we considered the NPI and
AOL as the references for assessing the risk of recurrence.
The prognostic information provided by AOL and NPI then
seemed to be limited to the ER+/HER2- subtype. Because
we could not compute AOL and NPI on the training set
(VDX) due to missing clinical information, we were unable
to develop a version of GENIUS fully integrating microarray and clinical data, and to test it on the validation set.
However, we observed that the combination of the risk
group classification of GENIUS and the clinical guidelines
in the validation set might considerably improve the prediction of clinical outcome. Indeed, both AOL and NPI were
able to further refine the GENIUS classification in the
global population of patients. For the ER+/HER2- subtype,
NPI provided a much clearer separation than AOL in the
low-risk group of patients, although it takes neither the
patient's age nor ER status into account. We might thus
hypothesize that within this subgroup of patients with low
proliferative tumors, tumor size is the relevant parameter to
further refine prognosis in the node-negative breast cancer
population. AOL and NPI exhibited only weak prognosis
improvement over the GENIUS classification for the ER-/
HER2- and HER2+ subtypes. Interestingly, when we did
consider the published cutoffs, AOL no longer added significant information to the ER+/HER2- subtype, underlin-
(b)
(a)
Distant metastasis
7.3 years after follow-up
Distant metastasis
4.38 years after follow-up
Prediction
Id: VDXRHU_1721
Age: 54 years
Tumor size: 3cm
Grade 2
ER+ (IHC)
Node-
AOL:
NPI:
GGI:
Prediction
Outcome
High risk
High risk
Low risk
GENE70: Low risk
GENE76: High risk
GENIUS: Low risk
cation: ER+/HER2- with Pr > 0.999
Comments:
- Low proliferative ER+/HER2- tumor leading to
relapse after 4 years.
- GENIUS, along with GGI and GENE70, failed to
predict outcome.
- Combination with age and tumor size information
might yield better prediction.
Id: VDXKIU_440
Age: 50 years
Tumor size: 0.9cm
Grade 2
ER+ (IHC)
Node-
AOL:
NPI:
GGI:
Outcome
Low risk
Low risk
Low risk
GENE70: High risk
GENE76: High risk
GENIUS: Low risk
cation: ER+/HER2- with Pr > 0.993
Comments:
- Low proliferative ER+/HER2- tumor leading to late
relapse (after > 7 years).
- All predictors but GENE76 and GENE70 failed.
cally designed to
predict relapses before 5 years.
- Given the late occurrence of the relapse, the correct
cation is not clear.
Figure 11 Study of two breast cancer cases highlighting drawbacks of using GENIUS. (a,b) Two cases of breast cancer patients from the TBG
dataset (breast cancer microarray dataset introduced by Desmedt et al. [34]) where prognostic clinical indices and gene signatures are compared to
GENIUS. The boxes contain relevant comments highlighting the drawbacks of using GENIUS.
Haibe-Kains et al. Genome Biology 2010, 11:R18
/>
ing the importance of the cutoff in evaluating a prognostic
indicator.
To further compare GENIUS with prognostic clinical
indices and current gene signatures, we illustrated eight
breast cancer cases retrieved from the TRANSBIG validation study along with the different classifications. We
observed that GENIUS was able to identify more low-risk
patients, especially when there was discordance between
subtypes identified by immunohistochemistry and by gene
expression.
Although the GENIUS methodology was used for prognostication in this work, it might be particularly effective to
predict response/resistance to anticancer treatments as well.
New predictive models using our fuzzy computational
approach could be developed by adapting the fuzzy subtype
identification step to the biological processes underlying
the treatments of interest. Moreover, integrating different
sources such as genomic, epigenetic and proteomic data, in
addition to transcriptomics, might further improve the performance of the current GENIUS model.
Conclusions
We report here a novel, fuzzy computational approach to
building a risk prediction model to assess breast cancer
prognosis that takes into account breast cancer heterogeneity. We have shown that the fuzziness of the approach
yielded better performance than a crisp integration of subtype identification and prognostic gene signatures.
Materials and methods
We developed a fuzzy computational approach to build a
new prognostic index for early breast cancer, called
GENIUS, which is illustrated in Figure 1. Our method to
derive this index is based on a 'divide-and-conquer' strategy, dividing the original problem into simpler ones whose
solutions can be combined to obtain a global solution [23].
In this study, the global population of breast cancer patients
was divided into fuzzy molecular subtypes for which specific risk prediction models were used and finally combined
to get a global risk prediction model. GENIUS was implemented in an R [38] package called genefu, available from
the Comprehensive R Archive Network [39].
Gene expression data
Gene expression datasets were retrieved from public databases or authors' websites: the 20 datasets used in our analysis are described in Table S1 in Additional file 1 and
sketched in Figure S1 in Additional file 1. We used normalized data (log2 intensity in single-channel platforms or log2
ratio in dual-channel platforms) as published by the original
studies. Hybridization probes were mapped to Entrez
GeneID as in Shi et al. [40], using RefSeq and Entrez database version 2007.01.21. When multiple probes were
mapped to the same GeneID, the one with the highest vari-
Page 14 of 18
ance in a particular dataset was selected to represent the
GeneID.
Survival data
For the survival analysis, we considered only node-negative
untreated patients (that is, having received neither chemotherapy nor hormone therapy after initial surgical resection
with or without radiotherapy). We used distant metastasis
free survival as the survival endpoint. However, when distant metastasis free survival was not available (for example,
UPP, a breast cancer microarray dataset introduced by
Miller et al. [41]), we used relapse free survival. We censored the survival data at 10 years in order to have comparable follow-up across the different studies [26,34].
Fuzzy risk prediction model GENIUS
In this paper we illustrate the methodology employed to
develop the risk prediction model GENIUS, which integrates the fuzzy identification of subtypes with novel or
existing gene signatures.
Fuzzy subtype identification
In order to identify the molecular subtypes of breast cancer,
we performed model-based clustering in a two-dimensional
space defined by the ESR1 and ERBB2 module scores, representing the ER and HER2 phenotypes, respectively [8].
Once fitted to the training set, this clustering model returns
a set of probabilities of a patient belonging to each cluster
(called subtype). These probabilities are denoted by P(s)
where s e S = {ER-/HER2-,HER2+,ER+/HER2-} are the
subtypes. We applied this clustering model to several independent datasets to assess its quality and robustness.
Identification of prognostic genes
In order to reduce the dimensionality of the gene expression
data, we filtered the probes as follows: because we used
Affymetrix and Agilent datasets in our survival analysis, we
kept only the common genes between these two platforms
(10,540 genes); we kept 10% of the genes for which the
variance was the largest in the training set.
In order to identify prognostic gene signatures, we used a
ranking-based gene selection procedure. The score given to
each gene is based on the significance of the concordance
index [42] computed by assuming asymptotical normality
[43]. We introduced a weighted version of the concordance
index in order to select genes relevant for a specific subtype
s. The weights were defined as the probability of a patient
belonging to the subtype s (section 3 of Additional file 1).
The only hyperparameter to tune was the signature size k,
that is, the number of selected genes in the signature. To do
so, we assessed the signature stability with respect to its
size by re-sampling the training set [44-46].
Haibe-Kains et al. Genome Biology 2010, 11:R18
/>
Page 15 of 18
Clinical prognostic indices
Model building
For a subtype s, the subtype risk score, denoted by Rs, was
defined as the weighted combination of all the gene expressions in the corresponding signature:
∑ wi x i
i∈Q
Rs =
nQ
where Q is the set of genes in the signature, nQ is the number of genes in Q, xi is the expression of gene i, and wi is
either -1 or +1 depending on its concordance index (wi = 1
if concordance index <0.5, +1 otherwise). Each subtype
risk score was scaled such that quantiles 2.5% and 97.5%
equaled -1 and +1, respectively. This scaling was robust to
outliers and ensured that the risk score lay approximately in
[-1,+1], allowing for comparison between datasets using
different microarray technology and normalization.
Combination
The final risk score for a patient was defined as the
weighted combination of the subtype risk scores:
R=
∑ P (s)R
where P(s) is the probability of belonging to the subtype s
∑ P (s) = 1 .
Current prognostic gene signatures
In order to compare our risk prediction model with other
gene signatures shown to be prognostic in the global population of breast cancer patients or in specific molecular subtypes, we computed the risk predictions of these signatures
using the alternative computational method introduced in
Desmedt et al. [8]. Although this method may differ from
the algorithms used in the original publications, it is able to
yield similar performance [8]. Moreover, the strategy used
to build our new prediction model (Figure 1) makes it possible to plug these signatures into the subtype signatures in
order to assess their potential benefit at the level of the
whole model.
Crisp risk prediction model SUBCLASSIF
s
s∈S
such that
In order to compare our risk prediction model with the best
current clinical prognostic indices, we computed risk predictions using the NPI [32] and AOL version 8.0 [47]. NPI
takes into account tumor grade and size and nodal status
(the latter being negative for all patients in this study). AOL
calculates 10-year survival probability based on a patient's
age, tumor size and grade, tumor ER status and nodal status.
As the sum of the probabilities
s∈S
equals 1, the final risk score has the same scale as the subtype risk scores. This continuous value quantifies the risk of
a patient to relapse, with low and high values denoting low
risk and high risk, respectively. We used the final risk score
to derive risk groups on the basis of a cutoff defined on the
training set.
Crisp risk prediction model GENIUS CRISP
In order to assess whether the fuzziness of the GENIUS
approach improved the overall prognostic ability of the
model, we developed a crisp version of GENIUS, called
GENIUS CRISP (section 5 of Additional file 1). The design
of this risk prediction model is identical to GENIUS except
that the probabilities of belonging to each subtype are not
taken into account. Indeed, the subtype of each tumor is
univocally determined by the maximum posterior probability estimated during the subtype identification step. For
instance, the probabilities {P(ER-/HER2-), P(HER2+),
P(ER+/HER2-)} = {0.1, 0.8, 0.2} are transformed into {0,
1, 0}.
In order to mimic the use of the best current prognostic
gene signatures according to molecular subtype, we developed a crisp risk prediction model, similar to GENIUS
CRISP, except that the gene signatures used to compute the
subtype risk scores are those already published. This risk
prediction model, called SUBCLASSIF (section 6 of Additional file 1), used the IRMODULE, SDPP and AURKA
signatures for the ER-/HER2-, HER2+ and ER+/HER2subtypes, respectively.
Performance assessment and comparison
We assessed the performance of the risk score predictions
(continuous variable) using the concordance index (Cindex) [42], the time-dependent ROC curve [48] and its
corresponding area under the curve as implemented in the R
package survcomp [49]. The performance of the risk group
predictions (binary variable, low- and high-risk groups)
was assessed using the concordance index and the hazard
ratio estimated through Cox's model. All Cox's models
were stratified by dataset, allowing for different baseline
hazard functions between cohorts. We statistically compared the performance of the risk score and risk group predictions through C-index by using a paired Student t-test
[26,50].
Gene ontology and functional analysis
Gene ontology analyses were performed using Ingenuity
Pathways Analysis tools [51], a web-delivered application
that enables researchers to discover, visualize, and explore
Haibe-Kains et al. Genome Biology 2010, 11:R18
/>
molecular interaction networks in gene expression data. For
a more detailed description of the methods, see Additional
file 1.
Page 16 of 18
2.
3.
Additional material
4.
Additional file 1
Supplementary information, including sections about the identification
of molecular subtypes, performance assessment, fuzzy identification of
prognostic genes, gene ontology and functional analysis, development of
SUBCLASSIF and comparison with GENIUS, development of GENIUS CRISP
and comparison with GENIUS, and GENIUS risk predictions for treated
patients. The file also contains the supplementary figures and tables.
5.
Additional file 2
Comma separated values (csv) file including the probabilities of all the
patients belonging to each breast cancer molecular subtypes.
6.
Additional file 3
Comma separated values (csv) file including the lists of prognostic genes
selected for the subtype signatures.
7.
Abbreviations
AOL: Adjuvant! Online; AURKA: proliferation gene module with prototype
AURKA; CI: confidence interval; C-index: concordance index; ER: estrogen
receptor; ERBB2: gene name for human epidermal growth factor receptor 2;
ESR1: gene name for estrogen receptor alpha 1; GENIUS: Gene Expression progNostic Index Using Subtypes; GGI: gene expression grade index; HER: human
epidermal growth factor receptor; IRMODULE: immune response module; NPI:
Nottingham Prognostic Index; ROC: receiver operating characteristic; SDPP:
stroma derived prognostic predictor.
8.
9.
10.
Competing interests
CS, CD, BHK are named inventors of on a patent application for the STAT1 and
PLAU modules. CS and MP are named inventors on a patent application for the
GGI used in this study. There are no other conflicts of interest.
11.
Authors' contributions
BHK, CD and GB were responsible for the design and execution of the study,
data and statistical analysis and interpretation. FR participated in the data analysis. BHK and CD were responsible for writing the manuscript; MP, GB and CS
supervised the study. All authors read and approved the final manuscript.
13.
Acknowledgements
We would like to thank Mathias Gehrmann and Marcus Schmidt for sharing the
clinical information necessary to compute the AOL prognostic index for the
MAINZ dataset. We thank Carolyn Straehle for her editorial assistance. This work
was supported by the Belgian National Foundation for Research FNRS (CD,
BHK, CS), the MEDIC Foundation (CS), and the European Commission's Framework Programme 6 (for TRANSBIG).
15.
Author Details
1Functional Genomics and Translational Research Unit, Medical Oncology
Department, Jules Bordet Institute, Boulevard de Waterloo, Brussels, 1000,
Belgium and 2Machine Learning Group, Computer Science Department,
Université Libre de Bruxelles, Boulevard du Triomphe, Brussels, 1050, Belgium
17.
Received: 14 September 2009 Revised: 4 January 2010
Accepted: 15 February 2010 Published: 15 February 2010
18.
14.
16.
Genome Biologyaccess 11:R18distributed under theLtd. of the Creative Commons Attribution License ( which permits unrestricted use, distribution, and reproduction in any medium, provided the original work is properly cited.
© 2010 Haibe-Kains et al.; licensee BioMed Central terms
This article is available article />is an open 2010, from:
References
1. Hu Z, Fan C, Oh DS, Marron JS, He X, Qaqish BF, Livasy C, Carey LA,
Reynolds E, Dressler L, Nobel A, Parker J, Ewend MG, Sawyer LR, Wu J, Liu Y,
Nanda R, Tretiakova M, Ruiz Orrico A, Dreher D, Palazzo JP, Perreard L,
Nelson E, Mone M, Hansen H, Mullins M, Quackenbush JF, Ellis MJ,
Olopade OI, Bernard PS, et al.: The molecular portraits of breast tumors
are conserved across microarray platforms. BMC Genomics 2006, 7:96.
19.
20.
Kapp AV, Jeffrey SS, Langerod A, Borresen-Dale AL, Han W, Noh DY,
Bukholm IR, Nicolau M, Brown PO, Tibshirani R: Discovery and validation
of breast cancer subtypes. BMC Genomics 2006, 7:231.
Perou CM, Sorlie T, Eisen MB, Rijn M van de, Jeffrey SS, Rees CA, Pollack JR,
Ross DT, Johnsen H, Akslen LA, Fluge O, Pergamenschikov A, Williams C,
Zhu SX, Lonning PE, Borresen-Dale AL, Brown PO, Botstein D: Molecular
portraits of human breast tumours. Nature 2000, 406:747-752.
Sorlie T, Perou CM, Tibshirani R, Aas T, Geisler S, Johnsen H, Hastie T, Eisen
MB, Rijn M van de, Jeffrey SS, Thorsen T, Quist H, Matese JC, Brown PO,
Botstein D, Eystein Lonning P, Borresen-Dale AL: Gene expression
patterns of breast carcinomas distinguish tumor subclasses with
clinical implications. Proc Natl Acad Sci USA 2001, 98:10869-10874.
Sorlie T, Tibshirani R, Parker J, Hastie T, Marron JS, Nobel A, Deng S,
Johnsen H, Pesich R, Geisler S, Demeter J, Perou CM, Lonning PE, Brown
PO, Borresen-Dale AL, Botstein D: Repeated observation of breast tumor
subtypes in independent gene expression data sets. Proc Natl Acad Sci
USA 2003, 100:8418-8423.
Sotiriou C, Neo SY, McShane LM, Korn EL, Long PM, Jazaeri A, Martiat P,
Fox SB, Harris AL, Liu ET: Breast cancer classification and prognosis
based on gene expression profiles from a population-based study.
Proc Natl Acad Sci USA 2003, 100:10393-10398.
Pusztai L, Mazouni C, Anderson K, Wu Y, Symmans WF: Molecular
classification of breast cancer: limitations and potential. Oncologist
2006, 11:868-877.
Desmedt C, Haibe-Kains B, Wirapati P, Buyse M, Larsimont D, Bontempi G,
Delorenzi M, Piccart M, Sotiriou C: Biological processes associated with
breast cancer clinical outcome depend on the molecular subtypes.
Clin Cancer Res 2008, 14:5158-5165.
Wirapati P, Sotiriou C, Kunkel S, Farmer P, Pradervand S, Haibe-Kains B,
Desmedt C, Ignatiadis M, Sengstag T, Schutz F, Goldstein DR, Piccart M,
Delorenzi M: Meta-analysis of gene expression profiles in breast cancer:
toward a unified understanding of breast cancer subtyping and
prognosis signatures. Breast Cancer Res 2008, 10:R65.
Babuska R: Fuzzy modeling and identification. In PhD thesis Technische
Universiteit Delft; 1996.
Nascimento S: Fuzzy Clustering via Proportional Membership Model
Amsterdam, The Netherlands: IOS Press; 2005. Frontiers in Artificial
Intelligence and Applications, volume 11912.Sotiriou C, Piccart MJ: Taking
gene-expression profiling to the clinic: when will molecular signatures
become relevant to patient care? Nat Rev Cancer 2007, 7:545-553.
Cardoso F, Van't Veer L, Rutgers E, Loi S, Mook S, Piccart-Gebhart MJ:
Clinical application of the 70-gene profile: the MINDACT trial. J Clin
Oncol 2008, 26:729-735.
Sparano JA, Paik S: Development of the 21-gene assay and its
application in clinical practice and clinical trials. J Clin Oncol 2008,
26:721-728.
Calza S, Hall P, Auer G, Bjohle J, Klaar S, Kronenwett U, Liu ET, Miller L,
Ploner A, Smeds J, Bergh J, Pawitan Y: Intrinsic molecular signature of
breast cancer in a population-based cohort of 412 patients. Breast
Cancer Res 2006, 8:R34.
Sihto H, Lundin J, Lehtimaki T, Sarlomo-Rikala M, Butzow R, Holli K, Sailas L,
Kataja V, Lundin M, Turpeenniemi-Hujanen T, Isola J, Heikkila P, Joensuu H
: Molecular subtypes of breast cancers detected in mammography
screening and outside of screening. Clin Cancer Res 2008, 14:4103-4110.
Conforti R, Boulet T, Tomasic G, Taranchon E, Arriagada R, Spielmann M,
Ducourtieux M, Soria JC, Tursz T, Delaloge S, Michiels S, Andre F: Breast
cancer molecular subclassification and estrogen receptor expression
to predict efficacy of adjuvant anthracyclines-based chemotherapy: a
biomarker study from two randomized trials. Ann Oncol 2007, 18:14771483.
Minn AJ, Gupta GP, Padua D, Bos P, Nguyen DX, Nuyten D, Kreike B, Zhang
Y, Wang Y, Ishwaran H, Foekens JA, Vijver M van de, Massague J: Lung
metastasis genes couple breast tumor size and metastatic spread.
Proc Natl Acad Sci USA 2007, 104:6740-6745.
Wang Y, Klijn JG, Zhang Y, Sieuwerts AM, Look MP, Yang F, Talantov D,
Timmermans M, Meijer-van Gelder ME, Yu J, Jatkoe T, Berns EM, Atkins D,
Foekens JA: Gene-expression profiles to predict distant metastasis of
lymph-node-negative primary breast cancer. Lancet 2005,
365:671-679.
Teschendorff AE, Miremadi A, Pinder SE, Ellis IO, Caldas C: An immune
response gene expression module identifies a good prognosis subtype
in estrogen receptor negative breast cancer. Genome Biol 2007, 8:R157.
Haibe-Kains et al. Genome Biology 2010, 11:R18
/>
21. Gerds TA, Schumacher M: On functional misspecification of covariates
in the Cox regression model. Biometrika 2001, 88:572-580.
22. Bontempi G: Local learning techniques for modeling, prediction and
control. In PhD thesis Université Libre de Bruxelles, IRIDIA; 1999.
23. Murray-Smith R, Johansen TA: Local learning in local model networks. In
Multiple Model Approaches to Modeling and Control Edited by: MurraySmith R, Johansen TA. Taylor and Francis; 1997:185-210.
24. Sotiriou C, Wirapati P, Loi S, Harris A, Fox S, Smeds J, Nordgren H, Farmer P,
Praz V, Haibe-Kains B, Desmedt C, Larsimont D, Cardoso F, Peterse H,
Nuyten D, Buyse M, Vijver MJ Van de, Bergh J, Piccart M, Delorenzi M:
Gene expression profiling in breast cancer: understanding the
molecular basis of histologic grade to improve prognosis. J Natl Cancer
Inst 2006, 98:26-272.
25. van't Veer LJ, Dai H, Vijver MJ van de, He YD, Hart AA, Mao M, Peterse HL,
Kooy K van der, Marton MJ, Witteveen AT, Schreiber GJ, Kerkhoven RM,
Roberts C, Linsley PS, Bernards R, Friend SH: Gene expression profiling
predicts clinical outcome of breast cancer. Nature 2002, 415:530-536.
26. Haibe-Kains B, Desmedt C, Piette F, Buyse M, Cardoso F, Van't Veer L,
Piccart M, Bontempi G, Sotiriou C: Comparison of prognostic gene
expression signatures for breast cancer. BMC Genomics 2008, 9:394.
27. Teschendorff AE, Caldas C: A robust classifier of high predictive value to
identify good prognosis patients in ER-negative breast cancer. Breast
Cancer Res 2008, 10:R73.
28. Finak G, Bertos N, Pepin F, Sadekova S, Souleimanova M, Zhao H, Chen H,
Omeroglu G, Meterissian S, Omeroglu A, Hallett M, Park M: Stromal gene
expression predicts clinical outcome in breast cancer. Nat Med 2008,
14:518-527.
29. Galea MH, Blamey RW, Elston CE, Ellis IO: The Nottingham Prognostic
Index in primary breast cancer. Breast Cancer Res Treat 1992, 22:207?219.
30. Olivotto IA, Bajdik CD, Ravdin PM, Speers CH, Coldman AJ, Norris BD, Davis
GJ, Chia SK, Gelmon KA: Population-based validation of the prognostic
model ADJUVANT! for early breast cancer. J Clin Oncol 2005, 23:27162725.
31. Adjuvant! Online: Decision making tools for health care professionals
[]
32. Todd JH, Dowle C, Williams MR, Elston CW, Ellis IO, Hinton CP, Blamey RW,
Haybittle JL: Confirmation of a prognostic index in primary breast
cancer. Br J Cancer 1987, 56:489?492.
33. Buyse M, Loi S, van't Veer L, Viale G, Delorenzi M, Glas AM, d'Assignies MS,
Bergh J, Lidereau R, Ellis P, Harris A, Bogaerts J, Therasse P, Floore A,
Amakrane M, Piette F, Rutgers E, Sotiriou C, Cardoso F, Piccart MJ:
Validation and clinical utility of a 70-gene prognostic signature for
women with node-negative breast cancer. J Natl Cancer Inst 2006,
98:1183-1192.
34. Desmedt C, Piette F, Loi S, Wang Y, Lallemand F, Haibe-Kains B, Viale G,
Delorenzi M, Zhang Y, d'Assignies MS, Bergh J, Lidereau R, Ellis P, Harris AL,
Klijn JG, Foekens JA, Cardoso F, Piccart MJ, Buyse M, Sotiriou C: Strong
time dependence of the 76-gene prognostic signature for nodenegative breast cancer patients in the TRANSBIG multicenter
independent validation series. Clin Cancer Res 2007, 13:3207-3214.
35. Schmidt-Kittler O, Ragg T, Daskalakis A, Granzow M, Ahr A, Blankenstein TJ,
Kaufmann M, Diebold J, Arnholdt H, Muller P, Bischoff J, Harich D,
Schlimok G, Riethmuller G, Eils R, Klein CA: From latent disseminated
cells to overt metastasis: genetic analysis of systemic breast cancer
progression. Proc Natl Acad Sci USA 2003, 100:7737-7742.
36. Foekens JA, Atkins D, Zhang Y, Sweep FC, Harbeck N, Paradiso A, Cufer T,
Sieuwerts AM, Talantov D, Span PN, Tjan-Heijnen VC, Zito AF, Specht K,
Hoefler H, Golouh R, Schittulli F, Schmitt M, Beex LV, Klijn JG, Wang Y:
Multicenter validation of a gene expression-based prognostic
signature in lymph node-negative primary breast cancer. J Clin Oncol
2006, 24:1665-1671.
37. Cardoso F, Piccart-Gebhart M, Van't Veer L, Rutgers E: The MINDACT trial:
the first prospective clinical validation of a genomic tool. Mol Oncol
2007, 1:246-251.
38. Team RDC: R: A language and environment for statistical computing. R:
A Language and Environment for Statistical Computing 2009.
39. genefu R package: Relevant Functions for Gene Expression Analysis,
Especially in Breast Cancer [ />genefu/]
40. Shi L, Reid LH, Jones WD, Shippy R, Warrington JA, Baker SC, Collins PJ, de
Longueville F, Kawasaki ES, Lee KY, Luo Y, Sun YA, Willey JC, Setterquist RA,
Fischer GM, Tong W, Dragan YP, Dix DJ, Frueh FW, Goodsaid FM, Herman
Page 17 of 18
41.
42.
43.
44.
45.
47.
48.
49.
50.
51.
52.
53.
54.
55.
56.
D, Jensen RV, Johnson CD, Lobenhofer EK, Puri RK, Schrf U, Thierry-Mieg J,
Wang C, Wilson M, Wolber PK, et al.: The MicroArray Quality Control
(MAQC) project shows inter- and intraplatform reproducibility of gene
expression measurements. Nat Biotechnol 2006, 24:1151-1161.
Miller LD, Smeds J, George J, Vega VB, Vergara L, Ploner A, Pawitan Y, Hall
P, Klaar S, Liu ET, Bergh J: An expression signature for p53 status in
human breast cancer predicts mutation status, transcriptional effects,
and patient survival. Proc Natl Acad Sci USA 2005, 102:13550-13555.
Harrel FE: Tutorial in biostatistics: multivariable prognostic models:
issues in developing models, evaluating assumptions and adequacy,
and measuring and reducing errors. Stat Med 1996, 15:361-387.
Pencina MJ, d'Agostino RB: Overall C as a measure of discrimination in
survival analysis: model specic population value and condence interval
estimation. Stat Med 2004, 23:2109-2123.
Davis CA, Gerick F, Hintermair V, Friedel CC, Fundel K, Kuffner R, Zimmer R:
Reliable gene signatures for microarray classification: assessment of
stability and performance. Bioinformatics 2006, 22:2356-2363.
Haibe-Kains B, Desmedt C, Loi S, Delorenzi M, Sotiriou C, Bontempi G:
Computational intelligence in clinical oncology: lessons learned from
an analysis of a clinical study. In Applications of Computational
Intelligence in Biology Edited by: Smolinski TG, Milanova MM, Hassanien AE.
Berlin/Heidelberg: Springer-Verlag; 2008:237-268. Studies in
Computational Intelligence, volume 12246.Loi S, Haibe-Kains B, Desmedt
C, Wirapati P, Lallemand F, Tutt AM, Gillet C, Ellis P, Ryder K, Reid JF,
Daidone MG, Pierotti MA, Berns EM, Jansen MP, Foekens JA, Delorenzi M,
Bontempi G, Piccart MJ, Sotiriou C: Predicting prognosis using
molecular profiling in estrogen receptor-positive breast cancer treated
with tamoxifen. BMC Genomics 2008, 9:239.
Ravdin PM, Siminoff LA, Davis GJ, Mercer MB, Hewlett J, Gerson N, Parker
HL: Computer program to assist in making decisions about adjuvant
therapy for women with early breast cancer. J Clin Oncol 2001, 19:980991.
Heagerty PJ, Lumley T, Pepe MS: Time-dependent ROC curves for
censored survival data and a diagnostic marker. Biometrics 2000,
56:337-344.
survcomp: Performance Assessment and Comparison for Survival
Analysis [ />Haibe-Kains B, Desmedt C, Sotiriou C, Bontempi G: A comparative study
of survival models for breast cancer prognostication based on
microarray data: does a single gene beat them all? Bioinformatics 2008,
24:2200-2208.
Ingenuity Pathway Analysis Tools [ />Chin K, DeVries S, Fridlyand J, Spellman PT, Roydasgupta R, Kuo WL, Lapuk
A, Neve RM, Qian Z, Ryder T, Chen F, Feiler H, Tokuyasu T, Kingsley C,
Dairkee S, Meng Z, Chew K, Pinkel D, Jain A, Ljung BM, Esserman L,
Albertson DG, Waldman FM, Gray JW: Genomic and transcriptional
aberrations linked to breast cancer pathophysiologies. Cancer Cell
2006, 10:529-541.
Bild AH, Yao G, Chang JT, Wang Q, Potti A, Chasse D, Joshi MB, Harpole D,
Lancaster JM, Berchuck A, Olson JA Jr, Marks JR, Dressman HK, West M,
Nevins JR: Oncogenic pathway signatures in human cancers as a guide
to targeted therapies. Nature 2006, 439:353-357.
Bonnefoi H, Potti A, Delorenzi M, Mauriac L, Campone M, Tubiana-Hulin M,
Petit T, Rouanet P, Jassem J, Blot E, Becette V, Farmer P, Andre S, Acharya
CR, Mukherjee S, Cameron D, Bergh J, Nevins JR, Iggo RD: Validation of
gene signatures that predict the response of breast cancer to
neoadjuvant chemotherapy: a substudy of the EORTC 10994/BIG 00-01
clinical trial. Lancet Oncol 2007, 8:1071-1078.
Campone M, Campion L, Roche H, Gouraud W, Charbonnel C,
Magrangeas F, Minvielle S, Geneve J, Martin AL, Bataille R, Jezequel P:
Prediction of metastatic relapse in node-positive breast cancer:
establishment of a clinicogenomic model after FEC100 adjuvant
regimen. Breast Cancer Res Treat 2008, 109:491-501.
Nimeus-Malmstrom E, Krogh M, Malmstrom P, Strand C, Fredriksson I,
Karlsson P, Nordenskjold B, Stal O, Ostberg G, Peterson C, Ferno M: Gene
expression profiling in primary breast cancer distinguishes patients
developing local recurrence after breast-conservation surgery, with or
without postoperative radiotherapy. Breast Cancer Res 2008, 10:R34.
Haibe-Kains et al. Genome Biology 2010, 11:R18
/>
57. Saal LH, Johansson P, Holm K, Gruvberger-Saal SK, She QB, Maurer M,
Koujak S, Ferrando AA, Malmstrom P, Memeo L, Isola J, Bendahl PO, Rosen
N, Hibshoosh H, Ringner M, Borg A, Parsons R: Poor prognosis in
carcinoma is associated with a gene expression signature of aberrant
PTEN tumor suppressor pathway activity. Proc Natl Acad Sci USA 2007,
104:7564-7569.
58. Schmidt M, Bohm D, von Torne C, Steiner E, Puhl A, Pilch H, Lehr HA,
Hengstler JG, Kolbl H, Gehrmann M: The humoral immune system has a
key prognostic impact in node-negative breast cancer. Cancer Res
2008, 68:5405-5413.
59. Hess KR, Anderson K, Symmans WF, Valero V, Ibrahim N, Mejia JA, Booser
D, Theriault RL, Buzdar AU, Dempsey PJ, Rouzier R, Sneige N, Ross JS,
Vidaurre T, Gomez HL, Hortobagyi GN, Pusztai L: Pharmacogenomic
predictor of sensitivity to preoperative chemotherapy with paclitaxel
and fluorouracil, doxorubicin, and cyclophosphamide in breast cancer.
J Clin Oncol 2006, 24:4236-4244.
60. Liedtke C, Cardone L, Tordai A, Yan K, Gomez HL, Figureoa LJ, Hubbard RE,
Valero V, Souchon EA, Symmans WF, Hortobagyi GN, Bardelli A, Pusztai L:
PIK3CA-activating mutations and chemotherapy sensitivity in stage IIIII breast cancer. Breast Cancer Res 2008, 10:R27.
61. Minn AJ, Gupta GP, Siegel PM, Bos PD, Shu W, Giri DD, Viale A, Olshen AB,
Gerald WL, Massague J: Genes that mediate breast cancer metastasis to
lung. Nature 2005, 436:518-524.
62. Calabro A, Beissbarth T, Kuner R, Stojanov M, Benner A, Asslaber M, Ploner
F, Zatloukal K, Samonigg H, Poustka A, Sultmann H: Effects of infiltrating
lymphocytes and estrogen receptor on gene expression and prognosis
in breast cancer. Breast Cancer Res Treat 2009, 116:69-77.
63. Naderi A, Teschendorff AE, Barbosa-Morais NL, Pinder SE, Green AR, Powe
DG, Robertson JF, Aparicio S, Ellis IO, Brenton JD, Caldas C: A geneexpression signature to predict survival in breast cancer across
independent data sets. Oncogene 2007, 26:1507-1516.
64. Vijver MJ van de, He YD, van't Veer LJ, Dai H, Hart AA, Voskuil DW,
Schreiber GJ, Peterse JL, Roberts C, Marton MJ, Parrish M, Atsma D,
Witteveen A, Glas A, Delahaye L, Velde T van der, Bartelink H, Rodenhuis S,
Rutgers ET, Friend SH, Bernards R: A gene-expression signature as a
predictor of survival in breast cancer. N Engl J Med 2002,
347:1999-2009.
65. Pawitan Y, Bjohle J, Amler L, Borg AL, Egyhazi S, Hall P, Han X, Holmberg L,
Huang F, Klaar S, Liu ET, Miller L, Nordgren H, Ploner A, Sandelin K, Shaw
PM, Smeds J, Skoog L, Wedren S, Bergh J: Gene expression profiling
spares early breast cancer patients from adjuvant therapy: derived and
validated in two population-based cohorts. Breast Cancer Res 2005,
7:R953-964.
66. Hoadley KA, Weigman VJ, Fan C, Sawyer LR, He X, Troester MA, Sartor CI,
Rieger-House T, Bernard PS, Carey LA, Perou CM: EGFR associated
expression profiles vary with breast tumor subtype. BMC Genomics
2007, 8:258.
doi: 10.1186/gb-2010-11-2-r18
Cite this article as: Haibe-Kains et al., A fuzzy gene expression-based computational approach improves breast cancer prognostication Genome Biology 2010, 11:R18
Page 18 of 18