Báo cáo y học: " Basal core promoters control the equilibrium between negative cofactor 2 and preinitiation complexes in human cells" pdf
Bạn đang xem bản rút gọn của tài liệu. Xem và tải ngay bản đầy đủ của tài liệu tại đây (1.73 MB, 14 trang )
RESEARC H Open Access
Basal core promoters control the equilibrium
between negative cofactor 2 and preinitiation
complexes in human cells
Thomas K Albert
1
, Korbinian Grote
2
, Stefan Boeing
1
, Michael Meisterernst
1*
Abstract
Background: The general transcription factor TFIIB and its antagonist negative cofactor 2 (NC2) are hallmarks of
RNA polymerase II (RNAPII) transcription. Both factors bind TATA box-binding pro tein (TBP) at promoters in a
mutually exclusive manner. Dissociation of NC2 is thought to be followed by TFIIB association and subsequent
preinitiation complex formation. TFIIB dissociates upon RNAPII promoter clearance, thereby providing a specific
measure for steady-state preinitiation complex levels. As yet, genome-scale promoter mapping of human TFI IB has
not been reported. It thus remains elusive how human core promoters contribute to preinitiation complex
formation in vivo.
Results: We compare target genes of TFIIB and NC2 in human B cells and analyze associated core promoter
architectures. TFIIB occupancy is positively correlated with gene expression, with the vast majority of promoters
being GC-rich and lacking defined core promoter elements. TATA elements, but not the previously in vitro defined
TFIIB recognition elements, are enriched in some 4 to 5% of the genes. NC2 binds to a highly related target gene
set. Nonetheless, subpopulations show strong variations in factor ratios: whereas high TFIIB/NC2 ratios select for
promoters with focused start sites and conserved core elements, high NC2/TFIIB ratios correlate to multiple start-
site promoters lacking defined core elements.
Conclusions: TFIIB and NC2 are global players that occupy active genes. Preinitiation complex formatio n is
independent of core elements at the majority of genes. TATA and TATA-like elements dictate TFIIB occupancy at a
subset of genes. Biochemical data support a model in which preinitiation complex but not TBP-NC2 complex
formation is regulated.
Background
The core region of metazoan promoters shows various
architectures and can harbor several distinct motifs,
termed TATA box (TATA) [1], initiator (INR) [2],
downstream promoter element (DPE) [3], downstream
core element [4], upstream and downstream TFIIB
recognition elements (BREu and BREd, respectively)
[5,6] and motif ten element [7] (reviewed in [8]). These
elements facilitate assembly of the transcription machin-
ery in a cooperative manner and are thought to contri-
bute to accurate initiation at a defined transcription
start site (TSS) [9]. In a majority of vertebrate genes
core promoter elements are less represented [10].
Instead, they reside in CpG islands and are GC-rich.
These promoters assemble general t ranscription factors
(GTFs) in a manner that remains poorly understood.
The general initiation factor TFIIB is absolutely
required for transcription initiation by RNA polymerase
II (RNAPII) [11]. TFIIB associates with TATA box-bind-
ing protein (TBP) and establishes sequence-specific con-
tacts in the major groove upstream and in the minor
groove downstream of TATA [12]. The upstream bind-
ing site, termed BREu, has been defined via an in vitro
selection procedure employing the TATA-containing
Adenovirus major late (AdML) promoter [6]. The corre-
sponding high-affinity downstream element, BREd, was
characterized via site selection in the context of the
TATA-containing Adenovirus E4 (AdE4) promoter [5].
Both elements stabilize the TFIIB-TBP-promoter
* Correspondence:
1
Institute of Molecular Tumor Biology (IMTB), University of Muenster, Robert-
Koch-Str. 43, 48149 Muenster, Germany
Albert et al. Genome Biology 2010, 11:R33
/>© 2010 Albert et al.; licensee BioMed Central Ltd. This is an open access article distributed u nder the terms of the Creative Commons
Attribution License ( which permits unrestricted use, distribution, and reproduction in
any medium, provided the original work is properly cited.
complex in vitro. BREu and BREd suppressed basal tran-
scription of the AdML core promoter [13]; however,
BREd enhanced activity of the AdE4 promoter [5].
Broadly, these data are in conflict with a general positive
role of TFIIB in transcription.
The function of TFIIB has not been investigated
in vivo, nor has TFIIB occupancy so far been correlated
with gene activity. Prevalence of BREs in active genes
remains subject to controversy. A computational study
based on statistical analysis of curated promoter sets
concludedthatupto25%ofhumancorepromoters
contain a potential BREu. The motif was found to be
enriched in CpG promoters (>30% frequency) but
depleted in CpG-less promoters (<10% frequency) [14].
In contrast, a recent large-scale study of CAGE (cap
analysis of gene expression) data sets in mammals did
not reveal clear evidence of BREu over-representation in
these regions [15]. The prevalence of BREd in mamma-
lian promoters has not been investigated by bioinfor-
matic means.
Genome-wide binding studies on general initiation fac-
tors have been extensively performed in yeast and include
maps of TBP, TFIID and SAGA [16,17], GTFs [18], Med-
iator [19,20], and Mot1 and negative cofactor 2 (NC2)
[21]. However, with few exceptions [22-25] comparable
studies in mammalian cells are lacking. Here we con-
ducted a comparative genome-wide analysis on promoter
association of human TFIIB and NC2 and correlate it
with gene expression and core promoter architecture.
Whereas most genes direct preinitiation complexes
(PICs) to their promoters in the apparent absence of core
promoter elements, a small subset of highly expressed
genes with high TFIIB/NC2 ratios direct binding of PICs
via core promoters. Biochemical data suggest that TATA
and regulatory factors positively control TFIIB but not
(or to a lesser extent) NC2 binding, thereby providing a
model for binding of GTFs in the absence of core ele-
ments and alterations in TFIIB/NC2 ratios inside cells. In
addition to defining a library of promoters ranked by
steady-state levels of PICs in human B ce lls, the com para-
tive analyses of TFIIB and NC2 also establish a resource
for human basal core promoters.
Results
Genome-wide promoter binding of TFIIB
We conducted chromatin immunoprecipitation (ChIP)-
chip analysis of TFIIB in two biological replicates from
human B cell line LCL721 with promoter arrays cover-
ing roughly 24,000 TSS regions. Following binding site
determination, an excellent overall correlation of the
TFIIB ChIP-chip duplicates was observed (Pearson’s cor-
relation r = 0.92; Figure 1a). The concordance rate
increased further for high-occupancy targets exhibiting
the most intense hybridization signals; 97% (1,173 of
1,207) of promoters in the upper 5th percentile (95 to
100) of one replicate were found in the upper 10th per-
centile (90 to 100) from the other. On the level of indi-
vidual promoter regions, TFIIB profiles also appeared
largely identical. This is illustrated on extended gene
loci such as the HIST1 histonegeneclusterandthe
adjoining BTN butyrophilin gene cluster on chromo-
some 6 (Figure 1b), as well as on single promoter
regions such as of the RNPS1 gene (Figure 1c). The lat-
ter also exemplifies the spatial resolution of single peak
regions, which was approximately 300 to 400 bp and in
good agreement with the median size of the bulk of
sheared ChIP DNA. On a genome-wide scale, several
thousands of bin ding sites were reproducibly detec ted
when a peak finding algorithm [26] was applied to the
two ChIP-chip samples (Table 1). To further s ubstanti-
ate resolution and reproducibility of the ChIP-chip data,
average binding profiles of the two TFIIB samples were
generated (Figure 1d). Probes from the upper 5th per-
centile of target promoters were remapped and plotted
as relative fractions that are found in 10 bp intervals
from aligned TSSs at +1. The replicates displayed a
nearly identical Gaussian-type profile with peak maxima
centered at position -50, thereby demonstrating high
mapping accuracy in independent ChIP-chip samples.
Moreover, the distance of TFIIB signals upstream of t he
TSS is in line with recent genome-wide ChIP data
obtained for yeast TFIIB/Sua7 [18].
A subset of target genes was validated by quantitative
ChIP-quantitative PCR (ChIP-qPCR) using a third inde-
pendent B cell-derived chromatin sample. A total of
29 promoters were interrogated that represent high
occupancy (group I, upper 10th percentile), mid-to-low
occupancy (group II, 60th to 80th percentile), or no
TFIIB occupancy (group III, lower 10th percentile) as
determined by Ch IP-chip (Figure 2a). Non-TSS regions
were included as negative controls and a non-specific
IgG ChIP served as background reference. With few
exceptions, relative magnitudes of array signals were
retained in the ChIP-qPCR analysis. Out of 25 promo-
ters from groups I and II, 23 (92%) showed greater than
10-fo ld enrichment of TFIIB over control ChIP, provin g
them as true positives. Likewise, four of four group III
promoters and fo ur of four control regions were nega-
tive for TFIIB enrichment in ChIP-qPCR (Figure 2b).
Based on the above confirmation rate, we estimate that
approximately 6,000 (92% of 6,547) promoters - repre-
senting one-quarter of all 24,000 interrogated promoters
- are bound by TFIIB. This is in line with previous esti-
mates on the number of active promoters in human
cells [25]. To corroborate specific promot er association
of TFIIB, the glyceraldehyde 3-phosphate dehydrogenase
gene (GAPDH) was scanned by ChIP-qPCR with eight
primer pairs scattered throughout the locus (Figure 2c).
Albert et al. Genome Biology 2010, 11:R33
/>Page 2 of 14
Binding of TBP and the initiating form of RN APII
(phosphorylated at serine 5 in its carboxy-terminal
domain) were monitored in pa rallel. All three factors
showed pronounced binding to the GAPDH promoter,
indicating assembly of an active PIC containing TFIIB.
Similar results were obtained at other large gene loci
(data not shown). TFIIB did not bind the 3 ’ region of
GAPDH or other genes [22] as was recently reported for
yeast genes [27].
TFIIB occupancy correlates positively with steady-state
mRNA levels
At single genes TFIIB occupancy matched well with
steady-st ate mRNA levels in LCL721 B cells [22] (Figure
2b, lower panel). To corroborate this at a genome-wide
scale, TFIIB occupancy levels were correlated with
mRNA levels for all genes. To this end, the median of
the TFIIB ChIP-chip signal on each NimbleGe n promo-
ter array probeset was plotted against the normalized
mRNA hybridization signal on the corresponding probe-
set of an Affymetrix gene expression array (Figure 2d).
Then, a sliding window was moved over the ChIP-chip
data from genes with low TFIIB levels to genes with
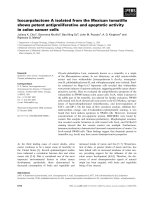
Figure 1 Genome-wide promoter occupancy of TFIIB. (a) TFIIB enrichment on human promoter arrays in two biological ChIP-chip replicates .
Each spot represents the median of hybridization intensities obtained on 15 probes per individual promoter region (log2 scale). Pearson’s
correlation is denoted by r. (b) Signal tracks of the two TFIIB replicates for the HIST1 histone gene cluster and an adjacent BTN butyrophilin gene
cluster on chromosome 6. Signals are bar-plotted as ChIP over non-enriched input DNA (ChIP/total) in log2 scale. (c) Resolution of ChIP-chip
signals at a single gene promoter. The left panel shows the fragment length distribution of sheared ChIP DNA in the two replicates as
determined by ethidium bromide staining of 250 ng (lanes 2 and 4) or 500 ng (lanes 3 and 5) of purified DNA loaded on a 1.4% agarose gel.
Lane 1 is a DNA size marker with fragment lengths indicated on the left. The right panel shows magnified signal plots of the two TFIIB replicates
at the RNPS1 promoter region. Scale is indicated at the top. The approximate width of the peak area is outlined in red, with the vertical hatched
line denoting the peak center. The broken arrow marks the location and direction of the TSS. (d) Average binding profiles of the top 5%
probesets for TFIIB replicate 1 (black line) and replicate 2 (grey line) relative to aligned TSSs at 10-bp resolution.
Table 1 TFIIB Peak Identification
TFIIB replicate 1 TFIIB replicate 2
Peaks (mean + 1.0 s.d.) 4,139 4,713
Peaks (mean + 2.0 s.d.) 3,148 3,332
Peaks (mean + 2.5 s.d.) 2,371 2,493
Peaks in TFIIB ChIP-chip samples were identified by a triangular best-fitting
algorithm (Mpeak) [26] using the indicated cut-offs for peak calls (s.d.,
standard deviation).
Albert et al. Genome Biology 2010, 11:R33
/>Page 3 of 14
high TFIIB levels and the average expression for these sub-
groups was determined. The resulting curve revealed a sig-
nificant positive correlation between TFIIB occupancy and
gene expression (Pearson’s correlation r = 0.97). Moreover,
a disproportiona tely high number of the most strongly
expressed genes bear high TFIIB levels, as revealed by the
skewed distribution of expression quantiles (Figure 2e).
Here, 94% of the genes in the upper 10th percentile of
TFIIB occupancy are expressed above average (median of
all expression array signals), and 37% fall into the top 10%
of expressed genes. In contrast, 26% of the genes in the
lower 10th percentile of TFIIB occ upancy are expressed
above average, and only 2% of those are amongst the top
10% of all expressed genes. These outliers may reflect gene
expression control at posttranscriptional stages, for
example, through stabilization of mRNAs. To statistically
evaluate the observed difference, a Kolmo gorov-Smirnov
test wa s applie d. It confirmed with a significance level of
P < 2e-16 that the distribution of expression signals in the
upper 10th percentile of TFIIB occupancy is highly dissim-
ilar to the distribution in all genes. Taken together, these
analyses indicate that TFIIB-dependent PIC formation
provides an excellent measure for gene activity, both at
the single gene and the genome-wide level.
Human core promoter structure associated with
preinitiation complexes
General features of high-TFIIB promoters (upper 5th
percentile) were compared to low-TFIIB promoters
(45th to 50th percentile) and no-TFIIB promoters
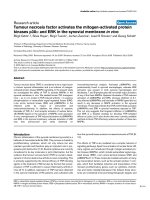
Figure 2 Validation of TFIIB target promoter s. (a) Signal distribu tion of TFIIB enrichment. I, II and III denote groups of promoters from the
upper 10th, 60th to 80th, or lower 10th percentile and correspond to high, mid-to-low, or no TFIIB occupancy. (b) Target gene validation.
Selected genes from groups I to III were analyzed by ChIP-qPCR using TFIIB or IgG control antibody in a third chromatin sample from LCL721
cells in which two independent ChIP reactions were performed (upper panel). Genes are ordered from left to right according to TFIIB levels on
the promoter arrays. The relative ChIP recovery is expressed as percentage of input (y-axis). The bars represent the mean, error bars the range of
the two ChIP experiments. Corresponding gene expression levels in LCL721 B cells are shown in the lower panel. These were determined using
Affymetrix U133 Plus 2.0 microarrays. They represent normalized hybridization signals of gene-specific microarray probesets. N.A., not analyzed.
(c) Assembly of an active PIC at the GAPDH promoter. ChIP-qPCR was conducted with eight primer pairs spanning the human GAPDH locus
(numbered boxes in top scheme). Results of ChIPs in LCL721 B cells with antibodies for TFIIB, TBP or the initiating form of RNAPII (CTD S5-P) are
graphed as relative occupancy levels at the different amplicon locations (lower panel). (d) Scatter plot showing the genome-wide correlation of
TFIIB binding to promoters (x-axis, log
2
scale) and steady-state mRNA levels (y-axis, log
2
scale) of the corresponding genes. The median of all
expression array probesets with present calls is indicated by the dotted horizontal line. The red dots indicate the average expression in gene
groups with increasing TFIIB occupancy. They were determined by moving a sliding window (step size 0.1) over the TFIIB data points and
calculating the mean expression value for each increment. (e) Distribution of ranked gene expression quantiles (color-coding indicated to the
right) in genes with increasing TFIIB occupancy levels. The difference in distributions was statistically evaluated using a Kolmogorov-Smirnov test
(***P < 2e-16).
Albert et al. Genome Biology 2010, 11:R33
/>Page 4 of 14
(lower 5th percentile). For each group the core promo-
ter sequences from position -50 to +50 were extracted,
aligned at the major TSS and represented in a n ucleo-
tide frequency plot [28] ( Additional file 1). High- and
low-TFIIB promoters have 61% and 62% GC content
compared to 54% of the no-TFIIB promoter set, well
above the 38% for the whole human genome [10]. An
exception is the region surrounding the TSS, where,
consistent with previous CAGE data, pyrimidine (Py) at
-1 and purine (Pu) at +1 (with G as the most fre-
quently base at +1) is seen [15]. We next searched for
core promoter elements in the different promoter
groups, including a block of 100 genes with the highest
levels of TFIIB binding. In the latter group, referred to
as ‘top 100’ , 24% of all promoters contained a TATA
consensus motif (TATAW, with the first T at position
-31 relative to the TSS). The number decreased in the
less frequently bound groups, reaching an overall 5% in
high-TFIIB and 1.4% in low-TFIIB promoters (Figure
3a). TATA-like sequences (WWWW) within position
-20 to -40 were found in 66% of the top 100 genes,
and d ecreased to 29% and 20% in high- and low-TFIIB
promoters (Figure 3a). In contrast, the frequency of the
BREu motif (SRCGCC positioned immediately
upstream of TATA) was around 2 to 3% and indepen-
dent of TFI IB occupancy ( Figure 3b). Relaxation of the
BREu sequence constraints by allowing for one mis-
match elevated frequencies to 17%, 19% and 21% in the
top 100, high-TFIIB and low-TFIIB genes, respectively.
Thus, unlike TATA, BREu and BREu-like sequences do
not correlate with TFIIB occupancy. For BREd, we ana-
lyzed only TATA consensus promoters within high-
TFIIB promoters to allow accurate location of the
motif downstream of TATA as described [5]. Despite
its degenerated consensus (RTDKKKK) we did not find
a single TATA promoter containing a full match to
this sequence in this subgroup. Allowing for one mis-
match did not reveal enrichment of BREd above sto-
chastic levels. Hence, BREd is essentially absent in
TATA consensus promoters with high TFIIB levels.
Finally, we found that 17% of the top 100 genes con-
tained a full match to the initiator sequence
(YYANWY) around the TSS (with the central A
between position -4 and +5). INR frequency was
slightly decreased in high-TFIIB promoters (12%) and
low-TFIIB genes (10%) (Figure 3 c). Like TATA, initia-
tor was readily discovered using the ab initio motif dis-
covery program MEME [29] in the top 100 TFIIB-
bound promoters (data not shown). No other mo tifs
with reasonable E-values (measuring significance of
enrichment) and/or specific position ing in the core
region could be identified. Most notably, MEME
uncover neither BREu nor BREd from these TFIIB-
bound promoters.
Comparison of genome-wide TFIIB and NC2 promoter
occupancy
NC2 ChIP-chip was conducted in parallel to TFIIB and
as described previously [22]. The two data sets proved
to be closely related (Pearson’s coefficient of 0.8; Figure
4a). Nearly three-quarters of TFIIB target promoters
from the upper 10th percentile were also identified in
the upper 10th percentile of NC2 targets (Figure 4b).
Binding of the repressor NC2 to active genes and over-
lap in targets is not unexpected given that both factors
target exclusively active genes bound by TBP. TATA
frequency was slightly higher in TFIIB targ et promoters
(4.8% versus 3.3% in NC2 target promoters), whereas
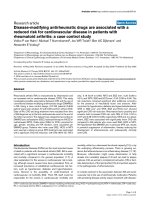
Figure 3 Frequencies of core promoter elements in TFIIB
target promoters. Pie charts showing the relative frequencies of
(a) TATA and TATA-like motifs, (b) BREu, and (c) INR consensus in
the top 100 TFIIB-bound promoters (left chart), high-TFIIB promoters
(middle chart) and low-TFIIB promoters (right chart). Motif
sequences and positions that were requested for a hit are shown
below the charts.
Albert et al. Genome Biology 2010, 11:R33
/>Page 5 of 14
BREu frequency in the two sets was identical (Figure
4c). The limited preference of NC2 for TATA confirms
previous biochemical analyses conducted on model pro-
moters in vitro ([30]; see also below).
Intact core promoters select for TFIIB and against NC2
Differences in the underlying gene architectures may
favor PIC formation (that is, TFIIB-TBP) versus PIC
inhibition (that is, NC2-TBP) in vivo. To address t his,
we sought to relate the relative occupancy levels of
TFIIB versus NC2 on core promoters with the mRNA
output of the corresponding genes. To this end, relative
factor occupancy levels were calculated for percentile-
ranked gene expression groups by determining the
mean enrichment of either TFIIB or NC2 on all genes
within a given expression quantile. The ratio of these
two values was built and is plotted in Figure 5a. It is
informative for steady-state PIC levels on promoters.
The majority of genes displayed a uniform TFIIB/NC2
ratio at their promoters, reasoning against tight control
of binding of either one. However, the TFIIB/NC2 ratio
increased steeply towards the most highly expressed
genes (that is, in the 90th to 95th and 95th to 100th
percentiles). The overall range of TFIIB/NC2 ratios on
individual gene promoter s was between 3.0 (w here
TFIIB and PIC is dominating) and 0.12 (where NC2 is
dominating).
We then asked if we could identify core promoter
structures that relate to different TFIIB/NC2 ratios.
Here, we focuse d on active genes, that is, genes that are
expressed above average and are bound by both factors,
using the 60th percentile for TFIIB and NC2 gene
occupancy as well as for steady-state mRNA levels as
cut-off. From these, the top 100 genes showing the
highest or lowest TFIIB/NC2 ratios were selected for
further analysis. Alignment of the promoter regions of
the top 100 TFIIB-dominated genes yielded structured
core regions with the most frequent bases resembling
the INR consensus at positions -2 to +5 (Figure 5b,
upper panel). Preferred bases at positions -35 to
-25 (CGGCTAAAAAA) matched conserved BREu and
TATA residues. Also, a G-rich sequence around +30
(GGGCGT) resembled the DPE motif (RGWYVT) [3]
identified in Drosophila. In contrast, alignment of
NC2-dominated genes did not reveal recognizable c ore
elements. Instead, t he core regions of t hese genes were
enriched for G and C, which were the most frequent
bases at every single position from -50 to +50 (Figure
5b, lower panel).
The enrichment of core promoter elements in T FIIB-
versus NC2-dominated genes was analyzed further. Enu-
meration of motif frequencies revealed that in 81% of
TFIIB-dominated genes but in only 38% of NC2-domi-
nated genes, at least one core promoter motif was pre-
sent (Figure 5c). Strikingly, 27% and 11% genes of the
former group harbored combinations of two or three
motifs, whereas only 4% and zero genes of the latter
group contained such binary and ternary motif combi-
nations. Individual motif frequencies are summarized in
Figure 5d. Comparing TFIIB- versus NC2-dominated
genes, TATA was revealed as the most strongly
enriched motif. It was present in 39% of TFIIB-
Figure 4 TFIIB versus NC2 binding to human promoters. (a) Genome-wide correlation of TFIIB and NC2 binding levels on promoter regions.
r, Pearson’s correlation. (b) Pie chart showing the overlap of high-occupancy promoters (upper 10th percentile) recovered in TFIIB and NC2
ChIP-chip samples. (c) Comparison of the frequencies of TATA and BREu consensus sequences in high-TFIIB versus high-NC2 promoters.
Albert et al. Genome Biology 2010, 11:R33
/>Page 6 of 14
dominated genes but in only 1% of NC2-dominated
genes (Figure 5d). Other significantly enriched motifs
included DPE (11% versus 1%), BREu (6% versus 1%)
and, to a l esser extent, TATA-like (63% versus 16%),
BREu-like (35% vers us 13%) and INR (20% versus 13%).
Again, BREd wa s not identified above stochastic levels
in the TATA downstream region. In aligned TATA con-
sensus promoters of TFIIB-dominated genes, the pre-
ferred bases upstream of TATA were consistent with
described TFIIB contacts [6,12] at the BREu (G at posi-
tion -34 and C at position -32 were found in 42% and
52% of all TATA promoters), whereas the base com po-
sition downstream of TATA did not show homology to
the BREd consensus. For example, thymine was the least
frequent base at position -24, while it is the most fre-
quent base in the in vitro selected BREd consensus
sequence RTDKKKK [5]. Base composition rather
resembled the upstream region by showing preferential
usage of G and C. From these data and the insignificant
abundance of BREd, we conclude that BREd does not
correlate with PIC formation and TFIIB binding in vivo.
The high prevalence for the occurrence of motif com-
binations in TFIIB-dominated genes in illustrated in
Figure5e.InlinewiththeknownsynergybetweenINR
and TATA [14], 94% and 56% of promoters harboring
the INR motif also contained a TATA-like or TATA
consensus sequence, respectively. A strong linkage was
also observed for DPE and TATA: 89% of DPE promo-
ters harbored a TATA-like sequence, and 67% of DPE
promoters a TATA consensus motif in the upstream
region around -30. This is unexpected, since the DPE
was function ally identifi ed in Drosophila promoters as a
Figure 5 High TFIIB/NC2 ratios select for TATA and combin ations of TATA with other core promoter elements. (a) Correlation of TFIIB/
NC2 ratio to gene expression. Genes were grouped into percentiles of expression levels (x-axis). For each group, the mean value of TFIIB or NC2
occupancy on all promoters within this group was determined. From these values the ratio was calculated and is plotted as a blue curve in the
graph. (b) Nucleotide frequency plots [28] of the top 100 TFIIB-dominated genes (upper panel) or the top 100 NC2-dominated genes (lower
panel). Core promoter sequences from position -50 to +50 were extracted and aligned at the TSS (broken arrow). Letter heights reflect relative
base frequencies at the given position. Shaded boxes on top of each panel indicate matches to the consensus sequences of core promoter
elements shown above. (c) Pie charts depicting the percentage of promoters of either TFIIB-dominated genes or NC2-dominated genes that
contain zero, one, two, or three motifs in their core region. (d) Matrix showing absolute frequencies of the indicated core promoter motifs or
motif combinations in TFIIB-dominated genes (left) or NC2-dominated genes (right). (e) Synergistic motif combinations in core promoters of
TFIIB-dominated genes. The bar graph depicts how often one of the specified reference motifs is found in combination with a second motif in
the same promoter. Co-occurrence of two motifs is expressed as fractional percentage, with the reference motif alone set to 100%.
Albert et al. Genome Biology 2010, 11:R33
/>Page 7 of 14
surrogate core element in TATA-less promoters [3].
Finally, 50% of promoters with a BREu-like motif
around position -32 contained an adjacent TATA-like
sequence and 32% a downstream TATA consensus,
reflecting the above observation of conserved BREu resi-
dues in TATA-containing promoters with high-TFIIB
levels.Takentogether,TFIIBstronglyselectsforTATA
as well as for synergistic combinations of TATA with
INR or DPE and, to a lesser extent, with BREu-like
sequences in human core promoters.
NC2 is more frequent on genes with multiple start sites
lacking defined core promoter elements
Next, CAGE data [31] were compared with the top 100
of either TFIIB- or NC2-dominated genes. This analysis
revealed that the majority of TFIIB-dominated genes
(69%) displayed focused TSS patterns starting from one
or very few dominant sites (Figure 6a). At NC2-domi-
nated promoters, dispersed TSS distributions were
enriched (68%). CAGE tags provide a quantitative mea-
sure for mRNA abundance. TFIIB-dominated genes
contained, on average, 948 CAGE tags per cluster,
whereas this number decreased to 279 tags per cluster
for NC2-dominated genes.
Average occupancy profiles of TFIIB and NC2 at p ro-
moters of genes with high or low TFIIB/NC2 ratios
(1,000 for each group) showed similar factor profiles at
the former group, with peak maxima coinciding at posi-
tion -50 (Figure 6b, left). I n contrast, at genes with low
NC2/TFIIB ratios a broader dist ribut ion of both factors
(ranging from -90 to -290) was observed (Figure 6b,
right). Here, NC2 is markedly enriched in upstream
regions relative to TFIIB, perhaps indicating a specific
role of NC2 on genes with multiple start sites. The rele-
vance of the difference in TFIIB versus NC2 distribu-
tions on these genes was confirmed with high
confidence (P < 2.2e -16) by running a Wilcoxon-Mann-
Whitney test on the positions of TFIIB and NC2.
TFIIB/NC2 ratios are influenced by both activators and
core promoter elements
To this point our data suggested that core promoters
and specifically TATA in synergy with other elements
influence the equilibrium between TFIIB and NC2. On
the other hand, PICs form in the absence of core ele-
ments in the majority of genes, raising questions as to
how factors are directed here. To model this situation,
we employed an in vitro PIC formation assay in which
transcription complexes were assembled on a Gal4-
responsive heterologous promoter template containing
either a wild-type or mutant TATA box, both in the
presence and absence of the model activator Gal4-VP16
(Figure 7). Whereas the activator enhanced TFIIB bind-
ing, NC2 remained essentially irresponsive to at least
this activator. Notably, the positive activa tor effect on
TFIIB was stronger for the template containing a
mutant TATA element (three-fold increase of TFIIB
binding) compared to the wild-type TATA template
(1.8-fold increase of TFIIB binding).
Discussion
Our analysis establishes the first genome-wide reference
data set for steady-state occupancy levels of vertebrate
PICs. The comparative analysis of TFIIB and NC2 occu-
pancy with gene expression further provides a frame-
work for future detailed analyses of basal versus gene
regulatory mechanisms on individual or groups of
human genes. Our data presently suggest that PIC (or
TBP-TFIIB) association correlates with TATA or is
independent of core e lements altogether, whereas NC2
association is largely independent of the underly ing core
promoter structure.
TFIIB and NC2 act globally and are present a t active
genes. We report a strong positive correlation of TFIIB
Figure 6 TFIIB/NC2 ratio reflects transcription start site
patterns. (a) Start site patterns in TFIIB- versus NC2-dominated
genes. Pie charts show the fraction of promoters for which a
distinct TSS pattern could be assigned. Individual regions displaying
single peak or dominant peak shape were classified as focused TSSs,
and those displaying broad or multimodal peak shape were
classified as dispersed TSSs (classification following [43]). Examples
of genes with focused and dispersed TSS patterns (taken from [44])
are shown. (b) TFIIB profiles (green) and NC2 profiles (red) at
promoters of TFIIB-dominated genes (left), or NC2-dominated genes
(right). For each profile the relative fraction of high-score (upper 5th
percentile) probes mapping to distinct 10 bp bins around the
aligned TSS is plotted, with score maxima arbitrarily set to 1.
Albert et al. Genome Biology 2010, 11:R33
/>Page 8 of 14
with gene expression levels at a genome-wide scale
(Figure 2d), which is in line with the factor’soriginal
definition as a crucial PIC component [11]. Conflicting
reports indicating a negative TFIIB impact through BRE
interactions (see Introduction) are not represented in
our genome-wide data, although we can not exclude
such mechanisms at specific genes. At least for highly
expressed genes, our data reason for an inhibitory func-
tion of NC2. It remains to be proven that NC2 can also
act positively on certain genes. Candidates for the latter
are multiple start sites genes that produce high mRNA
levels and display high NC2/TFIIB ratios. A possible
mechanism is that efficient promoter association of TBP
depends on NC2 at such genes.
Ourdatareasonagainstapositiveinfluenceofcore
elements on NC2 promoter association. For example,
NC2-dominated genes with high NC2/TFIIB ratios were
enriched for GC but depleted for core promoter ele-
ments, in particular TATA, BREu and DPE (Figure 5b-
d). Attempts to show direct specificity of TBP-NC2
complexes for GC-rich regions failed (Christine Göbel
and MM, unpublished). Enrichment of NC2 on such
genes probably reflects low initiation rates from start
sites located further upstream of a major TSS. At the
majority of genes, however, TFIIB and NC2 occupancy
distribution is very similar. This indirectly suggests that
TBP, the partner of both TFIIB and N C2, dictates the
recognition site. However, alternative scenarios in which
NC2 binding and PIC formation become coupled could
be projected. For example, when RNAPII clears the pro-
moter it leaves TBP behind [32]. The latter may subse-
quentlyberecognizedandstabilizedbytheabundant
NC2 complex.
NC2 occupancy and activity appear in a distinct light
if compared with TFIIB. A generally positive correlation
of binding with the presence of TATA turns into a
negative correlation relative to the competing GTF
TFIIB. Related to this, NC2 occupancy positively corre-
lates with gene expression, yet TFIIB correlation with it
is more pronounced. Indeed, TFIIB/NC2 ratios increase
especially in the most strongly expressed 5% of the B
cell genes (Figure 5a). Our data thus reason for a nega-
tive role of NC2 at strongly expressed genes carrying
intact core promoters. This is consistent with the origi-
nal reports by Reinberg and our laboratory [33-36].
TATA, although a rather in frequent motif, is posi-
tively correlated with the binding of TFIIB (Figure 3a).
Somewhat surprisingly, we found little evidence for a
critical role of the previously defined BREs in PIC for-
mation. The BREu conse nsus is found in appr oxim ately
3% of the preferred TFIIB target genes (Figure 3b). In
pre-selected TFIIB-dominated genes the BREu frequency
increases only moderately to 6% (Figure 5c). BREd is not
found above stochastic levels and, hence , is apparently
notlinkedtoTFIIB-drivenPICformation.Onemay
object that BREs are more degenerated in sequence and
difficult to track, especially in the absence of TATA
boxes, where the position of TFIIB-DNA i nteraction is
less predictable. Along this line we note that genes with
a high TFIIB/NC2 ratio often carry GC-rich regions that
resemble the upstream BREu. In summary, the data
imply that conserved BRE motifs w ith position and
sequence fidelity comparable to the TATA consensus
do not play a significant role in TFIIB promoter
association.
Most genes that bind TFIIB with high efficiency (top
5%) seem not to employ core elements to facilitate or
stabilize GTF-core promoter interactions. TATA con-
sensus is found with a frequency below 5%, TATA-like
elements reach 29% (Figure 3a). The DPE, downstream
core element and motif ten element were not detected
above stochastic levels in the top 5% of target genes of
either TFIIB or NC2. So far our attempts have failed to
select associated structure in core promoters for the few
genes where these elements may play a role. We could
also not r econstruct an alternative (that is, mammalian)
DPE from the information obtained with h igh-TFIIB or
high-NC2 target genes. Generally, core elements were
most well represented in a small subset of genes that
have high expression levels and at the same time display
high TFIIB/NC2 ratios. In this small subset we did iden-
tify with a frequency of 11% a positioned DPE-like motif
Figure 7 TFIIB and NC2 binding to TATA (+/-) promoters in
nuclear extracts. PICs were formed on immobilized HIV/AdML
promoter templates containing a wild-type (wt) or mutant (mt)
TATA box using Jurkat nuclear extract under basal conditions
(-VP16) or in the presence of the activator Gal4-VP16 (+VP16). After
washing, the reactions were analyzed by immunoblotting with
specific antibodies against TFIIB or NC2. Blots were scanned and
quantified using ImageJ [41]. Bars and error bars represent mean
and standard deviation of three independent reactions. TFIIB and
NC2 template association is expressed as percentage of relative
binding, with the reaction showing maximum binding set to 100%.
Albert et al. Genome Biology 2010, 11:R33
/>Page 9 of 14
conforming to the D rosophila consensus RGWYVT [3].
In contrast to the situation in Drosophila, DPE presence
is strongly linked to TATA in this subset of human pro-
moters (Figure 5d).
We hypothesize that at the majority of genes lacking
intact core elements, promoters are accessible in chroma-
tin and/or may ultimately direct GTFs to promoters via
interactions with regulatory surfaces, for example, through
gene-specific activators. To prove this assumption, indivi-
dual genes will have to be studied i n detail both in vivo
and in vitro. While this will undoubtedly uncover different
scenarios in directing PIC formation, w e have initially
taken a reductionist biochemical approach using one
model activator together with prototypic (TATA+/-,
INR+) promoters (Figure 7). Most importantly, the activa-
tor, and to a lesser extent TATA, influence binding of
TFIIB, while NC2 is unresponsive to the activator. NC2
also has less affinity for TATA, yet TBP-NC2 complexes
retain moderate specificity for TATA [30]. This result sug-
gests that PICs might be directed to promoters by activa-
tors, whereas the core promoters contribute to their
binding and less to the association of NC2 with promoters.
The high prevalenc e of intact core elements and their
combinations in the small subset of TFIIB-dominated
genesaswellasthepositivecorrelation of high TFIIB/
NC2 ratios to gene expressi on levels (Figure 5a) suggests
that core promoter elements contribute to gene activity in
this subgroup of genes. The model predicts that binding of
GTFs may be largely directed by activators on GC-rich
promoters, whereas direct binding of GTFs and, to a lesser
extent, regulatory factors contribute to the activity of the
small subset of genes carrying multiple intact core ele-
ments within promoters.
Conclusions
TFIIB and NC2 are global factors acting at a large frac-
tion of all human genes. TATA was revealed as the most
influential element for TFIIB recruitment and PIC forma-
tion. Most genes, however, recruit general factors in the
absence of known GTF binding sites. We hypothesize
that at these genes, TFIIB/NC2 ratios are determined by
interactions between regulatory factors and the RNAPII
machinery. There is overwhelming evidence for the influ-
ence of regulatory factors on PIC formation, but little
precedence for direct action of activators on NC2. This is
also the result of our in vitro binding studies using VP16
as a model for transactivators. On the other hand, core
promoter elements are the major determinant for PIC
binding in a subgroup of highly expressed genes that are
characterized by high TFIIB/NC2 ratios. This subgroup
establishes a small pool of human core promoters that
may prove useful for future analyses of interactions
between GTFs, cofactors and core promoters.
Materials and methods
Antibodies
Anti-TFIIB antibody (sc-225) and non-specific IgG
serum (sc-2027) we re purchased from Santa Cruz Bio-
technology (Santa Cruz, CA, USA). Anti-NC2 alpha
(DRAP1) antibody 4G7 has been previously described
[22].
Cell culture
LCL721 cells were grown in RPMI 1640 medium sup-
plemented with 10% (v/v) heat-inactivated fetal bovine
serum, 5 mM L-glutamine and 100 units/ml penicillin-
streptomycin (all from Invitrogen, Karlsruhe, Germany)
in a humidified incubator at 37°C and 5% CO
2
.
Chromatin immunoprecipitation
We pelleted 1 × 10
8
cells (0.4 × 10
6
cells/ml) by centri-
fugation (1,200 rpm, 5 minutes) and washed them with
PBS. The cell pellet was resuspended in 36 ml of PBS.
Cells were fixed by adding 4 ml of a freshly prepared
10% formaldehyde solution (10% (v/v) formaldehyde
(Sigma- Aldrich, Tauf kirchen, Germany), 140 mM N aCl,
1mMEDTA,0.5mMEGTA,50mMHepes-KOHpH
8.0). Cross-linking was done for 9 minutes at room tem-
perature, followed by quenching wit h 125 mM glycine,
with immediate transfer of cells to ice f ollowed by 5
minutes incubation on ice. Cells were washed twice with
ice-cold PBS and sequentially lysed by resuspending the
cell pellet in 5 ml of ice-cold ChIP lysis buffer 1 (50
mM Hepes-KOH pH 7. 4, 140 mM NaCl, 1 m M EDTA,
0.5 mM EGTA, 10% (v/v) glycerol, 0.5% (v/v) Igepal
CA-630 (Sigma-Aldrich, Taufkirchen, Germany), 0.25%
Triton X-100 (Sigma-Aldrich), and freshly added 1×
protease inhibitor cocktail (Roche, Man nheim, Ger-
many)) and 10 minutes rotation at 4°C. Cells were col-
lected by centrifugation (4,000rpm,10minutes,4°C),
followed by resuspension in 5 ml of ice-cold ChIP lysis
buffer 2 (10 mM Tris-HCl pH 8.0, 200 mM NaCl, 1
mM EDTA, 0.5 mM EGTA, freshly added 1× protease
inhibitor cocktai l) and 10 minutes rotatio n at 4°C. After
centrifugation (4,000 rpm, 10 minutes, 4°C) , the pellet
was resuspended in 3 ml of ice-cold ChIP lysis buffer
3 (10 mM Tris-HCl pH 8.0, 140 mM NaCl, 1 mM
EDTA, 1 mM EGTA, 0.5% N-lauryl sarcosine (Sigma-
Aldrich), 0.1% sodium deoxycholate (Sigma-Aldrich),
and 1× protease inhibitor cocktail). Acid-washed glass
beads (212 to 300 microns; Sigma-Aldrich) were added,
and the cross-linked chromatin was sheared to an aver-
age size of 300 bp by 6 m inutes sonication (40% power
output, with pulses set to 30 s ON/10 s OFF) in an ice-
water bath using a Branson 250-D sonicator and a
microtip. After sonication, Triton X-100 was added to
0.5% as final conce ntration, and the lysate was
Albert et al. Genome Biology 2010, 11:R33
/>Page 10 of 14
centrifuged (5,500 rpm, 5 minutes, 4°C) to remove cell
debris. The chromatin ext ract was pre-cleared with 100
μl b locked (pre-absorbed with PBS/0.5% (w/v) BSA
(Sigma-Aldrich)) protein A/G sepharose FF beads (GE
Healthcare, Munich, Germany) for 2 h at 4°C, quantified
in a UV spectrophotometer and diluted to 1 mg/ml and
0.25% N-lauryl sarcosine. We used 500 μlofthechro-
matin extract per single ChIP reaction in lubricated
tubes in a total volume of 1 ml. The extract was incu-
bated overnight at 4°C with 50 μl blocked protein A/G
sepharose beads that had been pre-adsorbed with 10 μg
of antibody. Immune complexes were collected by cen-
trifugation (3,000 rpm, 1 minute, 4°C) and washed six
times with 1 ml of ice-cold ChIP wash buffer (50 mM
Hepes-KOH pH 7.4, 500 mM LiCl, 1 mM EDTA, 1%
Igepal Ca-630, 0.7% sodium deoxycholate, and freshly
added 0.5× protease inhibitor cocktail) and one time
with 1× TE (10 mM Tris-HCl pH 8.0, 1 mM EDTA)
containing 50 mM NaCl. The protein-DNA complexes
were eluted from the beads by adding 200 μlChIPelu-
tion buffer (50 mM Tris-HCl pH 8.0, 10 mM EDTA, 1%
sodium dodecyl sulfate (SDS; Invitrogen)) and in cuba-
tion at 65°C under constant agitation for 10 minutes.
After removal of beads b y centrifugation (6,000 rpm, 5
minutes, room temperature) the supernatant was incu-
bated at 65°C overnight to revert the cross-links. Then,
the sample was diluted to 400 μl with 1× TE. DN Ase-
free RNAse A (8 μg; RPA grade; Applied Biosystems,
Foster City, CA, USA) was added and the s ample was
incubated for 1 h at 37°C, followed by addition of pro-
teinase K (PCR grade; Roche) to 250 μg/ml and diges-
tion for 2 h at 55°C. Genomic DNA was isolated from
the precipitated material as well as from the sheared
chromatin input (1% of the material used for ChIP) by
phenol extraction and ethanol precipitation.
ChIP-chip
ChIP and input DNA was end-polished using T4 DNA
polymerase (New England Biolabs, Ipswich, MA, USA)
and 200 μM dNTPs for 20 minutes at 12°C. After phe-
nol extraction and ethanol precipitation, blunted DNA
was ligated to 100 pmol of annealed linker (of oligo-25,
5’-GCGGTGACCCGGGAGATCTGAATTC, and oligo-
11, 5’ -GAATTCAGATC) using T4 DNA ligase (New
England Biolabs) overnight at 16°C. DNA was ethanol
precipitated and amplified by ligation-mediated PCR in
a total volume of 55 μl containing 250 μMdNTPs,50
pmol of oligo-25, 5 units of Taq polymerase (New Eng-
land Biolabs) and 0.025 units of Pfu Turbo polymerase
(Stratagene, La Jolla, CA, USA) for one initial cycle con-
sisting of 2 minutes at 55° (during which polymerase
was added), 5 minutes at 72°C and 2 minutes at 94°C,
followed by 22 cycles of 0.5 minutes at 94°C, 0.5 min-
utes at 60°C and 2 minutes at 72°C, and a final 4-minute
extension at 72°C. Amplicons were purified with a PCR
purification kit (Qiagen, Hilden, Germany). At least 5
μg of amplified ChIP and input DNA were labeled and
hybridized to human promoter arrays (NimbleGen
HGS17 human 1.5 K promoter chip) containing 24,134
human promoter regions, each represented by a probe
set of 15 tiling 50-mer oligonucleotide probes covering
1.5 kb DNA around TSSs. Slides were scanned by Nim-
bleScan and raw data were processed by NimbleGen
according to s tandard procedures [37]. Briefly, for each
feature a log2 ratio of the hybridization intensities of
the co-hybridized ChIP and input DNA was deter-
mined. These ratios were scaled to center the data
around zero by robust statistics. Specifically, scaling
was performed by subtracting Tukey’s bi-weight mean
for the log2 ratios of all array features from each indi-
vidual log2 ratio. The median of the scaled log2 ChIP/
input ratio of each probe set provides a measure for
promoter occupancy.
ChIP-qPCR
ChIP-qPCR analysis was done with Power SYBR green
PCR master mix in an ABI StepOne Plus thermocycler
(Applied Biosystems, Foster City, CA, USA). Triplicate
reactions were carried out in a total volume of 10 μl
containing 4 pmol of forward and reverse primers. Reac-
tions containing serially diluted input DNA were used as
standard curve to quantify ChIP DNA reactions. Melting
curve analysis was used to determine the specificity of
all reactions. Primer sequences are available upon
request.
Computational and statistical analyses
Peak finding was done using the Mpeak program [26].
Peaks were called under different stringency settings,
with cut-offs of mean log
2
signal ratios (ChIP versus
total DNA) plus either 1, 2, or 2.5 standard deviations
(Table 1). High-resolution binding profiles were gener-
ated by extracting and remapping of relevant array
probe sequences to their exact position in the NCBI
build 36 of the human genome. A slightly modified ver-
sion of the RegionMiner software (Genomatix, Munich,
Germany) was used to correlate the position of single
high-score probes (upper 5th percenti le) with annotated
TSSs (Figures 1d and 6b). To avoid positional bias, the
relative fraction of high-score probes mapping to dis-
tinct 10-bp bins around aligned TSSs was calculated
with respect to the number of all available probes at this
position. Correlation analyses of factor occupancy and
gene expression leve ls w ere conducted as follows:
steady-state mRNA expression levels were derived from
polyadenylated RNA of LCL721 cells hybridized to an
Affymetrix U133 Plus 2.0 microarray that covers probe-
sets for the analysis of over 47,000 human transcripts
Albert et al. Genome Biology 2010, 11:R33
/>Page 11 of 14
(data available as SI Data Set 2 in reference [22]). Data
analysis with GCOS software and default statistical
algorithm parameters was performed by Affymetrix
service provider KFB (Regensburg, Germany). Log
2
-
scaled ChIP/input enrichment of TFIIB or NC2 on
NimbleGen promoter probesets (see above) were
matched with corresponding Affymetrix probeset IDs
(only using probesets with ‘present’ calls) to generate
the gene expression correlation analysis of TFIIB (Fig-
ure 2d) or TFIIB/NC2 ratios (Figure 5a). Degree of cor-
relation between data sets in Figures 1a, 2d and 4a was
determined by applying the Pearson correlation func-
tion in Microsoft Excel. For other statistical analyses
the Bioconductor package was used. These included
the evaluation of the statistical significance of the dif-
ference of Affymetrix probeset signal values for genes
that do have a top 10% enrichment score against t he
distribution of all probeset signal values using a Kol-
mogorov-Smirnov test (Figure 2e). The hypothesis that
both distribu tions a re similar can be denied on a signif-
icance level of P < 0.01, thus making it clear that the
data for these genes differ from the complete set. To
accomplish this we used the ks.boot function from the
‘ Matching’ package (provided by JS Sekhon) [38], for
the R software for statistical computing [39]. Similarly,
the relevance of the difference in TFIIB versus NC2
distributions on genes (Figure 6b) was revealed by run-
ning a Mann-Whitney-Wilcoxon test on the factor
positions using the R package [39].
Immobilized template assay and in vitro transcription
Immobilized template assays and in vitro transcription
were performed as described [40]. The pGL2-MRG5
promoter template was amplified from vector pGL2-
MRG5. It contains five Gal4 binding sites immediately
upstream of a synthetic HIV/AdML core promoter
driving expression of a downstream luciferase cassette.
Amplification primers were biotinylated 5’ -GCATTC-
TAGTTGTGGTTTGTCCAA and 5’ -ATACGAC-
GATTCTGTGATTTG. Templates were purified on 1%
(w/v) agarose gels, recovered using a gel extraction kit
(Qiagen) and coupled to paramagnetic streptavidin
beads (Promega, Madison, WI, USA) as follows: beads
were washed twice in B&W buffer (5 mM Tris-HCl
pH 7.5, 1 mM EDTA, 1 M NaCl, 0.003% Igepal CA-
630). Subsequently, beads were resuspended in B&W
buffer, and 15 ng biotinylated template (in 1× TE pH
8.0 containing 1 M NaCl) was added for each micro-
gram of magnetic beads. After shaking for 45 minutes
at room temperature, beads were washed once in
B&W buffer containing 0.5 mg/m l BSA (fraction V;
Sigma-Aldrich). For blo cking, beads were resuspended
at a concentration of 1 μg/μlinbufferA(60mMKCl,
20 mM Hepes-KOH pH 8.2, 5 mM MgCl
2
,10mM
dithiothreitol (DTT; Sigma-Aldrich), 0.025% Igepal
CA-630, 0.2 mM phenylmethanesulfonyl fluoride
(PMSF; Sigma-Aldrich)) containing 5 mg/ml BSA and
5 mg/ml polyvinylpyrrol idone (Sigma-Aldrich) and
incubated for 15 minutes at room temperature. After-
wards, beads were washed three times with buffer A.
PIC assembly was conducted in a total volume of 200
μl with 1,050 ng pGL2-MRG5 promoter template
coupled to 70 μgbeads,2μg poly(dG:dC) competitor
DNA, 100 to 200 μg Jurkat nuclear extract and, if indi-
cated, 200 ng Gal4-VP16 (the carboxy-terminal 147
amino acids of the Saccharomyces cerevisiae Gal4p
DNA-binding domain linked to the Herpes simplex
virus VP16 activation domain comprising residues 411
to 490). PIC assembly buffer was composed of 20 mM
Hepes-KOHpH8.2,5mMMgCl
2
, 10 mM DTT,
0.025% Igepal CA-630, 0.5 mg/ml BSA (Roche), 10%
(w/v) glycerol, 0.1 mg/ml PEG 8000 and 0.2 mM
PMSF. After 45 minutes incubation at 30°C the tem-
plate-bound complexes were co ncen trated with a mag-
net and washed three times with 200 μl buffer A. PICs
were either eluted with Laemmli buffer and analyzed
by immunoblot or probed in an in vitro transcripton
reaction (see below). Immunoblots were scanned and
signal intensities quantified using the ImageJ program
[41]. To test for the activity of template-associated
PICs, in vitro transcription was performed. PICs were
formed as above, washed and resuspended in transcrip-
tion buffer (20 mM Hepes-KOH pH 8.2, 60 mM KCl,
5mMMgCl
2
, 10 mM DTT, 0.025% Igepal CA-630 0.5
mg/ml BSA, 10% (w/v) glycerol, 0.1 mg/ml PEG 8000,
4 units RNAsin (Promega), 0.2 mM PMSF). Transcrip-
tion was initiated by addition of the NTP mix supple-
mented with 1 μlalpha-
32
P UTP (3,000 Ci/mmol).
Final NTP concentrations were 100 μM ATP, CTP and
GTP each, and 5 μM UTP. Transcription reactions
were incubated at 30°C for 30 minut es and stopped by
addition of 400 μl transcription stop buffer (7 M urea,
10 mM Tris-HCl pH 7.8, 10 mM EDTA pH 8.0, 300
mM sodium acetate, 0.5% SDS, 100 mM lithium chlor-
ide, 0.4 mg/ml yeast tRNA). Reactions were extracted
with phenol/chloroform, RNA precipitated with isopro-
panol and analyzed by autoradiography.
Data accession
The raw and processed ChIP-chip data have been
depo sited at the Gene Expression Omnibus (GEO) pub-
lic repository [42] and are accessible as [GEO:
Albert et al. Genome Biology 2010, 11:R33
/>Page 12 of 14
GSE19562]. Scaled log2 ChIP/input ratios of NimbleGen
probeset signals from the TFIIB and NC2 ChIP-chip
experiments are also available as Additional file 2.
Additional file 1: Aligned core promoter regions of TFIIB target
genes. Nucleotide frequency plots of TSS-aligned core promoter regions
from high-, low- and no-TFIIB genes.
Additional file 2: Data set of TFIIB and NC2 ChIP-chip signals. Log2-
scaled ChIP/input ratios of probeset signals from TFIIB and NC2 ChIP-chip
experiments using two biological samples (Px5, chromatin from LCL721 B
cells of passage 5; Px7, chromatin from LCL721 B cells of passage 7) on a
NimbleGen human (HG17) promoter array. The data set includes the
median, mean and standard deviation of 24,134 probesets, each
composed of 15 individual 50-oligomer probes.
Abbreviations
AdML: Adenovirus major late; bp: base pair; BREd: downstream TFIIB
recognition element; BREu: upstream TFIIB recognition element; BSA: bovine
serum albumin; CAGE: cap analysis gene expression; ChIP: chromatin
immunoprecipitation; ChIP-chip: ChIP with detection by microarrays; DPE:
downstream promoter element; DTT: dithiothreitol; GAPDH: glyceraldehyde
3-phosphate dehydrogenase; GTF: general transcription factor; INR: initiator;
NC2: negative cofactor 2 (DR1/DRAP1); PBS: phosphate-buffered saline; PEG:
polyethylene glycol; PIC: preinitiation complex; PMSF: phenylmethanesulfonyl
fluoride; qPCR: quantitative PCR; RNAPII: RNA polymerase II; TATA: TATA box;
TBP: TATA box-binding protein; TFIIB: general transcription factor IIB (GTF2B);
TSS: transcription start site.
Acknowledgements
We thank J-C Andrau for providing PCR primer sequences for human
GAPDH, and B Lenhard for comments on the manuscript. This work was
supported by grants from the German Ministry for Education and Research
(grant 0313030A) and the European Union (EUTRACC, grant LSHG-CT-2007-
037445) to MM.
Author details
1
Institute of Molecular Tumor Biology (IMTB), University of Muenster, Robert-
Koch-Str. 43, 48149 Muenster, Germany.
2
Genomatix Software GmbH,
Bayerstr. 85a, 80335 Munich, Germany.
Authors’ contributions
TKA and MM conceptualized the study; TKA and SB performed the
experiments; TKA, KG and MM conducted the analyses; TKA and MM wrote
the manuscript.
Received: 17 October 2009 Revised: 22 February 2010
Accepted: 15 March 2010 Published: 15 March 2010
References
1. Lifton RP, Goldberg ML, Karp RW, Hogness DS: The organization of the
histone genes in Drosophila melanogaster : functional and evolutionary
implications. Cold Spring Harb Symp Quant Biol 1978, 42:1047-1051.
2. Smale ST, Baltimore D: The “initiator” as a transcription control element.
Cell 1989, 57:103-113.
3. Burke TW, Kadonaga JT: Drosophila TFIID binds to a conserved
downstream basal promoter element that is present in many TATA-box-
deficient promoters. Genes Dev 1996, 10:711-724.
4. Lewis BA, Kim TK, Orkin SH: A downstream element in the human beta-
globin promoter: evidence of extended sequence-specific transcription
factor IID contacts. Proc Natl Acad Sci USA 2000, 97:7172-7177.
5. Deng W, Roberts SG: A core promoter element downstream of the TATA
box that is recognized by TFIIB. Genes Dev 2005, 19:2418-2423.
6. Lagrange T, Kapanidis AN, Tang H, Reinberg D, Ebright RH: New core
promoter element in RNA polymerase II-dependent transcription:
sequence-specific DNA binding by transcription factor IIB. Genes Dev
1998, 12:34-44.
7. Lim CY, Santoso B, Boulay T, Dong E, Ohler U, Kadonaga JT: The MTE, a
new core promoter element for transcription by RNA polymerase II.
Genes Dev 2004, 18:1606-1617.
8. Juven-Gershon T, Hsu JY, Theisen JW, Kadonaga JT: The RNA polymerase II
core promoter - the gateway to transcription. Curr Opin Cell Biol 2008,
20:253-259.
9. Thomas MC, Chiang CM: The general transcription machinery and
general cofactors. Crit Rev Biochem Mol Biol 2006, 41:105-178.
10. Saxonov S, Berg P, Brutlag DL: A genome-wide analysis of CpG
dinucleotides in the human genome distinguishes two distinct classes
of promoters. Proc Natl Acad Sci USA 2006, 103:1412-1417.
11. Sawadogo M, Roeder RG: Factors involved in specific transcription by
human RNA polymerase II: analysis by a rapid and quantitative in vitro
assay. Proc Natl Acad Sci USA 1985, 82:4394-4398.
12. Tsai FT, Sigler PB: Structural basis of preinitiation complex assembly on
human pol II promoters. EMBO J 2000, 19:25-36.
13. Evans R, Fairley JA, Roberts SG: Activator-mediated disruption of
sequence-specific DNA contacts by the general transcription factor TFIIB.
Genes Dev 2001, 15:2945-2949.
14. Gershenzon NI, Ioshikhes IP: Synergy of human Pol II core promoter
elements revealed by statistical sequence analysis. Bioinformatics 2005,
21:1295-1300.
15. Frith MC, Valen E, Krogh A, Hayashizaki Y, Carninci P, Sandelin A: A code for
transcription initiation in mammalian genomes. Genome Res 2008,
18:1-12.
16. Huisinga KL, Pugh BF: A TATA binding protein regulatory network that
governs transcription complex assembly. Genome Biol 2007, 8:R46.
17. Zanton SJ, Pugh BF: Changes in genomewide occupancy of core
transcriptional regulators during heat stress. Proc Natl Acad Sci USA 2004,
101:16843-16848.
18. Venters BJ, Pugh BF: A canonical promoter organization of the
transcription machinery and its regulators in the Saccharomyces
genome. Genome Res 2009, 19:360-371.
19. Andrau JC, Pasch van de L, Lijnzaad P, Bijma T, Koerkamp MG, Peppel van
de J, Werner M, Holstege FC: Genome-wide location of the coactivator
mediator: Binding without activation and transient Cdk8 interaction on
DNA. Mol Cell 2006, 22:179-192.
20. Zhu X, Wiren M, Sinha I, Rasmussen NN, Linder T, Holmberg S, Ekwall K,
Gustafsson CM: Genome-wide occupancy profile of mediator and the
Srb8-11 module reveals interactions with coding regions. Mol Cell 2006,
22:169-178.
21. van Werven FJ, van Bakel H, van Teeffelen HA, Altelaar AF, Koerkamp MG,
Heck AJ, Holstege FC, Timmers HT: Cooperative action of NC2 and Mot1p
to regulate TATA-binding protein function across the genome. Genes Dev
2008, 22:2359-2369.
22. Albert TK, Grote K, Boeing S, Stelzer G, Schepers A, Meisterernst M: Global
distribution of negative cofactor 2 subunit-alpha on human promoters.
Proc Natl Acad Sci USA 2007, 104:10000-10005.
23. Birney E, Stamatoyannopoulos JA, Dutta A, Guigo R, Gingeras TR,
Margulies EH, Weng Z, Snyder M, Dermitzakis ET, Thurman RE, Kuehn MS,
Taylor CM, Neph S, Koch CM, Asthana S, Malhotra A, Adzhubei I,
Greenbaum JA, Andrews RM, Flicek P, Boyle PJ, Cao H, Carter NP,
Clelland GK, Davis S, Day N, Dhami P, Dillon SC, Dorschner MO, Fiegler H,
et al: Identification and analysis of functional elements in 1% of the
human genome by the ENCODE pilot project. Nature 2007, 447:799-816.
24. Denissov S, van Driel M, Voit R, Hekkelman M, Hulsen T, Hernandez N,
Grummt I, Wehrens R, Stunnenberg H: Identification of novel functional
TBP-binding sites and general factor repertoires. EMBO J 2007,
26:944-954.
25. Kim TH, Barrera LO, Zheng M, Qu C, Singer MA, Richmond TA, Wu Y,
Green RD, Ren B: A high-resolution map of active promoters in the
human genome. Nature 2005, 436:876-880.
26. Zheng M, Barrera LO, Ren B, Wu YN: ChIP-chip: data, model, and analysis.
Biometrics 2007, 63:787-796.
27. Singh BN, Hampsey M:
A transcription-independent role for TFIIB in gene
looping. Mol Cell 2007, 27:806-816.
28. Crooks GE, Hon G, Chandonia JM, Brenner SE: WebLogo: a sequence logo
generator. Genome Res 2004, 14:1188-1190.
29. Bailey TL, Elkan C: Fitting a mixture model by expectation maximization
to discover motifs in biopolymers. Proc Int Conf Intell Syst Mol Biol 1994,
2:28-36.
Albert et al. Genome Biology 2010, 11:R33
/>Page 13 of 14
30. Gilfillan S, Stelzer G, Piaia E, Hofmann MG, Meisterernst M: Efficient binding
of NC2. TATA-binding protein to DNA in the absence of TATA. J Biol
Chem 2005, 280:6222-6230.
31. Kawaji H, Kasukawa T, Fukuda S, Katayama S, Kai C, Kawai J, Carninci P,
Hayashizaki Y: CAGE Basic/Analysis Databases: the CAGE resource for
comprehensive promoter analysis. Nucleic Acids Res 2006, 34:D632-636.
32. Yudkovsky N, Ranish JA, Hahn S: A transcription reinitiation intermediate
that is stabilized by activator. Nature 2000, 408:225-229.
33. Goppelt A, Stelzer G, Lottspeich F, Meisterernst M: A mechanism for
repression of class II gene transcription through specific binding of NC2
to TBP-promoter complexes via heterodimeric histone fold domains.
EMBO J 1996, 15:3105-3116.
34. Inostroza JA, Mermelstein FH, Ha I, Lane WS, Reinberg D: Dr1, a TATA-
binding protein-associated phosphoprotein and inhibitor of class II gene
transcription. Cell 1992, 70:477-489.
35. Schluesche P, Stelzer G, Piaia E, Lamb DC, Meisterernst M: NC2 mobilizes
TBP on core promoter TATA boxes. Nat Struct Mol Biol 2007, 14:1196-1201.
36. Xie J, Collart M, Lemaire M, Stelzer G, Meisterernst M: A single point
mutation in TFIIA suppresses NC2 requirement in vivo . EMBO J 2000,
19:672-682.
37. Roche NimbleGen. [].
38. Multivariate and Propensity Score Matching Software for Causal
Inference. [ />39. The R Project for Statistical Computing. [].
40. Boeing S, Rigault C, Heidemann M, Eick D, Meisterernst M: RNAPII CTD SER-
7 phosphorylation is established in a mediator-dependent fashion. J Biol
Chem 2009.
41. ImageJ. [ />42. Gene Expression Omnibus. [ />43. Carninci P, Sandelin A, Lenhard B, Katayama S, Shimokawa K, Ponjavic J,
Semple CA, Taylor MS, Engstrom PG, Frith MC, Forrest AR, Alkema WB,
Tan SL, Plessy C, Kodzius R, Ravasi T, Kasukawa T, Fukuda S, Kanamori-
Katayama M, Kitazume Y, Kawaji H, Kai C, Nakamura M, Konno H, Nakano K,
Mottagui-Tabar S, Arner P, Chesi A, Gustincich S, Persichetti F, et al:
Genome-wide analysis of mammalian promoter architecture and
evolution. Nat Genet 2006, 38:626-635.
44. Cage Basic Viewer. [ />doi:10.1186/gb-2010-11-3-r33
Cite this article as: Albert et al.: Basal core promoters control the
equilibrium between negative cofactor 2 and preinitiation complexes in
human cells. Genome Biology 2010 11:R33.
Submit your next manuscript to BioMed Central
and take full advantage of:
• Convenient online submission
• Thorough peer review
• No space constraints or color figure charges
• Immediate publication on acceptance
• Inclusion in PubMed, CAS, Scopus and Google Scholar
• Research which is freely available for redistribution
Submit your manuscript at
www.biomedcentral.com/submit
Albert et al. Genome Biology 2010, 11:R33
/>Page 14 of 14