Báo cáo y học: "Identifying transcriptional targets" pdf
Bạn đang xem bản rút gọn của tài liệu. Xem và tải ngay bản đầy đủ của tài liệu tại đây (1004.41 KB, 7 trang )
Genome Biology 2004, 5:210
comment
reviews
reports deposited research
interactions
information
refereed research
Review
Identifying transcriptional targets
Nicola V Taverner, James C Smith and Fiona C Wardle
Addresses: Wellcome Trust/Cancer Research UK Gurdon Institute and Department of Zoology, University of Cambridge, Cambridge
CB2 1QR, UK.
Correspondence: Fiona C Wardle. E-mail:
Abstract
Identifying the targets of transcription factors is important for understanding cellular processes.
We review how targets have previously been isolated and outline new technologies that are
being developed to identify novel direct targets, including chromatin immunoprecipitation
combined with microarray screening and bioinformatic approaches.
Published: 27 February 2004
Genome Biology 2004, 5:210
The electronic version of this article is the complete one and can be
found online at />© 2004 BioMed Central Ltd
The control of many cellular processes requires the coordi-
nated activation or repression of genes in the correct spatial
and temporal patterns. This regulation is carried out in large
part by transcription factors, which bind to DNA sequences
within chromatin and activate or repress the transcription of
nearby genes. This binding is frequently sequence-specific,
with sequence recognition being carried out by the transcrip-
tion factor itself or by other proteins complexed to it. Identi-
fication of the targets of each transcription factor provides
information about individual processes and how transcrip-
tion factors interact in a transcriptional network. These net-
works can then be used to describe a particular cellular
process, or even something as complicated as embryonic
development [1,2].
The first step in identifying targets of a transcription factor
usually involves overexpression or knockdown of the factor
in question and analysis of the resulting changes in gene
expression. The development of microarray technology has
facilitated this kind of analysis, allowing identification of
many more downstream genes than was previously feasible.
But this method gives no information about whether targets
are regulated directly by the transcription factor through
binding to regulatory sequences within the gene or whether
regulation is indirect, through the activation of intermediate
genes. Other techniques, such as chromatin immunoprecipi-
tation (ChIP) and Dam methylase identification (DamID),
have therefore been developed. These reveal where in the
genome the transcription factor is bound; these approaches
allow identification of many direct target sequences, particu-
larly when it is combined with microarrays of genomic DNA.
This type of information, in combination with genomic
sequences, is now being used to develop computational algo-
rithms that scan genomic sequence with the aim of distin-
guishing functional binding sites and target genes of
transcription factors.
Identification of downstream genes
Comparison of two cell populations in which a given tran-
scription factor is differentially expressed, either by overex-
pression or knockdown, has been used to identify the target
genes activated by transcription factors in a wide range of
systems. The resulting mRNA populations may be analyzed
in a number of ways, such as reverse-transcriptase-coupled
(RT-)PCR of candidates, subtractive hybridization, differ-
ential display or serial analysis of gene expression (SAGE;
see Figure 1). For instance, a large-scale screen to describe
transcriptional networks in the development of sea urchins
has recently been undertaken: genes involved in endomeso-
derm development - including those encoding transcription
factors - were overexpressed or knocked down, and mRNA
populations were compared using subtractive hybridization
and RT-PCR of candidate genes [1].
210.2 Genome Biology 2004, Volume 5, Issue 3, Article 210 Taverner et al. />Genome Biology 2004, 5:210
Figure 1 (see the legend on the next page)
TG(A)n
CG(A)n
TG(A)n
AC(A)n
Reverse
transcription
PCR with primers
specific to mRNA
2
AC(T)n
GC(T)n
AC(T)n
TG(T)n
mRNA
1
mRNA
2
mRNA
1
mRNA
3
(a) Candidate gene RT-PCR
Population 1 Population 2
PCR product produced
Make cDNA from
population 1
Remove double-stranded
cDNA/mRNA hybrids and
mRNA molecules
Clone single-stranded cDNA
molecules and sequence them
(b) Subtractive hybridization
RT-PCR with (T)nCG
and arbitrary 7-mer
RT-PCR
with (T)nCA
and arbitrary
7-mer
100-500
base-pair
PCR
products
run on
sequencing
gel
Any cDNAs present in only one population
can be cloned and sequenced
Pop1Pop2
(c) Differential display
Make cDNA and digest with
restriction enzyme which cuts at
a 4 base-pair recognition site
AC(T)n
TG(A)n
TG(A)n
GC(T)n
CG(A)n
CG(A)n
AC(T)n
TG(T)n
AC(A)n
Isolate 3′ ends with
beads binding poly(dT)
Ligate 5′ linker with
type IIS linker site
AC(T)n
TG(A)n
GC(T)n
AC(T)n
TG(A)n
TG(T)n
AC(A)n
Cut with enzyme which
cleaves 13 base-pairs
away from type IIS
recognition site
Concatenate and sequence
No PCR product
GC(T)n
GC(T)n
AC(T)n
GC(T)n
Hybridize to mRNA from
population 2
AC(T)n
TG(A)n
AC(A)n
Compare sequences between the two populations
Pop1Pop2
(d) Serial analysis of gene expression (SAGE)
Such approaches have their limitations, however. Overexpres-
sion or misexpression of a transcription factor may not lead
to up-regulation of its target genes if transcription is tightly
controlled, or alternatively it may lead to indiscriminate acti-
vation of other genes that are not usually activated by the
transcription factor under physiological conditions. On the
other hand, knockdown of a transcription factor may cause
embryonic or cellular lethality, or there may be redundancy
with another factor so that bona fide target genes are not
downregulated and therefore may not be identified. Never-
theless, these methods have been used successfully to identify
transcription-factor target genes (see, for example, [3,4]).
Once putative target genes have been identified, they are
often verified by examination of their expression pattern in
tissues or whole organisms, since direct targets are expected
to be activated in the regions where the transcription factor
is expressed. Expression of putative target genes can also be
compared between wild-type and mutant systems, as targets
should not be expressed in the absence of the transcription
factor (see [5] for example).
These methods identify only a limited number of targets, but
more recently high-throughput techniques have allowed the
identification of many more. Projects for sequencing both
genomic DNA and expressed sequence tags (ESTs) have led
to the development of expression microarrays, which enable
simultaneous screening of most or all of the transcriptome
and thus increase the number of targets that can be easily
identified through comparisons of mRNA populations. In
such experiments, RNA from each of the two cell popula-
tions, as described above and in Figure 1, is labeled with a
different fluorescent dye. The RNA is then mixed and
hybridized to microarrays, consisting of cDNAs or
oligonucleotides arrayed on glass slides. The fluorescence
intensity of each dot, which corresponds to one gene, can be
measured and correlated to a change in expression of each
gene [6]. For example, circadian gene expression in
Drosophila, which is at least partially controlled by the Clock
(Clk) transcription factor, was recently analyzed using
microarrays [7]. Comparison of gene expression in wild-type
and clk mutant flies led to the identification of 134 genes that
require Clk for expression and whose expression levels cycle
over 24 hours in wild-type flies [7].
In addition to giving increased numbers of potential tran-
scription-factor targets, the ease with which large numbers
of genes can now be investigated allows comparison of more
than two different conditions, giving a clearer indication
about which genes may be direct targets. For example, to
identify targets of the sterol-regulatory-element binding
protein (SREBP) genes in mice, Horton et al. [8] compared
gene expression in the livers of one knockout strain and two
transgenic strains of mice that overexpress different forms of
SREBP. They applied stringent combinatorial criteria to
identify direct targets, restricting themselves only to genes
that were upregulated in both transgenic lines and downreg-
ulated in the knockout line. As a result, 33 genes were identi-
fied by this method, only 38% of the genes that would have
been identified by comparing just two of the strains.
Although this combinatorial method clearly increases the
likelihood of predicting a direct target, other methods must
be used to be more confident of a direct interaction of the
transcription factor with the target gene.
Testing for direct activation of putative
target genes
A variety of methods can be used to identify targets that are
likely to be regulated directly by a transcription factor.
Timing is one criterion: for example, immediate early genes,
which are switched on shortly after the activation of a tran-
scription factor, are more likely to be activated directly by
that factor, because there has been little time for another
gene to be activated and then for that to activate the target
gene. This type of analysis is facilitated by the use of
inducible gene expression, so the precise moment at which
the transcription factor is activated and able to induce
expression of downstream genes is known [9].
This technique can be further improved by the use of protein-
synthesis inhibitors, such as cycloheximide. Transcription
factors that are already present within the cell are able to acti-
vate the expression of their target genes, but in the presence
comment
reviews
reports deposited research
interactions
information
refereed research
Genome Biology 2004, Volume 5, Issue 3, Article 210 Taverner et al. 210.3
Genome Biology 2004, 5:210
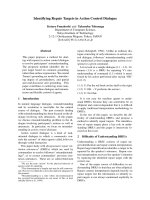
Figure 1 (see figure on the previous page)
Four established techniques that are used to identify transcription-factor targets. These methods all compare mRNAs extracted from two populations of
cells, one of which has the transcription factor in question overexpressed or knocked out. (a) Differences in the levels of specific candidate target genes in
the two populations can be analyzed by reverse-transcriptase-coupled (RT-)PCR (for example, see [1,40]). (b) Any mRNAs that are equally expressed in
both populations are subtracted, or removed, by cDNA-RNA hybridization. The remaining cDNAs are derived from mRNAs that are differentially
expressed in one of the populations, and these can then be cloned and sequenced [3]. (c) With differential display, partial cDNA sequences are amplified
from mRNA pools by RT-PCR. One primer - (T)
n
NN - binds to the polyadenylated tail of a subset of mRNAs that is defined by the two bases immediately
5Ј to the tail. The other binds to short sequences (6 or 7 base-pairs) that will occur with moderate frequency within the transcriptome. The products are
radiolabeled and analyzed by polyacrylamide gel electrophoresis. Short cDNAs present in only one population can be isolated and sequenced [41,42]. (d)
In serial analysis of gene expression (SAGE), cDNA is synthesized from mRNA and cleaved by a restriction enzyme that recognizes a 4 nucleotide
sequence. The 3Ј end of the cleaved cDNA is isolated using beads that bind to oligo-dT, and 5Ј linkers are ligated to the restriction sites. These linkers
contain type-IIS restriction sites, which are recognized by endonucleases that cleave a defined distance away (up to 20 base-pairs). This produces short
DNA tags whose sequence and position are sufficient to identify the original transcript, provided cDNA sequences or expressed sequence tags (ESTs) are
already known. The tags can be concatenated and sequenced, providing quantitative analysis of many transcripts simultaneously [43].
of cycloheximide the target genes cannot be translated, and
so cannot switch on further downstream genes as indirect
targets. Thus, only those genes upregulated in the presence of
cycloheximide are direct targets [10]. For instance, although
microarray expression analysis identified 134 targets of
Drosophila Clk, expression of a hormone-inducible form of
Clk in cell culture in the presence of cycloheximide indicates
that only nine of the genes are in fact direct targets [7].
These methods provide further evidence that a target is
direct but do not show that the transcription factor binds
directly to a regulatory sequence in the gene; this can be
tested by other approaches, such as the electrophoretic
mobility shift assay (EMSA). This technique identifies
binding of specific proteins to DNA sequences, and so can
demonstrate direct binding of a transcription factor to the
promoter region of its target gene [11]. This in vitro method
may not accurately reflect the situation in vivo, however, as
binding is likely to be less tightly regulated in the assay.
To overcome this difficulty, two methods have been devel-
oped to demonstrate direct binding of a transcription factor
to promoter regions of DNA in vivo: chromatin immunopre-
cipitation (ChIP) and Dam methylase identification (DamID;
both are described in Figure 2). In addition to being used to
ask whether a particular candidate gene is a direct target of a
transcription factor, these techniques can also be adapted to
identify new target genes. For example, regulatory DNA
sequences enriched by ChIP can be used as probes to iden-
tify the coding regions of direct target genes [12-14]. Even
these approaches have their limitations, however. In ChIP,
protein-DNA interactions may not survive the procedure,
and there is the risk of artifactual binding being introduced
during the fixation process; similarly, expression of a fusion
protein with DamID may not accurately replicate the situa-
tion in vivo. Nevertheless, these approaches prove to be very
powerful and, as described below, can be scaled up to
analyze the binding of transcription factors across the entire
genome (so-called genome-wide location analysis).
Genome-wide location analysis
Several groups have recently developed techniques for
high-throughput identification of genomic regions associated
with transcription-factor binding [15-18], using ChIP and
DamID approaches.
ChIP arrays
One approach, which was first described for Saccharomyces
cerevisiae but has since been applied to human cell lines
[15,16,18-21], has extended the ChIP protocol to the analysis
of immunoprecipitated DNA with genomic microarrays (see
Figure 2; reviewed in more detail in [22,23]).
The design of microarrays differs between different research
groups and between organisms. For S. cerevisiae, which has
a small and relatively simple genome containing approxi-
mately 6,200 genes, it is possible to design microarrays con-
taining all yeast intergenic regions [15,16] in addition to
coding regions [15,24]. Designing microarrays for human
studies is more difficult, because higher eukaryotes have a
more complex genome and more complex mechanisms of
gene regulation. Unlike yeast, where the majority of tran-
scription-factor-binding sites are found in upstream proxi-
mal promoter regions [15,24], higher eukaryotic gene
expression is also controlled by factors binding at enhancer
sequences located many kilobases from the gene. These
enhancers may be situated 5Ј or 3Ј relative to the gene, in
introns or even occasionally in exons (see below).
Initial studies of transcription-factor binding in human cells
concentrated on E2Fs, a family of transcription factors that
play a role in cell-cycle progression and proliferation [16,18].
Thus Ren and colleagues [19] designed arrays containing
sequences upstream of 1,444 genes available from the
human genome sequence, about 1,200 of which had previ-
ously been identified as cell-cycle-regulated. As more human
genome sequence data and annotation has become available,
however, the Ren and Young labs have now produced
microarrays containing 6,000 and 13,000 sequences, again
consisting mostly of 5Ј proximal sequences [21,25]. A differ-
ent approach was taken by Weinmann and colleagues [18]
who arrayed 7,776 human genomic fragments enriched for
CpG islands, which are generally associated with upstream
regulatory regions in vertebrates (reviewed in [26]).
Although such approaches are very powerful, one drawback of
intergenic arrays is that they are biased by the design. In par-
ticular, 5Ј upstream sequence arrays will not detect interac-
tions in introns, downstream sequences, non-annotated
genomic regions, or exons. To overcome this bias, another
group has designed a microarray containing the non-repetitive
sequence of human chromosome 22 [27]. They then used this
array in a ChIP assay to analyze binding of the p65 subunit of
NF-B when cells were stimulated with tumor necrosis factor
(TNF) ␣. This approach not only identified new targets for p65
on chromosome 22, but also revealed binding sites in areas of
the chromosome that are currently not annotated. Although
costly, this technique could be extended to the other chromo-
somes as more completed human chromosome sequences
become available, and in this way an unbiased view of
genomic binding-site architecture can be built up.
DamID arrays
DNA isolated from DamID experiments has also been used
to probe microarrays (Figure 2b). In the first reports of using
this technique in Drosophila, cDNA arrays were used
[17,28]. More recently, however, Sun and colleagues have
used a microarray spotted with contiguous regions of
Drosophila chromosomes 2 and 3 for this analysis [29], and
it should not be long before genomic arrays are also com-
monplace when using this technique.
210.4 Genome Biology 2004, Volume 5, Issue 3, Article 210 Taverner et al. />Genome Biology 2004, 5:210
One interesting picture that is emerging from these genome-
wide location analyses is the pattern of transcription-factor
binding across the genome. Several studies have searched
for consensus binding sites for a particular factor using
bioinformatic approaches (see below), and such sites have
been found scattered throughout the genome, in both
intergenic and coding regions (see, for example, [15,24]).
Genome-wide location analysis reveals, however, that only a
subset of these sites is actually bound in vivo. This could be
because binding-site recognition may be influenced by
comment
reviews
reports deposited research
interactions
information
refereed research
Genome Biology 2004, Volume 5, Issue 3, Article 210 Taverner et al. 210.5
Genome Biology 2004, 5:210
Figure 2
Experimental procedures for identifying transcription-factor targets in vivo by chromatin immunoprecipitation (ChIP) and Dam methylase identification
(DamID), using microarrays. (a) In ChIP, formaldehyde is used to fix proteins bound to DNA in vivo. The DNA is then isolated and sheared by sonication
into fragments of 200-700 base-pairs. An antibody against the transcription factor of interest is used to immunoprecipitate the factor and associated
chromatin; or, if an epitope-tagged version of the protein is expressed in cells, an antibody can be used that is specific to the epitope. Protein is then
removed from the DNA by reversal of the crosslinks and digestion with proteinase K. At this point, the isolated DNA can be used to verify targets by PCR
or dot blot, or the DNA may be sub-cloned and sequenced to identify new targets [44]. For ChIP array analysis, the purified DNA is amplified by PCR and
then labeled with a fluorophore, such as Cy3. As a reference for background binding, input DNA that is not enriched by immunoprecipitation is also
amplified and labeled with another fluorophore, such as Cy5 [16,18]. Alternatively, non-enriched reference DNA is isolated after immunoprecipitation
from cells that do not contain the transcription factor of interest [15]. The two populations of DNA are then hybridized to a microarray containing
genomic sequences, and target sequences bound by the factor are identified according to the relative fluorescent intensity of each spot. (b) With DamID,
the transcription factor of interest is fused to the Escherichia coli enzyme DNA adenine methylase (Dam). The fusion protein is expressed in vivo and Dam
methylates DNA in the immediate vicinity of the binding site of the transcription factor, specifically acting on adenines in the sequence GATC. Dam alone
is also expressed in cells as a reference, to identify background binding and methylation. Given that endogenous methylation of adenine does not occur in
the DNA of most eukaryotes, methylated DNA can then be digested with Dpn1 (which cuts at the sequence GA
me
TC) and isolated from uncut genomic
DNA by size fractionation. The resulting DNA can then be analyzed by Southern blot to verify putative targets [14]. For genome-wide analysis, DNA from
the experimental and reference samples is labeled with two different fluorophores (such as Cy3 and Cy5) and hybridized to a microarray [17,28,29].
m
m
m
m
m
m
m
m
m
m
m
m
m
m
m
m
m
m
mm
mm
mm
mm
mm
mm
m
mm
mm
m
m
m
m
m
m
m
m
m
m
m
m
m
m
m
m
m
m
m
m
m
m
m
m
m
m
m
m
m
m
m
m
m
m
m
m
m
m
m
m
m
m
m
m
m
m
m
m
m
m
m
m
m
m
m
m
Crosslink protein to DNA
in vivo
Sonicate to shear DNA
Experimental Reference
Express Dam fusion
protein
in vivo
Isolate genomic DNA
Separate digested DNA from
genomic DNA by size
fractionation
Digest with Dpn1, which
specifically cleaves
methylated DNA within
the sequence
GATC
Reverse crosslinks
and digest protein
with proteinase K
Amplify isolated DNA
Label with Cy3Label with Cy5 Label with Cy5Label with Cy3
Transcription factor of interest
Other transcription factors
DNA methylase
Methylated DNA
Hybridize to microarray
Hybridize to microarray
Immunoprecipitate
with antibody
specific to a
transcription factor
Perform PCR or DNA blot
to verify known target,
and/or subclone DNA and
sequence it to identify
new targets
Take 'Input'
sample as
background
reference
ChiP(a) (b) DamID
transcription-factor binding partners or by chromatin struc-
ture. For instance, when the binding of yeast transcription
factors, Swi4 and Rap1, was analyzed using arrays containing
both intergenic and coding regions of the genome, most
binding sites were found to be in the proximal promoter
regions of genes, and very few in coding sequence [15,24]. In
human cells, when binding of p65 was analyzed across chro-
mosome 22, 28% of binding sites were found within 5 kilo-
bases upstream of the translation start codon, 40% were
found in intronic regions, and less than 1% of sites (2/209)
were found in exons [27]. To date, such observations have
been made for only a small number of factors and it will be
interesting to see how the results for other factors compare.
Bioinformatic approaches
Ideally, we would like to be able to predict the expression
pattern of a gene from its regulatory sequences. Are we
moving towards a time when bona fide regulatory sequences
bound by transcription factors can be identified in silico?
Databases of consensus transcription-factor-binding sites
have been assembled over the last decade and computational
algorithms that operate ab initio have been developed in an
attempt to identify transcription-factor-binding sequences
across the genome (see [30-32] for more detailed informa-
tion). The programs exhibit different levels of stringency
depending upon the algorithms used, but because they rely
only on sequence data all are subject to false positives and
false negatives. This is because transcription factors do not
bind to all instances of their consensus binding site, as out-
lined above, and may also bind to other sequences that vary
from the known consensus sequence (see below).
The development of computational algorithms has been
improved by comparative genomics, or phylogenetic foot-
printing (for example [33], reviewed in [31]). This approach
is based upon the fact that non-coding sequences that are
highly conserved between species are much more likely to be
involved in gene regulation. But difficulties arise in identifi-
cation of organisms that are significantly closely related for
regions to be conserved but sufficiently divergent for this
conservation to be significant.
In order to improve the reliability of computational predic-
tion of functional binding sites, other information, often
derived from experimental studies, must be included in the
analysis (see [31,32,34]). A common method involves com-
paring the promoters of genes co-regulated by a transcrip-
tion factor to identify conserved motifs. Recently, targets of
Dorsal, a transcription factor involved in specifying the
dorsoventral axis in Drosophila, were identified using
expression microarrays, and subsequent analysis identified
up to 40 targets that have the expected restricted expression
pattern in the embryo [35]. Examination of the genomic
sequence around a subset of these target genes discovered
that consensus Dorsal-binding sites generally cluster
together, either upstream of the start codon ATG or within
introns [35]. A computational algorithm was developed from
this information and used to scan the rest of the Drosophila
genome, identifying 3 known Dorsal target genes and 15 new
putative targets [34]. Two of these targets have been tested
and found to exhibit asymmetric expression patterns across
the dorsoventral axis, as would be expected for Dorsal target
genes ([34], reviewed in [36]).
Similarly, Kel et al. [37] were able to identify composite
modules consisting of clusters of binding sites for E2F and
other transcription factors that are involved in the regulation
of known E2F targets. Examination of these regulatory
sequences led to the identification of a range of characteris-
tic motifs in addition to the known binding sites. Using this
information, computational methods were then developed to
search the promoter regions of cell-cycle-regulated genes.
This led to the identification of 29 genes known to be regu-
lated by E2F, plus an additional 313 putative E2F targets
that contained the identified upstream regulatory modules.
Some of these putative targets have now been confirmed as
direct targets by ChIP analysis [37].
Interestingly, in those ChIP-array studies where it has been
examined, a proportion of sequences bound to transcription
factors did not contain the known consensus binding site for
the transcription factor tested. For example, Iyer et al. [15]
found that in S. cerevisiae about half of the targets of the
transcription factors MBF and SBF do not contain the con-
sensus binding sites for the factors. In human cells, Ren et
al. [19] and Weinmann et al. [18] found that up to 25% of
identified E2F targets did not contain the E2F consensus
site. Further characterization revealed that some of these
target genes are repressed rather than up-regulated by E2F
[18]. Although no sequence that is common to these repress-
ing regions has yet been described, applying computational
techniques may reveal such a site. Thus, genome-wide loca-
tion analysis combined with computational analysis may be
useful in identifying previously unknown binding sequences
for other transcription-factors.
Transcriptional networks
The development of high throughput methods for the identi-
fication of direct transcription-factor target genes has led to
a large increase in our understanding of combinatorial net-
works of gene regulation. The combination of genome-wide
expression data with genome-wide location analysis consti-
tutes a powerful tool not only in verifying predicted interac-
tions, but also in elucidating transcriptional networks.
Simon et al. [38] performed genome-wide location analysis
with the nine known cell-cycle activators in yeast and
showed that cell-cycle transcriptional control is a connected
network. For example, transcriptional regulators that act at
one stage of the cycle to up-regulate genes promoting cell-
cycle progression also up-regulate the transcription of
210.6 Genome Biology 2004, Volume 5, Issue 3, Article 210 Taverner et al. />Genome Biology 2004, 5:210
factors that act during the next stage of the cycle. This group
has since extended its analysis to (nearly) all yeast transcrip-
tion-factors [20]. This has identified simple network motifs
(the building blocks of a network) that have been used to
describe networks controlling, for example, metabolism and
the response to mating factor [20,39]. As these kinds of
analyses become more commonplace, we can look forward
to a time when each transcription factor can be placed in a
network that describes a complex cellular process, such as
those that lead to the development of an embryo.
References
1. Davidson EH, Rast JP, Oliveri P, Ransick A, Calestani C, Yuh CH,
Minokawa T, Amore G, Hinman V, Arenas-Mena C, et al.: A
genomic regulatory network for development. Science 2002,
295:1669-1678.
2. Wyrick JJ, Young RA: Deciphering gene expression regulatory
networks. Curr Opin Genet Dev 2002, 12:130-136.
3. Lee SW, Tomasetto C, Sager R: Positive selection of candidate
tumor-suppressor genes by subtractive hybridization. Proc Natl
Acad Sci USA 1991, 88:2825-2829.
4. Menssen A, Hermeking H: Characterization of the c-MYC-regu-
lated transcriptome by SAGE: identification and analysis of c-
MYC target genes. Proc Natl Acad Sci USA 2002, 99:6274-6279.
5. Zakin L, Reversade B, Virlon B, Rusniok C, Glaser P, Elalouf JM,
Brulet P: Gene expression profiles in normal and Otx2-/-
early gastrulating mouse embryos. Proc Natl Acad Sci USA 2000,
97:14388-14393.
6. Schena M, Shalon D, Davis RW, Brown PO: Quantitative monitor-
ing of gene expression patterns with a complementary DNA
microarray. Science 1995, 270:467-470.
7. McDonald MJ, Rosbash M: Microarray analysis and organiza-
tion of circadian gene expression in Drosophila. Cell 2001,
107:567-578.
8. Horton JD, Shah NA, Warrington JA, Anderson NN, Park SW, Brown
MS, Goldstein JL: Combined analysis of oligonucleotide microar-
ray data from transgenic and knockout mice identifies direct
SREBP target genes. Proc Natl Acad Sci USA 2003, 100:12027-12032.
9. Eilers M, Picard D, Yamamoto KR, Bishop JM: Chimaeras of myc
oncoprotein and steroid receptors cause hormone-dependent
transformation of cells. Nature 1989, 340:66-68.
10. Rosa FM: Mix.1, a homeobox mRNA inducible by mesoderm
inducers, is expressed mostly in the presumptive endodermal
cells of Xenopus embryos. Cell 1989, 57:965-974.
11. Garner MM, Revzin A: A gel electrophoresis method for quanti-
fying the binding of proteins to specific DNA regions: applica-
tion to components of the Escherichia coli lactose operon
regulatory system. Nucleic Acids Res 1981, 9:3047-3060.
12. White RA, Brookman JJ, Gould AP, Meadows LA, Shashidhara LS,
Strutt DI, Weaver TA: Targets of homeotic gene regulation in
Drosophila. J Cell Sci Suppl 1992, 16:53-60.
13. Orlando V: Mapping chromosomal proteins in vivo by
formaldehyde-crosslinked-chromatin immunoprecipitation.
Trends Biochem Sci Suppl 2000, 25:99-104.
14. van Steensel B, Henikoff S: Identification of in vivo DNA targets of
chromatin proteins using tethered dam methyltransferase.
Nat Biotechnol 2000, 18:424-428.
15. Iyer VR, Horak CE, Scafe CS, Botstein D, Snyder M, Brown PO:
Genomic binding sites of the yeast cell-cycle transcription-
factors SBF and MBF. Nature 2001, 409:533-538.
16. Ren B, Robert F, Wyrick JJ, Aparicio O, Jennings EG, Simon I, Zeitlinger
J, Schreiber J, Hannett N, Kanin E, et al.: Genome-wide location and
function of DNA binding proteins. Science 2000, 290:2306-2309.
17. van Steensel B, Delrow J, Henikoff S: Chromatin profiling using
targeted DNA adenine methyltransferase. Nat Genet 2001,
27:304-308.
18. Weinmann AS, Yan PS, Oberley MJ, Huang TH, Farnham PJ: Isolating
human transcription-factor targets by coupling chromatin
immunoprecipitation and CpG island microarray analysis.
Genes Dev 2002, 16:235-244.
19. Ren B, Cam H, Takahashi Y, Volkert T, Terragni J, Young RA, Dynlacht
BD: E2F integrates cell-cycle progression with DNA repair,
replication, and G(2)/M checkpoints. Genes Dev 2002, 16:245-256.
20. Lee TI, Rinaldi NJ, Robert F, Odom DT, Bar-Joseph Z, Gerber GK,
Hannett NM, Harbison CT, Thompson CM, Simon I, et al.: Transcrip-
tional regulatory networks in Saccharomyces cerevisiae. Science
2002, 298:799-804.
21. Li Z, Van Calcar S, Qu C, Cavenee WK, Zhang MQ, Ren B: A global
transcriptional regulatory role for c-Myc in Burkitt’s lym-
phoma cells. Proc Natl Acad Sci USA 2003, 100:8164-8169.
22. Nal B, Mohr E, Ferrier P: Location analysis of DNA-bound pro-
teins at the whole-genome level: untangling transcriptional
regulatory networks. BioEssays 2001, 23:473-476.
23. Shannon MF, Rao S: Transcription. Of chips and ChIPs. Science
2002, 296:666-669.
24. Lieb JD, Liu X, Botstein D, Brown PO: Promoter-specific binding of
Rap1 revealed by genome-wide maps of protein-DNA associa-
tion. Nat Genet 2001, 28:327-334.
25. Odom DT, Zizlsperger N, Gordon D, Bell GW, Rinaldi NJ, Murray
HL, Volkert TL, Schreiber J, Rolfe A, Gifford D, et al.: Control of
pancreas and liver gene expression by HNF transcription
factors. Science 2004, 303:1378-1381.
26. Antequera F, Bird A: CpG islands as genomic footprints of pro-
moters that are associated with replication origins. Curr Biol
1999, 9:R661-R667.
27. Martone R, Euskirchen G, Bertone P, Hartman S, Royce TE, Luscombe
NM, Rinn JL, Nelson FK, Miller P, Gerstein M, et al.: Distribution of
NF-kappaB-binding sites across human chromosome 22. Proc
Natl Acad Sci USA 2003, 100:12247-12252.
28. Orian A, van Steensel B, Delrow J, Bussemaker HJ, Li L, Sawado T,
Williams E, Loo LW, Cowley SM, Yost C, et al.: Genomic binding by
the Drosophila Myc, Max, Mad/Mnt transcription-factor
network. Genes Dev 2003, 17:1101-1114.
29. Sun LV, Chen L, Greil F, Negre N, Li TR, Cavalli G, Zhao H, Van
Steensel B, White KP: Protein-DNA interaction mapping using
genomic tiling path microarrays in Drosophila. Proc Natl Acad Sci
USA 2003, 100:9428-9433.
30. Qiu P, Ding W, Jiang Y, Greene JR, Wang L: Computational
analysis of composite regulatory elements. Mamm Genome
2002, 13:327-332.
31. Pennacchio LA, Rubin EM: Comparative genomic tools and data-
bases: providing insights into the human genome. J Clin Invest
2003, 111:1099-1106.
32. Ohler U, Niemann H: Identification and analysis of eukaryotic
promoters: recent computational approaches. Trends Genet
2001, 17:56-60.
33. Lenhard B, Sandelin A, Mendoza L, Engstrom P, Jareborg N, Wasser-
man WW: Identification of conserved regulatory elements by
comparative genome analysis. J Biol 2003, 2:13.
34. Markstein M, Markstein P, Markstein V, Levine MS: Genome-wide
analysis of clustered Dorsal binding sites identifies putative
target genes in the Drosophila embryo. Proc Natl Acad Sci USA
2002, 99:763-768.
35. Stathopoulos A, Van Drenth M, Erives A, Markstein M, Levine M:
Whole-genome analysis of dorsal-ventral patterning in the
Drosophila embryo. Cell 2002, 111:687-701.
36. Markstein M, Levine M: Decoding cis-regulatory DNAs in the
Drosophila genome. Curr Opin Genet Dev 2002, 12:601-606.
37. Kel AE, Kel-Margoulis OV, Farnham PJ, Bartley SM, Wingender E,
Zhang MQ: Computer-assisted identification of cell-cycle-
related genes: new targets for E2F transcription-factors. J Mol
Biol 2001, 309:99-120.
38. Simon I, Barnett J, Hannett N, Harbison CT, Rinaldi NJ, Volkert TL,
Wyrick JJ, Zeitlinger J, Gifford DK, Jaakkola TS, Young RA: Serial
regulation of transcriptional regulators in the yeast cell-cycle.
Cell 2001, 106:697-708.
39. Zeitlinger J, Simon I, Harbison CT, Hannett NM, Volkert TL, Fink GR,
Young RA: Program-specific distribution of a transcription-
factor dependent on partner transcription-factor and MAPK
signaling. Cell 2003, 113:395-404.
40. Endomesoderm Gene Network
[ />41. Liang P, Pardee AB: Differential display of eukaryotic messenger
RNA by means of the polymerase chain reaction. Science 1992,
257:967-971.
42. Matz MV, Lukyanov SA: Different strategies of differential display:
areas of application. Nucleic Acids Res 1998, 26:5537-5543.
43. Velculescu VE, Zhang L, Vogelstein B, Kinzler KW: Serial analysis of
gene expression. Science 1995, 270:484-487.
44. Weinmann AS, Farnham PJ: Identification of unknown target
genes of human transcription-factors using chromatin
immunoprecipitation. Methods 2002, 26:37-47.
comment
reviews
reports deposited research
interactions
information
refereed research
Genome Biology 2004, Volume 5, Issue 3, Article 210 Taverner et al. 210.7
Genome Biology 2004, 5:210