Báo cáo y học: "Whole exome capture in solution with 3 Gbp of data" pps
Bạn đang xem bản rút gọn của tài liệu. Xem và tải ngay bản đầy đủ của tài liệu tại đây (9.77 MB, 8 trang )
Bainbridge et al. Genome Biology 2010, 11:R62
/>Open Access
METHOD
© 2010 Bainbridge et al.; licensee BioMed Central Ltd. This is an open access article distributed under the terms of the Creative Com-
mons Attribution License ( which permits unrestricted use, distribution, and reproduc-
tion in any medium, provided the original work is properly cited.
Method
Whole exome capture in solution with 3 Gbp of
data
Matthew N Bainbridge
1,2
, Min Wang
1
, Daniel L Burgess
3
, Christie Kovar
1
, Matthew J Rodesch
3
, Mark D'Ascenzo
3
,
Jacob Kitzman
3
, Yuan-Qing Wu
1
, Irene Newsham
1
, Todd A Richmond
3
, Jeffrey A Jeddeloh
3
, Donna Muzny
1
,
Thomas J Albert
3
and Richard A Gibbs*
1
Abstract
We have developed a solution-based method for targeted DNA capture-sequencing that is directed to the complete
human exome. Using this approach allows the discovery of greater than 95% of all expected heterozygous singe base
variants, requires as little as 3 Gbp of raw sequence data and constitutes an effective tool for identifying rare coding
alleles in large scale genomic studies.
Background
DNA sequence capture is an effective technique for
enrichment of significant subfractions of the genome for
targeted analysis. Sequence capture is generally con-
ducted with either a solid-phase substrate, usually a glass
microarray, or alternatively, in solution [1-4]. Solution-
capture performance, however, has not been thoroughly
compared to microarray with respect to uniformity of
representation of the targeted DNA bases or evenness of
DNA sequencing coverage depth between regions [5,6].
Further, solution-based sequence capture has not been
demonstrated to work effectively at the scale of a human
exome (approximately 30 Mbp) but typically has been
limited to targets <5 Mbp in size. Despite this, solution
capture has several advantages when compared to
microarrays: the reagent cost is lower; less DNA is
required; and, because the capture method can be con-
ducted entirely in small laboratory tubes, it is readily
scaled and automated. Before solution-capture sequenc-
ing can be widely adopted, however, the reproducibility of
the method must first be demonstrated, and targets
should show similar levels of coverage from capture to
capture. Ideally, solution-capture methods should also be
able to be coupled to different sequencing technology
platforms, and reliably produce suitable levels of enrich-
ment that routinely enable the discovery of rare genetic
variants.
This report is the first demonstration of whole exome
capture in solution (Table 1). We demonstrate similar lev-
els of specificity to microarray-based techniques without
sacrificing reproducibility or specificity of either the cap-
ture or variant discovery while maintaining all the advan-
tages of solution-based techniques over microarray
capture.
To test the reproducibility of our recent innovations of
liquid DNA capture, technical replicate capture experi-
ments were performed and subsequently sequenced on
the SOLiD [7] platform. Capture followed by Illumina [8]
sequencing was also performed with both a fragment
(frag) and paired-end (PE) library to test the merits of
employing PE data versus single-ended reads. Finally, we
used each of these data sets to test the ability to discover
single nucleotide variants across the exome.
Results and discussion
Here we report the performance of newly developed
methods for sequence-capture in solution. The proce-
dures were tested with respect to reproducibility of cap-
ture, agnosticism to sequencer platform, and the ability to
discover genetic variation in human gene coding regions.
In total, six captures of the Consensus Coding Sequence
(CCDS) exons [9,10] were performed using DNA from
one HapMap sample (NA12812). Four separate, replicate
capture libraries were prepared for solid sequencing and
one additional library was prepared for both the Illumina
* Correspondence:
1
Human Genome Sequencing Center, Baylor College of Medicine, One Baylor
Plaza, Houston, Texas 77030, USA
Full list of author information is available at the end of the article
Bainbridge et al. Genome Biology 2010, 11:R62
/>Page 2 of 8
frag and PE sequencing. In total, 23 Gbp of data were
uniquely aligned to the human reference genome (Table
S1 in Additional file 1). Variants were called using algo-
rithms tailored to each sequence platform and corre-
sponding data type, and compared to known variants in
the HapMap sample (see Materials and methods).
To first test the reproducibility of the entire capture-
sequencing process, four technical replicate solution cap-
tures were performed. Each replicate was sequenced
using one-quarter of the same SOLiD DNA sequencer
'slide' to eliminate run-by-run sequencer variability. The
standard procedure for categorizing data from this
sequencing platform is to identify individual sequence
reads that can be mapped at high stringency to a refer-
ence sequence. These 'mappable' reads constitute the
usually cited yield for each sequence run. Here, the
sequences from four technical replicate libraries had an
average of 49.6% (standard deviation 1.23) of mappable
reads derived from the capture target regions with the
remainder mapping elsewhere to the genome. This effi-
ciency of properly targeted sequence reads represents a
value similar to Ng et al. [3], and higher than Choi et al.
[11]. The final DNA sequence coverage across each target
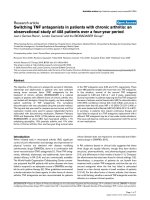
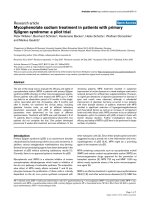
had >98% correlation between all four libraries (Figure 1).
In three of four experiments, >65% of the targeted bases
were covered ten or more times, and the observed varia-
tion in the coverage levels was primarily accounted for by
the total sequence yield of each spot. These results indi-
cate that, for a given amount of sequence data, the aver-
age coverage and distribution of coverage is highly
predictable and the performance of each individual target
region in different experiments is consistent.
One technical artifact of capture-sequencing proce-
dures is the generation of duplicate DNA sequencing
reads that represent the repeated sequencing of copies of
the same molecule. These duplicates generally arise when
there are too few total molecules present at any stage of
the technical manipulations - especially immediately
prior to any PCR step. Detection of the duplicate reads by
computational analysis is not trivial, and generally relies
on observation of the alignment positions. Unfortunately,
these artifactual duplicates are difficult to distinguish
from exactly overlapping reads that naturally occur
within deep sequence samples.
The percentage of duplicate reads, defined as reads
with the same start point and direction, was approxi-
mately 22% for 3 Gbp of aligned data and was also highly
consistent between replicates (Table 2, libraries 2 to 4).
As expected, when more reads were generated for the
SOLiD library 1 the duplicate rate increased to approxi-
mately 33%. Simulations of these data showed an
expected 'natural' (that is, not PCR-induced) duplication
rate of 22 and 14% for 10 Gbp and 3 Gbp of data, respec-
tively. This means that approximately 33% of our sus-
pected duplicate reads are likely not due to PCR-induced
duplication, but are those expected from the random dis-
tribution of read ends. As noted above, it is not possible
to differentiate true duplicate reads from randomly
occurring duplicates, and thus all such reads were
removed prior to further analysis.
To test the merits of using PE reads versus frag reads we
generated both types of library for Illumina sequencing.
Target coverage was slightly more uniform for Illumina
than SOLiD; however, both sequence types provide more
uniform coverage than other solution capture methods
(Figure S1 in Additional file 1). Although the majority of
targets had similar normalized coverage when sequenced
by SOLiD or Illumina, approximately equal numbers
showed some coverage-bias depending on sequencing
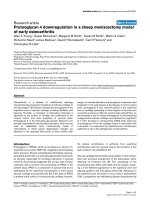
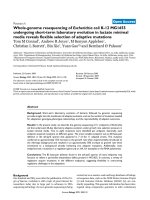
platform (Figure 2). Targets with very different coverage
levels typically had low complexity and/or high GC con-
tent. PE sequencing showed both a higher percentage of
reads on target and significantly fewer duplicate reads
(Table 3). In PE sequencing, reads are generated from
both ends of a captured DNA fragment and because the
approximate fragment length is known, this information
can be used to constrain the alignment of both reads to
the human genome. Constraining read alignment can
greatly improve accuracy when compared to frag
sequencing and we hypothesized that these inherent
advantages of mapping PE versus single end reads
resulted in the increased number of reads derived from
the target region. We also suspected that the drastic
reduction in the duplicate read rate was not because of a
difference in library construction but instead the result of
Table 1: A comparison of different capture methodologies
Study Capture type Reactors Capture size Sequencer type
Ng et al. [3] Array Multiple array >30 Mbp Illumina
Choi et al. [11] Array Single array >30 Mbp Illumina
Gnirke et al. [5] Solution Single tube <5 Mbp Illumina
This study Solution Single tube >30 Mbp SOLiD/Illumina
Bainbridge et al. Genome Biology 2010, 11:R62
/>Page 3 of 8
improved informatic identification of 'true' duplicates.
Deep, single-end, frag sequencing quickly saturates the
target regions such that any additional reads will likely
perfectly overlap an existing read and be identified as a
duplicate, even when the reads derive from different
DNA molecules. PE sequencing, in contrast, allows us to
use information about both the start and the end of the
capture-DNA fragment in order to determine whether
the data are derived from independent DNA molecules.
Thus, the increased information content of PE data
allows us to reduce the misidentification of duplicate
reads.
To test these theories we also analyzed the PE data as if
they were generated from a single-ended frag library.
Figure 1 Normalized coverage of replicate SOLiD libraries 2 to 4 versus normalized coverage of replicate library 1. Average coverage for each
target region in library 1 is plotted against library 2 (blue), library 3 (green) and library 4 (red). Coverage for each target is represented as a proportion
of the total sequence generated. The line X = Y indicates approximately equal levels of coverage in both libraries.
0
0.0002
0.0004
0.0006
0.0008
0.001
0.0012
0 0.0002 0.0004 0.0006 0.0008 0.001 0.0012
N orm al ized Coverage
N orm al i ze Coverage
Library #4
Library #3
Library #2
X=Y
Table 2: Alignment statistics for SOLiD frag sequencing libraries
SOLiD library
1 234
Total reads aligned 199,704,874 53,558,797 47,640,266 46,687,848
Total data aligned (Gbp) 9.99 2.68 2.38 2.33
Reads on target (%) 50.1 50.9 49.5 48.0
Duplicate reads (%) 32.8 22.1 22.5 20.9
Mean coverage (X)
a
43 22 20 19
Median coverage (X)
a
42 19 16 15
Targets hit (%) 99.3 98.44 98.4 98.1
Bases ≥1× coverage (%) 97.6 94.31 93.5 92.5
Bases ≥10× coverage (%)
a
89.4 70.8 65.9 64.1
Bases ≥20× coverage (%)
a
78.9 48.2 42.0 40.5
a
Calculated after duplicate read removal.
Bainbridge et al. Genome Biology 2010, 11:R62
/>Page 4 of 8
This caused the on-target alignment rate to drop slightly
to 73% and the duplicate rate to nearly quadruple to
27.6%, virtually identical to the Illumina frag library
duplicate rate. The net effect of using PE data instead of
frag data was a significant increase in on-target coverage,
which resulted in >90% of the targeted bases covered at
10-fold or higher using just 2.8 Gbp of data, a single 2 ×
75 bp lane of Illumina sequencing.
To assess the effect of DNA sequencing coverage depth
on our ability to correctly identify variants in the exonic
region of NA12812, we conducted variant discovery
using both approximately 3.3 Gbp and approximately 10
Gbp of SOLiD capture data and 2.8 and 2.5 Gbp of Illu-
mina PE and frag data, respectively. Only a subfraction of
these data, non-duplicate sequence reads mapped to tar-
get regions, was used for variant discovery, and it is these
data, not the total, that ultimately affect variant discovery
quality. Discovered variants were compared to known
HapMap SNPs in this sample and dbSNP. Here, the con-
cordance to HapMap is used to measure the false nega-
tive discovery rate, and the proportion of variants
discovered that were also present in dbSNP129 was used
to approximate the false positive discovery rate. Others
have typically found approximately 90% of CCDS variants
to be present in dbSNP for Europeans [3] and significant
deviation below 90% may indicate an increased false posi-
tive discovery rate.
Table 4 shows the total amount of data produced for
each sequencing platform, the final amount of data
mapped to targets after duplicate removal and the con-
cordance to dbSNP and HapMap. Three giga-base pairs
of SOLiD data allowed discovery of approximately 20 K
variants in the 36-Mbp total capture region for the CCDS
exome. Six giga-base pairs of additional sequence data
facilitated the discovery of approximately 20% more vari-
ants. In both cases the proportion of variants present in
dbSNP129 was high. Concordance to all known HapMap
variants that occur in the target region was 82% and 92%
for 3 and 10 Gbp of raw data, respectively. Importantly,
this statistic includes known SNPs in regions of little or
no coverage where no variant call is possible. When we
considered only SNPs that occur in regions with >9× cov-
erage, concordance was approximately 95%.
Significantly more variants were discovered in the Illu-
mina PE data than were found in the frag data (Table 4)
and consequently there was also higher concordance at
HapMap sites. This effect is almost certainly driven by
the higher coverage of the target regions achieved by hav-
ing PE reads. As already noted, this occurs because of a
slight increase in reads derived from target, but more sig-
nificantly, a drastic reduction in the number of reads that
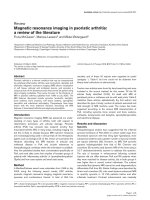
are incorrectly marked as duplicates (Figure 3). Interest-
ingly, the proportion of variants that were also in dbSNP
was significantly lower in the PE data. This may be due to
overall lower read quality at the ends of the PE reads and
improved mapping of reads that would not have been
aligned without a mate. Increasing the variant calling
stringency (LOD = 8; see Materials and methods) on the
PE data reduced the number of HapMap concordant vari-
ants slightly, but improved the percentage of variants in
dbSNP by approximately 3% (Table 4). Although the Illu-
mina PE data also had higher HapMap concordance than
the SOLiD variant calls, Illumina frag data performed
only slightly better than the SOLiD data, despite having
significantly more sequence data on target. When Hap-
Map heterozygous SNP concordance was considered as a
function of coverage, SOLiD data out-performed Illu-
mina data at low (<9×) coverage (Figure S2 in Additional
file 1); however, Illumina consistently obtained 2 to 3%
higher concordance at ≥9× coverage. The quality of the
Table 3: Alignment statistics for Illumina PE and frag sequencing libraries
Illumina Frag Illumina PE
Total reads aligned 33,524,973 37,832,835
Total data aligned (Gbp) 2.51 2.84
Reads on target (%) 67.62 78.0
Duplicate reads (%) 30.97 8.3
Mean coverage (X)
a
24 52
Median coverage (X)
a
20 40
Targets hit (%) 99.36 99.6
Bases ≥1× Coverage (%) 96.39 98.9
Bases ≥10× Coverage (%)
a
71.33 90.8
Bases ≥20× Coverage (%)
a
51.23 76.9
a
Calculated after duplicate read removal.
Bainbridge et al. Genome Biology 2010, 11:R62
/>Page 5 of 8
Figure 2 Average coverage for each target region as sequenced by Illumina 75-bp frag reads plotted against SOLiD library 1. Coverage for
each target is normalized for the total sequence aligned to target. The line X = Y indicates approximately equal levels of coverage in both libraries.
0
0.0002
0.0004
0.0006
0.0008
0.001
0.0012
0 0.0002 0.0004 0.0006 0.0008 0.001 0.0012
Illumina Coverage (X)
SOLiD Coverage (X)
Table 4: Variant discovery and HapMap concordance for different sequencing types and varying amounts of sequence
data
Illumina SOLiD
Frag PE PE (high stringency) 1 1
Bases produced (Gbp) 2.51 2.84 3.4 9.99
Bases on target after duplicate removal (Gbp) 1.04 2.01 0.59 1.72
Total SNPs 21,239 27,953 26,489 19,790 24,077
dbSNP SNPs 19,525 23,745 23,133 18,016 21,350
dbSNP (%) 91.9 84.95 87.3 91.04 88.67
HapMap variant concordance (%) 83.0 96.0 95.8 81.6 92.9
Variant concordance (>9× coverage) (%) 95.5 98.5 98.2 94.5 97.2
Bainbridge et al. Genome Biology 2010, 11:R62
/>Page 6 of 8
variant calls in both data sets was very high, with 22,066
(91.6%) of variants shared between SOLiD 10 G and the
Illumina PE data sets.
This work demonstrates the practicality of genomic tar-
get enrichment using capture-sequencing in solution. For
the first time, this technology is used at the scale of the
whole exome, comprising over 36 Mbp across >170,000 K
individual targets. Using four technical replicate libraries,
we show that the average coverage of the targeted regions
is highly correlated. Capture performance is also shown
to be consistent, with the average coverage of each target
having >98% correlation between technical replicates.
Thus, it is practical to obtain consistent sequence cover-
age distributions and reproducible variant discovery for a
variety of genomic screening experiments. This work also
shows the feasibility of using either SOLiD or Illumina-
based sequencing after capture. PE data were shown to be
superior to frag data, increasing both the on-target num-
ber of reads, and greatly improving the correct identifica-
tion of duplicates. Development of PE sequencing on the
SOLiD platform should show a similar effect. Interest-
ingly, Illumina sequencing consistently shows higher lev-
els of enrichment than SOLiD sequencing. This is
unexpected because both sequencing platforms yield
similar coverage distributions in whole genome sequenc-
ing data [12], that is, without enrichment. Further, the
capture-sequencing protocols for both methods are
almost identical; therefore, we suspect that differences in
efficiency are due to an increase in initial library com-
plexity arising from better annealing efficiencies of the
Illumina adapter. This is probably explained by the fact
that Illumina adaptor sequences contain an A/T over-
hang, whereas the SOLiD adapters rely on less efficient
blunt-end ligation. We are currently developing an A/T
overhang-type SOLiD sequencing adapter for use in cap-
ture to test whether we can improve levels of enrichment
for SOLiD-based capture.
Finally, we examine the amount of sequence data
required to fully interrogate the single nucleotide variants
of the exome in a HapMap sample using either SOLiD or
Illumina sequencing. Using approximately 10 Gbp of
SOLiD data, approximately 93% of all HapMap variants
are discovered and over 88% of all variants are present in
dbSNP. Illumina based sequencing, however, discovers
96% of HapMap variants, with approximately 85% of vari-
ants in dbSNP, using only 3 Gbp of sequence data. This
result is achieved because our Illumina protocol yields
higher overall coverage on the target regions even while
Figure 3 Coverage distribution across target regions of SOLiD libraries 1 (10 Gbp) and 2 (3 Gbp) and Illumina PE and frag libraries. The num-
ber of bases at each level of coverage for each library type is shown for approximately 10 Gbp of SOLiD data (green), approximately 3 Gbp of SOLiD
data (red), approximately 3 Gbp of Illumina PE data (yellow) and approximately 3 Gbp of Illumian frag data (blue) after duplicate removal.
0
500000
1000000
1500000
2000000
2500000
Targeted Bases (bp)
Covergage (X-fold)
SOLiD Library#1 (10G)
SOLiD Library#2 (3G)
IlluminaPE
Illumina Frag
Bainbridge et al. Genome Biology 2010, 11:R62
/>Page 7 of 8
producing less raw sequencing data. SOLiD variant call-
ing appears to be more sensitive at <9× coverage, typically
obtaining 20% higher concordance. Overall performance
between both platforms is similar, however, and the
majority of the observed difference is likely due to differ-
ences in the variant discovery pipeline software.
Conclusions
Sequence capture in solution is easier to automate, has
higher throughput and is less expensive than microarray-
based techniques but has not been extensively used
because of performance issues. Here we show the high
reproducibility and scalability of our capture method and
demonstrate that liquid capture can be used in large-scale
experiments to yield reliably high levels of coverage that
are consistent at a target-by-target level and are similar to
microarray-based techniques. Further, we establish that
the entire CCDS exome can be interrogated with just 2.8
Gbp of sequence data, approximately 3% of the required
data for whole genome shotgun experiments. At this level
of cost and scalability, solution capture-sequencing
becomes an attractive technique for rare variant discov-
ery in its own right and as follow-up to genome-wide
association studies, especially in studies where much of
the heritability of the disease remains unexplained [13]
and thus may be due to rare mutations [14]. Capture-
sequencing in solution reduces the cost and increases the
throughput of rare mutation discovery by focusing on
coding regions of the genome and will prove to be a sig-
nificant addition to the geneticist's tool chest.
Materials and methods
Sequence data
All sequence data are available from the Short Read
Archive with the following accession numbers
[SRA012614 to SRA012615].
Sequence alignment and variant discovery
SOLiD sequence data were aligned using ABI's
corona_lite package (version: 4.0r2.0) with a maximum
allowed mismatch of 6; all other parameters were set at
default. Pileup-style files were generated with samtools
[15] and were filtered to require a variant score of at least
40, or 30 and the variant to be on both strands, and pres-
ent in at least 15% of all reads. Illumina data were aligned
using BWA (v 0.5.3) [16]. The base quality was recali-
brated using GATK [17] (downloaded 2 October 2009).
Variants were discovered with a minimum LOD of 5
(unless otherwise stated), and were filtered with the fol-
lowing recommended parameters: -X AlleleBalance:low =
0.25, high = 0.75 -X ClusteredSnps.
Library and capture
The experimental procedures for preparation of pre- and
post-capture libraries are described in Additional file 1
and are available on-line for the SOLiD [18] and Illumina
platforms [19]. Briefly, 5 μg genomic DNA is sheared,
end-repaired and ligated with either Illumina (frag or PE)
platform-specific or SOLiD TM platform-specific adap-
tors. The library is amplified by pre-capture LM-PCR
(linker mediated-PCR) and hybridized to NimbleGen
SeqCap EZ Exome libraries. After washing, amplification
by post-capture LM-PCR and a quantitative PCR-based
quality check, the successfully captured DNA is ready for
sequencing.
Probe design
The CCDS (build 36.2) exome capture oligonucleotide
pool was designed by targeting 174,984 exons of 16,008
high-confidence protein-coding genes in CCDS. Chro-
mosomal coordinates were obtained from the UCSC
genome browser (human build hg18). Target exons were
padded to a minimum length of 80 bp, and consolidated
to remove redundant overlaps. Coordinates for 528
human miRNA genes were obtained from miRBase
(release 10), padded by 25 bp on each end, and likewise
consolidated. In sum, the coding and miRNA targets
comprised 36 Mb of non-redundant sequence, against
which 1.9 million probes were selected on the genomic
forward strand, with a median probe length of 75 bp and
median start-to-start spacing of 34 bp. A rebalancing
algorithm (described in Additional file 1) was used to
improve uniformity of coverage across target exons.
Probe pools were manufactured by Roche NimbleGen
(Madison, WI, USA).
Additional material
Abbreviations
bp: base pair; CCDS: Consensus Coding Sequence; frag: fragment; Gbp: giga-
base pairs; Mbp: mega-base pairs; miRNA: microRNA; PE: paired end; SNP: sin-
gle nucleotide polymorphism.
Authors' contributions
MNB aided in experimental design, sequence alignment and analysis and
drafted the manuscript. MW, YQW, IN, DM, and CK conducted the capture
hybridization and sequencing. DLB and JDJ participated in experimental
design and analysis and aided in manuscript preparation. MJR, MD'A, JK, and
TAR participated in designing the capture reagent. TJA and RG participated in
experimental design and aided in manuscript preparation.
Acknowledgements
The authors would like to thank Svasti Haricharan for editing the manuscript.
This project was supported by Award Number U54HG003273 from the
National Human Genome Research Institute.
Author Details
1
Human Genome Sequencing Center, Baylor College of Medicine, One Baylor
Plaza, Houston, Texas 77030, USA,
2
Department of Structural and
Computational Biology and Molecular Biophysics, Baylor College of Medicine,
One Baylor Plaza, Houston, Texas 77030, USA and
3
Roche NimbleGen, Inc., 504
S. Rosa Road Madison, WI 53719, USA
Additional file 1 Table S1 and Figures S1 and S2 as well as detailed
materials and methods.
Bainbridge et al. Genome Biology 2010, 11:R62
/>Page 8 of 8
References
1. Albert TJ, Molla MN, Muzny DM, Nazareth L, Wheeler D, Song X, Richmond
TA, Middle CM, Rodesch MJ, Packard CJ, Weinstock GM, Gibbs RA: Direct
selection of human genomic loci by microarray hybridization. Nat
Methods 2007, 4:903-905.
2. Hodges E, Xuan Z, Balija V, Kramer M, Molla MN, Smith SW, Middle CM,
Rodesch MJ, Albert TJ, Hannon GJ, McCombie WR: Genome-wide in situ
exon capture for selective resequencing. Nat Genet 2007, 39:1522-1527.
3. Ng SB, Turner EH, Robertson PD, Flygare SD, Bigham AW, Lee C, Shaffer T,
Wong M, Bhattacharjee A, Eichler EE, Bamshad M, Nickerson DA, Shendure
J: Targeted capture and massively parallel sequencing of 12 human
exomes. Nature 2009, 461:272-276.
4. Okou DT, Steinberg KM, Middle C, Cutler DJ, Albert TJ, Zwick ME:
Microarray-based genomic selection for high-throughput
resequencing. Nat Methods 2007, 4:907-909.
5. Gnirke A, Melnikov A, Maguire J, Rogov P, LeProust EM, Brockman W,
Fennell T, Giannoukos G, Fisher S, Russ C, Gabriel S, Jaffe DB, Lander ES,
Nusbaum C: Solution hybrid selection with ultra-long oligonucleotides
for massively parallel targeted sequencing. Nat Biotechnol 2009,
27:182-189.
6. Porreca GJ, Zhang K, Li JB, Xie B, Austin D, Vassallo SL, LeProust EM, Peck BJ,
Emig CJ, Dahl F, Gao Y, Church GM, Shendure J: Multiplex amplification
of large sets of human exons. Nat Methods 2007, 4:931-936.
7. Smith DR, Quinlan AR, Peckham HE, Makowsky K, Tao W, Woolf B, Shen L,
Donahue WF, Tusneem N, Stromberg MP, Stewart DA, Zhang L, Ranade
SS, Warner JB, Lee CC, Coleman BE, Zhang Z, McLaughlin SF, Malek JA,
Sorenson JM, Blanchard AP, Chapman J, Hillman D, Chen F, Rokhsar DS,
McKernan KJ, Jeffries TW, Marth GT, Richardson PM: Rapid whole-
genome mutational profiling using next-generation sequencing
technologies. Genome Res 2008, 18:1638-1642.
8. Bennett S: Solexa Ltd. Pharmacogenomics 2004, 5:433-438.
9. Flicek P, Aken BL, Beal K, Ballester B, Caccamo M, Chen Y, Clarke L, Coates
G, Cunningham F, Cutts T, Down T, Dyer SC, Eyre T, Fitzgerald S,
Fernandez-Banet J, Graf S, Haider S, Hammond M, Holland R, Howe KL,
Howe K, Johnson N, Jenkinson A, Kahari A, Keefe D, Kokocinski F, Kulesha
E, Lawson D, Longden I, Megy K, et al.: Ensembl 2008. Nucleic Acids Res
2008, 36:D707-714.
10. Consensus Coding Sequence. [ />11. Choi M, Scholl UI, Ji W, Liu T, Tikhonova IR, Zumbo P, Nayir A, Bakkaloglu A,
Ozen S, Sanjad S, Nelson-Williams C, Farhi A, Mane S, Lifton RP: Genetic
diagnosis by whole exome capture and massively parallel DNA
sequencing. Proc Natl Acad Sci USA 2009, 106:19096-19101.
12. Lupski JR, Reid JG, Gonzaga-Jauregui C, Rio Deiros D, Chen DC, Nazareth L,
Bainbridge M, Dinh H, Jing C, Wheeler DA, McGuire AL, Zhang F,
Stankiewicz P, Halperin JJ, Yang C, Gehman C, Guo D, Irikat RK, Tom W,
Fantin NJ, Muzny DM, Gibbs RA: Whole-genome sequencing in a patient
with Charcot-Marie-Tooth neuropathy. N Engl J Med 2010,
362:1181-1191.
13. Hindorff LA, Sethupathy P, Junkins HA, Ramos EM, Mehta JP, Collins FS,
Manolio TA: Potential etiologic and functional implications of genome-
wide association loci for human diseases and traits. Proc Natl Acad Sci
USA 2009, 106:9362-9367.
14. Manolio TA, Collins FS, Cox NJ, Goldstein DB, Hindorff LA, Hunter DJ,
McCarthy MI, Ramos EM, Cardon LR, Chakravarti A, Cho JH, Guttmacher
AE, Kong A, Kruglyak L, Mardis E, Rotimi CN, Slatkin M, Valle D, Whittemore
AS, Boehnke M, Clark AG, Eichler EE, Gibson G, Haines JL, Mackay TF,
McCarroll SA, Visscher PM: Finding the missing heritability of complex
diseases. Nature 2009, 461:747-753.
15. Samtools. []
16. Li H, Durbin R: Fast and accurate short read alignment with Burrows-
Wheeler transform. Bioinformatics 2009, 25:1754-1760.
17. GATK. [ />The_Genome_Analysis_Toolkit]
18. SOLiD Protocol. [ />Preparation_of_SOLiD_Capture_Libraries.pdf]
19. Illumina Protocol. [ />ez.html]
doi: 10.1186/gb-2010-11-6-r62
Cite this article as: Bainbridge et al., Whole exome capture in solution with 3
Gbp of data Genome Biology 2010, 11:R62
Received: 14 April 2010 Revised: 1 June 2010
Accepted: 17 June 2010 Published: 17 June 2010
This article is available from: 2010 Bainbridge et al.; licensee BioMed Central L td. This is an open access article distributed under the terms of the Creative Commons Attribution License ( which permits unrestricted use, distribution, and reproduction in any medium, provided the original work is properly cited.Genome Biolog y 2010, 11:R62