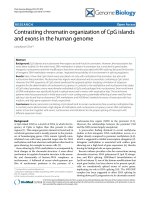
Báo cáo y học: " Contrasting chromatin organization of CpG islands and exons in the human genome" pot
Bạn đang xem bản rút gọn của tài liệu. Xem và tải ngay bản đầy đủ của tài liệu tại đây (587.64 KB, 8 trang )
Choi Genome Biology 2010, 11:R70
/>Open Access
RESEARCH
© 2010 Choi; licensee BioMed Central Ltd. This is an open access article distributed under the terms of the Creative Commons Attribu-
tion License ( which permits unrestricted use, distribution, and reproduction in any me-
dium, provided the original work is properly cited.
Research
Contrasting chromatin organization of CpG islands
and exons in the human genome
Jung Kyoon Choi
1,2
Abstract
Background: CpG islands and nucleosome-free regions are both found in promoters. However, their association has
never been studied. On the other hand, DNA methylation is absent in promoters but is enriched in gene bodies.
Intragenic nucleosomes and their modifications have been recently associated with RNA splicing. Because the function
of intragenic DNA methylation remains unclear, I explored the possibility of its involvement in splicing regulation.
Results: Here I show that CpG islands were associated not only with methylation-free promoters but also with
nucleosome-free promoters. Nucleosome-free regions were observed only in promoters containing a CpG island.
However, the DNA sequences of CpG islands predicted the opposite pattern, implying a limitation of sequence
programs for the determination of nucleosome occupancy. In contrast to the methylation-and nucleosome-free states
of CpG-island promoters, exons were densely methylated at CpGs and packaged into nucleosomes. Exon-enrichment
of DNA methylation was specifically found in spliced exons and in exons with weak splice sites. The enrichment
patterns were less pronounced in initial exons and in non-coding exons, potentially reflecting a lower need for their
splicing. I also found that nucleosomes, DNA methylation, and H3K36me3 marked the exons of transcripts with low,
medium, and high gene expression levels, respectively.
Conclusions: Human promoters containing a CpG island tend to remain nucleosome-free as well as methylation-free.
In contrast, exons demonstrate a high degree of methylation and nucleosome occupancy. Exonic DNA methylation
seems to function together with exonic nucleosomes and H3K36me3 for the proper splicing of transcripts with
different expression levels.
Background
A CpG island (CGI) is a stretch of DNA in which the fre-
quency of CpGs is higher than that present in other
regions [1]. This unique genomic element is found only in
vertebrate genomes and is usually present in the promot-
ers of housekeeping genes. CGIs remain typically unm-
ethylated even with many potential target sites for DNA
methylation and their aberrant methylation often leads to
gene silencing, for example in cancer cells [2].
Gene silencing by DNA methylation is accompanied by
local changes in the chromatin structure. A more direct
mechanism to regulate chromatin structure is the assem-
bly and disassembly of histone-DNA complexes, or
nucleosomes. A hallmark of recent whole-genome pro-
files of nucleosome positions is the presence of a
nucleosome-free region (NFR) in the promoter [3-5].
However, the relationships between the promoter CGI
and the NFR remain largely unexplored.
A provocative finding obtained in recent methylome
studies is that intragenic DNA methylation occurs at a
higher density compared to promoter methylation [6-8],
which is suggested to inhibit transcription elongation [9].
Intragenic methylation is associated with neither gene
silencing nor a high level of gene expression [6], thereby
leaving its biological role an open question.
Recent evidence provides a clue for connections among
chromatin structure, RNA polymerase II (pol II) elonga-
tion, and RNA splicing. H3K36me3 (trimethylation of
Lys36 on histone 3), one of the histone modifications that
mark gene bodies, has been shown to be present specifi-
cally on constitutively spliced exons of active genes,
implicating its role in RNA splicing [10]. The SWI/SNF
complex has been suggested to affect RNA splicing by
slowing down pol II progression via its chromatin remod-
* Correspondence:
1
Department of Biology and Brain Engineering, KAIST, 335 Gwahak-ro, Daejeon
305-701, Republic of Korea
Full list of author information is available at the end of the article
Choi Genome Biology 2010, 11:R70
/>Page 2 of 8
eling activity [11]. Likewise, two recent studies have sug-
gested that the exon-specific positioning of intragenic
nucleosomes, which function as roadblocks to inhibit pol
II, facilitates exon inclusion during RNA splicing [12,13].
Given the suggested links between chromatin regula-
tion and RNA splicing, one might suspect that intragenic
DNA methylation plays a similar role, judging by its influ-
ence on pol II elongation [9]. Thus, in the present study, I
investigated whether CpG methylation was specifically
enriched on exons compared to introns and whether it
was associated with spliced exons rather than skipped
exons, as H3K36me3 and nucleosomes were shown to be.
Results and discussion
Previous studies have shown that underlying DNA
sequences are important determinants of nucleosome
occupancy [14,15]. For example, the in vitro binding of
nucleosomes to naked genomic DNA from different spe-
cies is dictated in large part by the DNA sequence com-
position [15]. By collecting nucleosome-bound DNA
sequences and center-aligning them, common underlying
features of nucleosome-favoring sequences could be
found and modeled based on thermodynamics for future
predictions of nucleosome formation [14]. In another
approach, a support vector machine was employed to
build nucleosome prediction models based on different
human cell lines [16].
Although promoter sequences have been extensively
explored with respect to nucleosome patterns, the mech-
anism by which CGI sequences affect nucleosome assem-
bly has never been studied. One may postulate that the
unique sequence features of CGIs (for example, aberrant
high CpG density) may prevent nucleosome assembly,
considering the active chromatin structure of CGIs in
vivo [17].
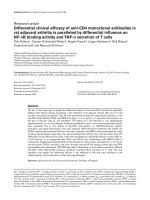
Expectedly, the in vivo nucleosome occupancy within
the CGI is remarkably low compared to that in the flank-
ing regions (Figure 1a). Open chromatin can be identified
by DNase I hypersensitivity experiments. I used the
whole-genome data of DNase I hypersensitivity sites [18]
to assess their enrichment in CGIs (see Materials and
methods). The fraction of the human genome that har-
bors these sites was compared with that of the CGIs that
overlap these sites, producing an odds ratio of 14. This
means that open chromatin is 14-fold more likely to be
found in CGIs than in the other genomic regions.
To assess whether the nucleosome depletion of CGIs is
derived from sequence preferences, I utilized the two
independent nucleosome prediction datasets mentioned
above [15,16]. The portions of the prediction data for
CGIs were collected to show that strong nucleosome-
favoring features were encoded in the DNA sequences of
CGIs (Figure 1b; Additional file 1). This finding is con-
firmed by the high DNA bendability of CGI sequences,
which is required for sharp DNA bending around histone
complexes [19] (Figure 1c). The measurement of DNA
bending was based on structural parameters that charac-
terize the bending propensity of trinucleotides, as
deduced from DNase I digestion data [20].
One factor that can explain this pattern is homopoly-
meric dA:dT tracts. As important elements in eukaryotic
promoters, these tracts are known to act as an intrinsic
nucleosome destabilizer [21,22]. Thus, they can be used
as a strong indicator of a nucleosome-free state in
sequence-based nucleosome prediction models [23,24].
The sequences of CGIs typically lack these elements. A
high CG density cannot be maintained in AT-rich
sequences. This phenomenon might explain, in part, the
nucleosome-favoring signals encoded in CGI sequences.
Reflecting this reciprocal tendency of in vivo and pre-
dicted nucleosome occupancy, promoters with a CGI
tended to maintain a NFR in vivo (Figure 1d) against high
sequence tendencies toward nucleosome deposition (Fig-
ure 1e). Conversely, CGI-lacking promoters exhibited
high nucleosome occupancy at the +1 nucleosome loca-
tion (Figure 1d), which seemed to be programmed by
nucleosome sequence preferences (Figure 1e).
The conflicting results obtained from the sequence fea-
tures and in vivo measurements were also demonstrated
in the context of DNA methylation. CGIs are typically
unmethylated [25,26], notwithstanding many target
CpGs in them. It is likely that trans-acting regulators are
actively recruited to promoter CGIs to maintain this
region in a nucleosome-and methylation-free state, over-
coming the sequence preferences for high methylation
and nucleosome packaging. Accordingly, CGIs showed
increased nucleosome occupancy when methylated
(orange curve in Figure 1d).
A model of cis-programmed nucleosome positioning
has been established for the yeast promoters [15]. In the
human genome, however, DNA sequences completely fail
to predict the presence of promoter NFRs, which is the
most distinguishing property of nucleosome positions in
vivo. This seems due to the unexpected feature of CGIs,
which is a conflict between the actions of cis-and trans-
elements in the context of chromatin organization.
CGIs often extend into downstream transcript regions.
This provides an explanation for the observation that the
exon at the 5' end of the transcript, flanked with the tran-
scription start site, shows a remarkably higher CpG den-
sity than the downstream exons (Additional file 2). Given
the distinctive chromatin state of CGIs, this might influ-
ence exonic nucleosome occupancy and CpG methyla-
tion depending on exon location.
An investigation of the DNA methylation and
nucleosome occupancy of exons reveals several novel
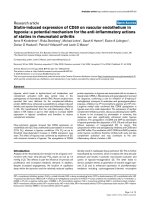
findings (Figure 2a). First, nucleosome occupancy and
CpG methylation are enriched in exons relative to
Choi Genome Biology 2010, 11:R70
/>Page 3 of 8
introns. Second, non-coding exons (NCEs) show mark-
edly lower enrichment than coding exons, including ini-
tial coding exons (ICEs), internal exons, and last coding
exons (LCEs). Third, a significant difference is detected
between the 5' end ICEs and internal ICEs. Fourth, even
though flanking each other within the LCE or ICE, the
UTR and the coding region show differential levels of
nucleosomes and methylation.
The exonic enrichment of nucleosomes has been
reported in most recent studies [12,13]. A similar finding
has also been reported for H3K36me3 [10]. Indeed,
H3K36me3 showed a pattern similar to that observed for
nucleosomes (Additional file 3). The exon enrichment of
DNA methylation has been recently reported [27]. A
novel observation here is that these marks are differen-
tially distributed among exons with different positions
and functions, in a manner that nicely explains their role
in RNA splicing.
For example, the 5'-end ICEs do not display high
enrichment because they do not require mechanisms for
exon inclusion as starting exons only with the splice
donor. On the other hand, the functional importance of
coding exons might restrict the loss of these marks that
ensure exon inclusion into mature transcripts. The main-
tenance of these marks in coding exons might be assisted
by DNA sequence conservation, as indicated by the
observation that coding sequences in the ICEs and LCEs
show higher enrichment than their flanking UTRs. As
compared to 5' UTRs, 3' UTRs are located more remotely
from splice acceptors, decreasing the need for these epi-
genetic mechanisms.
This is the first study to suggest a role for intragenic
DNA methylation in RNA splicing. Using the same
nucleosome dataset employed herein [5], a previous
study has reported the association of high nucleosome
occupancy and exons with weak splice sites [13]. Based
on the same data for exon strength, I discovered that CpG
methylation was also enriched in weak exons (Additional
file 4).
Overlapping CGIs on the 5'-end exons seemed to be
coupled with a lower level of DNA methylation and
nucleosome occupancy (Additional file 2). However,
internal NCEs were not affected by CGIs (Additional file
2) but still demonstrated a low level of nucleosome occu-
pancy and CpG methylation similar to introns (Figure
2a). Therefore, it is not likely that the differential enrich-
ment between internal NCEs and internal ICEs results
from the CGI effects.
Figure 1 Nucleosome organization of promoter CGIs. (a-c) Nucleosome patterns upstream, inside and downstream of the CGI (from left to right)
based on (a) in vivo nucleosome occupancy for human T cells [5] measured as normalized read count (NRC; see Materials and methods), (b) sequence
prediction of nucleosome occupancy [15], and (c) DNA bending propensity. (d,e) Nucleosome patterns surrounding the transcription start site (TSS)
based on (d) in vivo nucleosome occupancy for human T cells [5] measured as the NRC and (e) sequence prediction of nucleosome occupancy [15].
−1000 −500 0 0 500 1000
0.65 0.70 0.75
Distance from CGI boundary (bp)
Predicted nucleosome occupancy
−1000 −500 0 0 500 1000
0.25 0.30 0.35 0.40
Distance from CGI boundary (bp)
Nucleosome occupancy (NRC)
−1000 −500 0 0 500 1000
−0.0227 −0.0224 −0.0221
Distance from CGI boundary (bp)
DNA bending propensity
Promoters
with unmethylated CGI
Promoters
with methylated CGI
Promoters
without CGI
(a) (b) (c)
(d)
−1000 −500 0 500
0.55 0.60 0.65 0.70 0.75
Distance from TSS (bp)
Predicted nucleosome occupancy
−1000 −500 0 500
0.2 0.3 0.4 0.5 0.6
Distance from TSS (bp)
Nucleosome occupancy (NRC)
(e)
Choi Genome Biology 2010, 11:R70
/>Page 4 of 8
Figure 2 Exonic DNA methylation and nucleosome occupancy. (a) Nucleosome occupancy (upper panel) and CpG methylation (lower panel)
plotted as the average of all transcripts across non-coding exons (NCEs), coding exons, and flanking introns according to their relative positions within
the transcript. All exons and introns were partitioned into ten bins and the average normalized read count (NRC) was obtained for each bin of all cor-
responding exons and introns. ICEs (initial coding exons) and LCEs (last coding exons) are broken into the UTR (light blue or light green) and coding
region (dark blue or dark green) by the start codon and stop codon, respectively. The ends of the introns (orange) are connected to those of the flank-
ing exons by the black lines. (b) Exon inclusiveness measured as the relative expression of each internal exon compared to the other exons in the
transcript. The lowest 10% were considered spliced out and the others to be spliced in. The top 10% were identified as highly expressed for the pur-
pose of checking for sequencing bias. (c) Comparison of nucleosome occupancy (upper panel) and CpG methylation (lower panel) among skipped
exons, included exons, and highly expressed exons as defined above. tss, transcriptions start site.
(a) (c)
5’-end
ICE
Internal
exons
LCE
tss
5’-end
NCE
Start
codon
Stop
codon
Internal
ICE
Internal
exons
LCE
tss
Internal
NCE
0.4 0.6 0.8 1.0 1.2
CpG methylation (NRC)
5’-end
ICE
internal
ICE
0.30 0.35 0.40 0.45 0.50 0.55 0.60
Nucleosome occupancy (NRC)
internal
ICE
5’-end
ICE
Skipped
exon
mC
mC
mC
mC
mC
Skipped
exon
Nucleosome occupancy (NRC)
0.0 0.5 1.0 1.5 2.0 2.5
Skipped
exon
Included
exon
Highly
expressed
exon
01234
CpG methylation (NRC)
Skipped
exon
Included
exon
Highly
expressed
exon
−2 −1 0 1 2
0.0 0.5 1.0 1.5 2.0 2.5 3.0
Exon inclusiveness
Density
(b)
Choi Genome Biology 2010, 11:R70
/>Page 5 of 8
As the methylation data used here were generated
based on the affinity of methylation-binding proteins, it is
possible that high CpG density on exons results in the
exon enrichment of DNA methylation. To resolve this
confounding effect, I used the normalized methylation
levels divided by CpG density. It seems that CpG density
does not affect the DNA methylation patterns (Addi-
tional file 5). Another approach to measuring DNA meth-
ylation is based on bisulfite treatment, which provides
methylation measures on single CpG sites. One such
dataset for H1 human embryonic stem cells and IMR90
lung fibroblasts [28] was used and found to reproduce a
similar pattern of exon enrichment (Additional file 6).
To further test the role of CpG methylation in RNA
splicing, I employed RNA-seq data, which can provide
the relative expression of each internal exon compared to
the other exons present in the transcript. This measure
indicates the inclusiveness of the RNA splicing process
for a given exon and is thus termed exon inclusiveness.
The exons with the lowest 10% of exon inclusiveness (less
than about -1) were considered as spliced out while the
others as spliced in. To evaluate sequencing bais, the
exons with the top 10% of exon inclusiveness (greater
than about 1) were identified as highly expressed (see
Materials and methods). The distribution of exon inclu-
siveness is presented in Figure 2b.
The comparison of nucleosome occupancy and CpG
methylation among the above-defined skipped exons,
included exons, and highly expressed exons (Figure 2c)
reveals that the included exons indeed contain a higher
level of epigenetic marks compared to the skipped exons.
Moreover, the pattern was not caused by sequencing bias,
given the minor differences between the included and
highly expressed exons. This result is consistent with the
finding that H3K36me3 is enriched on constitutive exons
[10] and confirms the hypothesis that these marks can
facilitate exon inclusion.
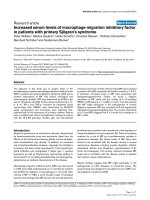
In an effort to find why the three marks are associated
with splicing regulation, I discovered that CpG methyla-
tion, nucleosome deposition, and H3K36me3 differen-
tially marked the internal exons of genes possessing
different expression levels (Figure 3): H3K36me3 marked
highly expressed genes as shown in a previous study [10],
nucleosomes appeared among lowly expressed genes, and
DNA methylation was linked with an intermediate level
of gene expression. The elongation efficiency of pol II
clarified this pattern (Figure 2b). Genes with a CGI in
their promoter tended to be regulated by H3K36me3
rather than nucleosomes or CpG methylation, probably
for efficient transcription elongation (see gray lines in
Figure 3).
Tilgner et al. [13] have shown that when normalized by
nucleosome levels, the relative density of H3K36me3
does not show exon-specific enrichment. My hypothesis
is as follows. The relative density of H3K36me3 differs
between highly and lowly expressed genes. It is the den-
sity of nucleosomes that differs between exons and
introns. Therefore, the absolute level of H3K36me3, the
product of the nucleosome level and the relative modifi-
cation density, should be different between the exons and
introns of highly expressed genes (Additional file 7).
This finding proposes a new model for the influence of
epigenetic mechanisms on RNA splicing. Nucleosomes
seem to act as roadblocks to pol II passage and expose
weak splice acceptors for a long duration to ensure exon
inclusion. CpG methylation might play a similar function
but with a lower efficiency in pol II inhibition.
H3K36me3 appears to accelerate RNA splicing, likely by
recruiting the spliceosome-for example, via the CHD1
protein [29]. Although the detailed mechanisms remain
to be elucidated, these three marks could function coop-
eratively to ensure the inclusion of the protein-coding
exons of many different transcripts with varying tran-
scriptional activity by differentially controlling pol II
elongation efficiency.
In the present study, I focused on the general mechanis-
tic effect of chromatin organization on proper splicing.
However, tissue-specific or condition-specific alternative
splicing may not be regulated in this way. More elaborate
mechanisms involving cis-acting RNA sequences and
trans-acting RNA-binding proteins should accompany
this process. Changes in chromatin organization of an
exon may result in an alternative inclusion or exclusion of
the exon. With epigenomic datasets coupled with RNA
profiles for multiple tissues or conditions, we will be able
to demonstrate the chromatin regulation of alternative
splicing.
Conclusions
The biological significance of the present findings can be
summarized as follows. First, CGIs and NFRs tend to
coexist in some promoters, together marking an active
chromatin configuration. Only promoters with a CGI
tend to display a NFR. In the human genome, promoters
lacking a CGI show no evidence of a NFR.
Second, in conflict with in vivo nucleosome depletion,
the DNA sequences of CGIs encode a strong tendency
toward nucleosome formation, highlighting the limita-
tions of DNA sequence programs for the determination
of nucleosome positioning.
Third, in support of recent evidence that chromatin
regulation mechanisms are linked to RNA splicing, CpG
methylation is proposed to cooperate with nucleosomes
and H3K36me3 to differentially regulate the elongation of
pol II. This finding provides a hint at the role of
intragenic DNA methylation, which has remained elusive,
and explains why exons maintain the three different
mechanisms for their proper splicing.
Choi Genome Biology 2010, 11:R70
/>Page 6 of 8
Fourth, the chromatin regulation of RNA splicing
seems to be more intricate than previously considered.
The functional importance and DNA sequence con-
straints of protein-coding exons may explain the dense
chromatin organization. The initial exons, which possess
splice donors but not acceptors, lack the three marks
present in internal and terminal exons.
Materials and methods
Measurement of nucleosome occupancy and DNA
methylation
H2A.Z-containing nucleosomes in resting human T cells
were mapped to the human genome (University of Cali-
fornia, Santa Cruz (UCSC) hg18 assembly based on
National Center for Biotechnology Information (NCBI)
build 36.1) by means of Solexa sequencing technology [5].
The tag coordinate files in the browser extensible data
(BED) format for nucleosomes were downloaded from
the authors' website [30]. DNA methylation in human T
cells was mapped to the human genome by using methyl-
CpG-binding domain (MBD) proteins and Solexa
sequencing technology [31]. These data are available at
NCBI's Gene Expression Omnibus (GEO) repository
under accession number [GEO:GSE17554]. The sequenc-
ing reads were extended to the average size of fragments
in the library (150 bp) [5] and the number of overlapping
sequence tags was obtained at 200-bp intervals across the
human genome. The ratio of (Target read count/200 bp)/
(Total read count/Genome size) was obtained and log2
transformed. This is termed the normalized read count
(NRC) and used as an estimate for the DNA methylation
level and nucleosomal level at the given genomic locus.
Measurement of cytosine methylation at base resolution
The degree of methylation at single cytosine nucleotides
was measured based on bisulfite treatment for H1 human
embryonic stem cells and IMR90 lung fibroblasts [28].
The genomic coordinates of methylated cytosines were
downloaded from the authors' website [32]. The ratio
between the number of intact cytosines and the total
number of intact and bisulfite-converted cytosines was
calculated for each locus to indicate the degree of methy-
lation. The cytosines in the CG context were considered.
Enrichment of open chromatin in CpG islands
A total of 95,723 experimental DNase I hypersensitivity
sites for human CD4
+
T cells [18] were downloaded from
the UCSC genome browser ('dukeDnaseCd4Sites' track).
About 80% of the human genome was known to be cov-
ered by high-throughput sequencing [33]. The mappable
portion of the human genome that harbors open chroma-
tin was compared with the fraction of CGIs that overlap
open chromatin, giving rise to an odds ratio indicating
the relative enrichment of open chromatin in CGIs.
Sequence prediction of nucleosome occupancy
Predicted nucleosome level for the human genome
(hg18) [15] was downloaded from the authors' website
[34]. The average nucleosome occupancy was obtained at
200-bp intervals across the genome. In addition, three
Figure 3 Normalized nucleosome occupancy, CpG methylation, and H3K36me3 density. (a,b) Normalized nucleosome occupancy, CpG meth-
ylation, and H3K36me3 density for internal exons versus (a) the quantiles of gene expression level and (b) pol II elongation efficiency. The gray lines
indicate the percentage of CGI promoters within each bin (y-axis on the right-hand side).
H3K36me3
CpG methylation
Nucleosome deposition
Percentage of CGI promoters
20 40 60 80
0.5 0.6 0.7 0.8
Elongation−efficiency quantile
Normalized epigenetic levels
−1.5 −1.0 −0.5 0.0 0.5 1.0 1.5
Percentage of CGI promoters
20 40 60 80
0.5 0.6 0.7 0.8
Expression quantile
Normalized epigenetic levels
−1.5 −1.0 −0.5 0.0 0.5 1.0
(a) (b)
Choi Genome Biology 2010, 11:R70
/>Page 7 of 8
different models for human nucleosome prediction [16]
were available from the UW Predicted Nucleosome
Occupancy track at the UCSC genome browser. The Mec
model points to the positions that are frequently
nucleosome-free while the A375 and Dennis models indi-
cate those that are frequently occupied by a nucleosome.
Again, a model score for each 200-bp genomic interval
was obtained. DNA bendability of a given sequence was
estimated based on DNase I digestion experiments [20].
Bending parameters for 32 trinucleotides were summed
over a target sequence to estimate its DNA bendability.
Gene expression level and pol II elongation efficiency
Genome-wide gene expression was profiled in resting
human T cells by means of DNA microarrays [5], the data
for which were available at NCBI's GEO repository under
accession number [GEO:GSE10437]. Conceptually, the
elongation efficiency of pol II can be calculated as RNA
production per unit density of elongating pol II. Tran-
scripts with high elongation efficiency will be produced
in high abundance even with a low density of elongating
pol II within the transcript. Transcripts with low elonga-
tion efficiency will be produced in low abundance even
with a high density of elongating pol II within the tran-
script. Upon transcription initiation, pol II switches to an
elongation-competent form with phosphorylation at Ser5
in its carboxy-terminal domain. Thus, elongation effi-
ciency was calculated as the ratio of gene expression level
to the density of Ser5-phosphorylated pol II within the
transcript body. Genome-wide Ser5-phosphorylated pol
II distribution was profiled along with H2A.Z
nucleosomes [5] and is available for download from the
authors' website [30].
Detection of skipped exons
RNA-seq was performed by means of Solexa sequencing
technology for CD4+ human T cells [35] and the raw
sequencing data are available at NCBI's GEO repository
under accession number [GEO:GSE16190]. The sequenc-
ing reads were extended to the average size of fragments
in the library [35] and the number of overlapping
sequence tags was obtained at 200-bp intervals across the
human genome. The ratio of (Target read count/200 bp)/
(Total read count/Genome size) was obtained and log2
transformed. The NRC for each internal exon was
obtained and compared with the average read count
mapped to all exons of the transcript in question. The dif-
ference between the read count of each exon and the
average read count of all exons can indicate how inclusive
or exclusive the mature transcript is of the given exon.
The exons with a large negative difference (lowest 10%),
which amounted to > two-fold lower count, were consid-
ered to be skipped during splicing in human T cells. The
other exons were counted to be included in human T
cells. Highly expressed exons - that is, the exons with a
large positive difference (highest 10%) - were identified in
order to check for sequencing bias. If some genomic
regions are easily amplified during Solexa sequencing,
high RNA read counts might be inherently correlated
with high epigenomic read counts. Without such bias,
there will be no significant difference between the set of
spliced exons and that of highly expressed exons.
Calculating the strength of exon splice sites
The sum of the scores of the splice sites of each internal
exon was calculated as described in the previous study
[13], whereby a total of 76,450 human internal constitu-
tive exons with AG-GT splice sites (50 to 250 bp in
length), whose flanking introns were at least 70 bp long
and not of U12 type, was used. The lowest scoring 5% and
10% of exons were considered as very weak and weak
exons, respectively. Exons with a score greater than the
lowest 10% were considered as not-weak exons for con-
trol. The average CpG methylation level was calculated
for each exon and its flanking intron regions (< 200 bp
upstream and downstream of the exon) for the absolute
and relative exonic enrichment of CpG methylation.
CpG islands, exons, and CpG density
The genomic coordinates of CGIs and exons were down-
loaded from the UCSC genome browser. CpG density was
calculated as the ratio of observed to expected CpG fre-
quencies according to the formula cited in Gardiner-Gar-
den and Frommer [36]. CGIs were predicted by the
following criteria: GC content of 50% or greater, length
greater than 200 bp, and a ratio greater than 0.6 of
observed number of CpG dinucleotides to the expected
number. A gene was deemed CGI-containing when the
region -1,000 bp to 500 bp from the transcription start
site overlapped a CGI.
Additional material
Additional file 1 A figure showing nucleosome occupancy upstream,
inside and downstream of the CGI as predicted by primary sequences.
Additional file 2 A figure showing the CpG density of exons with dif-
ferent positioning and their downstream introns.
Additional file 3 A figure showing the H3K36me3 level observed
within the transcript partitioned into non-coding exons, coding
exons, and introns.
Additional file 4 A figure showing specific enrichment of CpG methy-
altion on exons with weak splice sites.
Additional file 5 A figure showing DNA methylation normalized for
CpG density within the transcript partitioned into non-coding exons,
coding exons, and introns.
Additional file 6 A figure showing DNA methylation measured at
base resolution within the transcript partitioned into non-coding
exons, coding exons, and introns.
Additional file 7 A figure showing a model that explains the higher
relative density of H3K36me3 in highly expressed compared to lowly
expressed genes, and the higher absolute-level of H3K36me3 in
exons compared to introns.
Choi Genome Biology 2010, 11:R70
/>Page 8 of 8
Abbreviations
bp: base pair; CGI: CpG island; GEP: Gene Expression Omnibus; ICE: initial cod-
ing exon; LCCE: last coding exon; NCBI: National Center for Biotechnology Infor-
mation; NCE: non-coding exon; NFR: nucleosome-free region; NRC: normalized
read count; pol II: RNA polymerase II; UCSC: University of California, Santa Cruz;
UTR: untranslated region.
Competing interests
The authors declare that they have no competing interests.
Authors' contributions
JKC conceived of the study, analyzed the data, and wrote the manuscript.
Acknowledgements
This work was done by using computing facilities at CHUNG Moon Soul Center
for BioInformation and BioElectronics and supported by KAIST startup funding
for new faculty and by the National Research Foundation of Korea (NRF) grant
funded by the Korea Government (MEST; 2009-0086964). The author is a recipi-
ent of TJ Park Bessemer Science Fellowship.
Author Details
1
Department of Biology and Brain Engineering, KAIST, 335 Gwahak-ro, Daejeon
305-701, Republic of Korea and
2
Computational and Mathematical Biology,
Genome Institute of Singapore, 60 Biopolis Street, Singapore 138672, Republic
of Singapore
References
1. Bird AP: CpG-rich islands and the function of DNA methylation. Nature
1986, 321:209-213.
2. Jones PA, Baylin SB: The fundamental role of epigenetic events in
cancer. Nat Rev Genet 2002, 3:415-428.
3. Yuan G-C, Liu Y-J, Dion MF, Slack MD, Wu LF, Altschuler SJ, Rando OJ:
Genome-scale identification of nucleosome positions in S. cerevisiae.
Science 2005, 309:626-630.
4. Mavrich TN, Jiang C, Ioshikhes IP, Li X, Venters BJ, Zanton SJ, Tomsho LP, Qi
J, Glaser RL, Schuster SC, Gilmour DS, Albert I, Pugh BF: Nucleosome
organization in the Drosophila genome. Nature 2008, 453:358-362.
5. Schones DE, Cui K, Cuddapah S, Roh T-Y, Barski A, Wang Z, Wei G, Zhao K:
Dynamic regulation of nucleosome positioning in the human genome.
Cell 2008, 132:887-898.
6. Zilberman D, Gehring M, Tran RK, Ballinger T, Henikoff S: Genome-wide
analysis of Arabidopsis thaliana DNA methylation uncovers an
interdependence between methylation and transcription. Nat Genet
2006, 39:61-69.
7. Zhang X, Yazaki J, Sundaresan A, Cokus S, Chan SW-L, Chen H, Henderson
IR, Shinn P, Pellegrini M, Jacobsen SE: Genome-wide high-resolution
mapping and functional analysis of DNA methylation in Arabidopsis.
Cell 2006, 126:1189-1201.
8. Cokus SJ, Feng S, Zhang X, Chen Z, Merriman B, Haudenschild CD,
Pradhan S, Nelson SF, Pellegrini M, Jacobsen SE: Shotgun bisulfite
sequencing of the Arabidopsis genome reveals DNA methylation
patterning. Nature 2008, 452:215-219.
9. Lorincz MC, Dickerson DR, Schmitt M, Groudine M: Intragenic DNA
methylation alters chromatin structure and elongation efficiency in
mammalian cells. Nat Struct Mol Biol 2004, 11:1068-1075.
10. Kolasinska-Zwierz P, Down T, Latorre I, Liu T, Liu XS, Ahringer J: Differential
chromatin marking of introns and expressed exons by H3K36me3. Nat
Genet 2009, 41:376-381.
11. Batsche E, Yaniv M, Muchardt C: The human SWI/SNF subunit Brm is a
regulator of alternative splicing. Nat Struct Mol Biol 2006, 13:22-29.
12. Schwartz S, Meshorer E, Ast G: Chromatin organization marks exon-
intron structure. Nat Struct Mol Biol 2009, 16:990-995.
13. Tilgner H, Nikolaou C, Althammer S, Sammeth M, Beato M, Valcárcel J,
Guigó R: Nucleosome positioning as a determinant of exon
recognition. Nat Struct Mol Biol 2009, 16:996-1001.
14. Segal E, Fondufe-Mittendorf Y, Chen L, Thåström A, Field Y, Moore IK,
Wang J-PZ, Widom J: A genomic code for nucleosome positioning.
Nature 2006, 442:772-778.
15. Kaplan N, Moore IK, Fondufe-Mittendorf Y, Gossett AJ, Tillo D, Field Y,
LeProust EM, Hughes TR, Lieb JD, Widom J, Segal E: The DNA-encoded
nucleosome organization of a eukaryotic genome. Nature 2009,
458:362-366.
16. Gupta S, Dennis J, Thurman RE, Kingston R, Stamatoyannopoulos JA,
Noble WS: Predicting human nucleosome occupancy from primary
sequence. PLoS Comput Biol 2008, 4:e1000134.
17. Tazi J, Bird A: Alternative chromatin structure at CpG islands. Cell 1990,
60:909-920.
18. Boyle AP, Davis S, Shulha HP, Meltzer P, Margulies EH, Weng Z, Furey TS,
Crawford GE: High-resolution mapping and characterization of open
chromatin across the genome. Cell 2008, 132:311-322.
19. Tirosh I, Berman J, Barkai N: The pattern and evolution of yeast promoter
bendability. Trends Genet 2007, 23:318-321.
20. Brukner I, Sanchez R, Suck D, Pongor S: Sequence-dependent bending
propensity of DNA as revealed by DNase I: parameters for
trinucleotides. EMBO J 1995, 14:1812-1818.
21. Iyer V, Struhl K: Poly(dA:dT), a ubiquitous promoter element that
stimulates transcription via its intrinsic DNA structure. EMBO J 1995,
14:2570-2579.
22. Anderson JD, Widom J: Poly(dA-dT) promoter elements increase the
equilibrium accessibility of nucleosomal DNA target sites. Mol Cell Biol
2001, 21:3830-3839.
23. Field Y, Kaplan N, Fondufe-Mittendorf Y, Moore IK, Sharon E, Lubling Y,
Widom J, Segal E: Distinct modes of regulation by chromatin encoded
through nucleosome positioning signals. PLoS Comput Biol 2008,
4:e1000216.
24. Segal E, Widom J: Poly(dA:dT) tracts: major determinants of
nucleosome organization. Curr Opin Struct Biol 2009, 19:65-71.
25. Bird A: DNA methylation patterns and epigenetic memory. Genes Dev
2002, 16:6-21.
26. Yamada Y, Watanabe H, Miura F, Soejima H, Uchiyama M, Iwasaka T, Mukai
T, Sakaki Y, Ito T: A comprehensive analysis of allelic methylation status
of CpG islands on human chromosome 21q. Genome Res 2004,
14:247-266.
27. Hodges E, Smith AD, Kendall J, Xuan Z, Ravi K, Rooks M, Zhang MQ, Ye K,
Bhattacharjee A, Brizuela L, McCombie WR, Wigler M, Hannon GJ, Hicks JB:
High definition profiling of mammalian DNA methylation by array
capture and single molecule bisulfite sequencing. Genome Res 2009,
19:1593-1605.
28. Lister R, Pelizzola M, Dowen RH, Hawkins RD, Hon G, Tonti-Filippini J, Nery
JR, Lee L, Ye Z, Ngo Q-M, Edsall L, Antosiewicz-Bourget J, Stewart R, Ruotti
V, Millar AH, Thomson JA, Ren B, Ecker JR: Human DNA methylomes at
base resolution show widespread epigenomic differences. Nature
2009, 462:315-322.
29. Sims RJ, Millhouse S, Chen C-F, Lewis BA, Erdjument-Bromage H, Tempst
P, Manley JL, Reinberg D: Recognition of trimethylated histone H3 lysine
4 facilitates the recruitment of transcription postinitiation factors and
pre-mRNA splicing. Mol Cell 2007, 28:665-676.
30. Nucleosome Occupancy and Pol II Distribution Data [http://
dir.nhlbi.nih.gov/papers/lmi/epigenomes/hgtcellnucleosomes.aspx]
31. Choi JK, Bae J-B, Lyu J, Kim T-Y, Kim Y-J: Nucleosome deposition and DNA
methylation at coding region boundaries. Genome Biol 2009, 10:R89.
32. DNA Methylome Data [ />data.html]
33. Rozowsky J, Euskirchen G, Auerbach RK, Zhang ZD, Gibson T, Bjornson R,
Carriero N, Snyder M, Gerstein MB: PeakSeq enables systematic scoring
of ChIP-seq experiments relative to controls. Nat Biotechnol 2009,
27:66-75.
34. Predicted Nucleosome Occupancy Data [ />software/nucleo_genomes.html]
35. Chepelev I, Wei G, Tang Q, Zhao K: Detection of single nucleotide
variations in expressed exons of the human genome using RNA-Seq.
Nucleic Acids Res 2009, 37:e106.
36. Gardiner-Garden M, Frommer M: CpG islands in vertebrate genomes. J
Mol Biol 1987, 196:261-282.
doi: 10.1186/gb-2010-11-7-r70
Cite this article as: Choi, Contrasting chromatin organization of CpG islands
and exons in the human genome Genome Biology 2010, 11:R70
Received: 12 January 2010 Revised: 28 March 2010
Accepted: 5 July 2010 Published: 5 July 2010
This article is available from: 2010 Choi; licensee BioMed Central Ltd. This is an open access article distributed under the terms of the Creative Commons Attribution License ( which permits unrestricted use, distribution, and reproduction in any medium, provided the original work is properly cited.Genome Biolog y 2010, 11:R70