Báo cáo y học: "Identification of novel exons and transcribed regions by chimpanzee transcriptome sequencing" pptx
Bạn đang xem bản rút gọn của tài liệu. Xem và tải ngay bản đầy đủ của tài liệu tại đây (2.34 MB, 16 trang )
Wetterbom et al. Genome Biology 2010, 11:R78
/>Open Access
RESEARCH
© 2010 Wetterbom et al.; licensee BioMed Central Ltd. This is an open access article distributed under the terms of the Creative Com-
mons Attribution License ( which permits unrestricted use, distribution, and reproduc-
tion in any medium, provided the original work is properly cited.
Research
Identification of novel exons and transcribed
regions by chimpanzee transcriptome sequencing
Anna Wetterbom
†
, Adam Ameur
†
, Lars Feuk, Ulf Gyllensten and Lucia Cavelier*
Abstract
Background: We profile the chimpanzee transcriptome by using deep sequencing of cDNA from brain and liver,
aiming to quantify expression of known genes and to identify novel transcribed regions.
Results: Using stringent criteria for transcription, we identify 12,843 expressed genes, with a majority being found in
both tissues. We further identify 9,826 novel transcribed regions that are not overlapping with annotated exons,
mRNAs or ESTs. Over 80% of the novel transcribed regions map within or in the vicinity of known genes, and by
combining sequencing data with de novo splice predictions we predict several of the novel transcribed regions to be
new exons or 3' UTRs. For approximately 350 novel transcribed regions, the corresponding DNA sequence is absent in
the human reference genome. The presence of novel transcribed regions in five genes and in one intergenic region is
further validated with RT-PCR. Finally, we describe and experimentally validate a putative novel multi-exon gene that
belongs to the ATP-cassette transporter gene family. This gene does not appear to be functional in human since one
exon is absent from the human genome. In addition to novel exons and UTRs, novel transcribed regions may also stem
from different types of noncoding transcripts. We note that expressed repeats and introns from unspliced mRNAs are
especially common in our data.
Conclusions: Our results extend the chimpanzee gene catalogue with a large number of novel exons and 3' UTRs and
thus support the view that mammalian gene annotations are not yet complete.
Background
It is generally believed that comparisons at the genome
and transcriptome levels are powerful strategies towards
understanding the molecular differences that underlie the
phenotypic divergence between humans and chimpan-
zees. Since the time of divergence, approximately 6 mil-
lion years ago [1], the two species have acquired changes
in both their genomes and their transcriptomes. The
draft chimpanzee genome sequence [2] provided new
opportunities to study primate biology and to understand
the speciation process. Mikkelsen et al. [2] presented a
comprehensive analysis of the chimpanzee genome and a
comparative analysis with the human genome, but did
not address the complexity of the transcriptome. Studies
of chimpanzee transcription have been performed pri-
marily with microarrays, covering both coding [3-8] and
noncoding regions [9] of the genome. Due to the
sequence divergence between the species, the use of
microarrays can be problematic when arrays based on
human sequence data are employed to study the chim-
panzee transcriptome. To circumvent this problem, cus-
tom-made arrays with species-specific probes have been
used [10,11]. Notwithstanding, all targeted expression
arrays are based on a priori assumptions regarding the
expressed parts of the genome, and are therefore not suit-
able for unbiased studies of transcription and discovery
of novel transcripts.
Direct detection of both known and novel transcripts
and exons can be achieved by complete sequencing of the
cDNA population. This strategy was used by Sakate et al.
[12], who used Sanger sequencing of cloned cDNA librar-
ies to assemble the 5' end of 226 protein-coding chimpan-
zee genes and later to describe the full-length cDNAs
from 87 protein-coding genes [13]. However, Sanger
sequencing is not suitable for capturing the full comple-
ment of the chimpanzee transcriptome. The advent of
second-generation sequencing techniques now makes it
* Correspondence:
Department of Genetics and Pathology, Rudbeck laboratory, Uppsala
University, SE-751 85 Uppsala, Sweden
†
Contributed equally
Full list of author information is available at the end of the article
Wetterbom et al. Genome Biology 2010, 11:R78
/>Page 2 of 16
possible to directly sequence the RNA populations (RNA-
Seq) to an unprecedented depth, providing information
on both which genomic regions are transcribed and their
expression levels. This technology has been successfully
applied to eukaryotes, including yeast [14,15],
Caenorhabditis elegans [16], mouse [17] and human [18-
20]. More recently, transcriptome profiling has been
employed for comparative studies of human, chimpanzee
and rhesus macaque [21,22]. Blekhman et al. [21] used
RNA-Seq to identify a large number of genes in liver,
where the expression levels appear to be under natural
selection in primates. They also identified a group of
genes with similar expression levels between species but
with a sexually dimorphic expression pattern. In another
study, Babbitt et al. [22] used Tag-sequencing [23,24] to
survey the coding and noncoding transcriptome in fron-
tal cortex. Their results show that in addition to protein-
coding genes, a group of noncoding transcripts is also
conserved between the species.
Transcriptome studies usually rely on different types of
annotations to determine where genes and other func-
tional elements are located within the genome. Such gene
predictions can be based either on the DNA sequence
itself or on alignments of mRNAs and/or ESTs [25]. For
chimpanzee, few expression data are available and gene
models have therefore been based on evidence from
human annotations. This results in a homocentric view
that has previously made it hard to detect expression of
chimpanzee-specific transcripts. However, using RNA-
Seq it is now possible to measure gene expression and
capture the diversity of the chimpanzee transcriptome in
an unbiased way. Transcriptome sequencing of human
HapMap cell lines [26] indicates that even for well-anno-
tated genomes, it is possible to identify many novel tran-
scripts. Pickrell et al. [26] describe almost a thousand
novel transcribed regions (TRs) that appear to be part of
existing human gene models. Many of these regions are
spliced to annotated exons and most regions were puta-
tive new UTRs rather than protein-coding exons. Based
on these findings we expected also to find a large number
of novel TRs in the chimpanzee genome.
Here we report the results from sequencing of the
chimpanzee transcriptome in brain (frontal cortex) and
liver at higher coverage than previous studies [21,22].
Our samples are unique, originating from infant chim-
panzees, and thus the results provide an important com-
plement to studies of adult animals. Using the SOLiD
platform, we generated over 500 million reads from the
brain and liver of two chimpanzees. The sequence data
were used to quantify expression of known genes and to
identify novel TRs, some of which appeared to be absent
from the human genome. In these analyses we assessed
differences both between the tissue types and between
individuals. Furthermore, by combining the novel TRs
with de novo splice predictions we were able to detect
numerous uncharacterized exons and 3' UTRs that
extended existing gene models. Using this strategy we
also identified a putative novel member of the ATP-cas-
sette transporter gene family, located on chromosome 16.
These novel exons and the new gene model were not
included in human transcript databases, thereby suggest-
ing that they may account for some of the uncharacter-
ized variation between the species. In conclusion, our
experimental approach enabled us to create a compre-
hensive catalogue of transcribed elements across tissues
and individuals.
Results
Sample preparation, sequencing and mapping of reads
Samples from frontal cortex and liver tissue were
obtained from two young chimpanzees, one male and one
female. We generated one cDNA library per tissue and
individual and sequenced the fragments using the SOLiD
platform. For the female chimpanzee, both 35-bp and 50-
bp reads were generated (samples denoted brainF 35 bp,
brainF 50 bp, liverF 35 bp and liverF 50 bp) whereas for
the male only 35-bp reads were sequenced (samples
denoted brainM 35 bp and liverM 35 bp). The sequencing
reactions generated between 38 and 170 million reads, of
which more than 40% mapped uniquely to the chimpan-
zee reference genome (panTro2; Table 1) when allowing
for up to three mismatches for the 35-bp reads and up to
Table 1: Mapping summary for all six SOLiD runs
Sample Read length Total number of reads Uniquely aligned reads
BrainM 35 88,598,445 34,644,708 (39.1%)
LiverM 35 78,533,657 27,872,398 (35.5%)
BrainF 35 170,016,027 79,557,661 (46.8%)
BrainF 50 38,733,951 22,897,769 (59.1%)
LiverF 35 77,388,286 27,034,253 (34.9%)
LiverF 50 58,610,173 26,393,670 (45.0%)
Total 511,880,539 218,400,459 (42.7%)
Wetterbom et al. Genome Biology 2010, 11:R78
/>Page 3 of 16
four mismatches for the 50-bp reads. The subsequent
analyses were performed to characterize the transcrip-
tome repertoire, both in terms of quantifying the expres-
sion level of known genes and by identifying novel
transcripts (see outline in Figure 1).
Based on the mapped reads we constructed a coverage
signal profile across the chimpanzee genome. To mini-
mize the effect of pileups of identical reads at some
genomic positions, which may lead to overestimated gene
expression levels, we computed the coverage signal exclu-
sively from reads with unique starting points. This is a
conservative approach and may lead to reduced dynamic
range for studying gene expression. A common problem
in RNA-Seq analyses is an uneven representation of the 3'
and 5' ends of the mRNA [17,27]. To evaluate this aspect
of the data, as well as our ability to detect known coding
regions, we used the coverage signal of all chimpanzee
RefSeq genes [28] and computed the average coverage for
all exons and introns with different rank (for example, last
exon, second to last exon and so on; Figure S1 in Addi-
tional file 1). Although the coverage signals agreed very
well with the location of RefSeq exons, we observed a bias
towards more reads in the 3' end of the genes. This bias
was most likely due to incomplete reverse transcription
of the template RNA from the oligo(dT) priming used in
the first-strand cDNA synthesis.
Quantifying gene expression and detecting transcribed
regions
To define genes, we used annotations of human and
chimpanzee RefSeq genes [28], which are based on align-
ments of RefSeq RNAs. Gene expression was estimated
using the 'average depth of coverage per million reads'
(dcpm), as proposed by Hillier et al. [16]. Dcpm is the
coverage score normalized for the total number of
mapped reads. To avoid the observed 3' bias, expression
was estimated only for the last 500 bp of each gene,
ensuring that the expression data were comparable
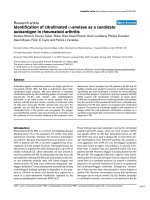
between genes of different lengths. Two of the samples,
brainF and liverF, were sequenced with different read
lengths (35 bp and 50 bp). These technical replicates
showed a very high correlation of gene expression levels
(Figure 2a,b), demonstrating the reproducibility of the
sequencing results. Consequently, we merged the techni-
cal replicates to obtain four final datasets: brainF, liverF,
brainM and liverM. A higher correlation of transcription
levels was seen between identical tissues from the two
individuals than between the two different tissues from
the same individual (Figure 2c-f).
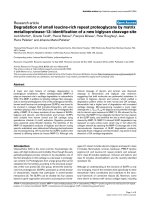
To detect significantly expressed genes we defined a
coverage threshold for expression. The distribution of
dcpm values from the last 500 bp of all genes was com-
pared to the coverage signal of an equal number of inter-
genic sequences of the same length, and on the same
chromosomes, sampled at random from the chimpanzee
genome (Figure 3). The two distributions had a small
overlap and the cut-off was set to exclude 95% of the ran-
dom sequences. We used the same approach to define a
distinct threshold for each of the four samples. This
resulted in a similar number of expressed genes per tissue
in the two individuals, with 11,315 genes being signifi-
cantly expressed in both brain samples and 8,806 genes
expressed in both liver samples (Table 2).
The same expression level thresholds were then used
for de novo detection of TRs across the genome, not lim-
iting the analysis to predefined gene annotations. To
reduce the frequency of false positives, we required each
region to have at least 50 bp consecutively above the cut-
off. Additionally, we required the regions to be expressed
in the same tissue of both animals. A total of 116,075 TRs
were detected in brain and 61,920 in liver (Table 2),
including both regions overlapping with RefSeq genes
and TRs outside of previous annotations. The coordi-
nates for all TRs are available in Additional file 2 and can
be uploaded and viewed in the UCSC Genome Browser
[29,30].
Localization and expression of transcribed regions
Each TR was classified as exonic (overlapping a RefSeq
exon), intragenic (inside a RefSeq intron), upstream (< 10
kb from the RefSeq transcription start site), downstream
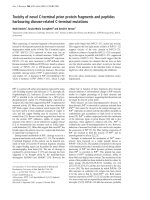
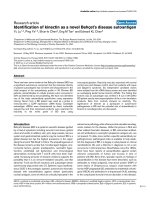
Figure 1 Work flow for the bioinformatics analyses. Sequence
reads were mapped to the reference genome (PanTro2), a coverage
signal was calculated across the genome and a threshold for expres-
sion was established. The threshold was initially used to determine ex-
pression of RefSeq genes and later for de novo detection of TRs. TRs
with no previous annotations were considered to be novel and further
characterized. De novo prediction of splice junctions was performed to
join novel TRs with each other and with existing gene models.
Aligned reads
Coverage signal
Gene expression
Transcribed regions (TRs)
Splice junctions
3’
5’
Extended gene models
3’
5’
Wetterbom et al. Genome Biology 2010, 11:R78
/>Page 4 of 16
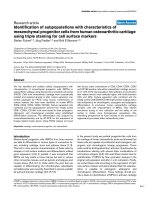
Figure 2 Pearson correlations of expression signals for different sequencing runs. (a,b) The correlation between 35-bp versus 50-bp reads for
the datasets brainF and liverF. (c,d) The correlation between the two individuals in brain and liver, respectively. (e,f) The correlation between brain
and liver within each individual. Gene expression values were estimated as the depth of coverage per million reads (dcpm), using the last 500 bp of
RefSeq genes. The axes in the figures represent log2(dcpm).
(a) (b)
(d)(c)
(e) (f)
−10 −5 0 5
−10 −5 0 5
R
2
=0.87
brainF_35
brainF_50
−10 −5 0 5
−10 −5 0 5
R
2
=0.9
liverF_35
liverF_50
−10 −5 0 5
−10 −5 0 5
R
2
=0.76
brainM
brainF
−10 −5 0 5
−10 −5 0 5
R
2
=0.6
liverM
liverF
−10 −5 0 5
−10 −5 0 5
R
2
=0.46
brainF
liverF
−10 −5 0 5
−10 −5 0 5
R
2
=0.34
brainM
liverM
Wetterbom et al. Genome Biology 2010, 11:R78
/>Page 5 of 16
(< 10 kb from the RefSeq 3' end) or intergenic (all other
regions) by subsequent matching to each of the catego-
ries. This way each TR may belong to only a single
genomic region, although there may be overlapping gene
annotations in databases. The percentage of TRs in dif-
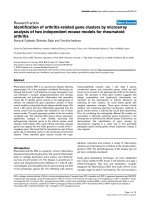
ferent genomic regions is shown in Figure 4a and the
absolute numbers are provided in Table S1 in Additional
file 1. When considering all samples together, more than
33% of the TRs mapped to RefSeq exons and approxi-
mately one-fifth of the regions in this group were located
within terminal exons. Non-exonic TRs were further
compared to annotations of human and chimpanzee
mRNAs and ESTs, and TRs not overlapping any of these
annotations were termed 'novel'. Thus, novel TRs repre-
sent transcripts that have not previously been observed in
either human or chimpanzee. The overwhelming major-
ity of novel TRs were located in introns, followed by
intergenic regions and regions in the proximity (that is,
within 10 kb) of genes (summarized in Figure S2). The
large accumulation of novel TRs around known genes
suggests a multitude of alternative isoforms that have not
been previously characterized.
The gene expression levels (measured in dcpm) for dif-
ferent genomic locations are shown in Figure 4b. The
exonic regions had the highest dcpm and there was only a
small difference in expression levels between terminal
and all other exons, although more TRs were found in
terminal exons counted in absolute numbers. The second
highest dcpm was seen for regions within 10 kb down-
stream of RefSeq genes, followed by the categories 10 kb
upstream, intergenic and finally intronic. Novel TRs had
lower average dcpm levels than annotated TRs in the
same genomic locations, thus emphasizing the potential
of deep sequencing to identify TRs that have previously
escaped detection due to lower transcription levels.
Comparing expression levels in frontal cortex and liver
We examined the expression of chimpanzee genes in the
two tissues and were able to confirm a total of 12,843
expressed genes, with 11,315 in frontal cortex and 8,806
in liver (Figure 5a). Of these genes, 7,278 (57%) were
expressed in both tissues and this group of genes had the
highest average expression values (dcpm
mean
= 5.4). Liver-
specific genes had slightly lower expression (dcpm
mean
=
3.9) and brain-specific genes showed even lower expres-
sion levels (dcpm
mean
= 1.5). We further examined the
biological function of genes in the three categories by a
Gene Ontology analysis and found that ubiquitously
expressed genes were primarily involved in general bio-
logical processes such as metabolism and RNA process-
ing (Table S2 in Additional file 1). Genes with tissue-
specific expression clustered into different biological pro-
cesses. Brain-specific genes were over-represented in sev-
eral developmental processes, for example, neurological
and anatomical structure development, and in cell adhe-
sion. In contrast, genes with liver specific expression were
over-represented in many metabolic processes, including
lipid and carboxylic acid metabolism, as well as in inflam-
matory response (Table S2 in Additional file 1).
In addition to expression of known genes, we also iden-
tified a large number of novel TRs. The vast majority
(84%) of novel TRs mapped within RefSeq introns or
within 10 kb upstream or downstream of RefSeq genes.
As a comparison, these extended RefSeq loci covered
approximately half of the genome, and thus there was a
Table 2: Number of expressed RefSeq genes and transcribed regions
BrainM BrainF Both brains LiverM LiverF Both livers
Number of expressed RefSeq genes 13,094 12,526 11,319 10,353 11,110 8,810
Total number of TRs 208,472 188,421 116,075 80,184 146,173 61,920
Number of novel TRs 79,092 76,847 19,446 17,617 47,295 6,496
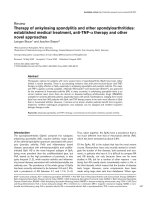
Figure 3 Establishing a threshold for expression of genes and
transcribed regions. Comparison between the coverage of the last
500 bp of RefSeq exons (red) and an equal number of randomly sam-
pled regions with the same length distribution (blue). The x-axis shows
the dcpm values and the y-axis denotes the frequency of exons or ran-
dom regions with a certain dcpm. Random regions do not overlap
with any RefSeq exon and regions with no coverage are not shown in
the distributions. The cut-off (yellow line) is placed at the top 5% in the
random distribution, which is different for each sample.
log2(avg_dcpm)
Number of regions
−10 −5 0 5
0 200 400 600 800
cut-off
12526 expressed genes
exons
random sequences
Wetterbom et al. Genome Biology 2010, 11:R78
/>Page 6 of 16
clear enrichment of TRs in these regions. The tissue dis-
tribution of genes containing novel TRs is displayed in
Figure 5b. In comparison to the results for all expressed
genes (Figure 5a), a larger proportion of genes with novel
TRs was found in brain than in liver. Furthermore, we
noted that the overlap between tissues was lower for
genes containing novel TRs than for expressed genes in
general, indicating that novel TRs have a higher degree of
tissue specificity. A Gene Ontology analysis showed that
genes harboring novel TRs belonged to similar biological
processes as was found for expressed genes in general
(Table S3 in Additional file 1).
Comparing expression levels between individuals
Although most genes were detected in both chimpanzees
for each respective tissue, we observed some differences
between the individuals. A total of 14,301 genes were
detected in the frontal cortex samples and 80% (n =
11,319) of these were found in both chimpanzees. The
corresponding figures for liver are 12,653 genes in total,
with 70% (n = 8,810) shared between both individuals.
Levels of gene expression were highly correlated between
individuals, in both brain and liver (Figure 2c,d). We also
noted that genes with individual-specific expression gen-
erally had lower expression levels than genes detected in
both chimpanzees, indicating that the differences
between samples is, to some extent, a result of the
sequencing depth. In contrast to known genes, where a
large proportion was shared between individuals, novel
TRs were not shared to the same extent. Of the novel
TRs, only 14% and 11% were common to both individuals
in brain and liver, respectively. This reflects the fact that
novel TRs were generally expressed at lower levels, and in
parallel to known genes, regions with lower expression
level were shared to a lesser extent between the two
chimpanzees.
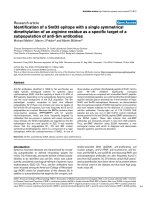
Figure 4 Genomic distribution and expression level of transcribed regions. (a) A histogram of the percentage of TRs in different genomic loca-
tions. The results are grouped into different genomic locations along the x-axis and the y-axis represents the percentage of TRs in each genomic lo-
cation. Each tissue is plotted separately in a different color. (b) A boxplot of the transcription levels (measured in dcpm) for TRs in different genomic
locations. The x-axis shows different genomic locations and expression values are on the y-axis. In this figure, all samples are pooled together.
(a) (b)
Last exon
Other exon
Intronic
Intronic
(novel)
Upstream
Upstream
(novel)
Downstream
Downstream
(novel)
Intergenic
Intergenic
(novel)
Brain M
Brain F
Liver M
Liver F
Transcription level, log2(dcpm)
Last exon
Other exon
Intronic
Intronic
(novel)
Upstream
Upstream
(novel)
Downstream
Downstream
(novel)
Intergenic
Intergenic
(novel)
Percent of TRs
0 5 10 15 20 25 30
−3 −2 −1 0 1 2
Figure 5 Tissue distribution of expressed genes and genes con-
taining novel transcribed regions. The Venn-diagram illustrates the
proportion of genes expressed only in brain, only in liver or in both tis-
sues simultaneously. (a) The tissue distribution of expressed genes; (b)
the tissue distribution of genes harboring at least one novel TR (found
intronically or within 10 kb upstream or downstram of the gene).
RefSeq genes RefSeq genes with
novel transcribed regions
(a) (b)
Liver
1528
Liver
1
5
28
Brain
4037 7278
Brain
5275 3235
Liver
1316
Wetterbom et al. Genome Biology 2010, 11:R78
/>Page 7 of 16
Blekhman et al. [21] have previously reported sexually
dimorphic gene expression in liver in primates (con-
served between human, chimpanzee and macaque) and
to revisit this question in our data we plotted gene
expression for male against female (Figure 6). As a control
in our data we highlighted genes on the sex chromosomes
and noted the expected pattern with genes on the Y chro-
mosome expressed only in the male, whereas there was
no clustering of × chromosomal genes. We then plotted
our results for the genes reported by Blekhman et al. and
as shown in Figure 6 we were not able to replicate the pat-
tern of sexually dimorphic gene expression in our data.
Since gene expression in primates is known to vary with
age and developmental stage [7], we speculate that the
observed discrepancy could reflect the different ages of
the chimpanzees examined by Blekhman et al. and by us.
Further characterization and validation of novel
transcribed regions
We required TRs to be present in both chimpanzees and
using this criterion we identified 116,075 TRs in brain
and 61,920 in liver. TRs were often found in clusters, thus
indicating that closely spaced TRs originated from the
same transcript and with increasing sequencing depth
many of the TRs are likely to merge into longer tran-
scripts. Seventeen percent (19,446) of the TRs in brain
and 10% (6,496) of those in liver did not overlap any pre-
viously annotated exons, mRNAs or ESTs. Such TRs were
considered novel TRs and analyzed further to elucidate
their origin and function. Current gene annotations in
chimpanzee are almost exclusively based on transcrip-
tional data originating from human and this implies that
the novel TRs in our study have not been previously
detected in human. The explanation for this may be
either that the novel TRs are absent in human tissues or
that they are expressed at low levels and have thus
escaped detection.
Novel transcribed regions absent from the human genome
A subgroup of novel TRs could not be mapped to the
human genome sequence, indicating that the DNA-
sequence has been lost in human or gained in chimpan-
zee. Starting with the complete dataset of all novel TRs
(19,446 in brain and 6,496 in liver), we selected all regions
where the coordinates could not to be translated to the
human genome (hg19). For these candidates, we
BLASTed [31] the transcribed chimpanzee sequences to
the entire human genome and selected TRs that did not
give a significant match. This resulted in 285 novel TRs in
brain and 77 in liver, which were not present in the
human genome sequence. Such novel TRs were located
both in the vicinity of known genes (that is, intronic or
within 10 kb upstream or downstream) and in intergenic
regions. The genomic regions that were absent in the
human genome have either been lost in the human lin-
eage or gained in the chimpanzee lineage and to deduce
the evolutionary history we used the macaque genome as
an outgroup. Within this subset of novel TRs approxi-
mately half (n = 133 in brain and n = 39 in liver) could not
be located in either the human or the macaque genomes,
thus indicating sequence gain in the chimpanzee lineage.
For the remaining part of novel TRs the region was found
both in the chimpanzee and macaque genomes and such
regions have most likely been lost in the human lineage.
Figure 7a shows two closely located novel TRs found
intergenically on chromosome 1. This region was present
in both the macaque and orangutan genomes but
appeared to be absent in the human genome. RT-PCR
validated the two TRs as expressed and produced a tran-
script (approximately 800 bp) that spanned the region
between the novel TRs (Figure 7b). Since this novel tran-
script was located in a genomic region with sparse anno-
tation, it was difficult to predict its function. Translating
the genomic sequence into amino acid code (using all six
reading frames) did not reveal a long open reading frame
and thus it is more likely that the two novel TRs stem
from a non-coding RNA (ncRNA).
Novel exons and UTRs
We aimed specifically at identifying TRs that represented
novel exons and UTRs. It is expected that many such TRs
will extend known gene annotations and thus the TRs will
be found close to known genes. This was supported by
the finding that 84% of the novel TRs mapped in the
Figure 6 Sexually dimorphic gene expression. Differences in gene
expression (in liver) between the two individual chimpanzees. The x-
axis represents expression values (in dcpm) in the female and the male
is on the y-axis; each grey dot represents the expression of one gene.
Genes located on the sex chromosomes are displayed as × and Y, re-
spectively. Overlaid are data from Blekhman et al. [21] with red dots in-
dicating genes with higher expression in female than in liver, and blue
dots representing the opposite scenario.
●
●●●●●
●
●
●
●
●
●
●
●
●
●
●
●
●
●
●
●
●
●
●●●
●
●
●
●
●
●
●
●
●
●
●
●●●●●●
●
●
●
●
●
●
●
●
●
●
●
●
●
●
●
●
●
●
●
●
●
●
●●
●
●
●
●
●●●●
●
●
●
●
●
●
●
●
●
●
●
●
●
●
●●●●
●
●
●●
●
●
●
●
●
●
●
●
●
●
●
●
●●
●
●
●
●
●
●
●
●
●
●
●
●
●
●
●
●
●
●
●
●
●
●
●
●
●
●
●
●
●
●
●
●
●
●
●
●
●
●
●
●
●
●
●●
●
●●●
●
●●
●
●
●
●
●
●
●●
●
●
●
●●
●
●
●
●
●
●
●
●
●
●
●
●
●
●
●
●●●●●
●
●
●
●
●
●
●
●
●
●●
●
●
●
●
●
●●
●
●●
●
●
●
●●
●
●
●
●
●●●●
●
●
●
●
●
●
●
●
●
●
●●
●
●
●
●●
●
●
●
●
●
●
●
●
●
●
●●●
●
●
●
●●●●
●
●
●
●
●●●
●
●
●
●
●
●
●
●●●●
●
●
●
●
●●●● ●●●●
●
●
●
●
●
●●●
●
●
●●
●
●
●
●
●
●
●●
●
●
●
●
●
●
●
●
●
●
●
●
●
●
●
●
●
●
●
●
●
●
●
●
●
●
●
●
●
●
●
●
●
●
●
●
●
●
●
●
●
●
●●●●●●●
●
●
●
●
●●
●
●●
●
●
●
●
●●
●
●
●●
●
●
●●●
●
●
●
●
●
●
●
●
●
●●
●
●
●
●●●●●
●
●●●
●
●
●
●
●
●
●
●
●●●
●
●
●
●
●
●
●
●
●
●
●●●
●
●
●
●
●
●
●
●
●
●●●
●
●
●●●
●
●
●●●●●
●
●
●
●
●
●
●
●
●
●
●
●
●
●
●
●
●
●
●
●
●
●
●
●
●
●
●
●
●
●
●
●
●
●
●
●
●
●●●
●
●
●
●
●
●
●●
●
●
●
●
●
●
●
●
●
●●●
●
●
●
●
●
●
●●●
●
●
●
●
●
●
●
●
●
●
●
●
●
●
●
●
●●
●
●
●
●
●
●
●●●●
●
●
●
●
●
●
●
●
●
●
●
●
●●
●
●
●
●
●
●●●
●
●
●●●●
●
●●●
●
●
●●●
●
●
●
●
●
●
●
●
●
●
●
●
●
●
●
●
●
●●
●
●
●
●
●
●
●
●
●
●
●
●●
●
●●
●
●●●
●
●
●
●
●
●
●
●
●
●●
●
●
●
●
●
●
●
●
●
●
●
●
●
●
●
●●●●
●
●
●
●
●
●
●
●
●●
●
●
●
●
●
●●
●
●
●
●
●
●
●
●
●●
●
●
●
●
●●●●
●
●●
●
●
●
●
●
●
●
●
●
●
●
●
●●
●
●
●
●
●
●
●
●
●
●
●●●
●
●●
●
●
●
●
●
●
●
●
●
●
●●
●
●●
●
●
●
●
●
●
●
●
●
●●●
●
●
●
●
●●●
●
●
●
●
●
●
●
●
●
●
●
●●
●
●
●
●
●
●
●●
●
●
●
●
●
●
●
●
●
●
●
●
●
●
●
●
●
●
●●
●
●
●
●
●
●●
●
●
●
●●
●
●
●
●
●
●
●●●●●
●
●●
●
●
●
●
●●
●
●●
●
●
●
●●
●
●
●
●
●
●
●
●
●
●
●●
●●●
●
●
●
●
●
●
●●●●●
●
●
●
●
●
●
●
●
●
●
●
●
●
●
●●
●
●
●
●
●
●
●
●
●●
●
●
●
●
●
●
●
●
●
●●●
●
●
●
●
●
●
●
●
●
●
●
●
●
●
●
●
●
●
●
●
●
●
●
●
●●●
●
●●
●
●
●
●
●
●
●
●
●
●
●
●
●
●
●
●●
●
●●
●
●
●
●
●
●
●
●
●
●
●
●
●
●
●
●
●
●
●
●
●
●
●
●
●
●
●
●
●
●
●●
●
●
●
●●
●
●
●
●
●
●●●
●
●
●
●
●
●
●
●
●
●
●
●
●
●
●
●
●
●
●
●
●
●
●●
●
●
●
●
●
●
●
●
●
●
●
●●
●
●
●
●
●
●●
●
●
●
●
●
●
●
●
●
●
●
●
●
●
●
●
●
●
●
●
●
●
●●
●
●
●
●
●
●
●
●
●
●
●
●
●
●
●
●●
●
●
●
●
●●●
●
●●●●
●
●
●
●
●
●
●
●●●
●
●
●
●
●
●
●
●
●
●
●●
●
●
●
●
●●
●
●
●
●
●
●
●
●
●
●
●
●
●
●
●
●
●
●
●
●
●
●
●
●
●
●
●
●
●
●
●
●
●
●
●
●
●
●
●
●
●
●
●
●
●●
●
●
●
●
●
●
●
●
●
●
●
●
●
●
●
●
●
●
●
●
●
●
●
●
●
●
●●
●
●
●●●
●
●
●
●
●
●
●
●
●
●
●
●
●
●
●
●●
●
●
●
●
●
●
●
●
●
●
●
●
●
●●
●
●
●
●
●
●
●
●
●
●
●
●
●●
●
●●
●
●
●
●
●
●
●
●
●
●
●●●
●
●
●
●
●●
●
●
●
●
●
●
●
●
●
●
●
●●
●
●
●
●
●●
●
●
●
●
●
●
●●
●
●
●
●
●
●
●
●
●
●
●
●
●
●
●
●●
●
●
●
●
●
●●
●
●
●
●
●●
●
●
●
●
●
●
●
●
●
●
●
●
●
●
●
●
●●
●
●
●
●
●●●
●
●
●
●
●
●
●
●
●
●
●
●
●
●
●
●
●●
●
●
●
●
●
●
●
●
●
●
●
●
●
●
●
●
●
●
●
●
●
●
●●●
●
●
●●
●
●
●
● ●
●
●
●
●
●
●
●
●
●
●
●
●
●
●
●
●
●
●
●
●
●
●
●●●
●
●
●
●
●
●
●
●●
●
●
●
●
●
●●●
●
●
●
●
●
●
●
●
●
●
●
●
●
●●
●
●
●
●
●
●
●
●
●
●
●●●
●
●
●
●●●
●
●●●
●
●
●●●●
●
●●●
●
●
●
●
●
●
●
●
●
●
●●
●
●
●
●
●
●
●
●
●●●
●
●
●
●
●
●
●●
●
●
●
●
●
●
●●●
●
●
●
●
●
●
●
●
●
●
●
●
●
●
●
●
●
●
●
●
●
●
●
●
●
●
●
●
●
●
●
●
●●●
●
●
●
●
●
●
●
●
●
●
●
●
●
●
●
●
●
●
●
●
●
●
●
●●●
●
●
●
●
●
●
●
●
●
●
●
●
●
●
●
●
●
●
●
●
●
●●●
●
●
●
●
●
●
●
●●●
●
●
●
●
●
●
●
●
●
●
●
●●
●
●
●
●
●
●
●
●
●
●
●
●
●●
●
●
●
●
●●●●●
●
●
●
●
●
●
●
●
●
●
●
●
●
●
●
●
●
●●
●
●
●
●
●
●
●
●
●
●
●
●●
●
●
●
●
●●●●
●
●
●
●
●
●
●
●
●
●
●
●
●●
●
●
●
●
●
●●
●
●
●
●
●
●
●
●
●
●
●●
●
●
●
●
●
●
●
●
●
●
●
●
●
●
●
●
●
●
●
●●●●
●
●
●
●●●
●
●
●●
●
●
●
●
●
●●
●
●
●
●
●
●
●
●
●
●
●
●
●
●
●
●
●
●
●
●
●
●
●
●
●
●
●
●
●
●
●
●
●
●
●●●●●●●
●
●●
●
●
●
●
●
●
●
●
●
●
●
●
●
●
●●●
●
●
●
●
●
●●●
●
●
●
●
●
●
●
●
●
●
●
●
●
●
●
●
●●●
●
●
●
●
●
●
●
●
●
●
●
●
●
●
●
●
●
●
●
●●
●
●
●
●
●
●●
●
●
●
●
●
●
●
●
●
●
●
●
●●
●
●
●
●●
●
●
●
●
●
●
●
●
●
●
●●●●●●
●
●
●
●●●
●
●
●
●
●
●●
●
●
●
●
●
●
●
●
●
●
●
●
●
●
●
●
●
●
●
●●●
●
●
●
●
●
●
●
●
●
●●
●
●
●●
●
●
●
●●●
●
●
●
●
●
●
●
●
●
●
●
●
●
●
●
●●
●
●
●
●
●
●
●
●
●
●
●
●
●
●
●●
●
●
● ●
●
●
●
●
●
●
●
●
●
●
●
●
●
●
●
●
●
●
●
●
●●
●
●
●
●
●
●●●●●
●
●
●
●
●
●
●
●
●
●●●
●
●●
●
●
●
●
●
●
●
●
●
●●●●
●
●
●
●●●
●
●
●
●
●
●
●
●
●
●
●
●
●
●
●
●
●
●
●
●
●
●
●
●
●
●●
●
●●
●
●
●
●
●
●
●●
●
●
●
●
●
●●●
●
●
●
●
●
●
●
●
●
●
●
●
●
●
●
●
●
●
●
●
●●
●
●
●
●
●
●
●
●●
●
●
●
●
●
●●●●
●
●
●
●
●
●
●
●
●
●
●●
●
●
●
●
●
●
●
●
●
●
●
●
●●
●
●●
●
●
●
●
●
●
●
●
●
●
●
●
●
●
●
●
●
●
●●
●
●
●
●
●
●
●
●
●
●
●
●
●
●
●
●
●
●
●
●
●●●●
●
●
●
●●
●
●●
●
●
●
●
●●
●
●
●
●
●
●
●
●
●
●
●
●
●
●
●
●
●
●
●
●
●
●
●
●●
●
●
●
●
●
●
●
●
●
●
●
●
●●
●
●
●
●
●
●
●●
●
●
●●
●
●●●
●
●
●
●
●
●
●●
●
●
●
●●
●
●
●
●
●
●
●
●
●
●
●
●
●
●
●
●●●●
●
●
●
●
●
●
●
●
●
●
● ●
●
●
●
●
●●
●
●
●
●
●
●
●
●●
●
●
●●
●
●●●
●
●
●
●
●
●
●
●
●
●
●
●
●
●
●
●●●
●
●●
●
●
●
●
●
●●
●
●
●●●
●
●
●
●
●
●
●
●
●●
●
●
●
●●
●
●
●
●
●
●
●
●
●
●
●
●
●
●
●
●
●
●
●
●
●●●
●
●
●
●
●
●
●
●
●
●
●
●
●
●
●
●
●
●
●
●●
●
●
●
●
●
●
●
●
●
●
●
●
●
●
●
●
●
●
●
●
●
●
●
●
●
●
●
●
●
●
●
●
●
●
●
●
●
●
●
●
●
●
●●●
●
●
●
●
●
●
●
●
●
●●
●
●
●
●
●
●
●
●
●
●
●
●
●
●
●
●
●
●
●
●
●
●
●
●
●
●
●
●
●●
●
●
●
●
●
●
●
●
●
●
●
●●●
●
●
●
●
●
●
●
●
●
●
●
●
●
●
●
●
●
●
●
●
●
●
●
●
●
●
●●
●
●
●
●
●
●
●
●
●
●
●
●
●
●
●
●
●
●
●
●●●
●
●●
●
●
●●●●
●
●
●
●●
●
●
●
●
●
●
●●●
●
●
●
●
●
●
●
●
●
●
●
●
●
●
●
●
●●
●
●
●
●
●
●
●
●
●
●
●
●
●●●
●
●●
●
●
●
●
●
●
●
●
●
●
●
●
●●●●●●●●
●
●
●
●
●
●
●
●
●
●
●●●●●
●
●
●●●
●
●
●
●
●
●
●●●
●
●
●
●
●
●●
●
●
●
●
●
●
●
●
●●
●
●●●
●
●
●
●
●
●
●
●
●
●●●
●
●
●
●
●
●
●●●●
●
●
●
●
●
●
●
●●●●
●
●
●
●
●
●
●
●
●●●●
●
●
●
●
●
●
●
●
●
●●
●
●
●
●
●
●
●
●
●
●
●
●
●
●
●
●
●
●
●
●
●
●
●
●
●
●
●
●●
●
●
●
●
●●●
●
●
●
●
●
●
●
●
●
●
●●
●
●
●
●
●●
●
●●●
●
●
●
●
●
●●●
●
●
●
●
●
●
●
●
●
●
●
●●●
●
●
●
●
●
●
●
●
●
●
●
●
●
●
●●●●
●
●
●
●
●
●●
●
●
●
●●
●
●
●
●
●
●
●
●
●
●
●
●
●
●
●
●
●
●
●
●
●●
●
●
●●
●
●●●
●
●
●
●
●
●
●
●
●●●●
●
●
●
●
●
●
●
●
●
●
●
●
●
●
●
●
●
●
●
●
●
●
●
●
●
●
●
●
●
●
●
●
●
●
●
●
●
●
●
●
●
●
●
●
●
●
●
●
●
●
●
●
●●
●
●
●
●
●
●
●
●
●
●
●
●
●
●●
●
●
●
●
●
●
●
●
●
●●
●
●●
●
●
●
●
●
●
●
●
●
●●
●
●
●
●●
●
●
●
●
●
●
●
●
●
●
●
●
●
●
●
●
●
●
●
●
●
●
●
●
●
●
●
●
●●●
●
●
●
●
●
●
●
●●●
●
●
●
●
●
●
●●
●
●
●
●
●
●
●
●
●
●
●
●
●
●
●
●
●
●
●
●
●
●
●
●
●
●
●
●
●
●
●
●
●●●●
●
●
●
●
●
●
●
●
●
●
●
●
●
●
●
●
●
●●●
●
●●●●
●
●●
●
●
●
●
●●
●
●
●
●
●
●
●
●
●
●
●
●
●
●
●
●
●
●
●
●
●
●
●●
●
●
●
●
●
●
●
●
●
●
●
●
●●
●
●
●
●
●
●
●
●
●
●●
●
●
●
●●
●
●
●
●
●
●
●●
●
●
●
●
●
●
●
●
●
●
●
●●
●
●
●●●●
●
●
●
●
●●
●
●
●
●
●●●
●
●
●
●
●
●
●
●
●
●
●
●
●●
●
●
●
●
●
●
●
●
●●
●
●
●
●
●
●
●
●
●
●
●
●
●●●●●
●
●
●
●
●
●
●
●●●●●●
●
●●
●
●
●
●
●●
●
●
●
●
●
●
●
●
●
●
●
●
●
●
●●
●
●
●
●
●
●
●
●
●
●●
●
●
●
●
●
●
●●●
●
●
●
●
●
●
●
●
●
●
●
●
●
●●
●
●
●
●
●
●●
●
●
●
●●●
●
●
●
●
●
●
●
●
●●●●●
●
●
●●
●
●
●
●
●
●
●
●
●
●
●
●●●●
●
●
●
●
●
●
●●●●
●
●
●
●
●
●
●
●
●
●
●●●●●
●
●
●
●
●
●
●
●●●
●
●
●
●
●
●
●
●
●
●
●
●
●
●
●
●
●
●
●●
●
●●●
●
●
●
●
●
●
●
●
●●●●●
●
●
●
●
●
●
●
●
●
●
●●●
●
●
●
●
●●
●
●
●
●●
●
●
●
●●
●
●
●
●
●
●
●●●●
●
●
●
●
●
●●●
●
●
●●
●
●
●
●
●
●
●
●
●
● ●
●
●
●
●
●
●●
●
●
●
●
●
●
●
●
●
●
●
●
●
●
●
●
●
●
●
●
●●
●
●
●
●
●
●
●
●
●
●
●
●
●
●
●
●
●
●
●
●
●
●
●
●
●
●
●
●
●
●
●
●
●
●
●
●
●
●
●●●
●
●
●
●●●●
●
●
●
●
●
●
●
●
●
●
●
●
●●
●
●
●
●
●
●
●
●
●
●
●
●
●
●
●
●
●
●
●
●
●●●
●
●
●
●
●●
●
●●●●●
●
●
●
●●
●
●
●
●
●
●
●
●
●
●
●
●
●●
●
●
●
●
●
●
●●
●
●
●
●
●
●
●
●
●
●
●
●
●
●●
●
●
●
●
●
●
●
●●●●
●
●●●
●
●
●
●
●
●
●●●
●
●
●
●
●
●
●
●
●
●
●
●
●
●
●
●
●
●
●
●
●
●
●
●
●
●
●
●
●
●
●●
●
●
●
●
●
●
●●●
●
●
●
●
●
●●
●
●
●
●
●
●
●
●
●
●
●
●
●
●
●
●
●●●●●
●
●●●
●
●
●
●
●
●
●
●●●●
●
●
●
●●●●●●
●
●
●
●
●
●
●
●
●●●
●
●
●
●
●
●●
●
●
●
●
●
●
●●
●
●
●
●
●
●
●
●●●
●
●
●
●
●
●
●
●
●
●
●
●
●
●●●
●
●
●●
●
●
●
●
●
●●
●
●
●
●●
●
●
●
●
●
●
●
●
●
●
●
●
●●
●
●
●●
●
●●
●
●
●
●
●
●
●
●
●●●
●
●
●
●
●
●
●●●●●
●
●
●
●
●
●
●
●
●
●
●
●
●
●
●
●
●●
●
●
●
●
●
●
●
●●
●
●
●
●
●
●
●
●
●
●
●●
●
●
●
●
●●
●
●
●
●
●
●
●
●
●
●
●
●
●
●
●
●
●
●
●
●
●
●
●
●
●
●●
●
●●
●
●
●
●
●
●
●
●
●
●
●
●
●
●
●
●
●
●
●●
●
●
●
●
●
●
●
●
●
●
●
●
●
●
●
●
●
●
●
●
●
●
●
●
●
●
●
●
●
●
●
●
●
●
●
●
●
●
●
●●
●
●
●
●
●
●
●
●
●●
●
●
●
●
●
●
●
●
●
●
●
●
●●●
●
●
●
●
●
●
●
●
●
●
●
●
●●
●
●
●
●
●
●
●
●
●
●
●
●
●
●●●
●
●
●●
●
●
●
●●
●
●
●
●
●
●
●
●
●
●
●
●
●
●
●
●
●
●
●
●
●
●
●
●
●
●
●
●
●
●
●
●●●●
●
●
●
●
●
●
●
●
●
●
●
●
●
●
●
●●
●
●
●
●
●●
●
●
●
●●
●
●
●
●
●
●●●
●
●
●
●
●
●
●
●
●●
●
●●
●
●
●
●
●
●
●
●
●
●
●
●
●
●
●
●
●
●
●
●
●
●
●
●
●
●●
●
●
●●
●
●●
●
●
●
●
●
●
●●●
●
●
●
●
●
●
●●
●
●●
●
●
●
●
●
●
●
●
●
●
●
●
●
●
●
●
●
●●●
●
●
●●●
●
●
●
●
●
●
●
●
●
●
●
●
●
●
●
●
●
●●
●
●
●
●
●
●
●
●
●
●
●
●
●●●
●
●
●
●
●
●
●
●
●
●
●
●
●
●
●
●
●
●
●●
●
●
●
●
●
●
●
●
●
●
●
●
●
●
●
●
●
●
●
●
●
●
●
●●
●
●
●
●
●
●
●
●
●●
●
●
●●●
●
●
●
●
●
●
●
●
●
●
●
●
●
●
●
●
●
●
●
●
●●
●
●●
●
●
●●
●
●●
●
●
●
●
●●●●
●
●
●
●●
●
●
●
●
●●
●
●
●●
●
●
●
●
●
●
●●
●
●
●
●
●
●
●
●
●
●
●
●
●
●
●
●
●
●
●
●
●
●●
●
●
●
●
●
●
●
●
●
●
●
●●
●●●
●
●
●
●
●
●
●
●
●
●
●
●
●
●
●
●
●
●
●
●
●
●
●
●
●
●
●●●
●
●
●
●
●
●●●
●
●
●
●
●
●
●
●
● ●
●
●
●
●
●
●
●
●
●
●
●
●
●●
●
●
●
●
●
●
●
●
●
●
●
●
●
●
●
●
●
●
●
●
●
●
●
●
●
●
●
●
●
●
●
●
●
●
●●●
●
●
●
●
●
●●●
●
●
●
●
●
●
●
●
●
●●
●
●
●
●
●
●
●
●●
●
●
●
●
●●
●
●
●
●
●
●●
●
●
●
●
●
●
●
●
●
●
●
●
●●
●
●
●
●
●
●
●
●
●
●
●
●
●
●
●
●
●●
●
●
●
●
●
●
●
●
●
●
●
●
●
●
●
●
●
●
●
●
●
●
●
●
●
●
●
●
●
●
●
●
●
●
●
●
●
●
●
●
●
●
●
●●●
●
●
●
●
●
●
●
●
●
●●
●
●
●
●
●
●
●
●
●
●
●
●
●
●
●●
●
●
●
●
●
●
●●●●
●●
●
●●●
●
●
●
●
●
●
●
●
●
●
●
●
●
●
●●
●
●
●●
●
●
●
●
●
●
●
●
●
●
●
●
●
●
●
●
●
●
●
●
●
●
●
●
●
●
●
●
●●
●
●
●
●
●
●
●
●
●●
●
●
●
●
●
●
●
●●●
●
●
●
●
●
●
●●
●
●
●
●
●
●
●
●
●
●
●
●
●
●●
●
●
●
●●
●
●
●
●
●
●
●
●
●
●
●
●
●
●●●
●
●
●
●
●
●
●
●
●
●
●
●
●
●
●
●
●
●
●
●
●●●
●
●
●●●
●
●
●
●●●
●
●
●●
●
●●
●
●
●●
●
●
●
●●
●
●
●●
●
●
●
●
●
●
●
●●●
●
●
●
●
●
●
●
●
●
●
●
●
●
●
●
●
●
●
●
●
●
●
●
●
●
●
●●●●●●●●
●
●
●
●
●
●
●
●● ●●●
●
●
●
●●
●
●●
●
●
●
●
●
●
●
●●
●
●●
●
●
●
●
●
●
●
●
●
●
●
●
●
●
●
●
●
●
●
●
●
●
●
●
●
●
●
●
●
●
●
●
●●●●
●
●
●
●●
●
●
●
●
●
●
●
●
●
●
●
●
●
●
●
●
●
●
●
●●
●
●
●
●
●●●
●
●
●
●
●
●
●
●
●
●
●
●
●●
●
●
●
●
●
●
●
●
●
●
●
●
●
●
●
●
●
●●
●
●
●
●
●
●
●●
●
●
●
●
●
●
●
●
●
●
●
●
●
●
●
●
●
●
●
●
●
●
●
●
●
●
●
●
●
●
●
●
●
●
●
●
●
●
●
●
●
●
●
●
●
●
●
●
●
●●
●
●
●
●●●
●
●
●
●
●
●
●
●
●
●
●
●
●●●
●
●
●
●
●
●
●
●
●●
●
●
●
●
●
●●
●
●
●
●
●
●
●
●
●●
●
●
●
●
●
●
●
●
●
●
●
●
●●
●
●
●
●
●●
●
●
●
●
●
●
●
●
●
●
●
●
●
●
●
●
●
●
●
●
●
●
●
●
●
●
●
●
●
●
●
●
●
●
●
●
●
●
●●●
●
●
●
●
●
●
●
●
●
●
●
●
●●●●
●
●
●●
●
●
●
●
●
●
●
●
●
●●●●
●
●
●
●
●
●
●
●
●●
●
●
●
●
●●
●
●
●
●
●
●
●
●●
●
●
●
●
●
●
●
●●
●
●
●
●
●
●
●
●
●
●
●
●
●
● ●●●
●
●
●
●●●
●
●●
●
●
●●
●
●
●
●
●
●
●
●
●
●
●
●
●●●●
●
●
●
●
●
●
●
●
●
●●●●
●
●
●
●
●
●
●
●
●
●
●
●
●
●
●
●
●
●
●
●
●
●
●●
●
●
●
●
●
●
●
●
●
●
●
●
●
●
●
●
●
●
●
●
●●●●
●
●
●
●
●
●
●
●
●
●
●●●●
●
●
●
●
●
●
●
●
●
●
●
●●
●
●
●
●●●
●
●
●
●
●
●
●
●
●
●
●
●
●
●
●●
●
●
●●
●
●
●
●
●
●
●
●
●
●●
●
●
●
●●●
●
●
●●
●
●
●
●
●
●
●●
●
●
●
●
●
●
●
●
●
●
●
●
●
●
●
●
●
●
●
●
●
●
●
●
●
●●
●
●
●
●
●
●
●
●
●
●
●
●
●
●
●●●●
●
●●●●
●
●
●
●
●
●
●
●
●
●
●
●
●
●
●
●
●
●
●
●
●
●
●●
●
●
●
●
●
●
●
●●
●
●
●
●
●
●
●
●
●
●
●
●
●
●
●
●
●
●
●
●●
●
●
●
●
●
●
●
●
●
●
●
●
●
●
●
●
●
●
●
●
●
●●●●
●
●
●
●●●●
●
●
●●●
●
●●
●
●
●
●
●●●
●
●
●
●
●
●
●
●
●
●
●
●
●
●
●●●
●
●
●
●
●
●●
●
●●
●
●
●
●
●
●
●
●
●
●
●●
●
●
●
●
●
●
●
●
●
●
●
●
●●
●
●
●
●
●
●
●
●
●
●
●
●
●
●
●
●
●
●
●
●
●●
●
●
●
●
●
●
●
●
●●●●
●
●
●
●
●
●
●
●●●●
●
●
●
●
●
●
●
●
●
●
●
●
●
●
●●●●
●
●
●
●
●
●
●
●
●
●●●●●
●
●
●
●
●
●
●
●
●
●
●
●
●
●
●
●
●
●
●
●
●
●
●
●
●
●
●
●
●
●
●
●
●
●
●
●●
●
●
●
●
●
●
●
●
●
●
●
●
●
●
●
●
●
●
●
●
●
●
●●●
●
●
●
●
●
●●●●
●
●
●
●
●
●
●
●●
●
●
●
●
●●
●
●
●
●
●
●
●
●
●
●●●
●
●
●●●
●
●
●
●
●
●
●
●
●
●
●
●
●
●
●
●
●
●
●
●●
●
●
●
●
●
●●●●●
●
●
●
●●
●
●
●
●
●
●
●
●
●
●
●
●
●
●●
●
●
●
●
●●●
●
●
●
●
●
●
●
●
●●
●
●
●
●
●
●
●
●
●
●●
●
●
●
●
●
●
●
●
●
●
●
●
●
●
●
●●●●●
●
●
●●
●
●
●
●
●
●●
●
●
●
●
●
●
●
●
●
●
●●
●
●●
●
●●
●
●
●
●
●
●
●
●
●
●
●
●
●
●
●
●●●
●
●
●●
●
●●●●●●●●
●
●
●
●
●●
●
●
●
●
●
●
●
●
●
●●
●
●
●
●
●
●
●
●●●●
●
●
●
●
●
●
●
●
●
●
●
●
●
●
●
●
●●
●
●
●
●●
●
●
●
●
●
●
●
●
●
●
●
●
●
●
●●
●
●
●
●
●
●
●●●
●
●
●
●
●
●
●
●
●
●
●
●
●
●●
●
●
●
●
●
●
●●●
●
●
●
●
●
●
●●●
●
●
●
●
●
●●●
●
●
●
●
●
●
●
●
●
●
●
●
●
●
●
●
●
●
●
●
●
●●
●
●
●
●
●
●
●
●
●
●
●
●
●
●
●
●
●
●
●
●
●
●
●
●
●●●
●
●
●
●●●
●
●
●
●
●
●●
●
●●●
●
●●●
●
●
●
●
●
●
●
●
●
●
●
●
●
●
●
●
●
●
●
●
●
●
●
●
●
●
●
●
●
●
●
●
●
●●
●
●
●
●
●
●●●
●
●
●
●
●
●
●
●
●
●
●
●
●
●
●
●
●
●
●
●
●
●
●
●
●
●
●
●
●
●
●●
●
●●
●
●
●●●●
●
●
●
●
●
●
●
●
●
●
●
●●
●
●
●
●
●
●
●●
●
●
●
●
●●
●
●
●
●
●
●
●●●●
●
●
●
●
●
●●
●
●
●
●
●
●
●
●
●●●●
●
●
●
●
●
●
●
●
●
●
●
●
●
●
●
●
●
●
●
●
●
●
●
●●
●
●
●
●●
●
●
●
●
●
●
●●
●
●
●
●
●
●
●
●
●
●
●
●
●
●●
●
●
●
●●
●
●
●
●
●
●
●
●●
●
●
●
●
●
●●●
●
●
●
●
●●
●
●
●●
●
●
●
●
●
●
●
●
●
●
●
●
●●
●
●
●
●
●
●●
●
●●
●
●
●
●
●
●
●
●
●
●
●
●
●
●●●
●
●
●
●
●
●●
●
●
●
●
●
●
●
●
●
●
●
●
●
●
●
●
●
●●
●
●
●
●●
●
●
●
●
●
●
●●●
●
●
●
●
●
●
●
●
●
●
●
●
●
●
●
●
●
●
●
●
●
●
●
●
●
●
●●
●
●
●
●
●
●
●
●
●
●
●
●
●
●
●
●
●
●
●
●
●
●
●
●
●
●
●●●
●
●
●
●
●
●
●
●
●
●
●
●
●
●
●
●
● ●●
●
●●
●
●
●
●
●
●
●
●
●
●
●
●
●●
●
●●
●
●
●
●
●
●
●
●
●
●
●
●
●
●
●
●
●
●
●
●
●
●
●
●
●
●
●
●
●
●
●
●
●●●●
●
●
●
●
●
●
●
●
●
●
●
●
●
●
●
●
●
●
●●●
●
●●
●
●
●
●
●
●
●
●
●
●
●●
●
●
●
●
●
●
●
●
●
●●
●
●
●
●
●
●
●
●
●
●
●
●
●
●●
●
●
●
●
●
●
●
●
●
●●●●●● ●
●
●
●
●
●
●
●
●
●
●
●
●
●
●
●
●
●
●
●
●●
●
●
●
●
●
●
●
●
●
●
●
●●●
●
●
●
●
●
●
●
●
●
●●
●
●
●●
●
●
●
●
●
●
●
●
●
●
●
●
●
●
●●
●
●
●
●
●
●
●
●
●
●
●
●●●
●
●
●
●●
●
●
●
●
●●●
●
●
●
●
●
●
●
●
●
●
●
●
●
●
●
●●
●
●
●
●●
●
●
●
●
●
●
●
●
●
●
●
●●●
●
●
●
●
●
●
●
●
●
●
●
●
●
●
●
●●
●
●
●
●
●
●
●
●
●
●
●
●
●
●
●
●
●
●
●
●
●
●
●
●
●
●●
●
●●
●
●
●
●
●
●
●
●
●
●
●
●
●
●
●
●
●
●●
●
●
●
●
●●●●
●
●●
●
●
●
●●
●
●
●
●
●
●
●
●
●
●
●●●
●
●
●
●
●
●
●
●
●
●
●
●
●
●
●
●
●
●
●
●
●●
●
●
●
●
●
●
●●
●
●
●
●
●
●
●
●
●
●●
●
●
●
●
●
●
●
●
● ●●
●
●
●
●
●
●
●●●
●
●●
●
●
●
●
●
●
●
●
●●●●●
●
●
●
●
●
●
●
●
●
●
●
●
●
●
●
●
●
●
●●
●
●
●●
●
●
●
●
●
●
●
●
●
●
●
●
●
●●
●
●
●
●
●
●●
●
●●●
●
●
●
●
●
●
●
●
●
●
●
●
●
●
●
●
●
●
●
●
●
●
●
●
●
●●●●
●
●
●
●●●
●
●
●
●
●
●
●
●
●
●
●
●
●
●
●●
●
●●
●
●
●
●●
●
●
●
●
●●
●
●
●●
●
●●●
●
●
●
●
●
●
●
●
●
●
●
●
●●●●
●
●●●
●
●
●
●
●●
●
●
●
●
●
●
●
●
●
●
●●
●
●
●
●
●
●●
●
●●
●
●
●
●
●
●
●
●
●
●
●
●
●
●
●
●
●
●
●
●
●
●
●●
●
●
●
●●●
●
●
●
●
●
●
●
●●●
●
●●
●
●
●
●
●
●
●
●●●
●
●
●
●
●
●
●
●●●●●●●
●
●
●●
●
●
●
●
●
●●
●
●●●
●
●
●
●●
●
●
●
●
●
●
●
●
●
●
●
●●●●
●
●
●
●●
●
●
●
●
●
●
●
●
●
●
●
●
●
●
●
●
●
●
●
●
●
●
●
●
●
●
●
●
●
●
●
●
●
●
●
●
●
●
●●●●
●
●
●
●
●
●
●●
●
●●
●
●
●
●
●
●
●
●
●
●●
●
●
●
●
●
●
●
●
●
●●
●
●
●●●●●●
●
●
●●●●●
●
●
●
●
●●
●
●
●
●
●
●●
●
●
●
●
●
●
●
●
● ●●
●
●
●
●
●
●
●
●
●
●
●
●
●
●
●
●
●
●
●
●
●
●
●
●
●
●
●
●●
●
●
●
●
●
●
●
●
●
●
●●
●
●
●
●
●
●
●
●
●
●●●●●
●
●
●
●
●
●
●
●
●
● ●
●
●
●●●● ●●
●
●
●
●● ●
●
●
●
●●●
●
●
●
●●●●
●
●
●
●
●
●
●
●
●
●
●
●
●
●
●
●
●
●
●
●
●●●
●
●
●
●
●
●
●
●
●
●
●
●
●
●
●
●
●
●
●
●
●
●
●●●
●
●
●
●
●●
●
●
●
●
●
●
●
●
●
●
●
●
●
●
●
●
●
●
●●●●●
●
●●
●
●
●
●
●
●
●
●
●
●
●
●
●●
●
●
●
●
●
●
●
●
●●
●
●●
●
●●
●
●
●
●
●
●
●
●
●
●
●
●
●●●
●
●
●
●
●
●
●
●
●
●
●
●
●
●
●
●
●
●
●
●
●
●
●
●●
●
●●
●
●
●
●●
●
●
●
●
●
●●●
●
●
●
●
●
●
●
●
●
●
●
●
●
●
●
●
●●●
●
●●
●
●
●●
●
●
●
●
●
●●
●
●
●●
●
●
●
●
●
●
●●
●
●
●●●
●
●
●
●●●●●
●
●
●
●●●
●
●
●
●
●
●
●
●
●
●
●
●
●
●
●
●
●
●
●
●
●
●
●
●
●
●
●
●
●
●
●
●
●
●●
●
●
●●
●
●●
●
●
●
●
●
●
●
●
●
●
●
●●
●
●
●●●
●
●
●
●
●
●
●
●
●
●
●
●
●
●
●
●
●
●
●
●
●
●●
●
●
●
●
●
●
●
●
●●
●
●
●
●
●
●
●
●
●
●
●
●
●●●●●
●
●
●
●
●
●
●●●●●●●●
●
●
●
●
●
●
●
●
●
●
●
●
●
●
●●
●
●
●
●●●●
●
●●
●
●●
●
●
●
●
●
●
●
●
●
●
●
●
●
●
●
●
●●
●
●
●
●
●
●
●
●
●
●●●
●
●
●
●
●
●
●
●
●
●
●
●
●
●
●
●
●
●
●
●
●●
●
●●●
●
●
●
●
●
●
●
●
●
●
●
●●●
●
●
●
●
●
●
●●●
●
●
●
●
●
●
●
●
●
●
●
●
●
●
●
●
●
●
●
●●●●●●
●
●●
●
●
●
●
●
●
●
●
●
●
●
●
●●●
●
●
●
●
●
●
●●
●
●
●
●
●
●
●
●
●
●
●
●
●
●
●
●
●●
●
●
●
●
●
●
●
●
●
●
●●●
●
●
●●●●
●
●
●●
●
●
●
●
●
●
●
●
●
●
●●
●
●
●●
●
●
●
●
●
●
●
●
●
●
●
●
●
●
●
●
●
●
●
●
●
●
●
●
●●
●
●
●
●
●
●●
●
●
●
●●●
●
●
●
●
●
●
●
●
●
●
●
●
●●●●
●
●●
●
●
●
●
●
●
●
●●●●
●
●
●
●
●
●
●
●●
●
●●
●
●
●
●●●●
●
●
●
●
●
●
●
●
●
●
●
●
●
●●
●
●
●
●
●
●
●
●
●
●●
●
●
●●
●
●
●
●●
●
●
●
●
●
●
●
●
●
●
●
●
●
●●●●
●
●
●●●
●
●
●
●
●
●
●
●
●●●●
●
●
●
●
●
●
●
●
●●
●
●
●
●
●
●
●
●
●
●
●
●
●
●●●
●
●
●
●
●
●
●
●
●
●
●●
●
●●
●
●
●
●
●
●
●
●
●
●●
●
●
●
●
●
●
●
●
●
●
●
●●●
●
●
●
●●
●
●
●
●
●
●
●●
●
●
●
●
●
●
●
●
●
●
●
●
●
●
●
●●
●
●
●
●
●
●
●
●
●●
●●
●
●
●
●
●●
●
●
●
●
●
●
●
●
●
●
●
●
●
●
●
●
●
●
●●
●
●
●
●
●●
●
●
●
●
●
●
●
●●
●
●
●
●
●
●
●
●
●
●●
●
●
●
●
●
●
●
●
●
●
●
●
●
●
●
●
●●●●●
●
●
●
●
●
●
●
●
●
●●●●●
●
●●●
●
●
●
●●●●●
●
●
●
●
●
●
●
●
●●●●
●
●
●
●
●
●
●
●
●
●
●
●
●●●●●
●
●
●
●
●
●
●
●
●
●
●
●
●
●
●
●
●
●
●
●
●
●
●
●
●
●
●●
●
●
●
●
●
●
●
●
●
●
●
●
●
●
●
●
●
●
●
●
●
●
●●
●
●
●
●
●
●
●
●
●
●
●
●
●●
●
●●
●
●
●
●
●
●
●
●
●
●
●
●
●
●
●
●
●
●
●
●
●
●
●
●
●
●
●●
●
●
●●
●
●
●●
●
●
●●
●
●
●●●
●
●
●
●
●
●
●
●
●
●
●
●
●
●
●
●
●
●
●●
●
●
●
●
●
●
●
●
●
●
●
●
●●
●
●
●
●
●
●
●
●●
●
●
●
●
●
●
●
●
●●●
●
●
●
●
●●●
●
●
●
●
●
●
●
●
●
●
●
●
●●●●
●
●
●
●
●●
●
●
●
●
●
●
●
●
●
●
●●
●
●
●
●
●
●
●
●
●
●
●
●●●●
●
●●●●●●●●
●
●
●
●
●
●
●
●
●
●●●
●
●
●
●●
●
●●
●
●
●●
●
●
●●
●
●
●●
●
●
●●●
●
●
●
●
●
●
●●
●
●
●●
●
●
●
●
●●
●
●
●
●
●
●
●
●
●
●●
●
●
●
●●
●
●
●
●
●
●
●
●●
●
●
●●
●
●
●
●●●
●
●●●
●
●
●
●
●
●
●
●
●
●
●
●
●
●
●●●
●
●
●
●
●
●
●
●●●●●●
●
●
●
●
●
●
●
●
●●
●
●
●●
●
●
●
●
●●●
●
●
●
●
●
●
●
●
●
●
●
●
●
●●
●
●●
●
●
●●
●
●
●●
●
●
●
●
●
●●●●●●●
●
●
●
●
●
●●
●
●
●
●
●
●
●●●●
●
●●●
●
●
●
●
●
●
●
●
●
●
●
●
●
●
●●
●
●
●
●
●
●
●
●
●●
●
●
●
●
●
●
●
●
●
●
●●●
●
●
●
●
●
●
●
●
●
●●
●
●●
●
●
●
●
●
●
●●
●
●
●
●
●
●
●
●
●
●
●
●
●
●
●
●
●●
●
●
●
●
●
●
●
●
●
●
●●
●
●
●
●
●
●
●
●
●
●
●
●
●
●
●
●
●
●
●
●
●●●
●
●
●
●
●
●
●
●
●
●
●
●
●
●
●
●
●
●
●
●●●●
●
●
●
●
●
●
●
●
●
●
●
●
●
●
●
●
●
●●
●
●
●
●
●
●
●
●
●
●
●
●
●
●
●●
●
●
●
●
●
●
●
●
●
●
●
●
●
●
●●
●
●
●
●
●
●
●
●
●
●
●
●
●
●
●
●
●
●
●
●
●
●
●
●
●
●
●
●
●●
●
●
●
●
●
●
●
●
●
●●
●
●
●
●
●●
●
●
●
●
●
●
●●●●
●
●
●
●
●
●
●
●
●
●
●
●
●
●
●
●
●
●
●
●●
●
●
●
●
●
●
●
●
●
●
●
●
●
●
●
●
●
●
●
●
●●
●
●
●
●●
●
●
●
●
●
●
●
●●
●
●
●
●
●
●
●
●
●
●
●
●
●
●●●
●
●
●
●
●
●
●
●
●
●
●
●
●●
●
●
●
●
●
●
●
●
●
●
●
●
●
●
●
●
●
●
●●
●
●●
●
●
●
●
●
●
●
●
●
●
●
●
●
●
●
●
●
●
●
●
●
●
●
●
●
●
●
●
●
●
●
●
●
●
●
●
●
●
●
●
●
●
●
●
●
●
●
●
●
●
●
●
●
●
●
●
●
●
●
●
●
●
●
●
●
●
●
●
●
●
●
●
●
●
●
●
●
●
●
●
●
●
●
●
●
●
●●
●
●
●
●
●●
●
●●
●
●
●
●
●
●
●
●
●
●
●
●
●
●
●
●
●
●
●●●
●
●
●
●
●●
●
●
●
●●
●
●
●●●●●●
●
●●
●
●●
●
●
●
●
●
●
●
●
●
●
●
●
●
●
●
●●●
●
●
●
●
●
●●●●●●
●
●
●
●
●
●
●
●●
●
●
●●
●
●
●
●●
●
●
●
●
●
●
●
●
●
●●
●
●●
●
●
●
●
●
●
●
●
●
●
●
●
●
●●
●
●●
●
●
●
●
●
●
●
●
●●●
●
●
●
●
●
●
●
●
●
●
●
●●●
●
●●●●
●
●
●
●
●
●●
●
●
●
●
●
●
●
●
●
●
●
●
●●●
●
●
●●●
●
●●
●
●●
●
●
●
●
●
●
●
●
●
●
●
●
●
●
●
●
●
●
●
●
●
●
●
●
●
●
●
●
●
●
●
●●
●
●
●
●
●
●
●
●
●
●
●●
●
●
●●●●
●
●
●●
●
●
●
●
●
●
●
●
●
●
●●●●●●
●
●
●
●●●
●
●
●
●
●
●
●●
●
●
●
●●●
●
●●
●
●
●
●●
●
●
●
●
●
●
●
●
●
●
●
●
●
●
●
●●
●
●
●
●
●
●
●●
●
●
●●●
●
●●
●
●
●●●
●
●
●
●●
●
●
●
●
●
●
●
●●●
●
●
●
●
●
●
●
●
●
●
●
●
●
●
●
●
●
●
●
●
●
●
●
●
●
●
●
●●
●
●
●
●
●
●
●
●
●
●
●
●
●
●
●
●
●
●
●
●
●
●
●
●
●
●
●
●
●
●
●
●
●
●
●
●
●
●●●
●
●
●
●
●
●
●
●
●
●
●
●
●●●●
●
●
●
●
●
●
●
●
●●●
●
●
●
●
●●●
●
●
●
●
●●●●●
●
●
●
●
●
●
●
●●
●
●●●
●
●
●
●
●
●
●
●●●●
●
●
●
●
●
●
●
●●
●
●●
●
●
●
●
●●
●
●
●
●●
●
●
●
●
●●●
●
●●
●
●
●
●
●
●
●
●
●
●
●
●
●●●
●
●
●
●
●
●
●
●
●
●
●
●
●
●
●
●
●
●●●
●
●
●
●
●●
●
●
●
●
●
●
●
●
●
●
●
●
●
●
●
●
●
●
●
●
●
●
●
●
●
●
●
●
●
●
●
●●
●
●
●
●
●●
●
●
●
●●
●
●
●
●
●●
●
●
●
●
●
●
●
●
●●
●
●
●
●
●●
●
●
●
●
●
●
●●
●
●
●
●●●
●
●
●
●
●
●
●●
●
●
●●
●
●●●●
●
●
●
●
●
●
●●
●
●
●
●
●●●
●
●●
●
●
●
●
●
●
●
●
●
●
●
●
●
●
●●
●
●●●
●
●●
●
●
●
●
●
●
●
●
●
●
●
●
●
●●●
●
●
●
●
●
●
●
●
●
●
●
●
●
●
●
●
●
●●
●
●
●
●
●
●●
●
●
●
●●●
●
●
●
●
●
●●
●
●
●
●
●
●
●●
●
●
●
●
●
●
●
●
●
●
●
●
●
●
●
●
●
●
●
●
●
●
●
●
●
●
●
●
●
●
●
●
●●●●
●
●
●
●
●
●
●
●
●
●
●
●
●
●●
●
●●
●
●●
●
●
●
●
●
●●
●
●
●
●
●
●
●
●
●
●
●
●
●
●
●
●
●
●
●●●●●
●
●
●●●●
●
●
●
●
●
●
●
●
●
●
●
●
●
●
●
●
●
●
●
●
●
●
●
●
●●
●
●
●
●
●
●
●
●
●
●●
●
●
●
●
●●
●
●
●
●
●
●
●
●
●
●
●
●
●
●
●
●
●
●
●
●
●
●
●
●
●
●●●
●
●●●
●
●
●
●
●
●
●
●
●●
●
●
●
●
●
●
●
●
●
●
●
●
●
●
●
●●
●
●
●
●
●
●
●
●
●
●
●
●
●
●●
●
●
●
●
●
●
●
●
●
●●
●
●
●
●
●
●
●
●
●
●
●●
●
●
●
●
●
●●
●
●
●
●
●
●
●
●
●
●
●●
●
●●●●
●
●●
●
●
●●
●
●
●
●
●
●
●
●
●
●
●
●
●
●
●
●
●
●
●
●
●
●
●
●
●
●●●●●●●●●
●
●
●
●
●
●
●
●●●●
●
●
●
●
●
●
●
●
●
●
●
●
●
●
●
●
●
●
●●●
●
●
●
●
●
●
●
●
●
●
●
●
●
●
●
●
●
●
●
●
●
●
●
●
●
●
●
●
●
●
●
●
●
●
●
●
●
●
●
●
●
●
●
●●
●
●
●
●●
●
●
●
●
●
●
●
●●
●
●
●
●
●
●
●
●
●
●
●
●
●
●
●
●
●
●
●
●
●●
●
●
●
●
●
●●●
●
●
●
●
●
●
●
●
●
●●
●
●
●
●
●
●
●
●
●●
●
●●●●
●
●●●●●●
●
●
●
●
●
●
●
●●
●
●
●
●
●
●
●
●
●
●
●
●●
●
●
●
●
●
●
●
●
●
●●●●●
●
●
●
●●
●
●
●
●
●
●
●
●
●
●
●●
●
●
●
●
●
●
●
●
●
●
●
●
●
●
●
●
●
●
●
●
●
●
●
●
●
●
●
●
●
●
●
●
●
●
●
●
●●
●
●●●
●
●
●
●
●
●
●
●
●
●
●
●●
●
●
●
●
●
●
●
●
●
●
●
●●
●
●●
●
●
●
●
●●●● ●●●●●●●
●
●
●●●
●
●
●
●
●
●●●●●
●
●
●
●
●
●
●
●●●
●
●
●●
●
●
●
●
●
●
●
●
●
●●
●
●
●
●
●
●
●
●
●
●
●
●
●
●
●
●
●●
●
●
●
●●
●
●
●
●
●●●●
●
●
●
●
●
●●●
●
●
●
●
●
●
●
●
●
●
●
●
●
●
●
●
●
●
●
●
●●●●●●
●
●
●
●
●
●
●
●
●
●
●
●
●
●
●
●
●
●
●●
●
●
●●●●●
●
●
●
●
●
●
●
●
●
●
●
●●
●
●
●●
●
●
●
●
●
●
●●●
●
●
●●●
●
●
●
●
●
●
●
●
●
●
●●●●●●
●
●
●
●
●
●
●
●
●
●
●
●
●
●
●
●
●
●●
●
●
●
●
●
●
●
●
●
●
●
●
●
●
●
●
●
●●
●
●
●
●
●
●
●
●
●●
●
●
●
●
●
●
●
●
●
●
●
●
●
●
●
●
●
●
●
●
●
●
●
●
●
●●
●
●
●
●
●●
●
●●
●
●
●
●
●
●
●
●
●●●
●
●
●
●
●
●
●
●
●
●●
●
●
●
●
●●●●●●●
●
●●
●
●
●
●
●
●
●
●
●
●
●
●●●●
●
●
●
●
●
●
●
●
●
●
●
●
●
●
●
●
●
●
●
●
●
●
●
●
●
●
●
●
●
●
●
●
●
●●
●
●
●
●
●
●
●
●
●
● ●
●
●
●
●●
●
●
●
●
●
●
●
●
●
●
●
●
●●
●
●
●
●
●
●
●
●
●
●
●
●
●
●
●
●
●
●
●
●
●
●
●
●
●●
●
●
●
●
●
●
●
●
●
●●
●
●
●
●
●
●
●
●
●
●●●●
●
●
●
●
●
●
●
●●
●
●●
●
●
●
●
●
●
●
●●
●
●
●
●
●
●
●
●
●
●
●
●
●
●
●
●
●
●●
●
●
●
●●
●
●
●●
●
●
●
●
●
●
●●
●
●
●
●
●
●●●
●
●
●
●
●
●
●
●
●
●
●
●
●
●
●
●
●●●
●
●
●
●●
●
●●●●
●
●
●
●
●
●
●
●
●
●
●
●
●
●
●
●
●
●
●
●
●●
●
●●
●
●
●
●
●
●
●
●
●
●
●
●
●
●
●
●
●●●
●
●
●
●
●
●
●
●
●●
●
●
●
●
●
●
●
●
●
●
●
●
●
●
●
●
●
●
●
●
●
●
●
●●●
●
●
●
●
●●
●
●
●
●
●
●
●
●
●
●
●●
●
●
●
●
●
●
●
●
●
●●
●
●
●
●●
●
●
●
●
●
●
●
●
●
●
●
●
●
●
●
●
●
●
●
●
●
●
●
●
●
●
●
●
●●
●
●●●
●
●
●
●
●
●
●
●
●
●
●
●
●
●
●
●
●
●
●
●
●
●
●
●
●●
●
●
●
●
●
●
●
●
●
●
●
●
●
●
●
●
●
●
●
●
●
●●
●
●●
●
●
●
●●
●
●●●
●
●
●
●
●
●
●
●●●●●
●
●
●
●
●●
●
●
●
●
●
●
●
●
●
●
●
●
●
●
●
●
●
●
●
●●
●
●
●●
●
●
●
●
●●●●
●
●
●
●●
●
●
●
●
●
●
●
●
●●●
●
●●
●
●
●
●
●
●
●
●
●
●
●
●
●
●
●
●
●●
●
●
●
●
●
●
●
●●●
●
●
●
●
●
●●
●
●
●
●
●
●
●
●●●
●
●
●
●
●
●
●
●
●
●
●
●
●●
●
●
●
●
●
●
●●
●
●
●
●
●
●
●
●
●
●●
●
●
●
●
●
●●
●
●
●●
●
●
●
●
●
●
●
●
●
●
●
●
●
●●
●
●
●
●
●
●
●
●
●
●
●
●●
●
●
●
●
●
●
●
●
●●
●
●
●
●
●
●
●
●
●
●
●
●
●
●
●
●
●
●
●●
●
●
●
●
●
●●
●
●
●
●
●
●
●
●
●
●
●
●
●
●
●
●
●
●
●
●
●
●
●
●
●
●
●
●●
●
●
●
●
●
●
●
●●●●
●
●●
●
●
●
●
●
●
●
●
●
●●
●
●
●
●
●
●
●
●
●
●
●●●●
●
●
●
●
●
●
●
●
●
●
●
●
●
●
●
●
●
●●
●
●
●
●
●
●
●
●
●
●
●
●
●
●
●
●
●
●
●
●
●●
●
●
●
●●
●
●
●
●
●
●
●
●
●
●
●
●
●
●
●
●
●
●
●
●●●●●
●
●
●
●●●
●
●
●
●
●
●
●
●●●
●
●
●
●
●
●
●●
●
●
●
●●●
●
●
●
●
●
●
●
●●●●
●
●
●
●
●
●
●
●
●
●
●
●
●
●●●
●
●
●
●
●
●
●
●●
●
●●●●●
●
●
●●
●
●
●
●
●
●●●●●
●
●
●
●
●
●●
●
●
●
●
●
●
●
●
●
●
●
●
●
●
●
●
●
●
●
●
●
●
●
●
●
●●
●
●
●
●
●
●
●
●
●
●
●
●●●●
●
●
●
●
●
●
●
●
●
●
●
●
●
●
●
●
●
●
●
●
●●
●
●
●
●●
●
●●
●
●
●
●
●
●
●
●
●
●
●
●
●
●
●
●
●
●
●
●●●
●
●
●●
●
●
●
●
●
●
●
●
●
●
●
●
●
●
●
●
●
●
●
●
●
●
●
●
●●
●
●
●
●
●●
●
●
●
●
●
●
●
●
●
●
●
●
●
●
●
●
●●
●
●
●
●
●
●
●
●
●●
●
●
●
●
●
●
●
●●
●
●
●
●
●
●
●
●
●
●
●
●
●
●
●
●
●
●
●
●
●
●
●
●
●
●
●
●
●
●
●
●
● ●
●●
●
●
●●
●
●
●●●●●
●
●
●
●
●
●
●
●
●
●
●
●
●
●
●
●●●
●
●
●
●
●
●
●●●●
●
●
●
●
●
●
●
●
●
●
●
●
●●
●
●
●
●
●●
●
●
●
●
●
●
●
●
●
●●
●
●
●
●
●●●●
●
●
●
●●
●
●●●●
●
●
●●
●
●
●
●
●
●
●
●
●●●
●
●
●
●
●
●●
●
●
●●●●
●
●
●
●
●
●
●●
●
●
●
●
●
●
●
●
●
●●●
●
●
●
●
●
●
●
●
●●●●●●
●
●●
●
●
●
●
●
●
●
●
●
●
●
●
●●
●
●
●
●
●
●
●
●
●
●
●
●
●
●
●
●
●●●●
●
●
●
● ●
●
●
●
●
●
●
●
●
●
●
●
●
●
●
●●
●
●
●
●●●
●
●
●
●●
●
●
●
●
●
●
●
●
●●
●
●
●
●
●
●●●
●
●
●
●
●
●
●
●
●
●
●
●
●
●
●
●
●
●
●
●●
●
●
●
●
●
●
●
●
●
●
●
●●
●
●
●●●
●
●●
●
●
●
●●
●
●
●
●
●
●
●
●
●
●
●
●●
●
●
●
●
●
●
●
●
●
●
●
●
●
●●●●
●
●
●●
●
●
●
●●
●
●
●
●
●
●
●
●
●●●
●
●
●
●
●
●
●
●
●
●
●
●
●
●
●●
●
●
●
●
●
●
●
●
●
●●●
●
●
●●
●
●
●
●
●
●
●●
●
●●
●
●
●
●
●
●
●
●
●
●
●
●
●●●
●
●
●
●
●
●
●
●
●
●
●
●
●
●
●
●
●
●
●
●
●
●
●
●
●
●
●
●
●
●
●
●●●
●
●
●
●
●
●
●●
●
●
●
●
●●
●
●●●
●
●●●●
●
●
●
●
●
●
●
●
●
●
●
●
●
●
●
●
●
●
●
●
●●
●
●
●
●
●
●
●
●
●
●
●
●
●
●
●
●
●
●
●●
●
●
●
●
●
●
●
●
●
●
●
●
●
●
●
●
●
●
●
●
●
●
●
●
●
●
●
●
●
●
●
●
●
●
●
●
●
●
●●
●
●●●
●
●
●
●
●
●
●
●●
●
●
●●
●
●
● ●
●
●
●
●
●
●
●●
●
●
●
●
●
●
●
●●●
●
●
●
●
●
●●
●
●
●
●
●
●
●
●●●
●
●
●
●●
●
●
●
●
●
●
●
●
●
●
●●●
●
●
●
●
●●
●
●
●
●●●●
●
●●●
●
●
●
●
●
●
●
●
●
●
●
●●
●
●
●
●
●
●
●
●
●
●
●
●●●●
●
●
●●
●
●
●
●
●
●
●
●●●●
●
●
●
●
●
●
●
●
●
●
●
●
●
●
●
●
●
●●
●
●
●
●●
●
●
●
●
●
●
●
●
●
●
●
●
●
●
●
●
●
●
●
●
●
●●●
●
●●●
●
●
●
●
●
●
●
●
●
●
●
●●
●
●
●
●
●
●
●
●
●
●
●
●
●
●●
●
●
●
●
●●●●
●
●
●
●
●
●●
●
●
●
●
●
●
●
●
●
●
●
●
●
●●
●
●
●
●
●
●
●
●
●
●
●
●
●
●
●
●
●
●
●●
●
●
●
●
●
●
●
●●
●
●●
●
●●
●
●
●
●
●
●
●●
●
●
●
●
●●
●
●
●
●
●●●●
●
●
●●
●
●●●●
●
●
●
●
●
●●●●●
●
●
●
●
●●
●
●
●●●
●
●
●
●
●
●
●●
●
●●●●
●
●●
●
●●
●●
●
●●
●
●●●
●
●
●
●●●
●
●
●●
●
●●
●
●
●
●
●
●
●
●
●
●
●
●
●
●
●
●
●
●
●
●
●
●
●
●
●
●
●
●
●
●
●
●
●
●
●
●
●
●
●
●●
●
●
●
●
●
●
●
●
●
●
●
●
●
●
●
●
●
●
●
●
●
●
●
●
●
●
●
●
●
●
●
●
●
●
●
●
●
●
●
●
●
●
●
●
●
●
●●
●
●
●
●
●
●
●
●
●
●
●
●●
●
●
●
●●
●
●
●
●
●
●●
●
●●
●
●●●
●
●
●
●●
●
●
●
●
●
●
●
●
●
●
●
●
●●
●
●
●
●
●●
●
●
●
●
●●●
●
●
●
●
●
●
●
●
●
●
●
●
●
●●
●
●●
●
●
●
●
●
●●●●
●
●●
●
●
●
●
●
●
●
●
●
●
●
●
●
●
●
●
●
●
●●
●
●
●
●●
●
●
●
●
●
●
●
●
●
●
●
●
●
●
●
●
●
●
●
●
●
●
●
●
●
●
●●●
●
●
●
●
●
●
●
●
●●●●●
●
●
●
●
●
●
●
●
●
●
●
●
●
●
●
●
●
●
●
●
●
●
●
●
●
●
●
●●
●
●
●
●
●
●
●
●
●
●
●
●●
●
●
●
●
●
●●●
●
●
●
●
●
●●
●
●
●●
●
●
●
●
●
●
●
●
●
●
●
●
●
●●
●
●
●
●
●
●●●●
●
●
●
●
●
●
●
●
●
●
●
●
●
●
●
●
●
●
●
●
●
●
●
●
●
●
●
●
●●
●
●
●
●
●●●
●
●
●
●
●
●
●
●
●
●
●●●●●
●
●
●
●
●
●
●
●●
●
●●
●
●●
●
●
●
●
●●
●
●
●
●
●
●●
●
●
●
●
●●●
●
●
●
●
●
●●
●
●
●
●
●
●●
●
●●
●
●
●
●●●
●
●
●
●●
●
●
●
●
●
●
●
●
●
●
●
●
●
●
●●●●
●
●
●
●
●
●
●
●
●
●
●
●●●
●
●
●
●
●
●
●
●
●
●
●
●
●
●
●
●
●
●
●
●
●
●
●
●
●
●●●
●
●
●
●●●
●
●
●
●
●●
●
●
●
●
●
●
●
●
●
●
●
●
●
●
●
●
●
●
●
●
●●
●
●
●
●
●
●
●
●
●
●
●
●
●
●
●
●
●
●
●
●
●
●
●
●
●
●
●
●
●
●
●
●
●
●
●
●
●
●
●
●
●
●
●
●
●
●
●
●
●
●
●
●
●
●
●
●
●
●
●●
●
●●
●
●●
●
●
●
●
●
●●
●
●
●
●
●
●
●
●
●
●
●
●
●
●
●
●
●
●
●
●
●●
●
●
●
●●●
●
●
●
●
●
●
●●
●
●
●
●●
●
●
●
●●
●
●
●
●
●
●●
●
●
●
●
●
●
●
●
●
●
●
●
●●
●
●
●
●
●
●
●
●
●
●
●
●
●
●
●
●
●
●
●
●
●
●●
●
●
●
●
●
●
●
●
●
●
●
●
●
●
●
●
●
●
●
●
●
●
●
●
●●
●
●
●
●●●
●
●
●
●
●
●
●
●
●
●
●
●
●
●
●
●
●
●
●
●
●
●
●
●
●
●
●
●
●
●
●
●
●●
●
●
●
●
●
●
●
●
●
●
●
●
●
●
●
●
●
●
●
●
●
●
●
●
●
●
●
●●
●
●●
●
●
●
●
●
●
●
●
●
●
●
●●●
●
●
●
●
●●
●
●
●
●
●●
●
●
●●
●
●
●
●
●
●
●
●●
●
●●●●●●●
●
●
●●
●
●
●
●
●
●
●
●
●
●
●
●
●
●
●●●
●
●
●
●●
●
●
●
●●
●
●
●●●
●
●
●
●●
●
●
●●
●
●
●
●
●
●
●
●●
●
●
●
●
●●
●
●
●
●
●
●
●
●
●
●
●
●
●
●●
●
●
●
●
●
●
●
●
●
●●
●
●
●
●
●
●
●
●●
●
●
●
●
●
●
●
●
●
●
●
●
●
●
●
●
●
●
●
●
●
●
●
●
●
●
●●●●●
●
●
●
●
●
●
●
●
●
●
●
●
●●
●
●●●
●
●
●
●
●●
●
●
●●●●
●
●
●
●
●
●
●
●
●
●
●
●
●
●
●●●●●
●
●
●
● ●
●
●
●
●
●
●
●
●
●
●
●
●
●
●
●
●
●
●
●
●
●
●
●●●
●
●
●
●●●●
●
●
●
●
●
●
●
●
●
●
●
●
●
●
●
●
●
●
●
●
●
●
●
●
●
●
●
●
●●
●
●
●
●
●
●
●
●●
●
● ●●
●
●
●
●
●
●●●
●
●
●
●
●
●
●
●
●
●
●
●
●
●
●
●
●
●
●
●
●
●
●●
●
●
●
●
●
●
●
●
●
●
●
●
●
●
●●●●
●
●
●
●
●●
●
●
●
●
●
●
●
●
●
●●●●
●
●
●
●
●
●
●●
●
●
●
●
●
●
●
●
●
●
●
●●
●
●
●
●
●
●
●
●
●
●●●
●
●
●
●
●
●
●
●
●
●
●
●●
●
●
●
●
●
●
●
●●●
●
●
●
●
●
●
●
●
●
●
●
●
●
●
●●
●
●
●
●
●●
●
●
●
●
●
●●
●
●
●
●
●
●
●●●
●
●
●
●
●●
●
●
●
●●
●
●
●
●
●
●
●
●
●
●
●
●
●
●
●
●
●
●
●●
●
●
●
●
●
●
●
●
●
●
●
●
●
●
●
●
●●●●●●
●
●
●
●
●
●
●
●
●
●
●
●
●
●
●
●
●●
●
●
●
●
●
●
●
●
●
●
●
●
●
●
●
●
●
●
●●●
●
●
●
●
●
●●●●
●
●
●
●
●
●
●
●
●
●●●
●
●
●
●
●
●
●
●
●
●
●
●
●
●
●
●
●
●
●
●
●●●
●
●
●
●
●
●
●
●
●
●
●
●
●
●
●
●
●
●
●●
●
●
●
●●
●
●
●
●
●
●
●
●
●●
●
●
●
●
●
●
●
●
●
●
●
●
●
●
●
●
●
●
●
●
●
●
●
●
●
●
●
●
●
●
●
●
●
●
●
●
●●
●
●
●
●
●●
●
●●
●
●
●
●●
●
●
●●
●
●
●
●
●
●
●
●
●
●
●
●
●
●
●
●●
●
●
●
●●
●
●
●
●
●
●●●
●
●●
●
●
●
●
●
●
●
●
●
●
●
●
●
●
●
●
●
●
●
●
●●
●
●
●
●
●
●
●
●
●
●
●
●
●
●
●
●
●
●
●
●
●
●
●
●●
●
●
●
●
●
●
●
●
●
●
●
●
●
●
●
●
●
●
●
●
●
●
●
●
●
●
●
●
●
●
●
●●●
●
●●
●
●
●
●
●
●●
●
●
●
●
●
●
●
●
●
●
●
●
●
●
●
●
●
●
●
●
●
●
●
●
●
●
●
●
●
●
●
●
●
●
●
●●
●
●
●
●
●
●
●
●
●
●
●
●
●
●
●●●●
●
●
●
●
●●
●
●●●
●
●
●
●
●●●●
●
●
●
●
●
●
●
●
●●
●
●
●●
●
●
●
●
●
●
●
●
●
●●
●
●
●
●
●
●
●
●
●●
●
●
●
●
●
●
●
●
●
●●
●
●
●●
●
●
●
●
●●
●
●
●
●●
●
●
●●
●
●
●
●
●
●
●
●
●
●
●
●
●
●
●
●●
●
●
●
●
●●●●
●
●
●
●
●
●
●
●
●
●
●
●
●
●
●
●
●
●
●
●
●
●
●
●●●
●
●
●
●
●
●
●
●
●
●
●●
●
●
●
●
●
●
●
●
●
●
●
●
●
●
●
●
●
●
●
●
●
●●
●
●
●
●
●
●
●
●
●
●
●
●
●
●
●
●
●
●
●
●
●
●
●
●
●
●
●
●
●
●
●
●
●
●
●
●
●●
●
●
●
●●●
●
●
●
●
●
●
●
●
●
●
●●
●
●
●
●●
●
●
●
●
●
●●●●
●
●●
●
●
●
●
●
●
●
●
●
●
●
●
●
●
●
●
●
●
●
●
●
●
●
●
●
●
●
●
●
●
●
●
●
●
●
●
●
●
●
●
●
●
●
●
●
●
●
●
●
●
●●●
●
●
●
●
●
●
●●
●
●●
●
●
●
●
●
●
●
●
●
●
●
●
●
●
●
●●
●
●
●
●●
●
●
●
●
●
●
●●
●
●
●
●
●
●
●
●
●
●
●
●
●
●
●
●
●●●
●
●
●
●
●
●
●
●
●
●
●
●
●
●
●
●
●
●
●
●
●
●
●
●
●●
●
●
●
●
●●
●
●
●
●
●
●
●
●
●
●
●
●
●
●
●
●
●
●
●
●
●
●
●
●
●
●
●●●
●
●
●
●
●●
●
●
●
●
●●
●
●
●
●
●
●
●
●
●
●
●
●
●
●
●
●
●●●●
●
●
●
●
●
●
●
●
●
●
●
●
●●●
●
●
●
●
●
●
●
●
●●
●
● ●●●
●
●
●
●
●
●
●
●●●
●
●
●
●
●●●
●
●
●
●
●
●
●
●
●
●
●
●
●
●
●
●
●
●
●
●
●
●
●
●
●●
●
●
●
●
●
●
●
●
●
●
●
●
●●
●
●
●
●
●
●
●
●
●
●
●
●
●
●
●
●●
●
●●
●
● ●
●
●
●
●●
●
●
●●
●
●
●
●●●
●
●
●
●
●
●
●
●
●
●
●
●
●
●●●
●
●●●●●
●
●
●
●
●
●
●
●●
●
●
●
●
●
●
●
●
●
●
●
●
●
●
●
●
●
●
●
●
●●
●
●●
●
●
●
●
●
●
●
●
●
●
●
●●
●
●
●
●
●
●
●
●
●
●●
●
●●
●
●●●●●●
●
●
●
●
●
●
●
●
●
●●
●
●
●
●
●
●
●
●
●
●
●
●
●
●
●
●
●
●
●●●
●
●
●
●
●
●
●●●
●
●●●
●
●●
●
●
●
●
●
●
●●●●
●
●
●
●
●
●
●
●
●
●●
●
●
●
●
●
●
●
●
●
●●
●
●
●
●
●
●
●
●
●
●●●
●
●
●
●
●
●
●
●
●●
●
●
●
●
●
●
●●
●
●
●
●
●●●●
●
●
●
●
●
●●
●
●●●●
●
●
●
●
●
●
●
●
●
●
●
●
●
●●
●
●
●
●
●
●
●●
●
●
●●●
●
●
●●●
●
●
●
●
●
●
●
●
●
●
●
●
●●
●
●
●
●●
●
●
●
●
●
●
●●
●
●
●
●
●
●
●●
●
●
●
●
●
●
●
●
●
●
●●●
●
●
●
●
●
●
●
●●
●
●
●
●●●●
●
●
●
●●
●
●
●
●
●
●
●
●
●
●
●
●
●
●
●
●
●
●
●
●
●
●
●
●
●
●
●
●
●
●
●
●
●
●
●
●
●
●
●
●
●
●●●
●
●
●
●
●
●
●
●
●
●
●
●
●
●
●
●
●
●
●
●
●
●●
●
●
●
●
●
●
●
●
●
●
●
●
●●●●●
●
●
●
●
●
●●●
●
●●●●●
●
●
●
●
●
●
●
●
●
●●●●
●
●
●
●
●●
●
●
●
●
●
●
●
●
●●●●
●
●
●
●
●
●●
●
●
●
●
●
●
●
●
●
●
●
●
●
●
●●
●
●
●
●
●
●
●
●
●
●
●
●
●
●
●●●
●
●
●●●●
●
●
●●
●
●
●
●
●
●
●
●
●
●
●
●
●
●
●
●
●
●
●
●
●
●
●
●
●
●●
●
●
●
●●●●
●
●
●
●
●
●
●
●
●
●
●
●
●
●
●
●
●
●
●
●
●●
●
●
●
●
●
●
●
●
●
●
●
●●
●
●
●
●
●
●
●
●
●
●
●
●
●
●
●
●
●
●
●
●
●
●
●
●
●
●
●
●
●
●
●
●
●
●
●
●
●
●
●
●
●
●
●
●
●
●
●
●
●
●
●
●●●
●
●
●
●
●
●
●
●●●
●
●
●
●
●
●●
●
●
●
●●
●
●
●
●●
●
●
●
●
●
●●
●
●
●
●●
●
●
●
●
●
●●●●
●
●
●
●
●
●
●●
●
●●●
●
●
●
●
●
●
●
●
●●
●
●●●
●
●
●
●
●
●
●
●
●
●●
●
●
●
●
●
●
●
●
●
●
●
●●
●
●
●
●
●
●●●
●
●
●
●
●
●
●●●
●
●
●
●
●
●
●
●
●
●
●
●
●
●
●●
●
●
●
●
●
●
●
●
●
●
●
●
●
●
●
●●
●
●
●
●
●
●
●
●
●
●
●
●
●
●
●●
●
●
●
●
●
●
●
●●
●
●
●
●
●
●
●
●
●
●
●
●
●
●
●
●
●
●
●
●
●
●
●●
●
●
●
●
●
●
●
●
●
●
●
●●
●
●
●
●
●
●
●
●
●
●
●
●
●
●
●
●
●
●
●
●
●
●
●
●
●
●
●
●
●
●
●●
●
●
●
●
●
●
●
●
●●
●
●
●
●
●
●
●
●●
●
●
●
●
●
●
●
●
●
●
●
●
●
●
●
●
●
●
●
●
●
●●
●
●
●
●
●
●
●
●
●
●
●●
●
●
●
●
●
●●
●
●
●●
●
●
●●●●
●
●●
●
●
●
●
●
●
●
●
●
●●
●
●●●
●
●
●
●
●
●
●
●
●
●
●●
●
●
●
●
●
●
●
●
●
●
●
●
●●
●
●
●●
●
●
●
●
●
●
●
●●●●●●●
●
●
●
●●●
●
●
●
●
●
●
●
●
●
●
●
●
●
●
●
●●
●
●
●
●
● ●
●
●
●
●
●●
●
●
●
●
●●
●
●●●●
●
●
●
●
●●
●
●
●
●
●
●
●
●
●●
●
●
●
●
●
●
●
●
●
●
●
●
●
●
●
●
●●
●
●
●
●
●
●
●
●
●
●
●
●
●
●
●
●
●
●
●
●
●
●
●
●
●
●●
●
●
●
●
●●
●
●
●
●
●
●
●
●
●
●
●
●
●
●
●
●
●
●
●
●
●
●
●●
●
●
●
●
●
●
●
●
●●●●
●
●
●
●
●
●
●
●
●
●
●
●
●
●
●
●
●
●
●
●
●
●
●
●
●
●
●
●
●
●
●
●
●
●●
●
●
●
●
●
●
●
●
●
●
●
●
●
●
●
●
●
●●●
●
●
●
●
●
●
●●●●
●
●
●
●
●
●
●
●
●
●
●
●
●
●●
●
●
●
●
●
●
●
●
●
●
●
●●
●
●
●
●●●
●
●●●
●
●
●
●
●
●
●
●
●
●
●
●
●
●
●
●
●
●
●●
●
●
●
●
●
●
●
●●
●
●
●●●
●
●
●
●
●●●
●
●●
●
●
●
●
●
●
●●
●
●
●
●●
●
●
●
●
●
●●●●●●
●
●
●
●
●
●
●
●
●
●
●
●
●
●
●●●●
●
●
●
●
●
●
●●
●
●
●
●
●
●●
●
●
●
●
●
●
●
●
●
●
●
●
●
●
●
●
●
●
●
●
●
●
●●
●
●
●
●●
●
●
●
●
●
●
●
●
●
●
●
●
●
●
●
●
●
●●
●
●
●
●
●
●
●
●
●
●
●●
●
●
●
●
●
●
●
●
●
●●
●
●
●●
●
●
●●
●
●
●
●
●
●
●
●
●
●
●
●
●
●
●
●
●●●●●●●
●
●
●
●
●
●●●●●
●
●
●
●
●
●
●
●
●
●
●
●
●
●
●
●
●
●●
●
●●●
●
●
●
●
●
●●●●
●
●
●
●
●
●
●
●
●
●●
●
●●
●
●
●●●● ●●
●
●●
●
●
●
●
●
●
●
●●
●
●
●
●
●
●
●
●
●
●●
●
●
●
●
●●●
●
●
●
●
●
●
●
●
●
●
●
●
●
●●
●
●
●●
●
●
●
●
●
●
●
●
●
●
●●
●
●
●
●
●
●●
●
●
●
● ●
●
●
●
●
●
●
●
●●
●
●
●
●
●
●
●
●
●
●
●
●
●●●
●
●
●
●
●
●
●
●
●
●
●
●
●
●
●
●
●
●
●
●●●
●
●
●
●
●
●
●
●
●
●
●
●
●
●
●
●
●
●●●
●
●
●
●
●
●
●
●
●●
●
●
●
●
●
●
●
●
●
●
●
●
●
●
●
●
●
●
●
●
●
●
●
●
●●
●
●
●
●
●
●
●
●
●
●
●
●
●
●
●
●
●●
●
●
●
●
●●●
●
●
●
●
●
●
●●●
●
●●●
●
●
●
●
●●
●
●
●
●
●
●
●●●
●
●
●
●
●
●
●
●
●
●
●
●●●
●
●
●
●
●
●
●
●
●
●
●
●
●
●
●●
●
●
●
●
●
●
●●
●
●●
●
●●●●
●
●●
●
●
●●
●
●
●
●
●
●
●
●
●
●
●
●
●
●
●
●
●
●
●
●
●
●
●
●
●
●
●
●
●
●●●
●
●
●
●
●
●
●
●
●●
●
●
●
●
●
●
●
●
●
●
●●●
●
●
●
●
●
●
●
●
●
●
●
●
●
●
●
●●
●
●
●
●
●
●
●
●
●
●
●
●
●
●
●
●
●
●
●
●
●
●
●
●
●
●●
●●
●
●
●
●
●
●
●●
●
●
●
●●
●
●
●
●●
●
●
●
●
●
●
●
●
●
●
●
●
●
●
●
●
●
●
●
●
●
●
●●
●
●
●
●
●
●
●
●
●
●
●
●
●
●●●
●
●
●
●
●
●
●
●
●
●●
●
●●●
●
●
●
●
●
●
●●
●
●
●
●
●
●
●●
●
●
●
●
●
●
●
●
●
●
●
●
●
●
●
●
●
●
●
●
●
●
●
●
●
●
●
●
●
●
●
●
●
●
●●
●
●
●
●
●
●●●
●
●
●
●
●
●●
●
●●●
●
●
●
●
●
●
●●
●
●
●●●●
●
●
●
●
●
●
●
●
●
●
●
●●●
●
●●
●
●
●
●
●
●
●
●
●
●
●
●
●●●
●
●
●
●
●
●
●
●
●
●
●
●
●
●
●
●
●
●
●
●
●●
●
●
●
●
●
●
●
●
●●
●
●
●●
●
●●
●
●
●
●
●
●
●
●
●
●
●●●
●
●
●
●
●
●
●
●●
●
●
●●●
●
●
●
●
●
●
●
●
●
●
●
●
●
●
●
●
●
●
● ●●●
●
●
●
●●
●
●
●
●
●
●
●
● ●
●
●
●
●
●
●
●
●
●
●
●
●
●
●
●
●
●
●
●
●
●
●
●
●
●
●
●
●
●
●
●
●
●
●
●
●
●
●
●
●
●
●
●
●
●●
●
●
●
●●
●
●
●
●
●
●
●●●●●
●
●●●
●
●
●
●
●
●
●
●
●
●●
●
●
●
●
●●
●
●●●●●
●
●
●
●
●
●
●
●
●
●
●
●
●
●
●
●
●
●
●
●
●●
●
●
●
●
●
●
●
●●
●
●
●
●
●
●
●
●
●
●
●
●
●
●
●
●
●●
●
●
●●●●
●
●
●
●
●
●
●
●
●
●
●
●
●
●
●
●
●
●
●
●
●
●
●
●●●
●
●
●
●
●
●
●
●
●
●
●●
●
●
●
●
●
●
●●
●
●
●
●
●
●
●
●
●
●
●
●●●
●
●
●
●● ●
●
●
●
●
●
●●
●
●
●
●●
●
●
●
●
●
●
●●
●
●
●
●
●
●
●
●
●
●
●●
●
●
●
●
●
●
●
●●
●
●
●
●
●
●
●
●
●
●
●
●
●●
●
●
●
●
●
●
●
●
●
●●
●
●
●
●
●
●
●
●
●
●
●
●
●
●
●●
●
●
●
●
●
●
●
●
●
●
●
●
●
●●
●
●
●●
●
●
●
●
●
●
●●
●
●
●
●
●
●●
●
●
●
●
●●●●
●
●
●
●
●
●
●
●
●
●
●
●
●
●
●
●
●
●
●
●
●●
●
●
●
●
●
●
●
●
●
●
●
●
●
●
●
●
●
●
●
●●●
●
●
●
●
●●●
●
●
●
●
●
●
●
●
●
●
●
●
●
●
●
●
●
●
●
●
●
●●
●
●
●●
●
●
●
●
●
●●
●
●
●●●
●
●
●
●
●
●
●
●●
●
●
●
●
●
●
●
●
●
●
●●
●
●
●
●
●
●
●
●
●
●
●
●
●●
●
●
●
●
●
●
●
●
●
●
●
●
●
●
●
●
●
●
●
●
●
●
●
●
●
●
●
●
●
●
●
●
●
●
●
●
●
●
●
●●●●
●
●
●
●●
●
●
●
●
●●●
●
●
●●●
●
●
●
●
●●
●
●●
●
●●
●
●●
●
●
●
●
●
●
●
●
●
●
●●
●
●●
●
●
●●●●
●
●
●
●●
●
●
●
●
●
●
●
●
●
●
●
●
●
●
●
●
●
●
●
●
●
●
●
●
●
●
●
●
●
●●●●●
●
●●●●●●
●
●●●●
●
●
●
●
●
●
●
●
●
●
●
●
●
●
●
●
●●
●
●
●
●
●
●
●
●
●
●●
●
●
●
●
●
●●●●
●
●
●
●
●
●
●
●
●
●
●
●
●
●
●
●
●
●●
●
●
●
●●
●
●
●
●
●
●
●
●
●
●
●
●
●
●
●
●
●
●
●
●
●
●
●
●
●
●
●●
●
●●
●
●
●
●
●
●
●
●
●
●
●
●●
●
●
●
●
●
●
●
●
●
●
●
●
●
●
●
●
●
●
●
●
●
●
●
●
●
●
●
●
●
●
●
●
●
●●●●
●
●
●
●
●
●
●
●
●
●
●
●
●
●
●
●
●
●
●
●
●
●
●●
●
●●
●
●
●
●
●
●
●
●●
●
●
●
●
●
●●
●
●●
●
●
●●
●
●
●
●
●
●
●
●
●
●
●
●
●
●
●
●
●
●
●●
●
●
●
●
●
●
●
●
●
●
●
●
●
●
●
●●
●
●
●
●
●
●
●
●
●
●
●
●
●●
●
●
●
●
●
●
●
●
●
●●
●
●
●
●
●
●
●
●
●●●●●
●
●
●
●
●
●
●
●
●●●
●
●
●
●
●
●
●
●
●●
●
●
●
●
●
●
●
●
●
●
●
●
●●
●
●
●
●
●
●●
●
●
●
●●●
●
●
●
●
●
●
●
●
●●
●
●
●
●
●
●●
●
●
●
●●●●●
●
●
●●
●
●●
●
●●
●
●
●
●
●●●
●
●
●
●
●
●●
●
●
●
●
●
●
●
●●
●
●●
●
●
●
●
●
●
●
●
●●●●●
●
●
●
●●
●
●
●
●
●
●
●
●
●
●
●●
●
●
●
●
●
●
●
●
●
●●
●
●●
●
●
●
●
●●
●
●
●
●
●
●
●
●
●
●
●
●
●
●
●
●
●
●●●
●
●
●●
●
●
●●
●
●
●
●
●
●
●
●
●
●
●
●
●
●
●
●
●
●
●
●●●
●
●
●
●
●
●
●
●
●
●
●
●●
●
●
●
●
●
●
●
●
●
●
●
●
●
●
●
●
●
●●
●
●
●
●●
●
●
●
●
●
●
●
●
●
●
●
●
●
●
●
●
●
●
●
●
●
●
●
●
●
●
●
●
●
●
●
●
●
●●
●
●
●
●
●
●
●
●●
●
●
●
●●●●
●
●
●
●
●
●
●
●
●●●
●
●
●●
●
●
●
●
●
●
●
●
●●●
●
●●
●
●
●
●●
●
●
●
●
●
●
●
●
●
●●
●
●
●
●
●
●
●
●
●
●
●
●
●●●
●
●
●
●
●
●
●
●
●
●●
●
●
●
●
●
●
●
●●
●
●
●
●
●
●
●
●
●
●
●
●
●
●
●
●
●
●
●
●
●
●
●
●
●
●
●
● ●
●
●
●
●
●●●
●
●
●●
●
●
●
●
●
●
●
●
●
●
●
●
●
●
●
●
●
●
●
●
●
●
●
●
●
●
●
●
●
●
●
●
●●
●
●
●
●
●
●
●
●
●
●●●
●
●
●
●
●
●●●
●
●
●
●
●
●
●
●●
●
●●
●
●
●
●
●●
●
●
●
●●
●
●
●●●●
●
●
●
●●●
●
●
●
●
●
●
●
●
●
●
●
●
●
●
●
●
●
●
●
●
●
●
●
●
●
●
●
●
●
●
●
●
●
●
●
●
●
●●
●
●
●
●
●
●
●
●
●
●
●
●
●
●
●
●
●
●
●
●●
●
●
●●●
●
●
●
●
●
●
●
●
●
●●
●
●●
●
●
●●
●
●
●
●
●
●●●
●
●
●
●●
●
●
●
●
●
●
●
●
● ●●●
●
●
●●
●
●
●
●
●
●
●
●●
●
●
●
●
●
●
●
●
●
●
●
●
●
●
●
●
●
●
●
●
●
●
●
●
●
●
●
●
●
●
●
●●
●
●
●●
●
●
●
●
●
●
●
●
●
●
●
●
●●
●
●
●
●●
●
●●
●
●
●
●
●
●
●
●
●
●
●●
●
●
●
●●
●
●
●
●
●●●
●
●
●
●●●
●
●
●
●●
●
●
●
●
●●
●
●
●
●
●
●
●
●
●
●
●
●●
●
●
●
●
●
●
●
●
●
●
●
●
●
●
●
●
●
●
●
●
●
●
●
●
●
●
●
●
●
●
●
●
●
●●●●
●
●
●
●
●●
●
●
●
●●
●
●
●
●
●
●
●
●
●
●
●
●
●
●
●
●
●
●
●
●
●
●
●
●
●
●
●
●
●
●
●
●
●
●
●
●
●
●
●
●
●
●
●
●
●
●
●
●
●
●
●
●
●
●
●
●
●
●●
●
●
●●●
●
●
●
●●
●
●●●
●
●
●
●
●
●
●
●
●
●
●
●
●
●
●
●
●
●
●
●
●
●
●
●
●
●
●
●
●
●
●
●
●
●
●
●
●
●
●
●
●●●
●
●
●
●
●
●
●
●
●
●
●●
●
●
●●
●
●
●
●
●
●
●
●
●
●
●
●
●
●
●
●
●
●
●
●
●
●
●
●
●
●
●
●
●
●
●
●
●
●
●
●
●
●
●
●
●
●
●
●
●
●
●
●
●
●
●●
●
●
●
●
●
●
●
●●●
●
●
●
●
●
●
●
●
●●●●
●
●
●
●
●●
●
●
●
●
●●
●
●
●
●●●●●
●
●
●
●
●●●
●
●
●
●
●
●
●
●
●
●
●
●
●
●
●
●
●
●
●
●
●
●
●●
●
●
●
●
●
●
●
●
●
●
●
●
●
●
●
●
●
●
●
●
●
●
●
●●●
●
●
●
●
●
●
●
●
●
●
●
●●
●
●
●
●
●●
●
●●●
●
●
●
●
●
●●
●
●
●
●
●
●●
●
●
●
●
●
●
●●●
●
●
●
●
●
●
●
●
●
●
●
●
●●
●
●
●
●●
●
●
●
●
●
●
●
●
●
●●
●
●
●
●
●●
●
●
●
●
●
●●
●
●
●
●
●
●
●
●●
●
●
●
●
●
●
●●●
●
●
●
●
●●
●
●
●
●
●
●
●
●
●●
●
●
●
●
●
●
●
●
●
●
●
●
●
●
●
●
●
●
●
●
●
●
●
●
●
●
●
●
●
●
●
●●
●
●
●
●
●●● ●
●
●
●
●
●
●
●
●
●
●
●
●
●
●
●
●
●
●
●
●
●●
●
●
●
●
●
●
●
●
●
●
●
●
●
●
●
●
●
●
●
●
●
●
●
●●●●
●
●
●●●●
●
●
●
●
●
●●●●●●●
●
●
●
●●●
●
●
●
●
●
●
●
●
●
●
●
●
●
●
●
●
●
●
●
●
●
●
●
●
●
●
●●
●
●
●
●
●
●
●
●
●
●●
●
●
●
●
●
●
●●●
●
●
●
●
●
●
●
●
●
●
●
●
●
●
●
●
●
●
●
●
●●
●
●
●●
●
●
●●●
●
●
●
●
●
●
●
●
●
●
●
●
●
●
●
●
●
●
●
●
●
●
●
●
●
●
●
●
●
●
●
●
●
●
●
●
●
●
●●
●
●●
●
●
●
●●
●
●
●
●
●
●
●
●
●
●
●●●●●●●
●
●
●
●
●
●
●
●
●
●
●
●
●
●
●
●
●
●
●
●
●●
●
●
●●●
●
●
●
●
●
●
●●
●
●
●
●
●
●
●
●
●
●
●
●
●
●
●
●
●
●
●
●
●
●
●
●
●
●
●
●
●
●
●
●●●●
●
●●
●
●
●
●
●
●
●
●
●
●●
●
●
●
●
●●
●
●
●
●
●
●
●●●●●
●
●
●
●
●
●
●
●
●
●
●
●
●
●
●
●
●
●
●
●
●●
●
●
●
●
●●●●●●●●
●
●
●
●
●
●●
●
●
●
●
●
●●
●
●
●
●
●
●
●
●
●
●
●
●
●
●
●
●
●
●
●
●●●
●
●
●
●
●
●
●
●
●
●
●
●
●
●
●
●
●
●●●
●
●
●
●●
●
●
●
●
●
●
●
●●
●
●
●
●
●
●
●
●
●
●
●
●
●
●
●
●
●
●
●
●
●●●●●●
●
●
●
●
●
●
●
●
●
●
●●
●
●●
●
●
●
●
●
●
●
●
●
●
●
●
●
●
●
●●●
●
●
●
●
●●
●
●
●
●
●
●
●
●
●
●
●
●
●
●●●
●
●
●
●
●
●
●
●
●
●
●
●●●
●
●
●
●
●
●
●
●
●
●
●
●
●
●
●
●
●
●●
●
●
●
●
●
●
●
●●●
●
●
●
●
●
●
●
●●
●
●●
●
●
●
●
●●
●
●
●
●
●
●
●
●●
●
●
●
●
●
●●●
●
●
●
●
●●
●
●
●
●
●
●
●●●●●●
●
●
●
●●
●
●
●
●
●
●
●
●
●
●●
●
●
●
●
●
●
●
●
●
●
●
●●●●
●
●
●●●
●
●
●
●●●●
●
●
●
●
●
●
●
●
●
●
●
●
●
●
●
●
●
●
●
●
●
●
●
●●●
●
●
●
●
●
●
●
●
●●●
●
●
●
●
●
●
●●
●
●
●
●
●
●
●
●
●
●
●
●
●
●
●
●●
●
●
●●
●
●
●
●
●
●
●
●
●
●
●
●
●
●
●
●
●
●
●
●
●
●
●
●●
●
●
●
●
●
●
●
●
●
●
●
●
●
●
●●
●
●
●
●
●
●
●
●
●
●
●
●
●
●
●
●
●
●
●●
●
●
●
●
●●●● ●
●
●
●
●
●
●
●
●
●
●
●
●
●
●
●●
●
●
●
●
●
●
●
●
●●
●
●
●●
●
●
●
●●
●
●
●
●
●
●●●●
●
●
●●
●
●
●
●
●
●●●●
●
●
●
●
●
●
●
●
●
●
●●●
●
●●
●
●
●
●
●
●
●
●
●
●
●
●
●
●
●
●●
●
●
●
●●
●
●●●
●
●
●
●
●
●
●●●●
●
●
●
●
●●●
●
●●
●
●
●
●
●●
●
●
●
●
●
●
●
●
●
●
●
●
●
●
●
●●●●
●
●
●●
●
●
●
●
●●●
●
●
●
●
●
●
●
●
●
●●●
●
●
●
●
●
●
●
●
●
●
●
●
●
●
●
●
●
●
●
●
●●
●
●
●
●
●●●●
●
●
●
●
●
●
●
●●
●
●
●
●
●●
●
●
●●●●●●
●
●●
●
●
●
●
●
●
●●●●
●
●
●
●
●
●
●
●
●
●
● ●
●
●
●●●
●
●
●
●●
●
●●
●
●
●
●
●
●
●
●
●
●
●
●
●
●
●
●
●
●
●
●
●●
●
●
●
●
●
●
●
●
●
●
●
●
●
●●●
●
●●●
●
●
●
●
●
●
●●●●
●
●
●
●
●
●
●
●
●
●
●
●
●
●
●
●●
●
●
●
●
●●
●
●
●
●
●●●
●
●
●●●● ●
●
●
●
●
●
●
●
●
●
●
●
●
●
●●●
●
●
●
●
●●●●
●
●
●
●
●
●●●●
●
●
●
●
●
●
●
●
●
●
●
●
●
●
●
●
●
●●
●
●
●
●
●
●
●
●
●
●
●
●
●
●
●
●
●
●
●
●●●●
●
●
●●●
●
●
●
●
●●
●
●
●●●●●●●
●
●
●
●
●●●
●
●
●
●
●
●●
●
●
●
●
●
●
●
●
●●
●
●
●●
●
●●●
●
●
●
●
●
●
●
●
●
●
●●
●
●
●
●
●
●
●
●
●
●
●
●
●
●
●
●
●
●●
●
●
●
●
●
●
●
●
●●●
●
●
●
●
●
●
●
●
●●
●
●
●
●
●
●
●
●
●
●
●●●
●
●
●
●
●
●●
●
●
●
●
●
●
●
●
●
●
●
●
●
●
●
●
●
●
●
●
●●
●
●●●
●
●
● ●
●
●
●
●
●
●
●
●
●●
●
●
●
●
●
●
●
●
●●
●
●
●
●
●
●
●●
●
●
●
●
●
●
●
●
●
●●
●
●
●
●
●
●
●
●
●
●
●
●
●
●
●
●
●
●
●
●
●
●
●
●
●
●
●
●
●
●
●●
●
●
●
●
●
●
●
●
●
●
●
●
●
●●
●
●
●
●
●
●
●
●
●
●
● ●
●
●
●
●
●
●
●
●
●
●
●
●
●
●●
●
●
●
●
●
●
●
●
●
●
●
●
●
●
●
●
●
●●
●
●
●
●
●
●
●●
●
●
●
●
●
●
●
●
●
●
●
●
●●
●
●
●
●
●
●
●●
●
●
●
●
●
●
●
●
●
●
●
●
●
●
●
●
●
●
●
●●
●
●
●
●●●●●●
●
●
●
●●
●
●
●
●
●
●
●
●
●
●
●
●
●
●
●
●
●
●
●
●●●
●
●●●
●
●●
●
●
●
●
●
●
●
●
●
●
●
●
●
●
●●●●
●
●
●
●
●
●
●
●
●
●
●
●
●
●
●●
●
●
●
●
●
●
●
●
●
●
●
●
●
●●
●
●
●
●
●
●
●
●
●
●
●
●
●
●
●
●
●●
●
●●
●
●
●
●
●
●
●●
●
●
●
●
●
●
●
●
●
●●
●
●
●
●●
●
●
●
●
●
●
●
●
●
●
●
●
●●
●
●●
●
●●
●
●●
●
●
●
●
●
●
●
●
●
●
●
●
●
●
●
●
●
●
●
●
●
●
●
●
●
●
●
●
●
●
●
●
●●
●
●●
●
●
●
●
●
●
●
●
●
●
●
●
●
●
●●●
●
●
●
●
●
●
●
●
●
●
●
●
●
●
●
●
●
●
●
●
●
●
●
●
●
●
●
●●●●
●
●
●
●
●
●
●
●
●
●
●
●
●
●
●
●●
●
●
●
●●
●
●●
●
●
●
●
●●●●●●●●
●
●
●
●
●
●
●
●
●
●
●
●
●
●
●
●
●
●
●
●
●
●
●
●
●●●
●
●
●
●
●
●
●
●
●
●
●
●
●
●
●
●
●
●
●
●
●
●
●
●
●
●
●
●
●
●
●
●
●
●
●
●
●
●
●
●
●
●
●●●
●
●●
●
●
●
●
●
●
●
●
●
●
●
●
●
●
●
●
●
●
●●●
●
●●
●
●
●
●
●
●
●
●
●
●
●
●
●
●
●
●
●
●
●
●
●
●
●
●
●
●
●
●
●
●
●
●
●
●
●
●
●
●
●
●
●
●
●
●
●
●●
●
●●
●
●
●
●
●
●
●
●
●
●
●
●
●
●
●
●
●
●
●
●
●
●●●
●
●
●●●
●
●
●
●
●
●
●
●
●
●
●●
●
●
●
●
●
●
●
●
●●●
●
●
●
●
●
●
●
●
●
●
●
●
●
●
●
●
●
●
●
●●●
●
●
●
●
●
●
●
●
●
●●
●
●
●
●
●
●●
●
●
●
●
●
●
●
●
●
●●
●
●
●
●
●
●
●
●
●
●●●
●
●
●
●
●●●
●
●
●
●
●
●
●
●
●●●●●●
●
●
●
●●●
●
●●
●
●●
●
●
●
●
●
●
●
●
●
●
●
●●●
●
●
●
●
●
●
●
●
●
●●
●
●
●
●
●
●
●
●
●●
●
●
●●
●
●
●
●
●
●●
●
●
●
●
●
●
●
●
●
●
●
●
●
●
●
●
●
●
●
●
●
●
●●
●
●
●
●
●
●
●
●
●●●
●
●
●
●
●
●
●
●
●
●
●●●
●
●
●
●●●
●
●
●
●●
●
●
●
●
●
●
●
●
●
● ●
●
●
●
●
●●●
●
●
●
●●●
●
●
●
●●
●
●
●
●
●●
●
●
●●●
●
●
●
●●
●
●●
●
●
●
●
●
●
●
●●
●
●
●
●
●
●
●
●●●
●
●
●
●
●
●
●
●
●
●
●●
●
●●
●
●
●
●
●
●
●●
●
●
●
●
●
●
●
●
●
●
●
●●
●
●
●
●
●
●
●
●
●
●
●
●
●
●
●
●
●
●
●
●
●
●
●
●
●
●
●
●
●
●
●
●
●
●
●
●
●
●
●
●
●
●●●
●
●
●
●
●
●
●
●
●●
●
●
●
●
●
●
●
●●
●
●
●
●
●
●●
●
●
●
●
●●●●●
●
●
●
●
●
●
●
●
●
●●
●
●
●●●●
●
●
●
●
●●
●
●
●
●
●
●
●
●
●
●
●
●
●
●
●●
●
●
●●●
●
●
●
●
●
●
●
●
●
●
●
●
●
●
●
●
●
●
●
●
●
●
●
●
●
●
●
●
●●●
●
● ●
●
●
●
●
●
●
●
●
●
●
●
●
●
●
●
●
●
●
●●
●
●
●
●
●
●
●
●
●
●
●●
●
●
●
●
●●
●
●
●
●
●
●
●●
●
●
●
●
●
●
●
●
●
●
●
●
●●●
●
●
●
●●
●
●
●
●
●
●
●
●●●
●
●●
●
●
●
●
●
●
●
●
●
●
●●●
●
●●●●
●
●
●
●
●
●●●
●
●●●
●
●
●
●
●
●
●
●
●
●
●
●●●
●
●●
●
●
●
●
●
●
●
●
●
●
●
●
●
●
●
●
●
●
●
●
●
●
●
●
●
●
●●
●
●●●●
●
●
●
●
●
●
●
●
●
●
●●
●
●
●
●
●
●
●
●
●
●
●
●
●
●
●
●
●
●
●
●
●
●
●
●
●
●
●
●
●
●
●
●
●
●
●
●
●
●
●
●
●
●
●
●
●
●●
●
●
●
●
●
●
●
●
●
●
●
●
●
●●●
●
●
●
●●
●
●
●
●
●
●
●
●
●
●
●
●
●
●
●
●
●
●
●
●
●
●
●
●●●
●
●
●
●
●
●
●●●
●
●
●●
●
●
●
●
●
●
●
●
●
●
●
●
●
●
●
●●●
●
●
●
●
●
●
●
●
●
●
●●
●
●
●
●
●
●
●
●
●
●
●
●
●
●
●
●
●
●
●●●
●
●
●
●
●
●
●
●
●●●
●
●
●
●●●●●
●
●
●
●
●
●
●
●
●
●
●
●●●●
●
●
●
●
●
●
●
●●
●
●
●
●
●
●
●
●
●
●
●
●
●
●
●
●
●●●
●
●
●
●
●●●
●
●
●
●
●
●
●
●
●
●
●
●
●
●
●
●●●●●
●
●●●
●
●
●
●
●
●
●
●
●
●
●
●
●
●
●
●
●
●
●
●
●
●
●
●
●
●
●
●
●
●
●●
●
●
●
●
●
●
●
●
●
●
●
●
●
0 5 10 15
0 5 10 15
dcpm, liverM
dcpm, liverF
X
X
X
X
X
X
X
X
X
XXX
X
XX
X
X
X
X
X
X
X
X
X
X
XXX
X
X
X
X
X
X
X
X
XXXX
X
X
X
X
X
X
X
X
XX
X
X
XX
X
X
X
X
X
X
X
X
X
X
X
X
XXX
X
XXX
X
X
XX
X
X
X
XXXX
X
X
X
X
X
X
X
X
X
X
X
X
X
X
X
X
X
X
X
X
X
X
X
X
XX
X
X
XX
X
XXX
X
X
X
X
X
X
X
X
X
X
X
X
X
X
X
X
X
X
XX
X
X
X
X
X
X
XXXX
X
X
X
X
X
X
X
X
XX
X
X
X
XX
X
X
X
X
X
X
X
X
X
X
X
X
X
X
X
X
X
X
X
X
XXX
X
X
X
X
X
X
XX
X
X
X
XXX
X
X
X
X
X
X
XXXX
X
XX
X
X
X
X
X
XX
X
X
X
X
X
X
X
X
X
X
XXX
X
X
XX
X
X
X
X
X
X
X
X
X
XX
X
X
X
X
X
X
X
X
XX
X
X
X
X
X
XXX
X
X
X
X
X
X
XXX
X
X
X
X
X
X
X
XX
X
X
X
X
X
X
X
X
X
X
X
XXXX
X
XX
X
X
X
XXX
X
X
X
X
XX
X
X
X
XXX
X
X
X
X
X
X
X
X
X
X
X
X
X
X
X
X
XXX
X
X
X
X
X
XX
X
X
X
X
X
XXX
X
X
X
X
X
X
XXXXXX
X
X
X
XXXXX
X
X
X
X
X
X
X
X
X
X
X
X
X
X
X
X
X
X
X
X
X
X
X
X
X
X
X
XX
X
X
X
XX
X
X
XX
X
X
X
X
X
X
X
X
X
X
X
X
X
XX
X
XXXX
X
X
X
X
X
X
X
X
X
X
X
X
XX
X
XXX
X
X
X
X
X
X
X
X
X
X
X
XX
X
X
X
XXX
X
X
X
X
X
X
X
X
XX
X
X
X
XX
X
XX
X
X
X
X
X
X
X
X
X
X
X
X
X
X
XXX
X
X
X
X
X
X
X
X
X
X
X
X
X
X
X
XX
X
XX
X
X
X
X
X
X
X
X
X
X
X
X
X
X
X
X
X
XX
X
X
X
X
X
XX
X
X
XX
X
X
X
X
X
X
X
X
X
X
XX
X
X
X
X
X
X
X
X
X
X
X
X
X
X
X
X
X
X
X
X
XX
X
X
X
X
X
X
XX
X
X
XX
X
XX
X
XX
X
X
X
X
X
X
X
XX
X
XX
X
X
X
X
X
X
X
X
X
XX
X
X
X
X
X
X
X
X
XXX
X
X
X
X
X
X
X
X
X
X
XXX
X
X
X
X
X
X
X
X
X
XX
X
X
X
XX
X
X
X
X
X
X
XX
X
X
X
X
X
X
X
X
X
X
X
XX
X
X
XXX
X
X
XXX
X
X
X
X
X
X
X
X
X
X
X
X
X
X
X
X
X
X
X
X
X
X
X
XX
X
X
X
X
X
X
X
XX
X
X
X
XXXXX
X
XX
X
X
X
X
X
X
X
X
X
X
X
XX
X
X
X
X
X
X
X
XX
X
XXX
X
X
XX
X
X
X
X
X
X
X
X
X
X
XX
X
X
X
X
X
X
X
X
X
X
XX
X
X
XX
X
X
XX
X
X
XXXX
X
X
X
X
X
XX
X
X
X
X
X
X
X
X
XX
X
X
X
X
XXXXX
X
X
X
X
X
X
X
X
XX
X
X
X
X
X
X
XXX
X
XXX
X
X
XX
X
X
X
X
X
X
X
X
X
X
X
X
X
X
X
XX
X
X
XXX
X
X
XXXXX
X
●
●
●
●
●
●
●
●
●
●
●
●
●
●
●
●
●
●
●
●
●
●
●
●●
●
●
●
●●
●
●
●
●
●
●
●
●
●
●
●
●
●
●
●
●
●
●
●
●
●
●
●
●
●
●
●
●
●
●
●
●
●
●
●
●
●
●
●
●
●
●
●
●
●
●
●
●
●
●
●
●
●
●
●
●
●
●
●
●
●
●
●
●
●
●
●
●
●
●
●
●
●
●
●
●
●●
●
●
●
●
●
●
●
●
●
●
●
●
●●
●
●
●
●
●
●
●
●
●
●
●
●
●
●
●
●
●
●
●
●
●
●
●
●
●
●
●
●
●
●
●
●
●
●
●
●
●
●
●
●
●
●
●
●
●
●
●
●
●
●
●
●
●
●
●
●
●
●
●
●
●
●
●
●
●
●
●
●
●
●
●
●
●
●
●
●
●
●
●
●
●
●
●
●
●
●
●
●
●
●
●
●
●
●
●
●
●
●
●
●
●
●
●
●
●
●
●
●
●
●
●
●
●
●
●
●
●
●
●
●
●
●
●
●
●
●
●
●
●
●
●
●
●
●
●
●
●●
●
●
●
●
●
●
●
●
●
●
●
●●
●
●
●
●
●
●
●
●
●
●
●
●
●
●
●
●
●
●
●
●
●
●●
●
●
●
●
●
●
●
●
●
●
●
●
●
●
●
●
●
●
●
●
●
●
●
●
●
●
●
●
●●
●
●
●
●
●
●
●
●
●
●
●
●
●
●
●
●
●●
●
●
●
●
●
●●
●
●
●
●
●
●
●
●
●
●
●
●
●
●
●
●
●
●
●
●
●
●
●
●
●
●
●
●
●
●
●
●
●
●
●●
●
●
●
●
●
●
●●
●
●
●
●●●
●
●
●
●
●
●
●●●
●
●
●
●
●
●
●
●
●
●●
●
●
●
●
●
●
●
●
●
●
●
●
●
●
●
●
●
●
●
●
●
●
●
●●●
●
●
●
●
●
●●
●
●
●
●
●
●
●
●
●
●
●
●
●
●
●
●
●
●
●
●●
●
●
●
●
●
YYYYYYYYYYYYYYYYYYYYYYYYYYYYYYYYYYYYYYYYYY
Y
YYYYYYYYYYYYYYYYYYYYYYYYYYYYYYYYYYYYYYYYYYYYYYY
Y
YY
Y
YYYYYYYYYYYYYYYY
Y
YYYYYYYYY
Wetterbom et al. Genome Biology 2010, 11:R78
/>Page 8 of 16
vicinity of a RefSeq gene (that is, intronic or within 10 kb
upstream or downstream; see Figure S2a,b in Additional
file 1 for genomic distribution of novel TRs). This is an
appreciable enrichment since the extended RefSeq
regions covered only 52% of the genome. A proportion of
these novel TRs probably represent novel exons or UTRs.
Considering the sequencing bias, we expected to find
mainly 3' UTRs and only to a lesser extent 5' UTRs.
Initially, we examined the length of novel TRs and
found it to vary between 50 and 2,500 bp, with a median
of 142 bp for brain and 151 bp for liver. The length distri-
bution was plotted together with the lengths of RefSeq
exons (Figure S3 in Additional file 1). The peak around
the TR mean coincided with a similar peak in the length
distribution for RefSeq exons, and the extended tail of
longer novel TRs resembled the distribution of terminal
exons (including annotated 3' UTRs). This comparison
suggested that our collection of novel TRs was composed
of a mixture of exons and 3' UTRs.
To further explore the genomic arrangement of novel
TRs and to what extent they were connected to known
gene annotations, we used the SplitSeek program [32] to
perform a de novo search for splice junctions. Since the
SplitSeek algorithm is not applicable for the shorter read
lengths, we used only the 50-bp reads from the brainF
and liverF samples in this analysis (see Materials and
methods for details). A total of 1,904 splice junctions
were predicted in the brainF sample and 4,279 in liverF,
with as many as 90% of them mapping exactly to an exon-
exon boundary in a known gene. The remaining 10% are
the most interesting, since they include previously unde-
tected splicing events connecting novel TRs to each other
and to known gene models.
Having identified potential novel TRs and splice junc-
tions, we attempted to combine these two datasets to find
examples of novel exons and UTRs that were linked to a
known gene model by a splice junction. We did this by
intersecting the novel TRs with our predicted splice junc-
tion coordinates, and this resulted in a number of inter-
esting candidates that we validated further with RT-PCR.
Figure S4 in Additional file 1 illustrates a novel putative
exon within the KNG1 gene. We predicted splicing from a
novel exon to a neighboring downstream exon and the
presence of this transcript was validated in both brain
Figure 7 Example of an intergenic novel transcript that was absent in the human genome. (a) A view from the UCSC Genome Browser showing
an intergenic region on chromosome 1. Two novel TRs are shown as blue boxes and the position of primers and the experimentally validated frag-
ments are indicated with lines. (b) Results of the experimental validation with RT-PCR. The first two gels show fragments covering the two novel TRs
and the third gel is a fragment spanning the junction between the novel TRs. The first lane on the gels is a 100-bp ladder (molecular weight marker,
MWM), then follows the brain sample with (+RT) and without (-RT) reverse transcriptase, followed by the same set of experiments in the liver sample.
novel region 1
novel region 1
novel region 2
novel region 2
novel region 3
novel region 3
MWM
MWM
MWM
TR+niarB
TR+niarB
TR+niarB
TR-niarB
TR-
niarB
TR-niarB
TR+r
eviL
TR+reviL
TR+reviL
TR-reviL
TR-rev
iL
TR-reviL
(a)
(b)
Wetterbom et al. Genome Biology 2010, 11:R78
/>Page 9 of 16
and liver samples. In addition, we validated novel exons
in MN1 (Figure S5 in Additional file 1), NDUFA7 (Figure
S6 in Additional file 1) and PRDM5 (Figure S7 in Addi-
tional file 1). We also found examples of novel 3' UTRs, as
in the UROS gene (Figure 8) where we observed two TRs
downstream of the annotated 3' UTR. One of the TRs
was predicted to be novel and the other was supported by
mRNA/EST data, although it was not included in the pre-
vious gene model. We were able to validate the expression
of both TRs, a connection between them as well as join-
ing the TRs to the last coding exon of the gene (without
including the annotated 3' UTR). Our results demon-
strated a novel 3' UTR in the UROS gene, which was
expressed in both brain and liver.
Other types of novel transcripts
In addition to new exons and UTRs, the novel TRs may
also stem from other types of transcripts. Poly(A)-
enriched RNA is known to contain partially spliced
mRNAs and this might explain a proportion of the
intronic novel TRs that we observed. Furthermore, abun-
dant transcription of different types of ncRNAs has been
reported in eukaryotic genomes [33-36] and to assess this
we compared our data to UCSC [29,30] annotations of
'RNA genes' and 'small nucleolar RNAs (snoRNAs)/
microRNAs'. This yielded only a handful of ncRNAs (38
in brain and 23 in liver) overlapping with novel TRs.
Another type of ncRNA that has been reported both in
human [19] and mouse [18] is expressed repeats.
Although a large proportion of primate genomes is com-
posed of repeated sequences, these regions have not been
Figure 8 Example of a novel 3' UTR in the UROS gene. (a) The structure of the UROS gene from the UCSC Genome Browser. At the top is a schematic
view of the RefSeq gene with exons as black boxes and introns as connective lines. Below are two tracks with predicted splicing events, then follows
a set of tracks with detected TRs in the two tissues and at the bottom is a representation of the primers and the experimentally validated junctions
between TRs. (b) The experimental validation with RT-PCR. The two TRs representing the novel 3' UTR are on the first two gels and a positive control
of the main transcript is on the third gel. The first lane on the gels is 100 bp ladder (molecular weight marker, MWM), then follows the brain sample
with (+RT) and without (-RT) reverse transcriptase, followed by the same set of experiments in the liver sample.
(a)
(b)
controlnovel region 1
novel region 2
novel region 1
novel region 2
control
MWM
MWM
MWM
Brain+RT
Brain+RT
Brain+RT
Brain-RT
Brain-RT
Brain-RT
Liver+RT
Liver+RT
Liver+RT
Liver-RT
Liver-RT
Liver-RT
Wetterbom et al. Genome Biology 2010, 11:R78
/>Page 10 of 16
described by previous transcriptome sequencing efforts
in chimpanzee. By comparing with the RepeatMasker
track from the UCSC Genome Browser [29,30] (requiring
a 20% overlap), we concluded that approximately half of
the novel TRs (9,193 in brain and 3,441 in liver) were
derived from repeated elements. The vast majority
appeared to be derived from retrotransposons such as
long interspersed nuclear elements (LINEs), short inter-
spersed nuclear elements (SINEs) and long terminal
repeats (LTRs) (summarized in Table 3). Detection of
expressed regions relies on mapping the sequence reads
to unique positions in the genome. Thus, it is inherently
harder to analyze repeated regions and the numbers in
Table 3 are likely an underestimate.
Experimental validation of novel transcribed regions
We used reverse transcriptase PCR (RT-PCR) to verify
the existence of novel TRs in seven example regions,
including five genes, one intergenic region and a putative
novel protein-coding gene. For novel TRs adjacent to
genes, we also designed primers to amplify a fragment
from the previously annotated gene, to act as a positive
control and as a baseline for comparing the expression
levels of novel TRs. The examples chosen for validation
were selected to represent both intergenic and genic TRs.
The expression levels of the validated TRs, as determined
from the sequencing data, varied from just above the
threshold to highly expressed regions. We were able to
validate all the five novel TRs within genes, as well as the
intergenic TR and for the putative novel gene we were
able to validate the majority of predicted exons and junc-
tions. The high success rate indicated that the threshold
for expression was very conservative and that there exists
additional RNAs that are not captured by our analyses.
In general, we observed that novel TRs had lower
expression levels than the positive controls from the same
gene (as judged from the intensity of the fragment on the
gel). This agrees well with the results presented in Figure
4b where novel TRs have lower expression levels than
annotated TRs in the same region. Furthermore, we
noted that in NDUFA7 (Figure S6 in Additional file 1),
PRDM5 (Figure S7 in Additional file 1) and UROS (Figure
8 in Additional file 1) the expression level of the control
was similar in brain and liver, whereas the expression lev-
els of the novel TRs differed between the two tissues.
These results support the notion that novel TRs are tissue
specific to a larger extent than transcripts in general.
Some novel TRs were only detected in a single tissue,
based on the threshold used to define transcription, but
the region was amplified with RT-PCR in both tissues.
One such example was the KNG1 gene, where the novel
TR was initially only predicted in liver but we were able to
amplify the region also in brain (although with a signifi-
cantly weaker band on the gel). This further suggests that
not all low abundance TRs are captured with our thresh-
old for transcription.
Characterization of a novel chimpanzee gene
Finally, we focused our attention on a small region on
chromosome 16, located in an intron of the OTOA gene,
which showed high enrichment of TRs and splice junc-
tions both in frontal cortex and liver. We noted that some
of the neighboring TRs were interconnected by predicted
splice junction in a way that resembled the structure of a
multi-exon gene. Moreover, we found that many of the
TRs coincided with exons in N-SCAN gene predictions
[37], and taken together this information suggested to us
that protein-coding transcripts were being actively tran-
scribed in this region. Next, we attempted to re-construct
the entire gene structure based on the coordinates for
TRs, predicted splice junction and N-SCAN predictions.
In this way, we built a gene model consisting of eight
exons and spanning approximately 20 kb. The putative
gene is displayed in Figure 9. The nucleotide sequence
results in an open reading frame that can be translated (in
the sense direction) into a protein consisting of 328
amino acids, thus strongly suggesting that this is a pro-
tein-coding gene (see Supplementary material in Addi-
tional file 1 for DNA and protein sequences and
alignments).
Searching the database of RefSeq proteins suggested
that the predicted protein belonged to the ATP-binding
cassette gene family. The highest similarity score was
found for the mouse protein Abca15 (NP_796187.2), with
90% our predicted gene covered in the alignment and 73%
identity among the aligned amino acids (see Supplemen-
tary material in Additional file 1). In addition to the eight
predicted exons there was also another TR just down-
stream of the fourth exon. This region was expressed at
significantly lower levels and inclusion of this TR dis-
rupted the open reading frame and thus it has not been
Table 3: Percentage of novel transcribed regions that overlap with different repeat classes
LINE SINE LTR All other repeat
classes
Novel TRs in brain 27% 10% 6% 4%
Novel TRs in liver 32% 10% 5% 5%
LINE, long interspersed nuclear element; LTR, long terminal repeat; SINE, short interspersed nuclear element.
Wetterbom et al. Genome Biology 2010, 11:R78
/>Page 11 of 16
Figure 9 Example of a previously uncharacterized gene. (a) A view from the UCSC Genome Browser displaying the predicted novel gene, located
within an intron in the OTOA gene. At the top is a schematic drawing of the gene with exons shown as red boxes. Then follows two tracks with pre-
dicted splice junctions and a set of tracks with TRs, shown separately for each tissue. Below are schematic models of human RefSeq genes (in blue)
and an N-SCAN gene prediction (in green) in the region. At the bottom is the structure of the human genome, showing the genomic rearrangement
affecting exon five in the novel gene. (b) The results of the experimental validation with RT-PCR. Each gel represents one exon-exon junction. The first
lane on the gels from the left is a 100-bp ladder (molecular weight marker, MWM), then follows the brain sample with (+RT) and without (-RT) reverse
transcriptase, followed by the same set of experiments in the liver sample. Some of the PCR products are longer than expected, indicating that some
of the exons are longer than initially predicted or that there may be additional exons in the gene model.
novel region 1 novel region 2 novel region 3
novel region 4 novel region 5 novel region 6
MWM
MWM
MWM
MWM
MWM
MWM
TR+niarB
TR+niarB
TR+niarB
TR+niarB
TR+niarB
TR+niarB
TR-niarB
TR-niarB
TR-niarB
TR-niarB
TR-
niarB
TR-niarB
TR+reviL
TR+reviL
TR+revi
L
TR+reviL
TR+reviL
TR+reviL
TR-reviL
TR-reviL
TR-reviL
TR-reviL
TR-reviL
TR-reviL
novel region 1
novel region 2
novel region 3
novel region 4
novel region 5
novel region 6
(a)
(b)
Wetterbom et al. Genome Biology 2010, 11:R78
/>Page 12 of 16
added to the proposed gene model. We used RT-PCR and
validated six out of seven possible pairs of consecutive
exon-exon junctions; three exon-exon junctions were also
supported by predicted splice junction.
The novel gene model was further supported by EST
evidence from GenBank [38,39]. We found macaque ESTs
covering exons 2 to 6 in our model, and human ESTs cov-
ering exons 3, 4 and 6. We noted that the fifth exon in our
gene model was skipped in the human ESTs and, as seen
in the human alignment track in Figure 9, a sequence of
312 bp encompassing exon 5 has been rearranged to a dif-
ferent location on the same chromosome (located more
than 500 kb upstream of the other exons). Removal of
exon 5 in human causes a shift in the reading frame and
introduces premature termination codons in the pre-
dicted protein sequence. Since the novel predicted gene
appeared to be transcribed in chimpanzee and other
mammals, but not in full in human, we speculate that it
has become a pseudogene in human.
Discussion
We have sequenced the chimpanzee transcriptome in
frontal cortex and liver, and with more than 200 million
uniquely mapping reads this is the most comprehensive
dataset to date, providing a rich source for validation of
existing RefSeq genes and for identification of novel TRs.
Our aim was to provide a comprehensive catalogue of
transcripts from protein-coding loci and to achieve this
we enriched for putative coding RNAs by using oligo(dT)
primers for reverse transcription. To establish a threshold
for expression we compared the expression values of Ref-
Seq genes with random intergenic regions and the thresh-
old was set to exclude 95% of the random sequences. This
approach rests on the premise that the majority of the
genome is only transcribed at a low level and although
this issue is still not completely resolved, a recent RNA-
Seq study suggests that most of the genome is not appre-
ciably transcribed [40]. Using this strategy we detected
11,319 expressed genes in brain and 8,810 in liver. The
numbers were slightly lower than other RNA-Seq studies
[21,22] of chimpanzee, indicating that our threshold was
conservative. This was further suggested by the RT-PCR
validation where we were able to amplify TRs with
expression below the threshold. However, with the choice
between finding all novel transcripts and minimizing the
number of false positives, we prioritized the latter.
Having shown that we could reliably detect expression
of known genes, we used the same expression threshold
for de novo detection of TRs across the chimpanzee
genome. A large number of TRs were found (over 150,000
in the two tissues) and given that many were located close
together we assume that with increasing sequencing
depth many TRs would merge into longer consecutive
transcripts. However, to avoid introducing an arbitrary
distance cut-off we did not merge nearby TRs in the anal-
yses. TRs that were not overlapping with annotations of
human or chimpanzee RefSeq exons, mRNAs or ESTs
were termed 'novel', implying that the region has not pre-
viously been annotated as transcribed. Based on the
oligo(dT)-priming employed for cDNA synthesis, we
expected that most novel TRs would originate from poly-
adenylated transcripts and this was supported by the fact
that 84% of the novel TRs mapped within the boundaries
of RefSeq genes (that is, intronically or within ± 10 kb),
thus suggesting a multitude of uncharacterized exons and
UTRs. It should be noted, however, that not all exons and
UTRs are necessarily protein coding. This was shown, for
example, by the manual annotation of the ENCODE
regions [41], which found that an appreciable proportion
of transcripts from genic loci appear to be noncoding.
Novel TRs may also stem from several other types of
noncoding transcripts, including expressed repeats,
retained introns in unspliced mRNAs, different types of
small ncRNAs or antisense transcripts. Expressed repeats
and unspliced mRNAs were quite commonly observed in
our data and other types of ncRNAs were not expected to
be present in large numbers, considering the oligo(dT)-
priming of the cDNA synthesis. Widespread transcrip-
tion outside protein-coding regions in chimpanzees has
been observed by Khaitovich et al. [9] and Babbitt et al.
[22] and much of it appears to be conserved in primates,
thus suggesting its functional importance. To address
these issues in the present samples, sequencing of total
RNA, with protocols providing strand-specificity, will
ideally be employed.
For a small subset of approximately 350 novel TRs, the
corresponding genomic sequence appeared to be absent
in human. Further comparison with the macaque genome
revealed that for approximately half of the novel TRs, the
corresponding genomic regions had been lost in human
whereas for the other half the region had been inserted
into the chimpanzee genome. We have experimentally
verified one such transcript where the corresponding
genomic region was absent in the human genome. Since
the region was also present in the macaque genome, the
most plausible explanation is that the sequence was lost
on the human lineage. Structural variation leading to spe-
cies-specific genomic regions in both human and chim-
panzee has been described by several groups, ranging
from short insertions and deletions [2] to large segmental
duplications [42]. If such genomic regions harbor tran-
scriptionally active loci, they will contribute to the tran-
scriptional diversity between the species. Thus, the group
of TRs described here is intriguing and future compara-
tive studies will have to determine whether they provide
important clues to the divergent phenotypes between
humans and chimpanzees.
Wetterbom et al. Genome Biology 2010, 11:R78
/>Page 13 of 16
Alternative splicing is an important mechanism for
generating transcript divergence, and to assess splicing
patterns in our data we used the SplitSeek software for de
novo predictions of splice junctions. The advantage with
this method is that we were able to predict exon-exon
junctions that have not been described previously, in con-
trast to many other RNA-Seq studies that rely on meth-
ods based on predefined junction libraries. We predicted
approximately 200 novel splice junctions in brain and
approximately 400 in liver and this is likely to represent
only a fraction of the splicing divergence. Due to the
nature of our transcript data many of these novel splice
junctions were found in 3' regions of genes. The differ-
ence in the number of splice junctions between brain and
liver most likely reflects the higher sequence coverage in
the liver sample rather than a biological difference. The
expression of different transcriptional isoforms is known
to vary between human tissues [20] and our analyses
indicated that this was also true in chimpanzee. Tissue-
specificity of noncoding transcripts has also been
described previously in human [35] and our results con-
firmed that the same applied in the chimpanzee. Genes
with novel TRs were expressed in a more tissue-specific
manner than genes with no novel TRs. Furthermore, we
noted several examples where the previously annotated
parts of a gene were expressed at the same level in brain
and liver, whereas the expression levels of novel TRs dif-
fered between the tissues. Bearing in mind that the
threshold for expression was conservative, it is quite
plausible that we did not capture all low abundance tran-
scripts and thus the proportion of tissue-specific TRs
may be even higher.
The samples used for sequencing originate from two
infant chimpanzees and this makes the dataset unique
and an important complement to previous datasets from
frontal cortex [22] and liver [21] of adult individuals.
Somel et al. [7] have previously shown that the brain
transcriptome in primates is remodeled after birth and
that gene expression differs with age. Although there is
no parallel study of developmental changes in the liver
transcriptome, it is reasonable to assume that consider-
able postnatal transcriptional changes occur also in the
liver. The age difference is also one plausible explanation
of why we were unable to replicate the sexually dimorphic
gene expression observed by Blekhman et al. [21].
Gene annotations in chimpanzee have relied almost
entirely on human mRNAs and ESTs as supporting evi-
dence. However, not all genes are identical between the
species and by using current human-centered gene anno-
tations it is only possible to find genes where regions are
present in human and absent in chimpanzee, and not the
opposite. Our analyses revealed a large number of novel
TRs located in the proximity of RefSeq genes and thereby
extends existing annotations of as many as 9,826 genes
(Figure 5b). We have a bias with higher sequencing depth
towards the 3' end of transcripts, and this gives us the
possibility to characterize novel 3' UTRs, even in tran-
scripts with very low expression levels. 3' UTRs have a
role in post-transcriptional regulation of gene expression,
stability of the transcript and as possible targets for
microRNAs. An illustrative example is the UROS gene
(Figure 8), where we identified and validated an alterna-
tive 3' UTR that was longer than the RefSeq annotated
UTR. We also identified and experimentally validated
examples of putative novel exons from five genes (Figures
S4, S5, S6 and S7 in Additional file 1). Such exons could
possibly add novel coding regions and thereby alter the
amino acid composition of the resulting protein. Similar
results, with a large number of uncharacterized exons
and UTRs, have been reported in human [26] and our
results support these findings. Finally, we describe an
example of a putative novel protein-coding gene that
belongs to the ATP-binding cassette transporter gene
family. The gene appeared to be present in chimpanzee
and several other primates but part of the DNA sequence
was absent from the human genome, thus suggesting that
the gene is not functional in human. The novel exons, 3'
UTRs and the putative gene described here are not pres-
ent in the current annotations of chimpanzee genes and
thus clearly show the weakness of existing homocentric
gene catalogues. Taken together, our results point to a
great transcriptional diversity in chimpanzee that has not
been previously characterized.
Conclusions
We have sequenced the chimpanzee transcriptome in
frontal cortex and liver and provided a comprehensive
catalogue of expressed RefSeq genes and numerous novel
TRs. The vast majority of novel TRs was found within or
in the vicinity of known genes and thus extends existing
gene models, mainly by adding new exons and 3' UTRs.
Furthermore, we have provided evidence of a gene that
appears to have been lost in the human lineage. Our anal-
yses highlight the great potential of combining RNA-Seq
with splice junction predictions in order to generate a
more complete understanding of transcriptome diversity.
Materials and methods
Sample preparation
Tissue samples from liver and frontal cortex were
obtained through autopsies of two young chimpanzees
(one female and one male), from the Kolmården Zoo,
Sweden. The deep frozen tissues were cryo-sectioned and
the slices recovered in QIAzol lysis buffer (Qiagen, Valen-
cia, CA, USA). Ten 10-μm slices were used for the liver
samples and 15 slices for frontal cortex. The miRNeasy
(Qiagen) protocol for small tissue samples was used to
prepare total RNA, which was subsequently treated with
Wetterbom et al. Genome Biology 2010, 11:R78
/>Page 14 of 16
DNAse (Qiagen) to remove possible contamination from
genomic DNA and further purified using the mini-elute
kit (Qiagen). First strand cDNA synthesis was performed
with the SuperSMART PCR cDNA synthesis kit (Clon-
tech, Mountain View, CA, USA), using the protocol sup-
plied by the manufacturer. The method enriches for full-
length cDNAs by using specific oligomers for priming. A
poly(A)-specific primer initiates the first strand synthesis
of cDNA, thereby selecting for polyadenylated RNA
while simultaneously keeping the concentration of ribo-
somal RNA low. The resulting single-stranded cDNA was
amplified with the Advantage2 PCR kit (Clontech) using
27 amplification cycles. The amplified cDNA was cleaved
with Rsa1 (NewEngland BioLabs, Ipswich, MA, USA) to
partially remove the added oligonucleotide and 3' primer.
The short cleavage products were eliminated in the size
selection step in the library preparation preceding
sequencing.
Sequencing and mapping of reads
The cDNA was used to prepare a fragment library from
each sample, according to the protocol supplied by the
manufacturer (Applied Biosystems, Carlsbad, CA, USA)
and sequenced using the SOLiD platform (Applied Bio-
systems). First, all four libraries were sequenced with a
read length of 35 bp, brainF and brainM on a whole slide
each, and liverF and liverM on half a slide each. Second,
the libraries for brainF and liverF were sequenced with a
read length of 50 bp, using a quarter of a slide per library.
Sequencing reads have been deposited in the European
Nucleotide Archive at EMBL with the accession number
[EMBL: ERA000160
].
Reads were aligned using the 'anchor-extend' method in
the whole transcriptome analysis tool from Applied Bio-
systems [43]. In the alignment each read was split into
two parts, or 'anchors' of length 25, which were then
mapped to the chimpanzee March 2006 (panTro2) refer-
ence sequence. Each anchor that mapped uniquely to the
reference was then extended as long as it was still match-
ing the reference. This 'anchor-extend' approach makes it
possible to map reads that partly overlap with a splice
junction.
When computing the coverage signal, all reads that
mapped to the exact same position and on the same
strand were merged and only counted once. In this way
we reduced the experimental bias caused by uneven PCR
amplification of transcripts. The brainF and liverF librar-
ies were sequenced twice with different read length (35
bp and 50 bp). Since there was a very high correlation
between the replicates with 35 and 50 bp (Figure 2a,b),
they were merged into one dataset per tissue.
Quantification of expression levels of RefSeq genes
For each of the samples brainM, brainF, liverM and liverF,
the coverage (that is, number of overlapping reads) was
calculated for every position of the reference genome. To
annotate genes, we used the 'Chimpanzee and human
RefSeq genes' track in the UCSC Genome Browser
[29,30]. This track defines genes based on the alignment
of RefSeq [28] mRNAs. Thus, different isoforms from the
same genomic locus will be annotated as different genes
although they have the same common gene name
(HGNC symbols).
To quantify expression levels, we calculated the average
dcpm value [16] in the last 500 bp of the last exon. The
average dcpm value was based on the whole last exon if it
was shorter than 500 bp. In this way, each RefSeq gene
was assigned a unique expression value. In order to estab-
lish a cut-off for expression of genes, we used the follow-
ing strategy. We compared the expression levels,
calculated as above, with the average dcpm values of ran-
domly sampled regions outside of RefSeq exons. For each
RefSeq gene, we sampled one random non-exonic region
of the same length as was used for calculating the gene
expression, that is, at most 500 bp. The sampling was
done from the same chromosome as the gene was local-
ized on and in this way we could compute average dcpm
values for the same number of randomly sampled regions
as the number of RefSeq genes. Assuming that most of
the genome is transcribed only at very low levels [40], we
then applied a cut-off so that 95% of the genes/TRs above
the threshold were detected as transcribed and only 5% of
the random regions. This is the same as having a 5% false
discovery rate. However, we expect that some of the ran-
domly sampled regions may represent biological tran-
scripts, rather than randomly mapped reads, and thus the
true false discovery rate is lower than 5%. Since the
expression levels differed between the samples, the pro-
cedure was repeated once for each dataset, resulting in
different cut-offs. After having established a cut-off for
each of the samples, we used this to scan for novel TRs.
All regions with a dcpm signal above the threshold over a
stretch of at least 50 consecutive bases were considered to
be transcribed, but to be included in the dataset of TRs
we further required detection in the same tissue in both
individuals.
De novo discovery and annotation of transcribed regions
The expression threshold described above was subse-
quently used to define TRs across the entire genome. The
complete set of TRs was compared to the RefSeq, mRNA
and EST tables from the UCSC Genome Browser [29,30],
containing information about genes, mRNAs or ESTs
detected either in chimpanzee or in human. We then
selected the TRs that did not overlap with any of the Ref-
Seq genes, mRNAs or ESTs and such TRs were consid-
ered to be 'novel'. To increase the confidence in these
novel TRs, we required them to be > 50 bp in length and
to be present (that is, overlap at least one base pair) in the
same tissue of both individuals.
Wetterbom et al. Genome Biology 2010, 11:R78
/>Page 15 of 16
Detection of novel regions with no support in the human
genome
The coordinates for all novel TRs were translated from
the chimpanzee genome (panTro2) to the human genome
(hg19) using the liftOver application available in the
UCSC Genome Browser [29,30]. Regions that did not
translate were BLASTed [31] to the entire human genome
(including chromosomes labeled as random and
unknown) and we then filtered out the ones that did not
give any match (with e-value < 0.001). For the evolution-
ary analysis we used the liftOver tool to further translate
the novel TRs to the macaque genome (rheMac2).
Gene Ontology analysis
The DAVID functional annotation tool [44] was used to
perform Gene Ontology classification of various lists of
RefSeq genes. We generally used all genes in the genome
as a background, focused on the ontology of biological
processes and considered a corrected (Benjamini) P-value
< 0.01 to be significant.
Splice junction detection
To detect splice junctions, we analyzed the reads using
the version 1.3.2 of the SplitSeek algorithm [32], available
from the SOLiD software development community [45].
Since the SplitSeek algorithm is not applicable for the
shorter read lengths, we used only the 50-bp reads from
the brainF and liverF samples in this analysis. The analy-
sis procedure and parameters were the same as in our
previous study on mouse RNA-Seq data [32]. We
required each prediction to be supported by at least two
uniquely mapping reads, and the two parts of the junc-
tion to be separated by at most 1 Mb. All SplitSeek pre-
dictions are included in Additional file 2, which can be
uploaded and viewed in the UCSC Genome Browser
together with all identified TRs in the chimpanzee sam-
ples.
Experimental validation of novel transcribed regions
RNA samples extracted from the female brain and liver
were used to regenerate cDNAs for RT-PCR, including
reactions without RT enzyme. We used the SMARTer™
Pico PCR cDNA synthesis Kit from Clontech (which has
replaced the SuperSMART PCR cDNA kit used for
library preparation) following the manufacturers instruc-
tions. Briefly, 1 μg of DNAase treated total RNA was
included in each cDNA synthesis reaction and incubated
at 42°C for 90 minutes. The cDNAs were purified using
the Nucleospin Extract II kit and recovered in a final vol-
ume of 160 μl. Then, 1 μl of each cDNA reaction was used
in 25 μl PCR reactions using the Advantage 2 PCR kit.
The primers used in amplifications are given in Table S4
in Additional file 1. The amplifications were initiated by 1
minute incubation at 95°C followed by 35 cycles at 95°C
for 15 s, 57 to 60°C for 30 s and 68°C for 30 s. The 10 ×
Advantage PCR buffer SA was used for primer pairs asso-
ciated with MN1. We separated 10 μl of the PCR reac-
tions using 2 to 3% NuSieve agarose gels.
Additional material
Abbreviations
bp: base pair; dcpm: depth of coverage per million reads; EST: expressed
sequence tag; LTR: long terminal repeat; ncRNA: non-coding RNA; RNA-Seq:
RNA sequencing; RT-PCR: reverse transcriptase PCR; TR: transcribed region;
UTR: untranslated region.
Authors' contributions
AW, LC and UG designed the study. AW and LC performed experiments. AA
performed mapping of reads and together with AW, LC, LF and UG analyzed
the data. AA and AW drafted the paper. All authors read and approved the final
manuscript.
Acknowledgements
We thank Bengt Röken at the Kolmården Zoo (Sweden) for sharing chimpan-
zee samples, Tomas Bergström for sample collection and the pathologists at
our department for help with tissue handling. We also acknowledge the staff at
Uppsala Genome Center who performed the SOLiD sequencing. Financial sup-
port for this project has been obtained from the Swedish Natural Sciences
Research Council (UG), The Knut and Alice Wallenberg Foundation (UG, LC)
and The National Graduate School for Functional Genomics and Bioinformatics
(AW).
Author Details
Department of Genetics and Pathology, Rudbeck laboratory, Uppsala
University, SE-751 85 Uppsala, Sweden
References
1. Chen FC, Li WH: Genomic divergences between humans and other
hominoids and the effective population size of the common ancestor
of humans and chimpanzees. Am J Hum Genet 2001, 68:444-456.
2. Mikkelsen TS, Hillier LW, Eichler EE, Zody MC, Jaffe DB, Yang S, Enard W,
Hellmann I, Lindblad-Toh K, Altheide TK: Initial sequence of the
chimpanzee genome and comparison with the human genome.
Nature 2005, 437:69-87.
3. Khaitovich P, Hellmann I, Enard W, Nowick K, Leinweber M, Franz H, Weiss
G, Lachmann M, Paabo S: Parallel patterns of evolution in the genomes
and transcriptomes of humans and chimpanzees. Science 2005,
309:1850-1854.
4. Enard W, Khaitovich P, Klose J, Zollner S, Heissig F, Giavalisco P, Nieselt-
Struwe K, Muchmore E, Varki A, Ravid R, Doxiadis GM, Bontrop RE, Paabo S:
Intra-and interspecific variation in primate gene expression patterns.
Science 2002, 296:340-343.
5. Caceres M, Lachuer J, Zapala MA, Redmond JC, Kudo L, Geschwind DH,
Lockhart DJ, Preuss TM, Barlow C: Elevated gene expression levels
distinguish human from non-human primate brains. Proc Natl Acad Sci
USA 2003, 100:13030-13035.
6. Uddin M, Wildman DE, Liu G, Xu W, Johnson RM, Hof PR, Kapatos G,
Grossman LI, Goodman M: Sister grouping of chimpanzees and humans
as revealed by genome-wide phylogenetic analysis of brain gene
expression profiles. Proc Natl Acad Sci USA 2004, 101:2957-2962.
7. Somel M, Franz H, Yan Z, Lorenc A, Guo S, Giger T, Kelso J, Nickel B,
Dannemann M, Bahn S, Webster MJ, Weickert CS, Lachmann M, Paabo S,
Khaitovich P: Transcriptional neoteny in the human brain. Proc Natl
Acad Sci USA 2009, 106:5743-5748.
Additional file 1 Supplementary figures, tables and material concern-
ing the novel gene.
Additional file 2 Custom tracks summarizing our results, which can
be uploaded and viewed in the UCSC Genome Browser.
Received: 15 December 2009 Revised: 17 June 2010
Accepted: 23 July 2010 Published: 23 July 2010
This article is available from: 2010 Wetterbom et al.; licensee BioMed Central Ltd. This is an open access article distributed under the terms of the Creative Commons A ttribution License ( which permits unrestricted use, distribution, and reproduction in any medium, provided the original work is properly cited.Genome Biology 2010, 11:R78
Wetterbom et al. Genome Biology 2010, 11:R78
/>Page 16 of 16
8. Karaman MW, Houck ML, Chemnick LG, Nagpal S, Chawannakul D,
Sudano D, Pike BL, Ho VV, Ryder OA, Hacia JG: Comparative analysis of
gene-expression patterns in human and African great ape cultured
fibroblasts. Genome Res 2003, 13:1619-1630.
9. Khaitovich P, Kelso J, Franz H, Visagie J, Giger T, Joerchel S, Petzold E,
Green RE, Lachmann M, Paabo S: Functionality of intergenic
transcription: an evolutionary comparison. PLoS Genet 2006, 2:e171.
10. Gilad Y, Rifkin SA, Bertone P, Gerstein M, White KP: Multi-species
microarrays reveal the effect of sequence divergence on gene
expression profiles. Genome Res 2005, 15:674-680.
11. Blekhman R, Oshlack A, Chabot AE, Smyth GK, Gilad Y: Gene regulation in
primates evolves under tissue-specific selection pressures. PLoS Genet
2008, 4:e1000271.
12. Sakate R, Osada N, Hida M, Sugano S, Hayasaka I, Shimohira N, Yanagi S,
Suto Y, Hashimoto K, Hirai M: Analysis of 5'-end sequences of
chimpanzee cDNAs. Genome Res 2003, 13:1022-1026.
13. Sakate R, Suto Y, Imanishi T, Tanoue T, Hida M, Hayasaka I, Kusuda J,
Gojobori T, Hashimoto K, Hirai M: Mapping of chimpanzee full-length
cDNAs onto the human genome unveils large potential divergence of
the transcriptome. Gene 2007, 399:1-10.
14. Nagalakshmi U, Wang Z, Waern K, Shou C, Raha D, Gerstein M, Snyder M:
The transcriptional landscape of the yeast genome defined by RNA
sequencing. Science 2008, 320:1344-1349.
15. Wilhelm BT, Marguerat S, Watt S, Schubert F, Wood V, Goodhead I, Penkett
CJ, Rogers J, Bahler J: Dynamic repertoire of a eukaryotic transcriptome
surveyed at single-nucleotide resolution. Nature 2008, 453:1239-1243.
16. Hillier LW, Reinke V, Green P, Hirst M, Marra MA, Waterston RH: Massively
parallel sequencing of the polyadenylated transcriptome of C. elegans.
Genome Res 2009, 19:657-666.
17. Mortazavi A, Williams BA, McCue K, Schaeffer L, Wold B: Mapping and
quantifying mammalian transcriptomes by RNA-Seq. Nat Methods
2008, 5:621-628.
18. Cloonan N, Forrest AR, Kolle G, Gardiner BB, Faulkner GJ, Brown MK, Taylor
DF, Steptoe AL, Wani S, Bethel G, Robertson AJ, Perkins AC, Bruce SJ, Lee
CC, Ranade SS, Peckham HE, Manning JM, McKernan KJ, Grimmond SM:
Stem cell transcriptome profiling via massive-scale mRNA sequencing.
Nat Methods 2008, 5:613-619.
19. Sultan M, Schulz MH, Richard H, Magen A, Klingenhoff A, Scherf M, Seifert
M, Borodina T, Soldatov A, Parkhomchuk D, Schmidt D, O'Keeffe S, Haas S,
Vingron M, Lehrach H, Yaspo ML: A global view of gene activity and
alternative splicing by deep sequencing of the human transcriptome.
Science 2008, 321:956-960.
20. Wang ET, Sandberg R, Luo S, Khrebtukova I, Zhang L, Mayr C, Kingsmore
SF, Schroth GP, Burge CB: Alternative isoform regulation in human
tissue transcriptomes. Nature 2008, 456:470-476.
21. Blekhman R, Marioni JC, Zumbo P, Stephens M, Gilad Y: Sex-specific and
lineage-specific alternative splicing in primates. Genome Res 2009,
20:180-189.
22. Babbitt C, Fedrigo O, Pfefferle A, Boyle A, Horvatth J, Furey T, Wray G: Both
noncoding and protein-coding RNAs contribute to gene expression
evolution in the primate brain. Genome Biol Evol 2010, 2010:67-79.
23. t Hoen PA, Ariyurek Y, Thygesen HH, Vreugdenhil E, Vossen RH, de
Menezes RX, Boer JM, van Ommen GJ, den Dunnen JT: Deep sequencing-
based expression analysis shows major advances in robustness,
resolution and inter-lab portability over five microarray platforms.
Nucleic Acids Res 2008, 36:e141.
24. Morrissy AS, Morin RD, Delaney A, Zeng T, McDonald H, Jones S, Zhao Y,
Hirst M, Marra MA: Next-generation tag sequencing for cancer gene
expression profiling. Genome Res 2009, 19:1825-1835.
25. Brent MR: How does eukaryotic gene prediction work?. Nat Biotechnol
2007, 25:883-885.
26. Pickrell JK, Marioni JC, Pai AA, Degner JF, Engelhardt BE, Nkadori E,
Veyrieras JB, Stephens M, Gilad Y, Pritchard JK: Understanding
mechanisms underlying human gene expression variation with RNA
sequencing. Nature 2010, 464:768-772.
27. Bainbridge MN, Warren RL, Hirst M, Romanuik T, Zeng T, Go A, Delaney A,
Griffith M, Hickenbotham M, Magrini V, Mardis ER, Sadar MD, Siddiqui AS,
Marra MA, Jones SJ: Analysis of the prostate cancer cell line LNCaP
transcriptome using a sequencing-by-synthesis approach. BMC
Genomics 2006, 7:246.
28. Pruitt KD, Tatusova T, Maglott DR: NCBI reference sequences (RefSeq): a
curated non-redundant sequence database of genomes, transcripts
and proteins. Nucleic Acids Res 2007, 35:D61-65.
29. Rhead B, Karolchik D, Kuhn RM, Hinrichs AS, Zweig AS, Fujita PA, Diekhans
M, Smith KE, Rosenbloom KR, Raney BJ, Pohl A, Pheasant M, Meyer LR,
Learned K, Hsu F, Hillman-Jackson J, Harte RA, Giardine B, Dreszer TR,
Clawson H, Barber GP, Haussler D, Kent WJ: The UCSC Genome Browser
database: update 2010. Nucleic Acids Res 2010, 38:D613-619.
30. The UCSC Genome Browser [ />31. Altschul SF, Gish W, Miller W, Myers EW, Lipman DJ: Basic local alignment
search tool. J Mol Biol 1990, 215:403-410.
32. Ameur A, Wetterbom A, Feuk L, Gyllensten U: Global and unbiased
detection of splice junctions from RNA-seq data. Genome Biol 11:R34.
33. Kapranov P, Cheng J, Dike S, Nix DA, Duttagupta R, Willingham AT, Stadler
PF, Hertel J, Hackermuller J, Hofacker IL, Bell I, Cheung E, Drenkow J,
Dumais E, Patel S, Helt G, Ganesh M, Ghosh S, Piccolboni A,
Sementchenko V, Tammana H, Gingeras TR: RNA maps reveal new RNA
classes and a possible function for pervasive transcription. Science
2007, 316:1484-1488.
34. Birney E, Stamatoyannopoulos JA, Dutta A, Guigo R, Gingeras TR,
Margulies EH, Weng Z, Snyder M, Dermitzakis ET, Thurman RE, Kuehn MS,
Taylor CM, Neph S, Koch CM, Asthana S, Malhotra A, Adzhubei I,
Greenbaum JA, Andrews RM, Flicek P, Boyle PJ, Cao H, Carter NP, Clelland
GK, Davis S, Day N, Dhami P, Dillon SC, Dorschner MO, Fiegler H, et al.:
Identification and analysis of functional elements in 1% of the human
genome by the ENCODE pilot project. Nature 2007, 447:799-816.
35. Cheng J, Kapranov P, Drenkow J, Dike S, Brubaker S, Patel S, Long J, Stern
D, Tammana H, Helt G, Sementchenko V, Piccolboni A, Bekiranov S, Bailey
DK, Ganesh M, Ghosh S, Bell I, Gerhard DS, Gingeras TR: Transcriptional
maps of 10 human chromosomes at 5-nucleotide resolution. Science
2005, 308:1149-1154.
36. Carninci P, Kasukawa T, Katayama S, Gough J, Frith MC, Maeda N, Oyama
R, Ravasi T, Lenhard B, Wells C, Kodzius R, Shimokawa K, Bajic VB, Brenner
SE, Batalov S, Forrest AR, Zavolan M, Davis MJ, Wilming LG, Aidinis V, Allen
JE, Ambesi-Impiombato A, Apweiler R, Aturaliya RN, Bailey TL, Bansal M,
Baxter L, Beisel KW, Bersano T, Bono H, et al.: The transcriptional
landscape of the mammalian genome. Science 2005, 309:1559-1563.
37. Gross SS, Brent MR: Using multiple alignments to improve gene
prediction. J Comput Biol 2006, 13:379-393.
38. Benson DA, Karsch-Mizrachi I, Lipman DJ, Ostell J, Sayers EW: GenBank.
Nucleic Acids Res 2010, 38:D46-51.
39. GenBank [ />40. van Bakel H, Nislow C, Blencowe BJ, Hughes TR: Most "dark matter"
transcripts are associated with known genes. PLoS Biol 2010,
8:e1000371.
41. Harrow J, Denoeud F, Frankish A, Reymond A, Chen CK, Chrast J, Lagarde
J, Gilbert JG, Storey R, Swarbreck D, Rossier C, Ucla C, Hubbard T,
Antonarakis SE, Guigo R: GENCODE: producing a reference annotation
for ENCODE. Genome Biol 2006, 7 Suppl 1:S4.1-S4.9.
42. Cheng Z, Ventura M, She X, Khaitovich P, Graves T, Osoegawa K, Church D,
DeJong P, Wilson RK, Paabo S, Rocchi M, Eichler EE: A genome-wide
comparison of recent chimpanzee and human segmental duplications.
Nature 2005, 437:88-93.
43. Ast G: The alternative genome. Sci Am 2005, 292:40-47.
44. Huang da W, Sherman BT, Lempicki RA: Systematic and integrative
analysis of large gene lists using DAVID bioinformatics resources. Nat
Protoc 2009, 4:44-57.
45. SplitSeek [ />doi: 10.1186/gb-2010-11-7-r78
Cite this article as: Wetterbom et al., Identification of novel exons and tran-
scribed regions by chimpanzee transcriptome sequencing Genome Biology
2010, 11:R78