Handbook of EEG interpretation - part 2 pdf
Bạn đang xem bản rút gọn của tài liệu. Xem và tải ngay bản đầy đủ của tài liệu tại đây (1.73 MB, 29 trang )
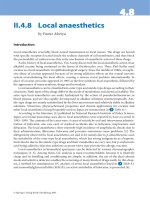
FIGURE 1.13. Muscle artifact at T4 manifests as repetitive single myogenic
potentials. Oz has continuous single electrode artifact, and a bifrontal burst of
muscle artifact is seen in second 3 to 4. Note the 6-Hz positive bursts in the
8th second. Filter settings are 1 to 70 Hz. (EEG courtesy of Greg Fisher MD).
A
myogenic (muscle) artifact consists of brief potentials that may
occur individually or become continuous obscuring underlying
EEG. EMG activity created during a seizure, during muscle contrac-
tion, or during movements are due to increased muscle tone. This arti-
fact is most prominent in individuals who are tense during the EEG
and is maximal in the temporal or frontopolar derivations (the site of
frontalis musculature). Myogenic potentials are composed of high-fre-
quency activity that is much briefer than the 20-msec potentials seen
with epileptiform discharges. In addition, an aftergoing slow wave is
absent, and having the individual relax their jaw muscles or capturing
sleep will lead to waning or elimination of a myogenic artifact.
Normal EEG
17
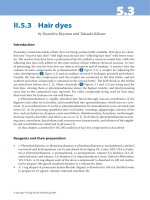
FIGURE 1.14. A chewing artifact seen at regular 1- to 2-second intervals.
Note the continuous myogenic artifact in the bitemporal regions.
R
egular bursts of myogenic potentials are seen during chewing.
These high-voltage temporal predominant bursts are due to con-
traction of the muscles associated with mastication. Associated
“slow” potentials during chewing reflect associated swallowing move-
ments created by the tongue. The tongue, like the eye, acts as a dipole
with the tip of the tongue being positive relative to the root. The
chewing that is an effect created by the temporalis muscles is accom-
panied thereafter by the glossokinetic movements of the tongue.
CHAPTER 1
18
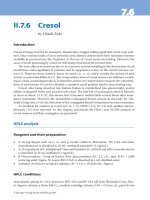
FIGURE 1.15. Pseudogeneralized spike-and-wave during intermittent photic
stimulation due to superimposition of a physiological artifact from eye flutter
and frontally predominant muscle artifact.
S
uperimposition of background frequencies can be deceiving when
normal or artifactual frequencies are combined. Identifying nor-
mal morphologies within the background and comparing the frequen-
cies of one or series of suspicious waveforms may help separate
normal from abnormal. In the above example, combined artifacts (eye
flutter and muscle artifact) create the appearance of a photoparoxys-
mal response during intermittent photic stimulation that could be a
pitfall to novice interpreters.
Normal EEG
19
FIGURE 1.16A. Single electrode artifact at T5.
P
otentials that are confined to a single electrode derivation are
suspicious for a single (or common electrode in average/linked
montages) electrode artifact. Identifying a single electrode artifact
should prompt a technologist to check the impedance and resecure the
electrode scalp-electrolyte interface, change the electrode with a per-
sistent artifact, and/or move the electrode to an alternate channel to
determine if the channel itself is defective.
CHAPTER 1
20
FIGURE 1.16B. Single electrode artifact at F7 mimicking a sharp wave.
B
izarre morphologies may occur and are usually recognizable.
Occasionally a single electrode artifact may mimic sharp waves
(see above).
Normal EEG
21
FIGURE 1.17A. A 60-Hz artifact.
A
60-cycle artifact is a function of the circuitry of the amplifiers
and common mode rejection when electrode impedances are
unequal. The frequency of an electrical line is represented in the EEG
usually when poor electrode impedances produce a mismatch. This
artifact should prompt a search for electrodes with an impedance of
>5000 ohm when a single electrode is involved, as well as ensuring
that ground loops and double grounds do not put the patient at a
safety risk when generalized a 60-cycle artifact is found, as in the
above example.
CHAPTER 1
22
FIGURE 1.17B. A 60-Hz artifact after notched filter application.
A
fter the application of the 60-Hz notched filter, note the elimina-
tion of the artifact that was seen on page 22 permitting interpre-
tation of the unobscured EEG. However, notice the persistent right
temporal myogenic artifact in the example above.
Normal EEG
23
FIGURE 1.18. A sphenoidal artifact that appears as a temporal sharp wave.
Note the absence of a lateral field in the left temporal chain.
S
ome electrode artifacts are difficult to recognize. In the above
example, the sphenoidal derivations were not functional and cre-
ated an electrode artifact that closely mimicked a temporal sharp
wave. Note the lack of a believable cerebral field and the absence of
any deflection in the true temporal and lateral temporal derivations
despite the high amplitude reflected in the scale in the bottom right-
hand corner.
CHAPTER 1
24
FIGURE 1.19. The vagus nerve stimulatior (VNS) artifact on the right recorded
during stimulation while undergoing continuous video-EEG monitoring.
A
n electrical artifact occurs when electronic circuits surgically
implanted (such as pacemakers or VNS) devices produce unde-
sirable signals internally that contaminate the EEG or EKG recording.
In this way, the patient or unshielded electrodes act as an antenna and
produce extracerebral sources of artifact similar to the way nearby
power lines may create external 60-Hz interference by the inducting
magnetic fields created from nearby current flow. It is the current flow
that results in electrode depolarization, is amplified by the amplifiers,
and creates the resultant “noise.”
Normal EEG
25
FIGURE 1.20. A mechanical artifact induced by CPAP in a comatose patient
in the ICU. Note the alternating polarity of the mechanical artifact and low
voltage.
A
variety of artifacts can be see in the intensive care unit (ICU),
critical care unit (CCU), or clinical specialty unit (CSU) pro-
duced by mechanical or instrumental sources. Electrical induced
“noise” can be more evident for routine mechanical function at high
gain (low sensitivity) settings. Alternating movement generated by a
respirator is noted in the above example using high sensitivities of 3
µV/mm in a patient who is intubated and mechanically ventilated with
continuous positive airway pressure (CPAP).
CHAPTER 1
26
FIGURE 1.21. A telephone ring artifact during in-patient long-term video-
EEG monitoring.
E
nvironmental artifacts may be quite elusive. They may often not
be readily identifiable or correctable within the confines of a
“hostile” environment when performing EEG in the ICU or CCU.
Some of these artifacts may be generated by high frequencies pro-
duced by nearby electrical machinery not directly connected to the
patient. Equipment such as blood warmers, bovies, and electrical beds
in the operating room (OR) may be challenging to locate the source
of the artifact. By unplugging or moving equipment away from the
recording electrode, redirecting electrical current flow may eliminate
the artifact from the EEG. Telephone lines (see above) may interfere
with EEG and produce an artifact typically in all the channels during
recording.
Normal EEG
27
The application of routine EEG provides information about generators emanating
from a three-dimensional sphere with regard to location, distribution, waveform fre-
quency, polarity, and morphology.The state of wakefulness and age are critical fea-
tures for accurate interpretation of the normal EEG.
FIGURE 1.22. Normal 10-Hz alpha rhythm “blocked” by eye opening and
returning on eye closure. Note the faster frequency immediately on eye closure
(“squeak”).
T
he alpha rhythm remains the starting point to analyze clinical
EEG. In the normal EEG, a posterior dominant rhythm is repre-
sented bilaterally over the posterior head regions and lies within the
8- to 13-Hz bandwidth (alpha frequency). When this rhythm is atten-
uated with eye opening, it is referred to as the
alpha rhythm. During
normal development, an 8-Hz alpha frequency appears by 3 years of
age. The alpha rhythm remains stable between 8 and 12 Hz even dur-
ing normal aging into the later years of life. In approximately one-
fourth of normal adults, the alpha rhythm is poorly visualized, and in
CHAPTER 1
28
NORMAL EEG
<10%, voltages of <15 µV may be seen. The alpha rhythm is distrib-
uted maximally in the occipital regions, and shifts anteriorly during
drowsiness. Voltage asymmetries of >50% should be regarded as
being abnormal, especially when the left side is greater than the right.
It is best observed during relaxed wakefulness, and has a side to side
difference of <1 Hz. Unilateral failure of the alpha rhythm to attenu-
ate reflects an ipsilateral abnormality (
Bancaud’s phenomenon).
Normally, alpha frequencies may transiently increase immediately
after eye closure (
alpha squeak). Alpha variants include forms that are
one-half (slow alpha) or two times (fast alpha) the frequency with
similar distribution and reactivity. Alpha variants may have a notched
appearance.
Paradoxical alpha occurs when alertness results in the
presence of alpha, and drowsiness does not.
Normal EEG
29
FIGURE 1.23. Note the prominent left central mu rhythm during eye opening.
T
he mu rhythm is a centrally located arciform alpha frequency
(usually 8 to 10 Hz) that represents the sensorimotor cortex at
rest (Figure 1.23). While it resembles the alpha rhythm, it does not
block with eye opening, but instead with contralateral movement of
an extremity. It may be seen only on one side, and may be quite asym-
metrical and asynchronous, despite the notable absence of an under-
lying structural lesion. The mu rhythm may slow with advancing age,
and is usually of lower amplitude than the existent alpha rhythm.
When persistent, unreactive, and associated with focal slowing, mu-
like frequencies are abnormal.
CHAPTER 1
30
FIGURE 1.24. Breach rhythm in the right temporal region (maximal at T4)
following craniotomy for temporal lobectomy.
B
eta rhythms are frequencies that are more than 13 Hz. They are
common, and normally observed within the 18- to 25-Hz band-
width with a voltage of <20 µV. Voltages beyond 25 µV in amplitude
are abnormal. Benzodiazepines, barbiturates, and chloral hydrate are
potent generalized beta activators of “fast activity” >50 µV for >50%
of the waking tracing within the 14- to 16-Hz bandwidth. Beta activ-
ity normally increases during drowsiness, light sleep, and with mental
activation. Persistently reduced voltages of >50% suggest a cortical
gray matter abnormality within the hemisphere having the lower
amplitude; however, lesser asymmetries may simply reflect normal
skull asymmetries. A skull defect may produce a
breach rhythm with
focal, asymmetrical, higher amplitudes (this relative increase may be
more than three times) beta activity without the skull to attenuate the
faster frequencies. It is normal unless associated with spikes or focal
slowing.
Normal EEG
31
FIGURE 1.25. Normal frontocentral theta rhythm in an 18-year-old patient
while awake.
T
heta rhythms are composed of 4- to 7-Hz frequencies of varying
amplitude and morphologies. Approximately one-third of nor-
mal awake, young adults show intermittent 6- to 7-Hz theta rhythms
of <15 µV that is maximal in the frontal or frontocentral head regions.
The appearance of frontal theta can be facilitated by emotions,
focused concentration, and during mental tasks. Theta activity is nor-
mally enhanced by hyperventilation, drowsiness, and sleep.
Intermittent 4- to 5-Hz activity bitemporally, or even with a lateral-
ized predominance (usually left > right), may occur in about one-third
of the asymptomatic elderly and is not abnormal.
CHAPTER 1
32
FIGURE 1.26. Bioccipital lambda waves in a 28-year-old patient with dizzi-
ness. Notice the frequent “scanning” eye movement artifact in the F7 and T8
derivations.
L
ambda waves have been initially described as surface positive
sharply contoured theta waves appearing bilaterally in the occip-
ital region. These potentials have a duration of 160 to 250 msec, and
may at times be quite sharply contoured, asymmetrical, with higher
amplitudes than the resting posterior dominant rhythm. When they
occur asymmetrically, they may be confusion with interictal epilepti-
form discharges, and potentially lead to the misinterpretation of the
EEG. They are best observed in young adults when seen, although
they are more frequently found in children. Lambda waves are best
elicited when the patient visually scans a textured or complex picture
with fast saccadic eye movements. Placing a white sheet of paper in
front of the individual will eliminate the visual input that is essential
for their genesis.
Normal EEG
33
FIGURE 1.27. Intermittent left mid-temporal delta during transition to
drowsiness in a normal 84-year-old patient evaluated for syncope.
D
elta rhythms are frequencies consist of <4-Hz activity that com-
prises <10% of the normal waking EEG by age 10 years. In the
waking states, delta can be considered a normal finding in the very
young and in the elderly. The normal elderly may have rare irregular
delta complexes in the temporal regions. It is similar to temporal theta
in the distribution, often left > right temporal head regions, but nor-
mally is present for <1% of the recording. Some delta is normal in
people older than 60 years, at the onset of drowsiness, in response to
hyperventilation, and during slow-wave sleep. Excessive generalized
delta is abnormal and indicates an encephalopathy that is etiology
nonspecific. Focal arrhythmic delta usually indicates a structural
lesion involving the white matter of the ipsilateral hemisphere, espe-
cially when it is continuous and unreactive.
CHAPTER 1
34
Stage 1 sleep is defined by the presence of vertex waves, typically 200-msec dipha-
sic sharp transients with maximal negativity at the vertex (Cz) electrode.They may
be seen in stages 1 to 3 sleep.They are bilateral, synchronous, and symmetrical, and
may be induced by auditory stimuli.Vertex waves can appear spiky (especially in chil-
dren) but should normally never be consistently lateralized. Other features include
attenuation of the alpha rhythm, greater frontal prominence of beta, slow rolling eye
movements, and vertex sharp transients. In addition, positive occipital sharp tran-
sients (POSTS) are another feature signifying stage 1 sleep.These are surface posi-
tive, bisynchronous physiological sharp waves with voltage asymmetries that may
occur over the occipital regions as single complexes or in repetitive bursts that may
be present in both stages 1 and 2 sleep.
FIGURE 1.28. POSTS appearing in the lower three channels in a bipolar cir-
cle montage demonstrating positive polarity in the occipital region during
sleep. Notice the surface negative vertex waves maximal at Cz.
Normal EEG
35
NORMAL SLEEP ARCHITECTURE
FIGURE 1.29. Stage 2 sleep with prominent sleep spindles and POSTs.
S
tage 2 sleep is defined by the presence of sleep spindles and K
complexes. This stage has the same features as stage 1 with pro-
gressive slowing of background frequencies. Sleep spindles are tran-
sient, sinusoidal 12- to 14-Hz activity with waxing and waning
amplitude seen in the central regions with frontal representation by
slower frequencies of 10 to 12 Hz. A
K-complex is a high amplitude
diphasic wave with an initial sharp transient followed by a high-
amplitude slow wave often associated with a sleep spindle in the fron-
tocentral regions. A K-complex may be evoked by a sudden auditory
stimulus. A persistent asymmetry of >50% is abnormal on the side of
reduction.
CHAPTER 1
36
FIGURE 1.30. Slow-wave sleep. Note the intermittent POSTs and sleep
spindles against the continuous delta background.
S
low-wave sleep now best describes non-REM deep sleep and is
comprised of 1- to 2-Hz delta frequencies occupying variable
amounts of the background. Stage 3 previously noted delta occupying
20% to 50% of the recording with voltages of >75 µV, while stage 4
consists of delta present for >50% of the recording.
Normal EEG
37
FIGURE 1.31. REM sleep with rapid eye movements associated with lateral
rectus spikes is noted at the F7 and F8 derivations.
R
EM sleep is characterized by rapid eye movements, loss of mus-
cle tone, and saw-toothed waves in the EEG (Figure 1.10). Non-
REM and REM sleep alternate in cycles four to six times during a
normal night’s sleep. A predominance of non-REM appears in the first
part of the night, and REM in the last third of the night. A routine
EEG with REM may reflect sleep deprivation and not necessarily a
disorder of sleep-onset REM such as narcolepsy.
CHAPTER 1
38
Activation techniques are a useful part of EEG in clinical practice and represent var-
ious types of stimuli or modalities that are able to trigger abnormalities.
Hyperventilation and intermittent photic stimulation are routinely performed to
augment slowing and/or epileptiform abnormalities, although sleep deprivation,
pharmacological, and other methods may be employed.
FIGURE 1.32. Normal build-up during hyperventilation.
H
yperventilation is routinely performed for 3 to 5 minutes in most
EEG laboratories. The purpose is to create cerebral vasocon-
striction through respiratory means promoting systemic hypocarbia.
Hyperventilation normally produces a bilateral increase in theta and
delta frequencies (build-up) that is frontally predominant, and often
of high amplitude. Resolution of the effect occurs normally within 1
minute. Activation, or the generation of epileptiform discharges, is
infrequently seen in those with localization-related epilepsy (<10%);
Normal EEG
39
ACTIVATION PROCEDURES
however, this may approach 80% for those with generalized epilepsies
that include absence seizures. Hyperventilation may produce focal
slowing in patients with an underlying structural lesion. It should not
be performed in patients with severe cardiac or pulmonary disease,
acute or recent stroke, significant large vessel cerebrovascular, and
sickle cell anemia or trait, and it should be used with caution during
pregnancy.
CHAPTER 1
40
FIGURE 1.33. Photic driving at 20 Hz seen in the P3-O1, P4-O2, T5-O1,
and T6-O2 derivations.
I
ntermittent photic stimulation normally produces potentials
exquisitely time locked to the frequency of the intermittent light
stimulus, and is referred to as
photic driving. Response depends upon
background illumination and the distance of the light source from the
patient. Distances of <30 cm from the patient are used to optimize the
effect of stimulation. Flashes are very brief, and delivered in sequence
from 1 to 30 Hz flash frequencies for approximately 10 sec before
stopping the stimulus. Subharmonics and harmonics of the flash fre-
quency may be seen. Photic driving is usually greatest in the occipital
location, in frequencies approximating the alpha rhythm, when the
eyes are closed.
Photomyoclonic (or photomyogenic) responses con-
sist of a frontally dominant muscle artifact that occurs when the flash
evokes repetitive local contraction of the frontalis musculature (pho-
tomyogenic). The periocular muscles may also be affected with single
lightening-like head jerks (photomyoclonic). Myogenic spikes occur
50 to 60 msec after the flash and increase in amplitude as the stimu-
lus frequency increases. The response is normal, although it may be
seen is withdrawal syndromes or states of hyperexcitability.
Normal EEG
41