Handbook of EEG interpretation - part 6 ppt
Bạn đang xem bản rút gọn của tài liệu. Xem và tải ngay bản đầy đủ của tài liệu tại đây (1.39 MB, 29 trang )
tive deflection sandwiched between a lower amplitude initial surface
negative deflection and an aftergoing slower surface- negative poten-
tial. Triphasic waves are seen in bilateral nonevolving bursts or runs
of 1 to 2 Hz frequently with an anterior predominance and an ante-
rior to posterior lag, although they may also possess a posterior pre-
dominance, or mixed predominance. They may be reactive to eye
opening or even benzodiazepine administration. When they occur in
prolonged runs, distinguishing triphasic waves from nonconvulsive
status epilepticus can be difficult.
Patterns of Special Significance
133
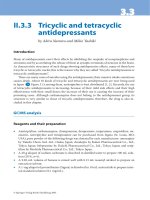
FIGURE 5.10. Triphasic waves noted on the EEG of another patient with
encephalopathy due to renal failure, who is on hemodialysis. The EKG how-
ever, demonstrates ventricular fibrillation. The patient had a cardiac arrest and
died during long-term EEG monitoring.
T
he electrocardiogram (EKG) is normally recorded on every EEG.
Cardiac function has been inextricably related to brain function,
and while many channels are dedicated to recording the EEG, the rep-
resentation for cardiac function is based upon a single channel. The
normal cardiac rhythm is usually represented by a bipolar derivation
connecting the left to right chest. Various artifacts may appear in the
EEG, although cardiac rhythm disturbances may be detected that are
important for cerebral function or even predicate discovery of malig-
nant arrhythmias (see above).
CHAPTER 5
134
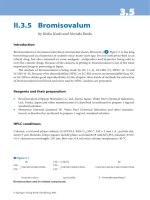
FIGURE 5.11. Burst-suppression following out-of-hospital cardiac arrest.
The recording was obtained at 2 µV/mm with single electrode distances.
B
urst suppression suggests a severe bilateral cerebral dysfunction,
and while nonspecific in etiology, when associated with hypoxia,
this pattern suggests a poor prognosis. The burst-suppression pattern
consists of stereotyped bursts, usually consisting of mixed frequencies
with or without intermixed epileptiform discharges. The bursts usu-
ally recur between 2 and 10 sec and are separated by intervals of sup-
pression that demonstrate no electrocerebral activity at normal
sensitivities. Note the lack of response to somatosensory stimulation
annotated by the technologist.
Patterns of Special Significance
135
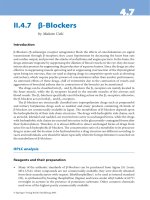
FIGURE 5.12. GPEDs in a 75-year-old man after cardiac arrest. He was com-
atose but had no clinical signs that were otherwise evident. Note the periodicity.
G
eneralized periodic epileptiform discharges (GPEDs) are bilat-
eral periodic epileptiform discharges. They signify a diffuse
encephalopathy and may occur with seizures, although frequently
GPEDs occur as the expression of a diffuse structural injury pattern
involving gray matter without seizures. They are unreactive to
somatosensory stimulation, and are associated with an absent or dif-
fusely slow posterior dominant rhythm. This pattern may also be seen
with NCSE, and whether the EEG independent of overt seizures rep-
resents nonconvulsive SE often has been subject to clinical debate.
CHAPTER 5
136
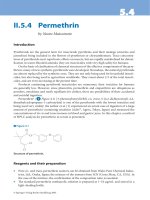
FIGURE 5.13. BiPLEDs in a 37-year-old HIV-positive man admitted follow-
ing a prolonged generalized tonic-clonic seizure and meningoencephalitis.
Note the right frontal and left occipital bilateral independent hemispheric dis-
charges.
B
ilateral independent periodic epileptiform discharges (BiPLEDs)
are less commonly associated with seizures than are periodic lat-
eralized epileptiform discharges (PLEDs). The discharges are bihemi-
spheric and independent with different morphologies and periods of
repetition and are less associated with seizures than are PLEDs or
PLEDs plus. They are seen in patients with a severe bilateral distur-
bance of cerebral function, and while nonspecific, BiPLEDs are most
commonly associated with hypoxic injury to the brain.
Patterns of Special Significance
137
FIGURE 5.14. GPED suppression in anoxic encephalopathy with facial
myoclonus reflected in the lower second chin electromyographic (EMG) chan-
nel. (Courtesy of Greg Fisher, MD.)
G
eneralized periodic epileptiform discharges (GPEDs) may be
composed of spikes, polyspikes, or sharp waves that are bilateral
and synchronous at a rate of 0.5 to 1.0 Hz on a “flat” or low-ampli-
tude recording and be associated with frequent myoclonic jerks (sta-
tus myoclonus). This pattern is seen with severe diffuse cerebral
insults such as with massive hypoxia, typically after cardiac arrest, but
also can be seen with stroke, trauma, or infections. The EEG typically
lacks background activity between discharges and may reveal a burst-
suppression pattern, GPEDs (see above), or prolonged periods of dif-
fuse suppression. The outcome is characteristically grim, resulting in
death or persistent vegetative states.
CHAPTER 5
138
FIGURE 5.15. Alpha coma in a post–cardiopulmonary resusitation coma-
tose patient following cardiac arrest. Stimulation was ineffective in creating a
change in background.
A
lpha coma is represented by diffuse alpha frequencies that are
part of an unreactive pattern without anterior-posterior gradient
on EEG seen in patients in coma. It is most frequently seen in hypoxic
encephalopathy, although it has been reported with brainstem lesions,
and portends a poor prognosis. Etiology is the most important deter-
minant in outcome regardless of the patterns seen. Other coma pat-
terns including beta coma, theta/delta coma, and spindle coma may
also be seen. As with alpha coma, drugs and trauma carry a more
favorable prognosis than hypoxic-ischemic causes.
Patterns of Special Significance
139
FIGURE 5.16. The EEG of a 67-year-old patient following cardiac arrest.
Note the diffuse anterior predominant spindle-like activity.
S
pindle coma is a pattern seen in comatose patients. Features on
the EEG include prominent spindle-like activity similar to the
spindles seen in stage 2 sleep, although they reflect abnormal spindle
formation because they are unreactive, diffuse, and the patient is com-
atose. Etiologies are similar to alpha coma, with anoxia not being
infrequently seen. It may also be seen with posttraumatic etiologies
and, in this case, usually carries a better prognosis.
CHAPTER 5
140
FIGURE 5.17. A 52-year-old following cardiac arrest 10 days previously.
The patient met the clinical criteria for a diagnosis of brain death.
E
lectrocerebral inactivity is defined as no cerebral activity greater
than 2 µV. For the purpose of brain death recording, guidelines
produced by the American Clinical Neurophysiology Society (ACNS)
are available and include several other requirements, such as testing
the integrity of the system and recording at double interelectrode dis-
tances, and ensuring electrode impedances are between 100 and 5000
ohms. In addition, certain factors that may make this pattern
reversible must be excluded, such as hypothermia and sedative drugs.
EEG is considered an indirect and adjunct test for clinical brain death,
but is not required for the diagnosis.
Patterns of Special Significance
141
Status epilepticus represents prolonged seizures with various electroclinical patterns
on EEG. All seizure types may manifest as status epilepticus. The features of status
epilepticus seen on the EEG are a reflection of the seizure type with characteristic
electrographic patterns. Both convulsive and nonconvulsive forms occur, and pro-
longed EEG recording can help elucidate the temporal pattern of patients with recur-
rent seizures when subtle or no clinical signs are present.
FIGURE 5.18. Epilepsia partialis continua in a 41-year-old patient with sub-
jective tingling and “twitching” noted at the corner of the left side of the mouth.
Note the rhythmic delta frequencies on the EEG that phase reverse at the F8
derivation.
T
he diagnosis of simple partial status epilepticus is confirmed by the
presence of an electrographic correlate on EEG. This occurs in a
CHAPTER 5
142
STATUS EPILEPTICUS
minority of cases of suspected SPSE given the restricted epileptogenic
zone that is involved. The discharges favor the convexity of the cerebral
hemispheres, and hence EEG may reveal spikes over frontal, rolandic,
parietal, or occipital regions. When temporal discharges are found and
a clinical correlate is present, these regions beyond an experiential sen-
sation usually are projected from extratemporal sources. Depending on
the region involved, seizures may begin with polyspike activity, rhyth-
mic activity or spike-slow-wave activity. When localized to a single
restricted area, SPSE is referred to as
epilepsia partialis continua.
Patterns of Special Significance
143
FIGURE 5.19. Complex partial SE in a 21-year-old patient with posten-
cephalitic localization-related epilepsy. The clinical symptoms were mild confu-
sion. Note the right hemispheric ictal activity.
C
omplex partial SE is often characterized by a change in mental
status with impairment of consciousness. EEG patterns may
include repetitive spiking, spike-slow-wave, rhythmic low- voltage fast
activity, or a combination of sharps and slow frequencies. The patterns
may wax and wane showing changes in frequency and amplitude as
well as in spatial distribution (see above). Although seizures are usually
seen unilaterally, they may be seen bilaterally, independently, or may
propagate from one hemisphere to the other. Complex partial SE may
initially lateralize with 4-to 7-Hz rhythmic activity during clinical
symptomatology. When the convexity of the temporal lobe is the ori-
gin, the EEG shows more widely distributed rhythmic activity.
CHAPTER 5
144
FIGURE 5.20. EEG in a patient with postanoxic generalized nonconvulsive
SE that followed convulsive SE.
E
lectrographic seizures seen during EEG may be found during the
evaluation of comatose patients. They can occur after convulsive
status epilepticus, or be uncovered in comatose patients with few clin-
ical clues other than a change in mental status. The EEG may show
generalized periodic discharges, polyspikes, spike-and-slow-waves or
even diffuse, rhythmic waxing and waning delta or theta activity. The
EEG may appear focal or diffuse and have IEDs that are serial or con-
tinuous as with nonconvulsive status epilepticus (NCSE). Note the
generalized spike-wave complexes with right lateralization in the
above example. There are a wide variety of possible EEG patterns that
may be seen with NCSE.
Patterns of Special Significance
145
FIGURE 5.21. ESES in a 9-year-old boy with Landau-Kleffner syndrome.
No clinical features were noted.
L
andau-Kleffner syndrome (LKS) and the syndrome of continuous
spikes and waves during slow sleep (CSWS) are syndromes of
acquired language (LKS) or cognitive dysfunction (CSWS) associated
with seizures in about three-fourths of patients. Irrespective of
seizures, consistent IEDs appear while awake, although in varying
degrees and locations. They may be high-voltage multifocal spikes
and spike-wave discharges that occur singly or in salvos, unilaterally
or bilaterally, and often involving the posterior temporal (language
dominant) head regions. The IEDs during slow-wave sleep appear dif-
fuse, symmetrical, or asymmetrical bisynchronous, and increase so
that 85% of the recording or more comprises electrical status epilep-
ticus of slow sleep (ESES).
CHAPTER 5
146
ADDITIONAL RESOURCES
American Clinical Neurophysiology Society. Guideline 3: Minimum technical
standards for EEG recording in suspected cerebral death. J Clin
Neurophysiol 2006;23:97–104.
Boulanger JM, Deacon C, Lecuyer D, et al. Triphasic waves versus nonconvul-
sive status epilepticus: EEG distinction. Can J Neurol Sci 2006;33:
175–180.
Brenner RP, Schaul N. Periodic EEG patterns: classification, clinical correla-
tion, and pathophysiology. J Clin Neurophysiol 1990;7:249–267.
Herman ST. In: FW Drislane, ed. Status Epilepticus. Humana Press, Totowa,
NJ, 2005:245–262.
Kaplan PW. Non-convulsive status epilepticus. Semin Neurol 1996;16:33–40.
Kaplan PW. The EEG of status epilepticus. J Clin Neurophysiol. 2006;23:
221–229.
Kaplan PW, Genoud D, Ho TW, Jallon P. Etiology, neurologic correlations, and
prognosis in alpha coma. Clin Neurophysiol 1999;110:205–213.
Kaplan PW, Genoud D, Ho TW, Jallon P. Clinical correlates and prognosis in
early spindle coma. Clin Neurophysiol 2000;111:584–90.
Shorvon S, Walker M. Status epilepticus in idiopathic generalized epilepsies.
Epilepsia 2005; 46:73–79.
Tatum WO, French JA, Benbadis SR, Kaplan PW. The etiology and diagnosis
of status epilepticus. Epilep Behav 2001;2:311–317.
Treiman DM. Electroclinical features of status epilepticus. J Clin
Neurophysiol. 1995;12:343–362.
Patterns of Special Significance
147
This page intentionally left blank
149
CHAPTER 6
Polysomnography
AATIF M. HUSAIN
S
leep is a nonhomogenous state composed of mostly non–rapid
eye movement (NREM) and rapid eye movement (REM) sleep.
NREM sleep is further divided into four stages, starting with
light sleep (stage I) to deep sleep (stage IV). Sleep and its disorders are
often studied with a polysomnogram (PSG), also known as a sleep
study. A PSG allows one to determine the quantity and quality of
sleep.
The terms listed below are commonly used in PSG
1. Lights out: start of PSG
2. Lights on: end of PSG
3. TIB (time in bed): total time patient was in bed during sleep study
(including periods of wakefulness)
4. TST (total sleep time): total time patient was in bed in any stage
of sleep
5. Sleep efficiency: (TST/TIB)
ϫ 100, expressed as percentage
6. WASO (wakefulness after sleep onset): time spent awake after the
first epoch of sleep and before final awakening
7. Sleep latency: time from lights out to first stage of sleep
8. REM latency: time from first stage of sleep to first epoch of REM
sleep
9. % Stages I, II, III, IV, REM: (time spent in each stage/TST)
ϫ
100, expressed as percentage; often stages III and IV are
expressed together as slow-wave (or delta) sleep.
FIGURE 6.1. Hypnogram of normal sleep cycle.
T
he hypnogram is a graphic representation of sleep stages achieved
in an overnight polysomnogram. The features noted in Figure 6.1
reflect the normal sleep cycle in a single overnight recording for an
adult. Non-REM sleep consists of light sleep (stages I and II,
thin
arrow
) and deep sleep (stages III and IV, dashed arrow) repeating four
to five times per night. REM, or “dream sleep,” occurs throughout the
night, appearing approximately every 90 min.
CHAPTER 6
150
FIGURE 6.2. A 30-sec page (epoch) of a PSG demonstrating a typical montage.
I
n a routine PSG, many physiological parameters are recorded to
determine the normal and abnormal features or stages of sleep.
Physiological parameters commonly recorded are included in Figure
6.2; electroencephalogram (EEG) (thin oval), chin electromyogram
(EMG) (
thin arrow), eye movements (electro-oculogram, EOG) (thick
circle
), electrocardiogram (ECG) (thick arrow), leg movements (leg
EMG) (
dashed circle), snoring (dashed arrow), airflow (dotted circle),
respiratory effort (
dashed-dotted circle), and oxygen saturation.
Additionally, body position (
dashed-dotted arrow), oxygen supple-
mentation, and continuous positive airway pressure (CPAP) are also
noted (
dashed-dotted-dotted arrow). Initial PSGs used a single EEG
channel, C3-A2 or C4-A1, to score sleep stages. Later, however, at
least one other channel using an occipital electrode (O1 or O2) was
added to aid in determining transition to sleep. In patients in whom
epileptic seizures are in the differential diagnosis, a full set of EEG
electrodes is applied and 16 to 18 channels of EEG are recorded. This
Polysomnography
151
allows a more definitive diagnosis of interictal and ictal epileptiform
abnormalities. Chin EMG is recorded from the submental region.
This helps in staging of sleep, with highest chin EMG activity noted
in wakefulness and lowest in REM sleep. Some sleep disorders cause
characteristic EMG abnormalities, such as increased tonic and phasic
EMG activity during REM sleep. EOG leads are placed below the
outer canthus of the left eye and above the outer canthus of the right
eye. Thus, any deflection of the eyes, whether horizontal or vertical,
produces an out of phase deflection. ECG monitoring electrodes are
placed on the anterior chest wall. This is used to detect cardiac
arrhythmias in sleep; it is not adequate for assessment of subtle abnor-
malities of cardiac conduction. Leg leads are used to monitor EMG
activity (movements) in the legs. Electrodes are placed on the anterior
tibialis muscle bilaterally. Dorsiflexion of the great toe and foot is
monitored with these electrodes. Respiratory monitoring involves
assessment of airflow, respiratory effort, and oxygen saturation. At
times, a snore microphone is also used to detect snoring. Airflow is
monitored with nasal and oral thermistors or pressure transducers.
Ventilatory effort is measured by recording chest and abdominal
movements. Pulse oximetry is used to determine oxygen saturation.
Other pertinent information, such as the patient’s position, whether
they are using supplemental oxygen, and CPAP, if it is being used, is
also noted. It is standard to review PSG in 30- sec intervals (pages or
epochs), which is equivalent to a display speed of 10 mm/sec. Each
epoch is scored according to the prevailing sleep stage. At the start of
every PSG, the technologist asks the patient to perform various tasks,
such as eye blinks, breath holding, moving legs, and others, to test the
integrity of the system and to make sure that appropriate deflections
are noted.
CHAPTER 6
152
Normally, sleep cycles remain consistent throughout the life of an individual and
throughout development and aging. Overnight polygraphic recordings include EEG
and other measures of ventilation, airflow, cardiac function, and muscle movements.
Polysomnograms are the foundation for assessing the normalcy of sleep architecture,
respiration, and nocturnal behavioral events. Multiple sleep latency or wakefulness
testing is another technique to determine the latency of sleep onset or REM onset.
FIGURE 6.3. This is a 30-sec epoch demonstrating stage W with alpha activ-
ity in the occipital channels (thin arrows) and tonic EMG activity (thick
arrow).
S
tage W, or normal wakefulness, is often seen at the start of a PSG
and after awakenings. Characteristic features include alpha
rhythm in the occipital regions, tonic EMG, rapid eye blinks, and reg-
ular respiration. Occasionally, instead of an alpha rhythm, low-volt-
age, mixed-frequency activity is seen.
Polysomnography
153
NORMAL SLEEP
FIGURE 6.4. This is a 10-sec epoch of stage W; it is the last 10 sec of the
previous sample.
T
his sample is displayed at the same paper speed (30 mm/sec) as
used in routine EEG. The alpha activity in the occipital electrodes
looks similar to that seen in a routine EEG (
arrow); in this case, it is
occurring at a frequency of about 11 Hz. It is helpful to change the
paper speed to a more familiar one to better recognize usual EEG fea-
tures. The slower paper speed (10 mm/sec) used in PSG is useful as
low-frequency activity (such as respiration) is better seen at that paper
speed.
CHAPTER 6
154
FIGURE 6.5. This is a 30-sec epoch of stage W with frequent eye blinks
present (arrows).
T
his sample has an alpha rhythm in the occipital region, tonic
EMG, and regular respiration. In addition, frequent eye blinks
are also seen. Eye blinks appear as out of phase deflections in the eye
leads. Along with alpha rhythm, tonic EMG, and regular respiration,
eye blinks are frequently seen in stage W.
Polysomnography
155
FIGURE 6.6. This is a 30-sec epoch showing sleep onset at about the third
second (arrow).
T
he initial change in EEG between stage W and stage I is fragmen-
tation of the alpha activity. Occipital electrodes are more sensi-
tive in recording alpha activity fragmentation. As seen in this tracing,
the first sign of sleep onset is loss of alpha activity (arrow) best seen
in the O1-A2 and Fp1-O2 channels. At the same time, no significant
change occurs in the C3-A2 channel. Consequently, contemporary
PSG always include at least two EEG channels: C3-A2 or C4-A1 and
O1-A2 or O2-A1. Many laboratory use additional channels to aid
further with sleep staging.
CHAPTER 6
156
FIGURE 6.7. This is a 30-sec epoch demonstrating early stage I sleep with
slow rolling eye movements (arrow).
S
tage I sleep is the transitional phase seen between wakefulness and
deeper stages of sleep. It comprises mostly a mixed-frequency
activity in the 2- to 7-Hz range. Early in stage I sleep, the alpha rhythm
becomes fragmented to a slower frequency activity and slow rolling eye
movements appear. Slow eye movements are distinguished from rapid
eye movements by the duration of the up slope of the eye movement;
rapid eye movements have an up slope of less than 300 msec, whereas
the up slope of slow eye movements is greater than 500 msec. EMG
activity in this stage of sleep is less than in wakefulness, but greater
than in deeper stages of sleep. Later in stage I sleep, vertex sharp waves
appear, but K complexes and sleep spindles are not present.
Polysomnography
157