Handbook of EEG interpretation - part 8 ppt
Bạn đang xem bản rút gọn của tài liệu. Xem và tải ngay bản đầy đủ của tài liệu tại đây (1.54 MB, 29 trang )
periods of time. Asynchrony is common. To differentiate them from
muscle jerks and irregular movements, the AASM has published
guidelines for scoring PLMS. These guidelines state that at least five
movements must occur in a series before counting can start. Each
movement must last between 0.5 and 5.0 sec, and movements must be
separated by 5 to 90 sec.
Polysomnography
191
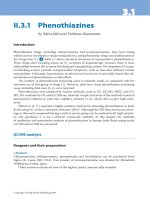
FIGURE 6.38. This is a 2-min epoch demonstrating PLMS. Note the perio-
dicity that is evident with each movement separated by 7 to 11 sec (arrows).
B
ecause of the time separating PLMS and their periodicity, they are
often best seen with a longer time base (i.e., 2-min epoch). The
figure above is from the same patient as the previous sample.
CHAPTER 6
192
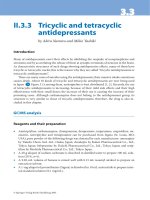
FIGURE 6.39. This is a 2-min epoch demonstrating unilateral PLMS occur-
ring only in the left leg 25 to 30 sec apart (arrows).
B
oth legs must be monitored in a PSG with electrodes on the ante-
rior tibialis muscles, as discussed previously. This is because occa-
sionally leg movements will be unilateral and may not be detected if
only one leg is monitored.
Polysomnography
193
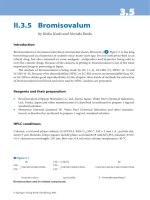
FIGURE 6.40. This is a 30-sec epoch demonstrating a leg movement associ-
ated with an arousal (thin arrow) that starts at the termination of the leg move-
ment (thick arrow).
L
eg movements may be associated with arousals or awakenings.
The AASM has proposed rules for scoring leg movements associ-
ated with arousals. The arousal (a frequency shift in the EEG lasting
at least 3 sec) must occur concurrently or within 1 to 2 sec after the
termination of the leg movement.
CHAPTER 6
194
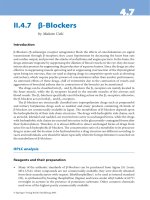
FIGURE 6.41. This is a 2-min epoch demonstrating PLMS in the left leg.
The latter two leg movements (thin arrows) occur at the termination of a
hypopnea and obstructive apnea (thick arrows). The respiratory events are also
associated with oxygen desaturations (dashed arrows).
P
eriodic movements can be associated with apneas and hypopneas
that often occur at the termination of the respiratory event. The
AASM recommends that these movements be classified as movements
related to respiratory events. Periodically, a respiratory event will ter-
minate with a movement and an arousal. It becomes difficult to deter-
mine if the arousal is due to the respiratory event or leg movement,
and the interpreter must rely on the clinical history in deciding the pri-
mary cause. Often when both respiratory events and PLMS are pres-
ent in a single patient, the respiratory events are addressed by
treatment first.
Polysomnography
195
Arrhythmias may be encountered during sleep evaluations that reflect changes in
heart rate or heart rhythm. Significant apneas or disorders of respiration may pro-
duce hypoxia that produces changes in the electrocardiogram.
FIGURE 6.42. This is a 2-min epoch demonstrating bradyarrhythmia asso-
ciated with a prolonged obstructive apnea (thin arrow) associated with a
severe desaturation (thick arrow). Before the start of the apnea, the heart rate
is approximately 100 beats per minute (dashed arrow), and this slows to about
50 beats per minute toward the end of the apnea (dotted arrow).
I
n addition to normal heart rate and rhythm changes during sleep,
arrhythmias are frequently seen. They occur due to imbalances
between sympathetic and parasympathetic tone. The most common of
these is severe sinus bradycardia, atrioventricular block, and sinus
arrest. Hypoxia produced by the apnea is thought to induce these
arrhythmias. During a PSG, only one channel of ECG is recorded, and
if significant abnormalities are noted, a 12-lead ECG should be ordered.
CHAPTER 6
196
CARDIAC ARRHYTHMIAS
FIGURE 6.43. This is a 60-sec epoch demonstrating bradyarrhythmia and a
sinus pause associated with a prolonged obstructive apnea (
thin arrow) associ-
ated with a bradyarrhythmia (thick arrow). Note that the oxygen saturation
channel is malfunctioning.
A
s noted previously, bradyarrhythmias are often seen with
obstructive apneas. In severe cases, sinus pauses can occur. This
is particularly likely in REM sleep due to increased parasympathetic
tone, which causes further slowing of the heart rate. In this sample,
the patient is in REM sleep in the first half of the epoch as manifest
by the rapid eye movement. In the figure above, toward the end of the
apnea, a sinus pause of almost 3 sec is noted (dashed arrow). At the
termination of the apnea, there is a compensatory tachycardia (
dotted
arrow
) and an arousal.
Polysomnography
197
FIGURE 6.44. This is a 30-sec epoch from the same patient as the previous
sample demonstrating resolution of the bradyarrhythmia and sinus pauses
(thin arrow) with CPAP at a pressure of 11 cm H
2
O (thick arrow).
T
he bradyarrhythmias and sinus pauses that occur with obstruc-
tive sleep apnea can often be effectively treated with CPAP. Prior
to placement of a permanent cardiac pacing device for bradyarrhyth-
mias, obstructive sleep apnea should be considered, and if present,
CPAP treatment should be used. This sample is from the same patient
as Figure 6.43.
CHAPTER 6
198
FIGURE 6.45. This is a 30-sec epoch showing sinus arrhythmia. Note that the
heart rate varies between 120 (thin arrow) and 85 (thick arrow) beats per
minute. The presence of P waves (dashed arrows) makes this a sinus arrhythmia.
S
inus arrhythmia is a frequently observed heart rhythm abnormal-
ity in sleep. It may or may not be associated with respiratory
events. Sinus arrhythmia may occur in normal individuals with heart
rates dropping to 40 beats per minutes. Sinus pauses of up to 2 sec
have also been noted.
Polysomnography
199
FIGURE 6.46. This is a 30-sec epoch demonstrating a run of ventricular
tachycardia.
W
hether ventricular arrhythmias increase or decrease in sleep is
disputed. When they do occur, they are most likely in the early
morning hours. These arrhythmias can occur in patients who do not
have apneas and desaturations. It has been suggested that sudden
death in sleep, which tends to occur more often in the early morning
hours, occurs due to ventricular arrhythmias. In the figure above
taken from a patient with ischemic heart disease and being evaluated
for obstructive sleep apnea, a 7-beat run of ventricular tachycardia is
noted (
thin arrow). Note that this arrhythmia occurred at 4:15 AM
(thick arrow). Significant respiratory disturbance was not noted in
this study.
CHAPTER 6
200
FIGURE 6.47. This is a 30-sec epoch demonstrating a run of supraventricu-
lar tachycardia with a rate of approximately 180 beats per minute (
thin arrow)
that terminates toward the middle of the epoch and replaced by normal sinus
rhythm at 85 beats per minute (thick arrow).
S
upraventricular tachycardias have a bimodal circadian peak,
between 6:00
AM and 12:00 PM and between 6:00 PM and 12:00
AM. During the latter peak, changes in autonomic tone are thought to
be causative. The time of the arrhythmia is noted during the record-
ing and is seen in the above example to occur at 11:35
PM (dashed
arrow
).
Polysomnography
201
Individuals with nighttime spells may have seizures as the underlying cause.
Epileptiform discharges may be encountered on the EEG during PSG, although dif-
ferentiating pathological spikes from artifact merits special consideration. If seizures
are a strong consideration, using an expanded montage may be helpful.
FIGURE 6.48. This is a 30-sec epoch demonstrating spikes.
I
dentifying spikes in a PSG viewed in 30-sec epochs is difficult
because artifacts can appear as spikes. With a restricted number of
EEG electrodes, localization of spikes is also very difficult. When
there is a suspicion of spikes in a PSG, the relevant section should be
reviewed in10-sec epochs. If the spikes appear epileptiform in the 10-
sec epochs, localization should not be attempted due to the small
number of EEG channels. Rather a standard EEG should be ordered.
If there is a high suspicion of epilepsy in a patient undergoing a PSG,
consideration should be given to applying a full set of EEG electrodes
CHAPTER 6
202
EPILEPTIC DISCHARGES
and acquiring an 18-channel EEG during the PSG. In the patient
shown above, there was no history of epilepsy and these sharp dis-
charges (
arrow) were seen on multiple occasions. Because of their
morphology, they raised the suspicion of epileptiform discharges and
were viewed in a10-sec epoch (see next sample).
Polysomnography
203
FIGURE 6.49. This is a 10-sec epoch demonstrating spikes.
H
ere the spikes noted in the previous sample are viewed in a 10-
sec epoch. Although the morphology can now be better
described as a spike and wave discharge (
arrow), no comment can be
made about localization. The amplitude appears to be the highest in
the Fp1-O2 derivation; however, this is because that derivation has
the longest interelectrode distance. The spike and wave discharge is
also seen in the EOG. Since it is in phase, it is not caused by an eye
movement. This patient underwent a 21 channel sleep-deprived EEG
a few days after the PSG and was noted to have generalized polyspike
and wave discharges.
CHAPTER 6
204
FIGURE 6.50. This is a 30-sec epoch demonstrating runs of spikes.
S
pikes can be difficult to differentiate from artifacts on a PSG due
to the 30-sec time window and restricted EEG montage. Steps
outlined previously can help differentiate epileptiform discharges
from other findings. In the figure above, bursts of 3- and 4-Hz dis-
charges (
arrows) were noted frequently during the PSG, particularly
in light stages of sleep.
Polysomnography
205
FIGURE 6.51. This is a 10-sec epoch demonstrating epileptiform discharges.
C
hanging the paper speed to 10 sec per epoch helps evaluate the
morphology of the spike discharge. This sample represents the
middle 10 sec of the previous sample. The discharges have polyspike
morphology (arrow) and clearly look epileptiform. However, an
epileptiform appearing PSG should be followed by an EEG to confirm
that the patient has epileptiform discharges.
CHAPTER 6
206
Many other patterns can be seen on PSG. Some have diagnostic significance, while
others do not.The presence of some findings may support additional testing.
FIGURE 6.52. This is a 30-sec epoch demonstrating alpha-delta sleep pat-
tern. The alpha activity can be seen overriding the delta waves (arrow).
I
n the alpha-delta sleep pattern there is persistence of alpha fre-
quency activity in NREM sleep. The distribution of the alpha activ-
ity is more pervasive than normal alpha rhythm, and the frequency is
usually slower. Underlying sleep spindles, K complexes, and delta
waves confirm the true stage of sleep. Earlier studies noted the occur-
rence of this pattern in patients with chronic pain syndromes,
fibromyalgia, and nonrestorative sleep. However, more recently, this
association and the significance of alpha delta sleep have been ques-
Polysomnography
207
MISCELLANEOUS FINDINGS
tioned. In the author’s practice, when this pattern is seen, it is
described, but no clinical significance is attributed.
CHAPTER 6
208
FIGURE 6.53. This is a 10-sec epoch of alpha-delta sleep; it is the first 10
sec of the previous sample.
T
his sample is displayed at a paper speed of 30 mm/sec. It clearly
shows 10-Hz activity superimposed on slower delta frequencies
(
arrow). When alpha frequencies are seen in non-REM sleep, it is
often useful to change the paper speed to 30 mm/sec to better visual-
ize the various frequencies present and determine the correct stage of
sleep. Based on the underlying delta activity, this epoch was scored as
stage III.
Polysomnography
209
FIGURE 6.54. This is a 30-sec epoch demonstrating increased EMG activity
during REM sleep creating excessive EMG tonic activity (thin arrow) in the
chin channel during REM sleep. REM sleep is manifest during this epoch by a
low-amplitude, mixed-frequency EEG activity (thick arrow).
I
n REM sleep, there is muscle atonia. This is manifest on PSG with
the chin EMG activity at its lowest level of any stage of sleep. REM
sleep behavior disorder (RBD) is a REM sleep parasomnia that occurs
due to loss of the normal muscle atonia in REM sleep. This is mani-
fest by an increase in phasic and tonic EMG activity during REM
sleep. Soon after the EMG activity starts, the patient has a spell of
yelling and movement (as noted by the technologist). This is manifest
by EMG artifact (
dashed arrows) in the above example. Immediately
after the episode, the patient returns to sleep.
CHAPTER 6
210
FIGURE 6.55. This is a 30-sec epoch demonstrating bruxism.
B
ruxism can occur in both NREM and REM sleep. It manifests on
PSG as bursts of EMG activity best seen in the temporal or ear
leads due to their proximity to the jaw. By virtue of their location
under the mandible, the chin EMG electrodes do not record the bursts
of activity as well as the temporal electrodes. The EMG activity asso-
ciated with bruxism occurs at a rate of 1 Hz and each burst lasts at
least 5 sec. Chewing artifact can appear similar; however, it is not seen
in sleep and usually lasts longer than bruxism. In the example above,
the burst of EMG activity is noted best in the temporal and ear elec-
trodes (thin arrows). Note that the patient is in stage II sleep, and the
burst of EMG activity occurs at a rate of approximately 1 Hz, mak-
ing it consistent with bruxism. Minimal activity is not noted in the
chin EMG lead (thick arrow).
Polysomnography
211
FIGURE 6.56. This is a 30-sec epoch demonstrating chewing artifact. Note
that the frequency of the artifact varies from 1 per second (thin arrows) to
about 2 per second (thick arrows).
C
hewing results in EMG artifact in EEG electrodes. Like bruxism,
this activity is best noted in temporal and ear electrodes because
of their proximity to the mandible. However, at times, all electrodes
may be involved. The patient is awake during chewing; however, due
to the pervasive nature of the artifact, recognizing the underlying EEG
may be difficult. The frequency of the artifact is more variable than
bruxism. In this sample, a high-amplitude EMG artifact is seen in all
EEG channels, as well as in chin EMG and EOG channels. Although
difficult to tell from the EEG, the patient is awake (as noted on video).
CHAPTER 6
212
FIGURE 6.57. This is a 30-sec epoch demonstrating a ballistocardiographic
artifact that is noted in the thoracic channel. The nature of this artifact can be
confirmed by noting its synchrony with the ECG (lines).
B
allistocardiographic artifacts occur when there is movement of
electrodes induced by cardiac or vascular pulsations.
Consequently, this artifact is always harmonious with the cardiac
rhythm. Ballistocardiographic artifact can be seen in any channel and
is particularly common in EEG leads. This is particularly likely if the
electrode has been placed on or near a blood vessel. Thoracic and
abdominal belts used to monitor respiratory effort can also show bal-
listocardiographic artifact from pulsations of the heart and aorta.
This artifact should not be confused with the presence of respiratory
effort as the deflections occur at a faster rate than those associated
with respirations.
Polysomnography
213
FIGURE 6.58. This is a 30-sec epoch demonstrating frequent eye blinks.
T
he eye acts as an electrically charged dipole with the cornea being
positive relative to the electronegativity of the retina. Whenever
the eye moves, the electrical charge is recorded by not only the EOG
but also nearby EEG leads (i.e., Fp1). In the example above, wakeful-
ness is noted with frequent eye blinks. They produce an out of phase
deflection in the eye leads (
thin arrows). A high-amplitude discharge
is noted in the Fp1-O2 channel as well (
thick arrow). This deflection
does not suggest that the discharge is produced by the brain and
instead, the proximity of the Fp1 electrode to the eye is what results
in the deflection.
CHAPTER 6
214
FIGURE 6.59. This is a 30-sec epoch demonstrating an electrical artifact in
both leg leads.
I
f electrodes are not applied securely, they can be dislodged during
the study. This produces an impedance mismatch between two elec-
trodes and compromises the common mode rejection ratio of the dif-
ferential amplifier. The result of this is presence of 60-Hz or other
electrical noise in the channel. In this sample, frequent leg movements
resulted in slight dislodgement of one electrode on each leg. The
impaired electrode contact with skin resulted in an impedance mis-
match and a 60-Hz artifact in the leg leads. Subsequent leg move-
ments could not be reliably recorded because of the artifact.
Polysomnography
215