Handbook of EEG interpretation - part 9 ppt
Bạn đang xem bản rút gọn của tài liệu. Xem và tải ngay bản đầy đủ của tài liệu tại đây (1.29 MB, 29 trang )
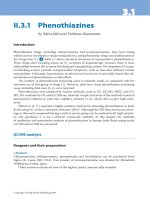
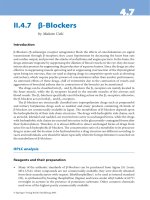
FIGURE 6.63. This is a 30-sec epoch of an MSLT showing a SOREMP.
I
n addition to noting the sleep-onset latency, whether or not REM
sleep occurs must also be noted for each MSLT nap. The number
of naps with SOREMP should be noted. If two or more naps have
SOREMP, the study is considered suggestive of narcolepsy. The mean
sleep latency is less than 5 min in narcolepsy. In the figure above,
rapid eye movements start in the seventh second (
thin arrows).
Simultaneously, the EEG changes to mixed-frequency activity (
thick
arrow
) noted in REM sleep. The chin EMG is lower than the remain-
der of the record (
dashed arrow) This nap is scored as a SOREMP.
CHAPTER 6
220
ADDITIONAL RESOURCES
AASM. Sleep-related breathing disorders in adults: recommendations for syn-
drome definition and measurement techniques in clinical research. The
Report of an American Academy of Sleep Medicine Task Force. Sleep
199;22(5):667–689.
Arand D, Bonnet M, Hurwitz T, et al. The clinical use of the MSLT and MWT.
Sleep 22005;8(1):123–144.
ASDA. EEG arousals: scoring rules and examples: a preliminary report from
the Sleep Disorders Atlas Task Force of the American Sleep Disorders
Association. Sleep 1992;15(2): 173–184.
ASDA. Recording and scoring leg movements. The Atlas Task Force. Sleep
1993;16(8):748–759.
Berry RB, Geyer JD, Carney PR. Introduction to sleep and sleep monitoring—
the basics. In: Carney PR, Berry RB, Geyer JD, eds. Clinical Sleep
Disorders. Lippincott Williams & Wilkins, Philadelphia, 2005:3–26.
Carskadon MA, Dement WC, Mitler MM, et al. Guidelines for the multiple
sleep latency test (MSLT): a standard measure of sleepiness. Sleep
1986;9(4):519–524.
Gillis AM, Flemons WW. Cardiac arrhythmias during sleep. In: Kryger MH,
Roth T, Dement WC, eds. Principles and Practice of Sleep Medicine. 2nd
ed. Saunders, London, 1994;847–860.
Littner MR, Kushida C, Wise M, et al. Practice parameters for clinical use of
the multiple sleep latency test and the maintenance of wakefulness test.
Sleep 2005;28(1):113–121.
Mitler MM, Poceta S, Bigby BG. Sleep scoring technique. In: Chokroverty S,
ed. S
leep Disorders Medicine: Basic Science, Technical Considerations, and
Clinical Aspects. 2nd ed. Butterworth Heinemann, Boston, 1999:245–262.
Parisi RA. Respiration and respiratory function: Technique of recording and
evaluation. In: Chokroverty S, ed. Sleep Disorders Medicine: Basic Science,
Technical Considerations, and Clinical Aspects. 2nd ed. Butterworth
Heinemann, Boston, 1999:215–221.
Radtke RA. Sleep disorders: laboratory evaluation. In: Ebersole JS, Pedley TA,
eds.
Current Practice of Clinical Electroencephalography. 3rd ed.
Lippincott Williams & Wilkins, Philadelphia, 2003:803–832.
Rechtschaffen A, Kales A, eds. A manual of standardized terminology, tech-
niques and scoring system for sleep stages of human subjects. Los Angeles,
UCLA Brain Information Service/Brain Research Institute, 1968.
Polysomnography
221
Shamsuzzaman AS, Gersh BJ, Somers VK. Obstructive sleep apnea: implica-
tions for cardiac and vascular disease. JAMA 2003;290(14):1906–1914.
Shepard JWJ. (1991). Atlas of Sleep Medicine. Futura, Mount Kisco, NY,
1991.
Wittig RM, Zorick FJ, Blumer D. Disturbed sleep in patients complaining of
chronic pain. J Nerv Ment Dis 1982;170(7):429–431.
CHAPTER 6
222
223
CHAPTER 7
Neurophysiologic
Intraoperative
Monitoring
AATIF M. HUSAIN
N
europhysiologic intraoperative monitoring (NIOM) is
increasingly being used to reduce neurologic morbidity asso-
ciated with surgeries that are performed where the nervous
system is at risk. NIOM allows assessment of neurologic function
when the patient cannot be examined. Often the neurophysiologist is
able to alert the surgeon of impending injury and potential neurologic
sequelae, allowing the surgeon to modify or reverse the procedure.
Several techniques can be used to monitor the integrity of the nervous
system during surgery, and these are chosen depending on the part of
the nervous system that is at risk and type of surgery. Common
modalities utilized during NIOM include brainstem auditory evoked
potentials (BAEP), somatosensory evoked potentials (SEP), transcra-
nial electrical motor evoked potentials (MEP), electromyography
(EMG), and electroencephalography (EEG). Often more than one
modality is used; this is known as multimodality monitoring. In this
chapter, each modality is shown separately for illustration purposes,
although in clinical practice many different types of monitoring tech-
niques are used simultaneously.
Brainstem auditory evoked potential (BAEP) monitoring is used whenever there is
potential for injury to the vestibulocochlear nerve or its pathways. Microvascular
decompression (MVD) for trigeminal neuralgia, hemifacial spasms, and cerebellopon-
tine angle (CPA) tumor surgery often utilize BAEP monitoring intraoperatively,
although it may also be used during other types of brainstem surgery. BAEP moni-
toring ipsilateral to the side of surgery has been shown to reduce the incidence of
hearing loss associated with MVD surgeries. Changes in the latencies and amplitudes
of the wave I and wave V from baseline are observed.The contralateral median nerve
somatosensory evoked potential (SEP) is also periodically monitored to evaluate
conduction in the dorsal column pathways in the brainstem that lie close to the
vestibulocochlear pathway. Multimodality monitoring is particularly useful in CPA
tumor surgery, and periodically, the contralateral BAEP and ipsilateral median SEP
are also checked for comparison purposes.
CHAPTER 7
224
BRAINSTEM AUDITORY EVOKED POTENTIALS
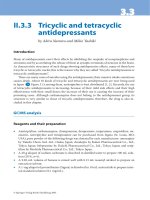
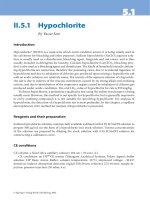
FIGURE 7.1. Intraoperative BAEP monitoring (right ear stimulation) show-
ing no significant change in the latency and amplitude of wave V (thick arrow)
during microvascular decompression (MVD) surgery for right trigeminal neu-
ralgia. Note the stimulation parameters at the bottom of the graph (
thin
arrows). The vertical line is drawn on the wave V. Notice the consistency with
which the wave V falls on this line, indicating no significant change in latency.
Neurophysiologic Intraoperative Monitoring
225
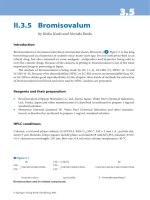
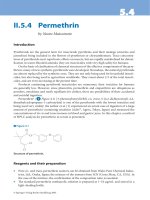
FIGURE 7.2. Intraoperative BAEP monitoring data in a patient undergoing
MVD for right trigeminal neuralgia that shows an increase in wave V latency
and a 50% decrease in amplitude.
D
uring BAEP monitoring a wave V latency prolongation of 1 msec
or an amplitude decrement of 50% is considered significant. The
latency shift is considered more important. Three possible mecha-
nisms can cause a change in the BAEP; first are technical issues, then
global physiological changes (anesthesia or blood pressure fluctua-
tion), and finally surgically induced change. During MVD surgery the
cerebellum is retracted to expose the CPA, which may cause a stretch
injury to the vestibulocochlear nerve and hearing loss if severe. In the
figure above, waves I (
thin arrow) and V (thick arrow) are initially
identified. Soon after placement of the cerebellar retractor, there is
prolongation of the wave V latency (notice the dot placed on the peak
of wave V at baseline). The maximum latency prolongation is 0.6
msec, which does not reach the critical 1-msec point at which the sur-
geon must be alerted (
dashed arrows), however, there is a significant
decrease in the amplitude (>50%) (
dotted arrow). The surgeon is
CHAPTER 7
226
alerted, and he repositions the cerebellar retractor. When the retractor
is removed, the wave V gradually returns to baseline (
dash and dot
arrow
). The return of the BAEP to near baseline suggests that perma-
nent damage to the vestibulocochlear pathway ipsilateral to the side
of surgery did not occur.
Neurophysiologic Intraoperative Monitoring
227
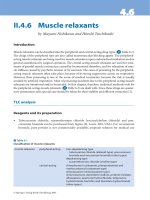
FIGURE 7.3. Intraoperative BAEP monitoring data in a patient undergoing
resection of a left acoustic neuroma showing a wave V latency prolongation of
1.5 msec and amplitude reduction of more than 50%.
A
1-msec prolongation of wave V latency is considered significant,
and the surgeon should be alerted. A persistent 1 msec or wors-
ening latency shift is more likely to be associated with postoperative
hearing loss. More recent data suggest that even smaller latency shifts
may be clinically significant in patients with CPA tumors. In the fig-
ure above, notice that the vertical line is over the wave V at baseline;
at the time of tumor dissection, there is maximal shift of the wave V
(
thin arrow). By the end of the surgery, the latency of wave V is close
to baseline signified by the vertical line (
thick arrow). Presence of
wave I at the time of maximal wave V shift verifies the adequacy of
stimulation (
dashed arrow).
CHAPTER 7
228
FIGURE 7.4. Intraoperative BAEP monitoring showing loss of wave V dur-
ing left CPA tumor dissection without return by the end of the surgery.
T
he loss of the wave V waveform is most severe type of change
that can occur with intraoperative BAEP monitoring. If it does
not return by the end of the surgery, the patient is likely to have post-
operative hearing loss. However, the loss of the wave V is not incom-
patible with preserved hearing (false-positive). When complete loss of
wave V occurs suddenly, it is usually due to interruption of the vascu-
lar supply of the vestibulocochlear nerve. If the loss is gradual, the eti-
ology is more likely to be either mechanical or thermal trauma to the
nerve. In the figure above, there is a robust wave V at the start of the
case (thin arrow); however, as dissection proceeds there is gradual loss
of amplitude (
thick arrow) and eventually complete loss of wave V
(
dashed arrow) that does not return by the end of the surgery. The
preserved wave I (
dotted arrow) confirms that this change is not due
to technical reasons.
Neurophysiologic Intraoperative Monitoring
229
FIGURE 7.5. Intraoperative BAEP monitoring during MVD for right trigem-
inal neuralgia showing loss of wave V with return by the end of the surgery.
T
ransient loss of wave V followed by recovery before the end of
the surgery suggests that hearing will be preserved. This is espe-
cially true in patients undergoing MVD surgery. In the figure above,
wave V is noted at baseline (thin arrow); however, with cerebellar
retraction there is gradual latency prolongation up to 0.7 msec with
amplitude reduction (
thick arrow) and eventual disappearance
(
dashed arrow). When the surgeon is notified and the retractor is
removed, there is a gradual return of wave V (
dotted arrow).
CHAPTER 7
230
FIGURE 7.6. Intraoperative BAEP monitoring data showing loss of wave V
during the noise associated with the use of a bone drill.
I
n addition to surgically induced changes, BAEP changes can occur
due to technical issues and physiological changes. One such techni-
cal issue arises with bone drilling during exposure. The drill makes a
loud noise that can mask the acoustic stimulus of the BAEP. This may
cause loss of the BAEP waveforms. It is recommended that BAEP
averaging be suspended during drilling. In the example above, BAEP
averaging is continued during drilling. Note the lower amplitude wave
V waveform (
thin arrow). Before and after drilling, the wave V wave-
form is robust.
Neurophysiologic Intraoperative Monitoring
231
FIGURE 7.7. Intraoperative BAEP monitoring showing loss of wave V soon
after draping the patient undergoing MVD for right trigeminal neuralgia.
M
any technical problems can lead to loss of BAEP waveforms
such as inadequacy of stimulation. A relatively common cause
is kinking or clamping of the tubing used to transmit the acoustic
stimulus from the sound generator to the ear. Obstruction of this tub-
ing prevents the clicks from reaching the auditory system, and conse-
quently a BAEP is not produced. After positioning the patient in the
example above, the baseline response was obtained and revealed a
robust wave V waveform (
thin arrow). Soon after draping the patient,
however, there was a sudden loss of the wave V (
thick arrow) as well
as wave I (
dashed arrows). The absence of all BAEP waveforms sug-
gested inadequacy of stimulation. After the clamps of the drape were
removed, the BAEP response returned (
dotted arrow).
CHAPTER 7
232
FIGURE 7.8. Intraoperative BAEP monitoring showing latency prolonga-
tion and amplitude decrement of the wave V toward the end of the surgery due
to technical problems of stimulating electrode dislodgement from the ear.
T
he auditory stimulator can be inadvertently dislodged during sur-
gery. This is more likely to occur when the surgery is prolonged.
When the stimulating electrode is dislodged, there is a lower stimulus
intensity delivered to the ear to produce the BAEP. Consequently, the
BAEP may demonstrate an artifactual prolongation of the latency and
reduction of the amplitude as the electrode becomes further removed
from the canal. In the example above, there is gradual prolongation
of latency and a drop in amplitude of the wave V waveform toward
the end of the surgery (
thin arrow). At the end of the surgery, the tech-
Neurophysiologic Intraoperative Monitoring
233
nologist confirmed that the stimulator tubing had been dislodged.
Note that as the wave V disappears, so does the wave I, indicating a
peripheral etiology for the change (
thick arrow).
CHAPTER 7
234
Somatosensory evoked potential (SEP) monitoring is utilized for demonstrating the
integrity of the large-fiber sensory tracts. During surgery, upper and lower SEPs may
be used to detect changes in dorsal column function of the posterior spinal cord.
Anesthesia, blood flow, and technical constraints may directly impact and produce
changes in amplitude and/or latency of SEPs.
FIGURE 7.9. Intraoperative median and tibial SEP monitoring data that
shows no significant change during posterior spinal fusion for scoliosis.
Median nerve SEPs are used as a control.
S
omatosensory evoked potential monitoring is most often used for
monitoring spinal cord function, however it can also be used dur-
ing surgeries on the brainstem and thoracic aorta. In scoliosis surgery,
SEP monitoring has been shown to result in reduced neurological
morbidity. SEPs obtained through posterior tibial nerve stimulation
are used when surgery involves risk to the spinal cord below the lower
cervical level. In such cases, median nerve SEPs can be used as a con-
trol. For surgeries involving risk to the upper to mid-cervical spinal
Neurophysiologic Intraoperative Monitoring
235
SOMATOSENSORY EVOKED POTENTIALS
cord, median or ulnar SEP is used (ulnar preferentially used if C6 to
C7 region is at risk). Subcortical (P14/N18 for upper, P31/N34 for
lower) and cortical (N20 for upper, P37 for lower) waveforms are fol-
lowed during surgery. SEPs monitor the posterior aspect of spinal cord
(dorsal columns) and therefore, are often done in conjunction with
additional types of monitoring (i.e., motor evoked potentials). In
Figure 7.9, both subcortical median and posterior tibial SEPs (P14,
thin arrows; P31, dashed arrows) seen in the first and third columns
and cortical (N20,
thick arrows; P37, dotted arrows) noted in the sec-
ond and fourth columns are displayed. When no significant changes
in the responses are noted, neurological morbidity is not anticipated.
CHAPTER 7
236
FIGURE 7.10. Intraoperative median SEP monitoring showing gradual loss
of the subcortical and cortical waveforms after right sided stimulation in a
patient undergoing decompression of syringomyelia.
A
significant change in SEP is a 50% decrease in amplitude or a
10% increase in latency. Unlike BAEPs, with SEPs an amplitude
change is more significant. When such a change occurs, and technical
and general physiological causes have been excluded, the surgeon
should be alerted. In the figure above, note the median SEP subcorti-
cal responses (first and third columns) and cortical responses (second
and fourth columns) are displayed. At the start of the case, robust sub-
cortical (
thin arrows) and cortical (thick arrows) responses are seen.
As surgery continues, there is a gradual loss of amplitude of the sub-
cortical (
dashed arrow) and cortical (dotted arrow) waveforms
obtained after right-sided stimulation. At the end of surgery, these
responses are almost completely lost (
circles). The patient is likely to
have postoperative dysfunction that involves the sensory pathways
mediated by the dorsal columns of the right median nerve.
Neurophysiologic Intraoperative Monitoring
237
FIGURE 7.11. Intraoperative posterior tibial SEP monitoring data showing
transient loss of the cortical waveform after right tibial nerve stimulation in a
patient undergoing a posterior spinal fusion for scoliosis.
D
uring scoliosis surgery implantation of hardware (sublaminar
wires and hooks) and distraction can lead to spinal cord injury.
Monitoring SEP allows determination of when such compromise is
imminent. In the figure above, cortical (P37) waveforms (
thin arrows)
are seen at the start of distraction from right tibial nerve stimulation.
However, shortly thereafter, the cortical response has a decrease in
amplitude and becomes difficult to identify (
thick arrow), and the sur-
geon is alerted. After the surgeon reverses the distraction, the
responses improve (
dashed arrow). Without SEP monitoring the sur-
geon would not have been aware of the spinal cord compromise, pos-
sibly leading to neurological morbidity.
CHAPTER 7
238
FIGURE 7.12. Intraoperative tibial SEP monitoring showing gradual loss of
the cortical waveforms with use of halogenated anesthetics in a patient under-
going surgery for scoliosis.
T
here are many systemic factors that can affect SEP. One of the
most common is anesthetics. Cortical waveforms, particularly the
tibial SEP, are very sensitive to inhalation (halogenated agents and
nitrous oxide) anesthetics. Concentrations of 1 minimum alveolar con-
centration (MAC), or above can eliminate the cortical responses.
Subcortical responses are more resilient to anesthetics and often can be
followed in cases in which such anesthetics are required. In the exam-
ple above, when isoflurane 0.3 MAC is initially used, well-defined sub-
cortical (
thin arrows) and cortical (thick arrows) responses are seen.
However, when the isoflurane is increased to 2 MAC, there is obliter-
ation of the cortical response bilaterally (
circles). Notice that the sub-
cortical responses persist despite the increase in anesthetics (
dashed
arrows
). The first and fourth columns are the popliteal fossa (PF)
responses (
dotted arrow), which indicates adequacy of stimulation.
Neurophysiologic Intraoperative Monitoring
239
FIGURE 7.13. Intraoperative tibial SEP monitoring showing intermittent
loss of cortical and subcortical waveforms with fluctuating blood pressure in a
patient undergoing posterior spinal fusion for scoliosis.
A
reduction in blood pressure can affect the SEP waveforms, caus-
ing a decrease in amplitude of the cortical and subcortical poten-
tials. This is likely due to hypoperfusion of the spinal cord. In the
figure above, the first and third columns display the cortical (P37)
waveforms, while the second and fourth columns display the subcor-
tical (P31/N34) waveforms. When the mean arterial pressure (MAP)
is about 70 mm Hg, both cortical (
thin arrows) and subcortical (thick
arrows
) waveforms are seen. However, when the pressure drops to
about 50 mm Hg, there is significant amplitude reduction of the wave-
forms (
circles). When the pressure is raised, the responses return
(
dashed arrows). In this patient, monitoring directs the anesthesiolo-
gist to maintain a relatively higher MAP.
CHAPTER 7
240
FIGURE 7.14. Intraoperative tibial SEP monitoring showing poor repro-
ducibility of the subcortical waveforms and preserved cortical waveforms with
wearing off of neuromuscular blocking agents in a patient undergoing anterior
cervical decompression and fixation for spinal stenosis.
S
ubcortical SEPs are smaller potentials than cortical responses and
are harder to resolve with averaging. With EMG contamination,
subcortical waveforms are even more difficult to obtain.
Consequently, if patients are not given neuromuscular-blocking agents
or higher doses of anesthetic gases during surgery, often the subcorti-
cal waveforms cannot be clearly seen. With neuromuscular-blocking
agents, even though SEP subcortical waveforms can be easily resolved,
MEP cannot be used. On the other hand, with higher doses of anes-
thetic gases, although there is less EMG, the SEP waveforms’ ampli-
Neurophysiologic Intraoperative Monitoring
241
tude may be reduced, particularly the cortical waveforms. In the
example in Figure 7.14, neuromuscular-blocking agents were initially
used for intubation with both the subcortical (
thin arrows) and corti-
cal (
thick arrows) responses identified. Neuromuscular-blocking
agents were then discontinued because of the anticipated use of motor
evoked potentials (MEP) that are sensitive to these agents. With
return of the myogenic artifact, subcortical waveforms became harder
to resolve and “noisy” (
dashed arrows), although the cortical wave-
forms remained robust (
dotted arrows).
CHAPTER 7
242
FIGURE 7.15. Intraoperative median SEP used to localize the central sulcus
in a patient with left facial pain undergoing stimulator placement.
S
EP has been used diagnostically to localize the central sulcus in
patients undergoing neurosurgery near the motor strip. It has also
been used for patients undergoing therapeutic stimulator implanta-
tions for facial pain. Recording from at least eight contacts is optimal
from the exposed cortex. Contralateral median nerve SEPs are
obtained sequentially from the various contacts on a grid or a strip
placed across a sulcus. An N20 waveform is seen over the somatosen-
sory cortex, while a P22 (sometimes called the P20) waveform is seen
over the motor cortex. The N20 and P22 produce a “phase reversal.”
The central sulcus is thought to reside between the electrodes generat-
ing the highest amplitude N20/P22 complex. In the figure above, there
are robust N20 (
thin arrow) and P22 (thick arrow) waveforms that
phase reverse at contacts 7 and 8. The central sulcus located beneath
and between these contacts.
Neurophysiologic Intraoperative Monitoring
243
FIGURE 7.16. Intraoperative tibial SEP monitoring showing the loss of both
PF (first and third column) and P37 (second and fourth column) waveforms
after left-sided stimulation in a patient undergoing a thoracic laminectomy for
excision of an extradural spinal lesion.
T
echnical issues must also be considered whenever there is a
change in waveforms. Whereas physiological changes, such as
anesthetic and blood pressure changes, are more likely to affect all
SEP responses, technical issues are more likely to produce more
restricted waveform changes. In the example above, robust PF (
thin
arrows
) and P37 (thick arrows) responses are initially seen bilaterally.
At 15:51:17 mild latency prolongation of the P37 after left tibial nerve
stimulation is noted (
dashed arrow) with an ipsilateral PF amplitude
reduction (
dotted arrow) progressing to complete absence of both the
CHAPTER 7
244