báo cáo khoa học: "Growth curves of highly inbred lines of fowl and their F hybrids 1 HYÁNEK R. ŠILER Milena VILHELMOVÁ" ppsx
Bạn đang xem bản rút gọn của tài liệu. Xem và tải ngay bản đầy đủ của tài liệu tại đây (874.85 KB, 26 trang )
Growth
curves
of
highly
inbred
lines
of
fowl
and
their
F1
hybrids
Helena
KNÍ&jadnr;ETOVÁ
B.
KNÍ&jadnr;E,
J. HYÁNEK
R. ŠILER
Ludmila
HYÁNKOVÁ
J. PLACHÝ
Milena
VILHELMOVÁ
Department
of
Experimental
Zoology,
Charles
University,
Vini!ná
7,
128
44
Prague
2,
Czechoslovakia
*
Institute
of Animal
Production,
251
61
Prague
10-Uhiin!ves
**
Institute
of Molecular
Genetics,
C
SAV,
Flemingovo
2,
160
00
Prague
6
Summary
Growth
curves
based
on
the
Richards
function
are
evaluated
for
four
highly
inbred
tines
of
fowl
(F,
>
99.9
p.
100)
and
some
of
their
F,
hybrids.
The
largest
deviations of
the
estimated
course
of
growth
(maximum :
9.3
p.
100)
in
terms
of
live
weight
occurred
before
6
weeks
of
age ;
inbred
and
hybrid
groups
showed
a
tendency
to
deviate
in
opposite
direction
as
a
result
of
differences
in
adaptive
behaviour
during
the
posthatching
period.
Another
deviation
in
some
groups
was
an
overestimation
of
the
asymptote
in
relation
to
the
observed
values
for
final
weight.
Interline
differences
occurred
in
age
and
weight
at
the
inflection
point,
the
asymptotic
weight,
the
shape
of
the
curve
and
the
parameters
of
the
growth
rate.
The
overall
eva-
luation
of
lines
and
hybrid
combinations
showed
that,
except
for
the
proportion
of
asymp-
totic
weight
reached
at
the
inflection
point,
the
genetic
variation
in
these
parameters
was
relatively
high.
Several
F, hybrids
showed
significant
heterosis
in
growth
rate
and
in
weight,
whereas
the
shift
of
the
inflection
point
to
an
earlier
age
was
mostly
insigni-
ficant.
Key
words :
Chicken,
inbred
lines,
growth
curves,
heterosist
Résumé
Courbes
de
croissance
de
lignées
de
volailles
hautement
consanguines
et
de
leurs
hybrides
F,
Des
courbes
de
croissance
dérivées
de
la
fonction
de
Richards
ont
été
établies
dans
4
lignées
de
volailles
hautement
consanguines
(F
x
>
99,9
p.
100)
ainsi
que
chez
certains
de
leurs
croisements
F1.
Les
écarts
les
plus
importants
en
termes
de
poids
vif
entre
crois-
sance
réelle
et
estimée
(maximum
9,3
p.
100)
se
manifestent
jusqu’à
un
âge
de
6
semaines.
Les
écarts
tendent
à
être
de
sens
opposé
chez
les
individus
consanguins
et
les
hybrides
suite
à des
comportements
adaptatifs
différents
au
cours
de
la
période
postérieure
à
l’éclosion.
Un
autre
type
d’erreur
relevé
dans
certains
groupes,
est
la
surestimation
de
l’asymptote
liée
aux
valeurs
observées
du
poids
final.
On
a
pu
mettre
en
évidence
des
différences
entre
lignées
pour
le
poids
et
l’âge
au
point
d’inflexion,
le
poids
estimé
par
l’asymptote,
la
forme
de
la
courbe de
croissance
et
les
paramètres
de
vitesse
de
croissance.
L’appréciation
générale
des
lignées
et
de
leurs
croisements
révèle
une
variabilité
génétique
relativement
élevée
des
paramètres
à
l’exception
de
la
fraction
du
poids
asymptotique
atteinte
au
point
d’inflexion.
Plusieurs
hybrides
Fi
manifestent
des
effets
d’hétérosis
significatifs
sur
la
vitesse
de
croissance
et
le
poids ;
toutefois,
le
décalage
du
point
d’inflexion
vers
un
âge
plus
précoce
observé
chez
les
F!,
s’avère
dans
la
plupart
des
cas,
non
significatif.
Mots
clés :
Volaille,
lignée.s
consanguines,
courbe
de
crois.sance,
hétéro.sis.
I.
Introduction
The
course
of
the
growth
of
most
mammals
and
birds,
expressed
as
a
weight
change
in
time,
is
described
by
an
asymmetric,
sigmoid-shaped
curve
with
an
inflection
point
where
the
autoacceleration
phase
passes
into
the
autoretardation
phase.
There
have
been
frequent
attempts
to
describe
the
growth
of
individuals
in
a population
or
in
lines
by
means
of
some
mathematical
function.
The
importance
of
the
deri-
vation
and
construction
of
curves
is
that
the
information
contained
at
a
number
of
points,
given
by
coordinates
of
weight
and
time,
can
be
summarized
in
several
generalizing
parameters.
The
irregular
fluctuation
of
weight
caused
by
random
envi-
ronmental
effects
is
eliminated
when
the
functions
are
expressed
graphically.
Another
advantage
to
growth
functions
is
the
prediction
of
animal
growth
rate,
the
determi-
nation
of
changes
in
the
shape
of
the
curves
in
the
course
of
selection,
and
the
application
of
derived
parameters
to
selection
trials.
Growth
curves
can
provide
infor-
mation
for
the
estimation
of
feed
requirements.
The
flexibility
of
the
growth
model,
i.e.
the
ability
to
comprehend
different
shapes
of
the
curve,
is
essential
in
choosing
the
function.
The
three
growth
functions
which
have
been
applied
most
extensively
to
animal
species
are
logistic,
Gompertz
and
Bertalanffy
curves.
R
ICHARDS
(1959)
has
shown
that
each
of
these
three
functions
is
a
special
case
in
a
general
family
of
growth
curves
which
differ
primarily
in
the
proportion
of
final
weight
at
which
the
inflection
point
occurs.
A
basic
requirement
for
a
mathematically
derived
growth
curve
is
a
measure
of
the
goodness
of
fit
to
actual
data.
The
authors
consider
this
essential
since
it
is
difficult
to
construct
a
curve
that
agrees
completely
with
the
actual
course
of
growth.
Most
of
the
functions
are
sensitive
to
the
frequency
and
regularity
of
data
on
both
weight
and
age.
As
a
rule,
a
monotonic
increase
in
weight
is
assumed
throughout
the
period
studied.
The
usual
tests
for
goodness
of
fit
involving
residual
variance
are
not
appro-
priate
to
longitudinal
data
because
of
correlated
errors
among
repeated
observations
over
time
(F
ITZHUGH
,
1976).
Despite
this,
some
authors
use
these
tests,
assuming
that
the
source
of
correlated
errors
influences
residual
variances
in
different
cases
in
a
similar
way
(EisEN
et
al.,
1969 ;
T!MOrr
&
ErsErr,
1969 ;
BROWN
et
al.,
1976).
Another
approach
to
fitting
a
growth
function
is
to
compare
observed
and
predicted
body
weights
at
important
points
of
the
curve
and
to
evaluate
the
inter-individual
variability
and
correlations
of
the
analogical
parameters
estimated
by
different
mathe-
matical
functions
(F
ITZHUGH
,
1976).
The
aim
of
the
present
study
was
to
characterize
the
growth
of
four
highly
inbred
lines
of
fowl
and
their
F,
hybrids
in
terms
of
the
Richards
function
and
to
analyze
the
differences
between
estimated
growth
curve
values
and
observed
weights.
The
genetic
aspects
of
growth
and
live
weight
(variability,
effects
of
additivity,
dominance,
sex
linkage,
maternal
effect,
etc.)
have
been
analyzed
in
two
of
these
lines
(C,
I)
and
their
hybrids
in
other
studies
(C
LOUGH
&
CocK,
1957 ;
COCK
&
M
ORTON
,
1963 ;
M
ORTON,
1973).
I1.
Material
and
methods
Growth
was
studied
in
chickens
of
four
highly
inbred
lines
(F!
>
99.9
p.
100)
C,
I
(Iowa),
W and
M
(Minor)
which
have been
characterized
in
detail
by
F
ESTING
(1979).
Lines
C,
I
and
W
were
derived
from
White
Leghorns
by
sib
mating
at
the
Northern
Poultry
Breeding
Station,
Reasehealt,
Cheshire,
starting
in
1932.
Line
C
was
developed
from
a
pair
of
WL
purchased
from
a
commercial
breeder.
Line
I
was
obtained
from
a
group
of
three
males
and
five
females
inbred
WL
imported
from
Iowa
State
Uni-
versity
in
1937.
Line
W
originated
as
a
British
commercial
line
WL ;
a
colour
variant
with
barring
pattern,
that
appeared
in
1941,
was
subsequently
fixed.
Finally,
line
M
was
established
in
1956
at
the
Czechoslovak
Academy
of
Sciences
from
Black
Minor
and
maintained
by
brother
X
sister
mating.
Of
the
Fl
hybrids,
groups
I
X
C,
I
X
W,
I X
M,
W X C,
M X C
and
M
X
W
(sire
line
X
mother
line)
are
represented
in
the
present
trial.
With
regard
to
demand
on
the
same
hatching,
the
numbers
of
birds
in
inbred
lines
and
hybrids
were
low
(C -
55,
I -
23,
W -
26
and
M -
25).
In
total,
the
F
hybrids
were
represented
by
79
cocks
and
77
hens.
All
the
chicks
were
reared
in
litter
floor
pens
in
an
environmentally
controlled
room.
The
diet
contained
19.3
p.
100
protein
and
11.82
MJ
(2 823
kcal)
ME/kg.
Both
feed
and
water
were
provided
ad
libitum.
Until
the
age
of
10
weeks
the
chickens
were
weighed
at
7-day
intervals
and,
in
the
subsequent
period,
at
intervals
of
2
weeks
(up
to
32
weeks
in
hybrids
and
36
weeks
in
lines).
The
records
up
to
the
end
of
the
studied
period
were
not
used
in
some
cases
to
calculate
the
growth
curve
parameters
of
pullets
and
we
only
used
data
up
to
the
first
decline
of
live
weight
because
applying
mathematical
growth
functions
supposes
a
monotonic
live
weight
increase.
Since
laying
began
in
most
groups
before
we
had
finished
weighing
the
birds,
usually
a
decrease
of
live
weight
is
seen.
The
changes
in
the
weight
of
each
individual
during
postnatal
growth
were
expressed
by
the
four-parameter
Richards
function
(R
ICHARDS
,
1959) :
The
parameters,
estimated
using
the
generalized
least-squares
method,
are
the
following :
yt
-
body
weight
(grams)
and
age
t
(days),
A -
asymptotic
value
of
size
as
t !
oo ;
generally
interpreted
as
average
size
at
maturity
independent
of
short-term
fluctuation
of
size in
response
to
extraneous
environmental
effects,
b -
integration
constant ;
time
scale
parameter
of
no
specific
biological
signi-
ficance,
k -
rate
at
which
a
logarithmic
function
of
degree
of
maturity
in
body
weight
changes
linealy
per
unit
of
time ;
this
rate
estimates
the
maturation
rate
of
the
curve
(i.e.
the
relative
rate
at
which
A
is
reached),
n -
shape
parameter
determining
the
position
of
the
inflection
point
of
the
curve.
In
the
original
Richards
function
it
was
designated
as
m (m =
n
+
1)
and
by
other
-
1
authors
as
M
(M =
-),
and
established
the
degree
of
maturity
in
body
weight
n
at
the
point
of
inflection.
If
n =
1,
the
function
is
logistic
(y
*
/A
=
0.5).
Cases
in
which
n -
0 (y
*
/A
=
0.368)
correspond
to
the
Gompertz
function
and
those
where
n
= —0,33
(y
*
/A
=
0.296)
correspond
to
the
Bertalanffy
function.
Weight
(y
*)
and
age
(t
*)
at
the
inflection
point
were
calculated
from
the
para-
meters
of
the
curve.
The
inflection
point
represents
mathematically
the
time
at
which
the
second
derivative
of
the
growth
curve
changes
from
positive
to
negative :
Further
derived
parameters
included
the
average
absolute
growth
rate
v
(g/day)
and
maximal
absolute
growth
rate
v*
(g/day
at
which
the
inflection
point
was
reached) :
The
coefficient
of
determination
R2
was
calculated
for
each
individual
growth
curve :
The
coefficient
of
determination
and
the
percentage
deviations
of
the
observed
values
of
weight
at
individual
points
of
the
curve
characterized
the
accuracy
of
curve
fit
to
the
observed
course
of
growth.
Animals
with
an
R2
<
0,99
were
eliminated
from
the
overall
analysis.
The
parameters
of
the
curves
of
the
inbred
lines
and
hybrid
combinations
were
evaluated
by
analysis
of
variance ;
the
differences
were
verified
by
the t-test.
The
Fl
hybrids
were
compared
with
the
parent
lines
and
deviations
from
mid-
parent
values
were
tested ;
the
significance
was
evaluated
using
W
EBER
’S
(1972)
formula :
In
the
many
cases
where
the
hybrids
exceeded
the
parent
line
with
the
higher
parameter
values,
i.e.
F1
>
max.
(P
I,
Pz)
the
differences
were
verified
by
the
t-test.
III.
Results
and
discussion
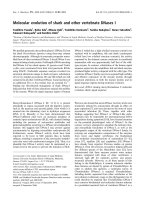
A.
The
course
of
growth
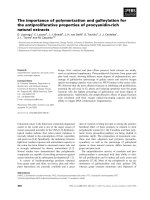
Changes
in
the
weight
of
chickens
in
individual
lines
and
in
hybrid
combinations
during
postnatal
development
are
illustrated
by
figure
1.
The
limited
number
of
individuals
in
each
group
does
not
allow
a
reliable
evaluation
of
differences
in
the
variability
of
lines
and
hybrids.
Nevertheless,
the
variability
of
weight
expressed
by
the
coefficients
of
variability
(tab].
1 )
seemed
to
increase
to
the
age
of
6-10
weeks
and
then
markedly
decrease.
The
expected
trend
to
lower
variability
in
the
weight
of
hybrids
compared
with
parent
lines
seemed
to
be
manifested
in
older
age
classes.
Differences
in
body
weight
between
the
sexes
steadily
increased
throughout
the
course
of
growth.
At
maturity,
the
cocks
of
individual
groups
reached
120
to
140
p.
100
of
the
weight
of
the
hens.
A
comparison
of
Fi
hybrids
of
both
sexes
with
the
parent
lines
showed
a
marked
heterosis
effect
(F
i
>
max.
Pi,
P !)
in
weight
at
2
weeks
of
age.
This
might
be
explained
as
a
better
adaptation
of
the
hybrids
in
the
period
after
hatching.
However,
as
seen
from
the
percentage
deviations
from
mid-parent
values
(tabl.
2),
the
relative
positions
of
different
hybrids
became
apparent
with
further
development,
particularly
in
terms
of
dependence
on
the
cross
combination.
B.
Fit
of
tlae
growth
function
The
difficulties
of
fitting
the
generalized
Richards
function
arise
mainly
from
the
high
correlation
(r1,
=
+
0.90)
between
the
constant
k
and
the
shape
parameter
of
the
curve
(T
IMON
&
E
ISEN
,
1969 ;
RuTr.EncE
et
al.,
1972).
In
our
trials
the
goodness
of
fit
of
the
growth
curves
was
measured
by
using
the
coefficient
of
determination
(R
2
),
by
evaluation
of
the
differences
between
the
estimated
asymptote
(A)
and
the
highest
weight
(A’)
observed
in
the
period
studied,
and
by
comparing
the
percentage
deviations
of
observed
weight
from
the
theoretically
determined
values
at
different
points
of
the
curve.
respect
to
the
determination
coefficient
of
individual
growth
curves
(R
2
>
0.99),
we
eliminated
a
higher
number
of
individuals
in
inbred
lines
(6.9
p.
100)
than
in
F,
hybrids
(1.3
p.
100)
from
the
overall
analysis.
K
IDWELL
et
al.
(1969)
also
report
that,
in
applying
the
Gompertz
function
to
mice,
more
inbred
animals
(3.9
p.
100)
than
hybrids
(0.2
p.
100)
had
to
be
eliminated.
One
explanation
of
these
results
might
be
the
higher
sensitivity
of
inbred
birds
to
randomly
changing
environmental
conditions
and
also
a
higher
fluctuation
of
gains
during
growth
(including
temporary
stagnation
or a
decrease
of
live
weight).
An
important
criterion
of
the
accuracy
of
the
estimated
curve
parameters
is
a
comparison
of
the
asymptote
(A)
with
the
highest
observed
weight
(A’).
The
data
in
table
3
show
that
percentage
deviations
from
the
estimated
asymptote
were
usually
higher
in
hybrid
combinations
than
in
inbred
lines.
A
comparison
of
the
different
groups
indicates
that
the
growth
curve
of
cockerels
of
inbred
lines
corresponds
to
the
type
3
function
(n
<
0)
in
only
5
p.
100
of
the
cases,
whereas
it
corresponds
in
hybrid
combinations
in
44
p.
100
of
the
individuals.
A
similar
situation
was
found
in
pullets
(18
p.
100
vs.
49
p.
100),
but
the
case
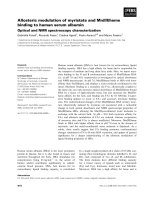
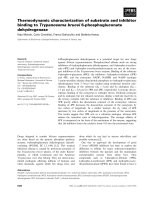
of the
Iowa
line
was
special.
When
weight
data
were
used
up
to
the
age
of
30
weeks
(practically
up
to
the
termination
of
growth)
to
calculate
parameters
of
the
curve,
the
asymptote
was
overestimated
by
10.4
p.
100.
When
all
the
data
were
used
(i.e.
up
to
36
weeks ;
the
Iowa
line
is
designated
by
I’),
the
estimate
of
A
was
improved
(the
difference
between
A
and
A’
was
reduced
to
3.7
p.
100)
but
the
determination
coefficient
was
much
lower
(0.9860
vs.
0.9957).
This
means
that
the
theoretical
curve
did
not
fit
the
observed
course
of
growth
(fig.
2).
The
main
reason
for
the
overestimation
of
asymptotic
weight
is
the
overall
character
of
growth
in
the
studied
period
as
expressed
by
shape
parameter
n.
This
parameter,
which
estimates
the
position
of
the
inflection
point
of
the
curve,
also
reflects
the
grade
of
sigmoid
curving.
In
growth
curves
with
less
sigmoid
curving,
i.e.
with
lower
values
of
n
(n
<
0),
the
estimated
value
of
the
asymptote
is
higher.
In
spite
of
that,
A
did
not
correspond
to
the
highest
observed
live
weight ;
in
the
case
of
a
given
estimated
n,
the
theoretical
growth
curve
gave
the
best
fit
for
the
observed
course
of
growth.
The
next
factor
influencing
the
estimation
of
A
are
irregularities
in
weight
when
the
animals
neared
maturity.
The
lines
were
considerably
different
in
the
age
at
sexual
maturity.
The
pullets
of
the
hybrid
groups
started
laying
eggs
substantially
earlier
(tabl.
4).
The
observed
weight
of
cocks
in
some
hybrid
combinations
fluctuated
in
the
final
phase
of
growth
due
to
their
social
behaviour.
In
addition
to
this,
we
noted
that
the
well-known
difficulty
in
estimating
final
weight
is
to
determine
the
proportion
of
physiologically
unessential
fat
(L
ILJEDAHL
,
1970
and
others).
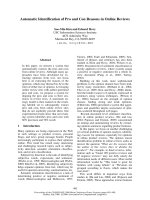
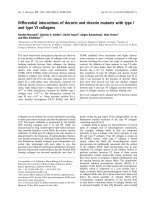
A
comparison
of
the
differences
between
estimated
and
observed
weight
in
chicks
of
inbred
lines
and
hybrid
combinations
during
the
studied
period
showed
that
the
greatest
deviations
were
recorded
in
the
initial
stage
of
postnatal
growth,
i.e.
up
to
about
6
weeks
of
age
(fig.
3).
The
differences
are
comparatively
low
(.!
1.5
p.
100)
in
the
region
of
the
inflection
point
and
this
trend
was
the
same
up
to
the
end
of
the
period
studied.
In
the
post-inflection
part
of
the
curve,
the
average
deviations
of
the
curve
did
not
usually
exceed ±
4
p.
100.
In
this
connection,
it
should
be
noted
that
deviations
of
observed
weights
ranging
between
- 7.1
and
+
5.2
p.
100
were
also
found
in
mice
after
the
goodness
of
fit
of
the
Gompertz
function
had
been
analyzed
(LAIRD
&
HOWARD,
1967).
evaluating
of
percentage
deviations
of
observed
weights
from
fitted
values
it
should
be
emphasized
that
conspicuous
differences
existed
between
inbred
lines
and
hybrid
combinations
(P
<
0.01,
P
<
0.05)
particularly
in
the
initial
phases
of
growth.
In
2-week
old
hybrids
of
both
sexes
the
theoretical
values
were
significantly
under-
estimated,
whereas
at
6
weeks
of
age
they
were
overestimated.
A
reverse
trend
was
found
in
inbred
chickens.
The
pronounced
positive
deviation
of
the
observed
weights
of
2-week
old
hybrids
seemed
to
be
related
to
heterosis
effect
during
this
period
(tabl.
2).
The
negative
deviation
of
inbred
chickens
could
be
attributed
to
their
low
ability
to
adapt
to
the
conditions
of
postnatal
life.
The
opposite
trend
(shown
by
deviations
at
the
age
of
6
weeks)
may
reflect
the
compensation
of
differences
arising
after
hatching.
Parameters
of
the
growth
curves
of
inbred
lines
and
hybrid
combinations
The
high
degree
of
inbreeding
(F
.
>
99.9
p.
100)
suggests
that
the
intraline
variability
in
growth
curve
parameters
could
be
ascribed
mainly
to
the
action
of
environmental
factors.
A
greater
genetically
determinated
variability
within
the
F1
hybrid
group
could
not
be
expected
either.
On
the
other
hand,
interline
differences
were
mainly
of
genetic
origin,
although
eventually
they
might
be
a
manifestation
of
the
genotype
X
environment
interaction.
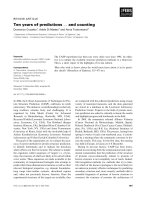
The
growth
curves
of
inbred
and
hybrid
groups
are
shown
in
figures
4-7
and
the
parameters
of
the
curves
are
summarized
in
tables
5-8.
The
shape
parameter
(n)
and
the
y*
/A
ratio
show
a
wide
range
of
values
for
individual
curves
(n
=-0.3
to
0.8
and
y*
/A =
0.279
to
0.480).
The
average
values
of
different
groups
are
within
the
range
n
= -0.100
to
0.271
and
y*
/A
=
0.347
to
0.410,
demonstrating
that
the
growth
of
chickens
can
generally
be
expressed
by
the
Gompertz
function
(y
*
/A
=
0.368).
This
function
has
been
used
to
analyze
turkey
growth
(BuFFirrcTOrr
et
al.,
1973).
A
comparison
of
the
course
of
growth
and
the
shape
of
curves
(parameters
n,
y*
/A)
in
cockerels
of
inbred
strains
reveals
a
similar
trend
in
the
Iowa
and
C lines
(tabi.
5).
Higher
average
shape
parameter
values
and,
therefore,
higher
values
of
the
y*
/A
ratio,
characterize the
curves
of
the
W and
M
lines.
However,
it
should
be
emphasized
that
the
W and
M
lines
differed
significantly
(P
<
0.01)
as
to
the
time
needed
to
reach
the
inflection
point
(t
*
=
77,4
vs.
101,0
days)
and,
therefore,
as
to
growth
rate
parameters
(k,
v,
v*
).
The
post-inflection
growth
phase
was
first
entered
by
the
C
line,
followed
by
Iowa
and
W,
with
a
marked
delay
in
the
Minor
cockerels.
The
order
of
lines
in
reaching
the
inflection
point
(y
*)
was
the
same
in
regard
to
weight
as
the
order
of
final
weight
(A) :
I
<
C
<
W
<
M.
It
should
be
noted
in
this
connection
that
the
correlation
rp
=
0.14,
rG
=
0.39
between
y*
and
A
has
also
been
demonstrated
in
mice
(T
IMON
&
E
ISEN
,
1969).
Coefficients
of
correlation
(rp)
ranging
from
0.57
to
0.89
were
obtained
in
,our
laboratory
in
unselected
fowl
populations
(White
Leghorn,
New
Hampshire,
Orpington).
pullets
of
inbred
lines
showed
a
pattern
of
intra-
and
inter-line
differences
similar
to
those
of
cockerels
(tabl.
6).
Higher
y !=/A
ratio
values
were
recorded
in
the
W and
M
strains ;
minor
pullets
were
also
slower
to
reach
the
inflection
point
(t
*
).
The
highest
growth
rate
parameters
(v,
v&dquo;),
recorded
in
the
W
line,
were
associated
with
a
comparatively
late
transition
to
the
post-inflection
phase.
course
of
the
Fl
hybrid
growth
is
shown
in
figures
6
and
7
and
the
curve
parameters
are
presented
in
tables
7
and
8.
Due
to
the
limited
number
of
chickens,
we
could
not
evaluate
differences
in
group
variability.
Nevertheless,
it
is
obvious
that
in
inbred
lines
and
in
hybrids
of
both
sexes,
the
k
parameter
showed
the
highest
coefficients
of
variability
(C.V.
=
6.6
to
25.2
p.
100).
A
comparatively
lower
intra-
group
variability
was
noted
in
the
y*
(C.V.
=
1.7
to
9.1
p.
100)
and
y&dquo;/A
(C.V. =
0.0
to
9.2
p.
100)
parameters.
Data
on
the
analysis
of
variance
of
curve
parameters
are
included
in
table
9.
Taking
the
characteristics
of
the
parental
material
(F!
>
99.9
p.
100)
as
a
basis,
it
follows
that
the
genetic
differences
between
lines,
and
eventually
between
hybrid
combinations,
are
an
important
source
of
the
total
variance.
The
highest
inter-group
variance
was
recorded
for
age
and
weight
at
inflection
point
(t !‘,
y*
),
higher
values
being
obtained
between
inbred
lines
than
between
F,
hybrids.
The
component
deter-
mined
by
genotype
was
also
comparatively
high
for
average
and
maximal
absolute
growth
rates
(v,
v!‘).
The
situation
is
similar
for the
variance
of
the
asymptote
of
inbred
lines.
The
low
value
in
F1
hybrids,
particularly
in
pullets,
can
probably
be
ascribed
to
an
inaccurate
estimation of
A,
since
the
genetic
variance
for
maximal
live
weight
(A’)
remained
high
(8
74.3
p.
100,
y
?
54.2
p.
100).
The
inter-group
variance
for the
y*/
A
ratio
was
comparatively
low
(22.6
to
31.3
p.
100).
comparison
of
hybrids
with
parental
lines
gave
estimates
of
heterosis
in
indi-
vidual
growth
curve
parameters
(tabl.
10
and
11).
In
our
experiment
comparing
different
inbred
and
hybrid
groups,
age
at
the
inflection
point
of
the
curve
occurred
within
a
wide
range
(from
63.3
to
101.1
days)
on
an
average,
the
hybrids
showed
some
shifting
towards
an
earlier
inflection :
cockerels
- 9.4
p.
100,
pullets
- 7.6
p.
100
(tabl.
10).
Some
hybrids
were
significantly
more
precocious
(t’k)
than
the
earlier
parental
line
(tabl.
11).
This
manifestation
of
heterosis
depended
on
particular
parental
lines
and
hybrid
combinations ;
a
more
detailed
analysis
of
these
effects
would
require
a
repre-
sentation
of
all
groups
of
reciprocal
crosses.
LAIRD
&
H
OWARD
(1967)
found
a
shift
to
an
earlier
age
at
the
inflection
point
in
hybrids
of
inbred
lines
of
mice.
In
the
growth
analysis
of
chickens
of
commercial
populations
of
egg
and
meat
types,
the
parameter
values
for
age
at
the
inflection
point
were
shifted
to
an
earlier
period.
For
instance,
when
the
power
function
y =
at’)
was
applied,
it
was
found
that
growth
rate
(b)
began
to
decrease
at
the
age
of
7-8
weeks
(R
OBERTS
,
1964).
In
another
analysis
applying
the
logistic
function,
the
maximal
absolute
growth
rate
of
broiler
chickens
was
estimated
to
occur
at
the
age
of
35.5
to
48.3
days
at
a
live
weight
of
763
to
1 261
g
(L
ILJEDAHL
,
1970),
although
the
author
admitted
that
the
weights
were
underestimated
with
respect
to
the
growth
capacity
of
the
meat-type
broiler
population.
This
assessment
agrees
with
the
results
of
Wi
L
SOrr
(1977)
who
applied
the
Gompertz
function
to
the
growth
of
meat-type
chickens
(Ross
1).
The
inflection
point
in
cockerels
was
estimated
to
occur
at
55
days
of
age
at
a
live
weight
of
about
2.0
kgs.
!
A
comparison
of
hybrid
weight
at
the
inflection
point
reveals
positive
deviations
from
the
mid-parent
value
(tabi.
10).
In
some
cases
the
hybrids
significantly
exceeded
the
parent
line
with
higher
parameters
(tabl.
11
The
higher
values
of
the
asymptote
for
the
majority
of
hybrid
combinations,
compared
with
pure
lines,
are
a
distortion
due,
to
some
extent,
to
inaccurate
estimation.
Nevertheless,
the
significant
differences
where
F1
exceeded
the
max.
(pl,
P2)
for
the
observed
final
weights
in
groups
of
males
I
X
C,
C
X
M,
M
X
C
and
females
I
X
C,
M
X
W,
suggest
that
manifestations
of
the
heterosis
effect
are
maintained
up
to
maturity
in
some
hybrid
combinations.
Taking
into
account
the
higher
parameter
values
in
hybrids,
it
is
not
surprising
to
find
heterosis
in
average
and
maximal
absolute
growth
rate
(v,
v’k).
D.
Sex
differences
As
expected,
the
cockerels
showed
significantly
higher
estimates
(tabl.
5-8)
for
parameters
immediately
related
to
live
weight
and
growth
rate
(y
*,
A,
v,
v*
).
Cockerels
reached
the
inflection
point
(t
*)
later
but
the
differences
were
small
and
in
most
cases
statistically
insignificant.
A
shift
in
the
age
parameter
at
the
inflection
point
towards
higher
values
in
the
male
sex
was
also
reported
by
L
ILJEDAHL
(1970).
The
values
of
the
remaining
curve
parameters
(y
*
/A,
k)
were
somewhat
higher
in
cockerels
but
all
these
differences
were
insignificant.
We
would
like
to
thank
the
referees
for
their
valuable
criticism
of
this
manuscript
and
for
correcting
our
English.
The
authors
wish
to
thank
the
scientific
editor
of
G.S.E.
and
Mrs.
D
AIFUKU
for
necessary
revision
of
the
final
manuscript.
References
BROWN
J.E.H.,
F
ITZHUGH
H.A.,
CART’WRIGHT
T.C.,
1976.
A
comparison
of
nonlinear
models
for
describing
weight-age
relationships
in
cattle.
J.
Anim.
Sci.,
42,
810-818.
B
UFFINGTON
D.E.,
JORDAN
K.A.,
Boyo
L.L.,
J
UNNILA
W.A.,
1973.
Mathematical
models
of
growth
data
of
male
and
female
Wrolstad
White
turkeys.
Poult. Sci.,
52,
1694-1700.
C
LOUGH
M.,
COCK
A.G.,
1957.
Variability
of
inbred
and
incross
chicken.
Nature,
179,
1030-1031.
CocK
A.G.,
M
ORTON
J.R.,
1963.
Maternal
and
sex
linked
effects
on
size
and
conformation
in
domestic
fowl.
Heredity,
18,
337-350.