Báo cáo y học: "Sequence and structure of Brassica rapa chromosome A3." pdf
Bạn đang xem bản rút gọn của tài liệu. Xem và tải ngay bản đầy đủ của tài liệu tại đây (892.33 KB, 12 trang )
RESEARC H Open Access
Sequence and structure of Brassica rapa
chromosome A3
Jeong-Hwan Mun
1*†
, Soo-Jin Kwon
1†
, Young-Joo Seol
1
, Jin A Kim
1
, Mina Jin
1
, Jung Sun Kim
1
, Myung-Ho Lim
1
,
Soo-In Lee
1
, Joon Ki Hong
1
, Tae-Ho Park
1
, Sang-Choon Lee
1
, Beom-Jin Kim
1
, Mi-Suk Seo
1
, Seunghoon Baek
1
,
Min-Jee Lee
1
, Ja Young Shin
1
, Jang-Ho Hahn
1
, Yoon-Jung Hwang
2
, Ki-Byung Lim
2
, Jee Young Park
3
,
Jonghoon Lee
3
, Tae-Jin Yang
3
, Hee-Ju Yu
4
, Ik-Young Choi
5
, Beom-Soon Choi
5
, Su Ryun Choi
6
, Nirala Ramchiary
6
,
Yong Pyo Lim
6
, Fiona Fraser
7
, Nizar Drou
7
, Eleni Soumpourou
7
, Martin Trick
7
, Ian Bancroft
7
, Andrew G Sharpe
8
,
Isobel AP Parkin
9
, Jacqueline Batley
10
, Dave Edwards
11
, Beom-Seok Park
1*
Abstract
Background: The species Brassica rapa includes important vegetable and oil crops. It also serves as an excellent
model system to study polyploidy-related genome evolution because of its paleohex aploid ancestry and its close
evolutionary relationships with Arabidopsis thaliana and other Brassica species with larger genomes. Therefore, its
genome sequence will be used to accelerate both basic research on genome evolution and applied research
across the cultivated Brassica species.
Results: We have determined and analyzed the sequence of B. rapa chromosome A3. We obtained 31.9 Mb of
sequences, organized into nine contigs, which incorporated 348 overlapping BAC clones. Annotation revealed
7,058 protein-coding genes, with an average gene density of 4.6 kb per gene. Analysis of chromosome collinearity
with the A. thaliana genome identified conserved synteny blocks encompassing the whole of the B. rapa
chromosome A3 and sections of four A. thaliana chromosomes. The frequency of tandem duplication of genes
differed between the conserved genome segments in B. rapa and A. thaliana, indicating differential rates of
occurrence/retention of such duplicate copies of genes. Analysis of ‘ancestral karyotype’ genome building blocks
enabled the development of a hypothetical model for the derivation of the B. rapa chromosome A3.
Conclusions: We report the near-complete chromosome sequence from a dicotyledonous crop speci es. This
provides an example of the complexity of genome evolution following polyploidy. The high degree of contiguity
afforded by the clone-by-clone approach provides a benchmark for the performance of whole genome shotgun
approaches presently being applied in B. rapa and other species with complex genomes.
Background
The Brassicaceae family includes approximately 3,700 spe-
cies in 338 genera. The species, which include the widely
studied Arabidopsis thaliana, have diverse characteristics
and many are of agronomic importance as vegetables, con-
diments, fodder, and oil crops [1]. Economically, Brassica
species contribute to approximately 10% of the world’s
vegetable crop produce and a pproximately 12% of the
worldwide edible oil supplies [2]. The tribe Brassiceae,
which is one of 25 tribes in the Brassicaceae, consists of
approximately 240 species and conta ins the genus Bras-
sica. The cultivated Brassica species are B. rapa (which
contains the Brassica A genome) and B. oleracea (C gen-
ome), which are grown mostly as vegetable cole crops,
B. nigra (B genome) as a source of mustard condiment,
and oil crops, mainly B. napus (a recently formed allotetra-
ploid containing both A and C genomes), B. juncea (A and
B genomes), and B. carinata (B and C genomes) as
sources of canola oil. These genome relationships between
the three diploid s pecies and their pairwise allopolyploid
* Correspondence: ;
† Contributed equally
1
Department of Agricultural Biotechnology, National Academy of Agricultural
Science, Rural Development Administration, 150 Suin-ro, Gwonseon-gu,
Suwon 441-707, Korea
Full list of author information is available at the end of the article
Mun et al. Genome Biology 2010, 11:R94
/>© 2010 Mun et al.; licensee BioMed Central Ltd. This is an open access article distributed under the te rms of the Creative Commons
Attribution License ( which permits unrestricted use, distribution, and reproduction in
any medium, provided the original work is properly cited.
derivative species have long been known, and are
described by ‘U’s triangle’ [3].
B. rapa is a major vegetable or oil crop in Asia and
Europe, and has recently become a widely used model for
the study of polyploid genome structure and evolution
because it has the smallest genome (529 Mb) of the Bras-
sica genus and, like all members of the tribe Brassiceae,
has evolved from a hexaploid ancestor [4-6]. Our previous
comparative genomic study revealed conserved linkage
arrangements and collinear chromosome segments
between B. rapa and A. thaliana, which diverged from a
common ancestor approximately 13 to 17 million years
ago. The B. rapa genome contains triplicated homoeolo-
gous counterparts of the corresponding segments of the
A. thali ana genome due to triplication of the entire gen-
ome (whole genome triplication), which occurred approxi-
mately 11 to 12 million years ago [6]. Furthermore, studies
in B. napus, which was generated in the last 10,000 years,
have demonstrated that overall genome structure is highly
conserved compared to its progenitor species, B. rapa and
B. oleracea, which diverged approximately 8 million years
ago, but significantly diverged relative to A. thaliana at the
sequence level [7,8]. Thus, investigation of the B. rapa
genome provides substantial opportunities to study the
divergence of gene function and genome evolution
associated with polyploidy, extensive duplication, and
hybridization. In addition, access to a complete and high-
resolution B. rapa genome will facilitate research on other
Brassica crops with partially sequenced or larger genomes.
Despite the import ance of Brassica crops in plant biol-
ogy and world agriculture, none of the Brassica species
have had their genomes fully sequenced. Cytogenetic
analyses have showed that the B. rapa genome is orga-
nized into ten chromosomes, with genes conce ntrated in
the euchromatic space and centromeric repeat sequences
and rDNAs arranged as tandem arrays primarily in the
heterochromatin [9,10]. The individual mitotic meta-
phase chromosome size ranges from 2.1 to 5.6 μm, with
a total chromosome length of 32.5 μm [9]. An alternative
cytogenetic map based on a pachytene DAPI (4’,6-diami-
dino-2-phenylindole dihydrochloride) and fluorescent
in situ hybridization (FISH) karyogram showed that the
mean lengths of ten pac hytene chromosomes ranged
from 23.7 to 51.3 μm, with a total chromosome length of
385.3 μm [11]. Thus, chromosomes in the meiotic pro-
phase stage are 12 times longer than those in the mitotic
metaphase, and display a well-differentiated pattern of
bright fluorescent heterochromatin segments. Sequen-
cing of selected BAC clones has confirmed t hat the gene
density in B. rapa is similar to t hat of A. thaliana in the
order of 1 gene per 3 to 4 kb [6]. Each of the gene-rich
BAC clones examined so far by FISH (> 100 BACs) was
found to be localize d to the visib le euchromatic region of
the genome. Concurrently, a whole-genome shotgun
pilot sequencing of B. oleracea with 0.44-fold genome
coverage generated sequences enriched in transposable
elements [12,13]. Taken together, these data strongly
point to a tractable genome organization where the
majority of the B. rapa euchromatic space (gene space)
can be sequenced in a highly efficient manner by a clone-
by-clone strategy. Based on these results, the multina-
tional Brassica rapa Genome Sequencing Project
(BrGSP) was launched, with the aim of sequencing the
euchromatic arms of all te n chromosomes [14]. The pro-
ject aimed to initially produce a ‘
phase 2 (fully oriented
and ordered sequence with some small gaps and low
quality sequences)’ sequence with accessible trace fil es by
shotgun sequencing of clones so that researchers who
require complete sequences from a specific region can
finish them.
To support genome sequencing, five large-insert BAC
libraries of B. rapa ssp. pekinensis cv. Chiifu were con-
structed, providing approximately 53-fold gen ome cov-
erage overall [15]. These libraries were constructed
using several different restriction endonucleases to
cleave genomic DNA (EcoRI, BamHI, HindIII, and
Sau3AI). Using these BAC libraries, a total of 260,637
BAC-end sequences (BESs) have been generated from
146,688 BAC clones (appr oxim ately 203 Mb) as a colla-
borative outcome of the multinational BrGSP commu-
nity. The strategy for clone-by-clone sequencing was to
start from defined and genetically/cytogenetically
mapped seed BACs and build outward. Initially, a com-
parative tiling method of mapping BES onto the A.
thaliana genome, combined with fingerprint-based phy-
sical mapping, along with existing genetic anchoring
data provided the basis for selecting seed BAC clones
and for creating a draft tiling path [6,16,17]. As a result,
589 BAC clones were sequenced and provided to the
BrGSP as ‘seed’ BACs for chromosome sequencing. Inte-
gration of seed BACs with the physical map provided
‘ gene-rich’ contigs spanning approximately 160 Mb.
These ‘gene-rich’ contigs enabled the selection of clones
to extend the initial sequence contigs. Here, as the first
report of the BrGSP, we describe a de tailed analysis of
B. rapa chromosome A3, the largest of the ten B. rapa
chromosomes, as assessed by both cytogenetic analysis
and linkage mapping (length estimated as 140.7 cM).
The A3 linkage group also contains numerous collinear-
ity discontinuities (CDs) compared with A. thaliana,a
recent study into which [18] revealed greater complexity
than originally described for the segmental collinearity
of Brassica and Arabidopsis genomes [19,2 0]. In accor-
dance with the agreed standards of the BrGSP, we
aimed to generate phase 2 contiguous sequences for
B. rapa chromosome A3. We annotated these sequences
Mun et al. Genome Biology 2010, 11:R94
/>Page 2 of 12
for genes and other characteristics, and used the data to
analyze genome composition and examine consequential
features of polyploidy, such as genome rearrangement.
Results and discussion
General features of chromosome A3
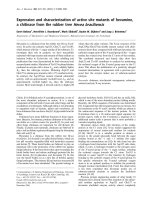
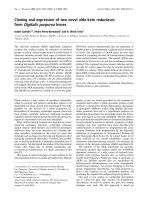
Chromosome A3 is acrocentric, with a heterochromatic
upper (short) arm bearing the nucleolar organizer region
(NOR) and a euchro matic lower (long) arm (Figure 1a).
The NOR comprises a large domain of 45S rDNA
repeats and a sm all fraction of 5S rDNA repeats extend-
ing to the centromere. The centromere of chromosome
A3 is typically characterized by hybridization of the 176-
bp centromeric tandem repeat CentBr2, which resides
on only chromosomes A3 and A5 [10]. The euchromatic
region of chromosome A3, the lo wer arm, has been
measured as 45.5 μm in pachytene FISH (Figure 1b).
The sequence length of the lower arm from centromere
to telomere was estimated to be approximately 34 to 35
Mb based on measurement of the average physical
Figure 1 F eatures of B. rapa chromosome A3. (a) Mitotic metaphase structure of chromo some A3 with FISH signals of 45S (red), 5S (green)
rDNAs, and CentBr2 (magenta). (b) Image of DAPI-stained pachytene spread of chromosome A3 showing the heterochromatic NORs of the
short arm (bright blue) and euchromatic long arm (blue). (c) VCS (cv. VC1 ⅹ cv. SR5) genetic map showing the positions of the BAC clones found
nearest the end of each contig. (d) Physical map showing the location of nine sequence contigs (blue). The chromosome is roughly 34.2 Mb
long, spans a genetic map distance of 140.7 cM with 243 kb/cM, and contains 6.4% of the unique sequence of the B. rapa genome. The
centromere is shown as a pink circle, the NOR of the rDNA repeat region in the short arm is represented as a brown bar, and telomeres are
light blue. The telomere, centromere, and NOR are not drown to scale. The sizes of eight unsequenced gaps measured by pachytene FISH are
given in kilobases. Red areas in (b, d) point to the position of the hybridization signal of KBrH34P23 in sequence contig 8.
Mun et al. Genome Biology 2010, 11:R94
/>Page 3 of 12
length of sequenced contigs (1 μm/755 kb). Chromo-
some sequencing was initiated using BAC clones that
had been anchored onto the lower arm of chromosome
A3 by genetic markers. Subsequently, BES and physical
mapping of chromosome A3 allowed extension from
these initial seed points and completion of the entire
lower arm. However, no BAC clones were identified
from the upper arm, possibly owing to the lack of
appropriate restriction enzyme sites in these regions, the
instability of the sequences in Escherichia coli or a com-
plete lack of euchromatic sequences on that arm.
A total of 348 BAC clones were sequenced from the
lower arm of chromosome A3 to produce 31.9 Mb of
sequences of phase 2 or phase 3 (finished sequences)
standard. These were assembled into nine contigs that
span 140.7 cM of the genetic map (Figures 1c, d; Figure
S1 in Additional file 1). The lower arm sequence starts
at the p roximal clone KBrH044B01 and terminates at
the distal clone KBrF203I22 (Table S1 in Additional file
2). Excluding the gaps at the centromere and telomere,
the pachytene spread FISH indicated that eight physical
gaps, totaling approximately 2.3 Mb, remain on the
pseudochromosome sequence. Despite extensive efforts,
no BACs could be identifi ed in those regions. The total
length of the lower arm, from centromere to telomere,
was therefore calculated to be 34.2 Mb. Thus, the 31.9
Mb of sequences we obtained represents 93% of the
lower arm of the ch romosome. The sequence and anno-
tation of B. rapa chromosome A3 can be found in Gen-
Bank (see Materials and methods).
Characterization of the sequences
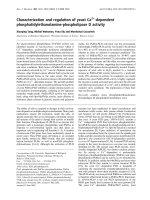
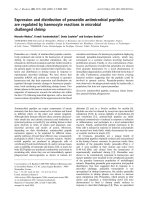
The distribution of g enes and vario us repetitive DNA
elements along chromosome A3 are depicted in Figure
2, with details of the content of repetitive sequences
provided in Table S2 in Additional file 2. Overall, 11%
of the sequenced region in chromosome A3 is com-
posed of repetitive sequences, which are dispersed over
the lower arm. The distribution of repetitive sequences
along the chromosome was not even, with fewer retro-
transposons (long terminal repeats) and DNA transpo-
sons towards the distal end. In addition, low complexity
repetitive sequences are relatively abundant in the lower
arm, indicating B. rapa-specific expansion of repetitive
sequences. These are the most frequently occurring
class of repetitive elements, accounting for 41% of the
total amount of repetitive sequence elements. Other
types of repeat do not show obvious clustering except
satellite sequences around 22 Mb from the centromere.
These sequences have high sequence similarity to a 350-
bp AT-rich tandem repeat of B. nigra [21].
Gene structure and density statistics are shown
in Table 1. The overall G+C content of chromosome
A3 is 33.8%, which is less than was reported for the
euchromatic seed BAC sequences (35.2%) [6] and
the entire A. thaliana genome (35.9%) [22]. Gene anno-
tation was carried out using our specialized B. rapa
annotation pipeline. This modeled a total of 7,058 pro-
tein-coding genes, of which 1,550 have just a single
exon. On average, each gene model contains 4.7 exons
and is 1,755 bp in length. Consistent with the results of
more restricted studies [6], the average length of gene
models annotated on chromosome A3 is shorter than
those of A. thaliana genesduetoreductioninboth
exon number per gene and exon length. The average
gene density is 4,633 bp per gene, which is also lower
than in A. thaliana (4,351 bp per gene), indicating a
slightly less compact genome organization. The longest
gene model, which is predicted to encode a potassium
ion transmembrane transporter, consists o f 8 exons
across 31,311 bp.
Potential alternative splicing variants, based upon a
minimum requirement for three EST matches, was iden-
tified for only 2.3% of the gene models. This finding
suggests that alternative splicing may be rarer in B. rapa
than it is in A. thaliana, where it occurs at a frequency
of 16.9% [23]. Additional EST data will enable more pre-
cise identification of alternative spliced variants on the
B. rapa genome.
We identified 5,825 genes as ‘known’ based upon EST
matches, protein matches, or any detectable domain sig-
natures. The remaining 1,417 predicted genes were
assigned as ‘unknown’ or ‘hypothetical’. The functions of
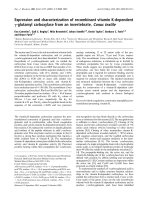
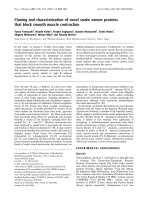
‘known’ genes were classified according to Gene Ontol -
ogy (GO) analysis (Figure 3). We compared the results
of GO-based classification of gene models from chromo-
some A3 with a similar analysis of gene models from
the 65.8 Mb of genome-wide seed BAC sequences [6].
This revealed several categories for which the functional
complement of genes on chromosome A3 is atypical of
the genome as a whole. For example, it has higher pro-
portions of genes classified as related to ‘st ress’ or
‘developmental process’ under the GO biological process
category compared to the collection of seed BAC
sequences (P < 0.0001). In addition, there are differences
in terms pertaining to membrane related genes and
chloroplast of the GO cellular component category
between the two data sets (P < 0.2).
The predicted proteins found on chromosome A3
were categorized into gene families by BLASTP (using a
minimum threshold of 50% alignment coverage at a cut-
off of E
-10
). The chromosome contains 384 families of
tandemly duplicated genes with 1,262 members, com-
prising 17.9% of all genes (Figure S2 in Additional file
1).ThisislowerthanfoundinA. thaliana, which has
27% of genes existing as tandem duplicates in the gen-
ome.Themostabundantgenefamilywastheprotein
kinase family, with 249 members, followed by F-box
Mun et al. Genome Biology 2010, 11:R94
/>Page 4 of 12
Figure 2 Distribution of various repeats and features on chromosome A3. The long arm of chromosome A3 is shown on the x-axis and is
numbered from the beginning of contig 1 to the end of contig 9 by joining up the physical gaps. The y-axis represents genes, ESTs, and the
various repeats plotted relative to the nucleotide position on the chromosome. The densities of genes, ESTs, and the repeats were obtained by
analyzing the sequence every 100 kb using a 10-kb sliding window. LINE, long interspersed nuclear element.
Mun et al. Genome Biology 2010, 11:R94
/>Page 5 of 12
proteins (170 members) and transcription factors (143
members). These families are distributed throughout the
chromosome (Figure 4). The highest number of tandem
duplicates detected at a single site was a cluster of 18
copies of the cysteine-rich receptor-like protein kinase
gene family, located around coordinate 7 Mb.
The chromosome contains 164 tRNAs and 3 small
nuclear RNAs. The tRNAs are evenly distributed along
chromosome A3 except for one region where they clus-
ter. This cluster, at 23.9 Mb, contains 12 tandem tRNA-
Pro
genes, whic h are the most abundant tRNA genes on
the chromosome (Figure S3 in Additional file 1). A
tRNA
Pro
cluster was previously detected also on A.
thaliana chromosome 1 [24]. A computational search
coupled with prediction of secondary structure using
reported mature microRNA (miRNA) sequences identi-
fied 26 miRNA genes, which outnumber the total num-
ber of B. rapa (17) recorded in miRBase (release 15.0;
April 2010; Table S3 in Additional file 2). Abundant
miRNAs on chromosome A3 included miR2111 and
miR399. These have been implicated in regulating nutri-
tional balance in B. rapa based upon observation of
their induction during phosphate limitation in A. thali-
ana and rapeseed [25,26].
A sequence similarity search showed that 2.5% of the
genes identified on chromosome A3 are of mitochondrial
(98 genes) or chloroplast (78 genes) origin. The wide-
spread distribution observed for organe llar insertions
across the chromosome indicates that mitochondrial and
chloroplast gene transfer occurred independently.
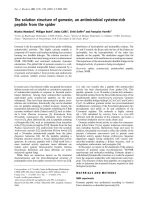
Synteny between chromosome A3 and the A. thaliana
genome
To investigate detailed syntenic relationships between
chromosome A3 and the five chromosomes of A. thali-
ana, we compared the proteomes predicted from the two
gen omes using BLAS TP analysis (T able S4 in Additional
file 2). Approximately 75.4% of the genes of chromosome
A3 have similarity to genes in the A. thaliana genome.
Figure 5 represents a dot matrix plot s howing the large-
scale blocks of collinearity between the two genomes.
The collinearity blocks, identified by the red dots, extend
the whole length of chromosome A3 and corr espond to
parts of four A. thaliana chromosomes (2, 3, 4, and 5) in
a mosaic pattern. The collinearity blocks contain 6,551
gene models in B. rapa and 12,78 3 gene m odels in
A. thaliana. Comparative analysis showed that 79.7% of
gene models on chromosome A3 show similarity with
Table 1 Statistics of B. rapa chromosome A3
B. rapa chromosome A3 A. thaliana whole genome
Total number of BACs 348 1,633
Approximate chromosome length (Mb) 34.2 134.6
Total non-overlapping sequence (Mb) 31.9 119.1
G/C content (%)
Overall 33.8 35.9
Exons 46.4 44.1
Introns 32.4 32.6
Intergenic regions 29.6 32.9
Number of protein coding genes 7,058 27,379
Number of exons per gene 4.7 5.7
Intron size (bp) 170 165
Exon size (bp) 222 304
Average gene size (bp) 1,755 2,467
Average gene density (bp/gene) 4,633 4,351
Alternatively spliced genes 184 4,626
Known genes 5,825 21,498
Average known gene size (bp) 1,231 2,384
Unknown genes 1,415 5,784
Average unknown gene size (bp) 547 1,489
Hypothetical genes 2 97
Average hypothetical gene size (bp) 1,681 686
tRNA genes 164 689
miRNA genes 26 215
Transposons (%) 5 13
The B. rapa chromosome A3 statistics were generated in this study. The Arabidopsis genome features are from The Arabidopsis Information Resource database
(release TAIR9) [23].
Mun et al. Genome Biology 2010, 11:R94
/>Page 6 of 12
counterparts in the collinear A. thaliana genome seg-
ments, whereas only 32.4% of A. thaliana genes show
similarity with counterparts on chromosome A3. This is
indicative of extensive and intersperse d gene loss from
B. rapa since divergence of the Brassica and Arabidopsis
lineages, as described previously [5,27,28]. We found
littleevidencetosupportthepresenceofparalogous
segments on chromosome A3 using self-syntenic com-
parison (Figure S4 in Additional file 1).
Recombination and evolution of chromosome A3
Comparison of chromosome sequences between B. rapa
chromos ome A3 and A. thaliana allows complete map-
ping of the inferred ancient karyotype (AK) genome
building blocks. According to genome mapping of AK
blocks on the A. thaliana genome [20,29] and pairwise
information for chromosome A3 and A. thaliana genome
collinearity blocks, we defined conserved AK genome
building blocks with pairwise boundary delineations of
each block on the two genomes (Figure 6; Table S4 in
Additional file 2). The order and boundaries of AK
blocks on chromosome A3 were fundamentally similar to
those of our previous report using seed BAC sequences
[6]. Chromosome A3 is highly rearranged relative to A.
thaliana chromosomes and compared with the AK.
Overall, 14 blocks derivedfrom6AKchromosomes
(AK3, AK4, AK5, AK6, AK7, and AK8) were aligned with
chromosome A3. A ll the AK blocks on chromosome A3
were shorter than those on the A. thaliana genome and
seven CD regions were found between the blocks, sug-
gesting that a complicated recombination of six AK chro-
mosomes resulted in the emergence of chromosome A3.
The combined a nalysis of AK mappi ng and identifica-
tion of CDs on chro mosome A3 enable us to hypothesiz e
Figure 3 Functional classification of the proteins encoded on chromosome A3 or seed BAC sequences through annotation using Gene
Ontology. Assignments are based on the annotations to terms in the GO biological process, cellular component, and molecular function categories.
Mun et al. Genome Biology 2010, 11:R94
/>Page 7 of 12
how parts of this chromosome have evolved from the AK.
One hypothetical model for the reconstruction of the
chromosome from the AK is presented in Figure 7. Chro-
mosome A3 appears to have been derived from at least
six AK chromosomes that were recombined in the pro-
genitor of B. rapa by genome rearrangements, including
inversion, translocation, fusion, and recombination. The
detectio n of sequences from the W block of AK8 at both
ends of the AK4 block indicates that there might have
been a circular intermediate derived from fusion chromo-
some AK8/4 that was then integrated into AK6. Rearran-
gement of the AK seems to have taken place in the
Figure 4 Distribution patterns of the top six gene categories on chromosome A3. Width of the vertical bars is proportional to the number
of genes located at that position.
Figure 5 Synteny between B. rapa chromosome A3 and the A. thaliana genome. Chromosome correspondence between the genomes is
represented by a dot-plot. Each dot represents a reciprocal best BLASTP match between gene pairs at an E value cutoff of < E
-20
. Red dots
show regions of synteny with more than 50% gene conservation as identified by DiagHunter. Color bars on the upper and left margins of the
dot plot indicate individual chromosomes of A. thaliana and B. rapa, respectively, demonstrating corresponding similarity. Black dots on the
chromosomes are centromeres. Color bars on the bottom and right margins of the dot plot show ancestral karyotype genome building blocks
mapped on the reduced karyotypes of A. thaliana and B. rapa, respectively. Bars of the same color are putative homologous counterparts.
Mun et al. Genome Biology 2010, 11:R94
/>Page 8 of 12
B. rapa genome after whole genome triplication, as none
of the other chromosomes in the B. rapa genome show a
similar arrangement of AK blocks. Furthermore, this
study suggests that re arrange ment events were involved
in reduction of the basic chromosome number of B. rapa
to ten. It remains uncertain, however, which group of
linked events occurred earlier or later because multiple
rounds of polyploidy followed by complex genome
recombination yielded the current chromosome structure
of B. rapa.
Conclusions
Polyploid ancestry greatly complicates efforts to sequence
genomes because of the presence of related sequences.
Figure 6 Genome building blocks and block boundari es of the
ancestral karyotype mapped onto B. rapa chromosome A3. The
position of AK genome building blocks in chromosome A3 was
defined by a comparison of B. rapa-A. thaliana syntenic relationships
and the A. thaliana-AK mapping results [20,29]. AK segments are
labeled and oriented by arrows. Putative orthologs delineating the
boundaries of recombination events are designated. CDs between
AK blocks are indicated by dotted arrows. CEN, centromere.
Figure 7 Hypothetical derivation of chromosome A3. Chromosome
A3 has originated due to inversion (i), translocation (t), fusion (f), and
recombination (r) of six AK chromosomes (AK3, AK4, AK5, AK6, AK7, and
AK8). The ancestral chromosomes are presumed to bear NORs (black
rectangles) and centromeres are represented as empty spheres. The
minichromosomes consisting of a NOR and a centromere that resulted
from translocation events have presumably been lost.
Mun et al. Genome Biology 2010, 11:R94
/>Page 9 of 12
Nevertheless, we have successfully sequenced, almost in
its entirety, the largest chromosome of B. rapa, A3, using
a clone-by-clone strategy. Annotation of the 31.9 Mb of
sequences representing the gene space of chromosome
A3 resulted in the development of models for 7,058 pro-
tein-coding ge nes and reve aled the gene den sity to be
only slightly lower t han that observed for the related
species A. thaliana, which is considered to have an
exceptionally compact genome [22]. Comparative analy-
sis of collinear genome segments with A. thaliana
revealed extensive chromosome-wide interspersed gene
loss from B. rapa sincedivergenceoftheBrassica and
Arabidopsis lineages, as described previously only for
small genomic regions [5,27,28]. The alignment of
genome segments that the whole chromosome sequence
permitted, relative to both the A. thaliana genome and
the inferred AK of a common progenitor of Brassica an d
Arab idopsis, enabled the development of a model for the
derivation of chromosome A3. The results confirm that
the complete genome sequence of B. rapa,providedthat
it is of an appropriate st andard, will have a major impact
on comparative genomics and gene discovery in Brassica
species.
Materials and methods
Chromosome sequencing
The B. rapa chromosome A3 was sequenced using a
clone-by-clone sequencing strategy with a BAC-based
physical map framework that was genetically anchored to
the B. rapa genome [16]. We sequenced chromosome A3
of B. rapa ssp. pekinensis cultivar Chiifu from 348 over-
lapping BAC clones. Initially, we isolated seed BAC
clones using a comparative BES tiling method and
sequenced them by shotgun sequencing [6]. Seed BAC
clones were then extended in both directions by search-
ing for sequence identity in the BES database, which was
then cross-examined with a physical map constructed
using the KBrH, KBrB, and KBrS1 BAC libraries [16]. We
also used KBrE and KBrS2 BAC libraries for additional
extension and gap filling in particular. We carried out
shotgun sequencing of the BAC clones to generate
sequence data with eight- to ten-fold coverage of each
cloneusingtheABI3730×lsequencer (Applied Biosys-
tems, Foster City, CA, USA). According to t he BrGSP
[30], the minimal sequence goal was five phase 2 contigs.
Individual BACs were assembled from the shotgun
sequences using the PHRED/PHRAP [31,32] and the
Consed [33] programs. The sequence contig assembly
was created based on overlapping sequences using
Sequencher (Gene Codes, Ann Arbor, MI, USA) pro-
gram. To evaluate the accuracy of the assembly, align-
ment of EST uni genes, PCR amplification of the
assembled sequences, and sequence comparison with fos-
mid clone links were performed. Contigs were ordered
using sequence tagged site markers mapping to the long
arm of the chromosome using VCS and Jangwon linkage
maps [15], followed by e stimation of non-overlapping
gaps between contigs based on the results of FISH
experiments. Pseudochromosome sequences were cre-
ated by connecting sequence contigs with addition of fil-
ler sequences according to the estimated gap size; 10 k
addition for gap sizes < 100 kb or 100 k addition for gap
sizes > 100 kb. All the sequence information has been
deposited in the National Center for Biotechnology and
Information (NCBI) with accession numbers [NCBI:
AC189184] to [NCBI:AC241201] (Table S1 in Additional
file 2).
Sequence annotation
We carried out gene prediction using our in-house auto-
mated gene predictio n system [6]. The assembled
sequences were masked using RepeatMasker [34] based
on a dataset combining the plant repeat element database
of The Institute for Genom ic Research [35], Munich
Information Center for Protein Sequences [36], and our
specialized database of B. rapa repetitive sequences.
Gene model prediction was performed using EVidence-
Modeler [37]. Putative exons and open reading frames
(ORFs) were predicted ab initio using FGENESH [38],
AUGUSTUS [39], GlimmerHMM [40], and SNAP [41]
programs with the parameters trained using the B. rapa
matrix. Putative gene splits predicted on the unfinished
gaps were removed. To predict consensus gene struc-
tures, 152,253 B. rapa ESTs plus full-length cDNAs we
have generate d, A. thaliana coding sequences (release
TAIR9), plant transcripts, and plant protein sequences
were aligned to the predicted genes using PASA [42] and
AAT [43] packages. The predicted genes and evidence
sequences were then a ssembled according to the we ight
of each evidence type us ing EVidenceMo deler. The high-
est scoring set of connected exons, introns, and noncod-
ing regions was selected as a consensus gene model.
Proteins encoded by gene models were searched a gainst
the Pfam database [44] and automatically assigned a
putative name based on conserved domain hits or simi-
larit y with previously identified proteins. Annotated gene
models were also searched against a database of plant
transposon-encoded proteins [45]. Predicted proteins
with a top match to transposon-encoded proteins were
exclud ed from th e annotation and gene counts. Transfer
RNAs were identified using tRNAscan-SE [46]. To scan
miRNA genes, the nonredundant miRNA sequence s in
miRBase v15 were mapped using BLASTN (up to two
mismatches) [47]. A search of potential precursor struc-
tures was performed by extracting the genomic context
(400 bp upstream and downstream) surrounding the
position of the miRNA sequence predicted and by ana-
lyzing those regions with Vienna RNA package [48].
Mun et al. Genome Biology 2010, 11:R94
/>Page 10 of 12
Only the putative pre-miRNA precursors with a folding
energy lower than -20 kcal/mol were selected. Organellar
insertions were determined using BLASTN with the A.
thaliana mitochondrion and the B. rapa chloroplast gen-
omesequenceusingacutoffof95%identityplus90%
coverage.
Comparative genome analysis
Syntenic regions between chromosome A3 of B. rapa and
the A. thaliana genome were identified by a proteome
comparison based on BLASTP analysis [47]. The entire
proteomes of the two genomes were compared, and only
the top reciprocal BLASTP matches per chromosome
pair were selected (minimum of 50% alignment coverage
atacutoffof<E
-20
). Chromosome scale synteny blocks
were inferred by visual inspection of dot-plots using
DiagHunter with parameters as described in the previous
reports [6,49]. At least four genes with the same respec-
tive orientations in both genomes were required to estab-
lish a primary candidate synteny block. To distinguish
highly homologous real synteny blocks from false posi-
tives due to multiple rounds of polyploidy followed by
genome rearrangement, we manually evaluated the
degree of gene conservation in all the primary candidate
blocks and selected real syntenic regions showing a gene
conservation index of g reater than 50% (the number of
conserved matches divided by the total number of genes
in the blocks). Self comparison of chromosome A3 with
other chromosom es of the B. rapa genome was also con-
ducted using seed BAC sequences [6].
Additional material
Additional file 1: Figures S1, S2, S3, and S4. Figure S1: genetic versus
physical distance on chromosome A3. The genetic map was constructed
using the VCS population. Figure S2: frequency distribution of genes in
multigene families with tandem duplicated paralog arrangements.
Tandem duplicated paralogs on chromosome A3 were identified using
BLASTP analysis with a minimum threshold of 50% alignment coverage
at a cutoff of E
-10
in a 100-kb window interval. Figure S3: clusters of
tRNA
Pro
genes on chromosome A3. The tRNA
Pro
repeat clusters at 23.68
Mb is located on BAC clone KBrH72P15. Figure S4: dot plot of
chromosome A3 compared with itself. Each dot in the dot plot
represents a reciprocal best BLASTP match between gene pairs at a
cutoff value of < E
-20
. Black dots show the regions of synteny identified
by DiagHunter
Additional file 2: Tables S1, S2, S3, and S4. Table S1: summary of
sequence contigs along with constituent BAC associations on minimum
tiling path for chromosome A3. Table S2: comparison of repetitive
sequences identified on chromosome A3 and seed BAC sequences of B.
rapa. Table S3: miRNAs identified on chromosome A3. Table S4: synteny
alignment between B. rapa chromosome A3 and the A. thaliana genome
along with mapping of AK genome building blocks.
Abbreviations
AK: ancestral karyotype; BAC: bacterial artificial chromosome; BES: BAC-end
sequence; bp: base pair; BrGSP: Brassica rapa Genome Sequencing Project;
CD: collinearity discontinuity; DAPI: 4’:6-diamidino-2-phenylindole
dihydrochloride; EST: expressed sequence tag; FISH: fluorescent in situ
hybridization; GO: Gene Ontology; kb: kilobase; miRNA: microRNA; NOR:
nucleolar organizer region.
Acknowledgements
We thank the many participants in the Korean Brassica rapa Genome Project
and Dr Xiaowu Wang of IVF, China for discussion. This work was supported
by the National Academy of Agricultural Science (05-1-12-2-1 and PJ006759)
and the BioGreen 21 Program (20050301034438), Rural Development
Administration, Korea, the UK Biotechnology and Biological Sciences
Research Council (BB/E017363), and the Australian Research Council (Projects
LP0882095 and LP0883462).
Author details
1
Department of Agricultural Biotechnology, National Academy of Agricultural
Science, Rural Development Administration, 150 Suin-ro, Gwonseon-gu,
Suwon 441-707, Korea.
2
Department of Horticulture, College of Agriculture
and Life Science, Kyungpook National University, 1370 Sangyeok-dong, Buk-
gu, Daegu 702-701, Korea.
3
Department of Plant Science, Plant Genomics
and Breeding Institute, and Research Institute for Agriculture and Life
Sciences, College of Agriculture and Life Sciences, Seoul National University,
599 Gwanak-ro, Gwanak-gu, Seoul 151-921, Korea.
4
Department of Life
Sciences, The Catholic University of Korea, 43-1 Yeokgok 2-dong, Wonmi-gu,
Bucheon 420-743, Korea.
5
National Instrumentation Center for Environmental
Management, Seoul National University, 599 Gwanak-ro, Gwanak-gu, Seoul
151-921, Korea.
6
Department of Horticulture, Chungnam National University,
220 Kung-dong, Yusong-gu, Daejon 305-764, Korea.
7
John Innes Centre,
Colney, Norwich NR4 7UH, UK.
8
NRC Plant Biotechnology Institute, 110
Gymnasium Place, Saskatoon, SK S7N 0W9, Canada.
9
Agriculture and Agri-
Food Canada, Saskatoon Research Centre, Saskatoon, SK S7N OX2, Canada.
10
ARC Centre of Excellence for Integrative Legume Research and School of
Land, Crop and Food Sciences, University of Queensland, Brisbane, QLD
4067, Australia.
11
Australian Centre for Plant Functional Genomics and School
of Land Crop and Food Sciences, University of Queensland, Brisbane, QLD
4067, Australia.
Authors’ contributions
JHM conceived the project, designed research, analyzed data, and wrote the
manuscript. SJK designed research, performed the experiments, and
analyzed data. JHM, SJK, JAK, MHL, SIL, JKH, THP, SCL, MJL, JYP, JL, TJY, and
IYC contributed to shotgun sequencing, sequence assembly, and data
acquisition. MJ and JSK performed genetic mapping. YJH and KBL
contributed to FISH. YJS and JHH contributed to annotation and database
development. YJS, BJK, SB, JYS, MSS, HJY, and BSC analyzed data. SRC, NR,
YPL, FF, ND, ES, MT, IB, AGS, IAPP, JB, and DE participated in BAC-end
sequencing. HJY and IB participated in manuscript preparation. BSP
conceived the project.
Received: 4 June 2010 Revised: 7 September 2010
Accepted: 27 September 2010 Published: 27 September 2010
References
1. Beilstein MA, Al-Shehbaz IA, Kellogg EA: Brassicaceae phylogeny and
trichome evolution. Am J Bot 2006, 93:607-619.
2. Selected vegetable production in leading countries and the world, 1998-
2008. [ />3. UN: Genome analysis in Brassica with special reference to the
experimental formation of B. napus and peculiar mode of fertilization.
Jpn J Bot 1935, 7:389-452.
4. Johnston JS, Pepper AE, Hall AE, Chen ZJ, Hodnett G, Drabek J, Lopez R,
Price HJ: Evolution of genome size in Brassicaceae. Ann Bot 2005,
95:229-235.
5. Yang TJ, Kim JS, Kwon SJ, Lim KB, Choi BS, Kim JA, Jin M, Park JY, Lim MH,
Kim HI, Lim YP, Kang JJ, Hong JH, Kim CB, Bhak J, Bancroft I, Park BS:
Sequence-level analysis of the diploidization process in the triplicated
FLOWERING LOCUS C region of Brassica rapa. Plant Cell 2006,
18:1339-1347.
6. Mun JH, Kwon SJ, Yang TJ, Seol YJ, Jin M, Kim JA, Lim MH, Kim JS, Lee SI,
Baek S, Choi BS, Kim DS, Kim N, Yu HJ, Lim KB, Lim YP, Bancroft I, Hahn JH,
Park BS: Genome-wide comparative analysis of the Brassica rapa gene
Mun et al. Genome Biology 2010, 11:R94
/>Page 11 of 12
space reveals genome shrinkage and differential loss of duplicated
genes after whole genome triplication. Genome Biol 2009, 10:R111.
7. Rana D, van den Boogaart T, O’Neill CM, Hynes L, Bent E, Macpherson L,
Park JY, Lim YP, Bancroft I: Conservation of the microstructure of genome
segments in Brassica napus and its diploid relatives. Plant J 2004,
40:725-733.
8. Cheung F, Trick M, Drou N, Lim YP, Park JY, Kwon SJ, Kim JA, Scott R,
Pires JC, Paterson AH, Town C, Bancroft I: Comparative analysis between
homoeologous genome segments of Brassica napus and its progenitor
species reveals extensive sequence-level divergence. Plant Cell 2009,
21:1912-1928.
9. Lim KB, de Jong H, Yang TJ, Park JY, Kwon SJ, Kim JS, Lim MH, Kim JA,
Jin M, Jin YM, Kim SH, Lim YP, Bang JW, Kim HI, Park BS: Characterization
of rDNAs and tandem repeats in the heterochromatin of Brassica rapa.
Mol Cells 2005, 19:436-444.
10. Lim KB, Yang TJ, Hwang YJ, Kim JS, Park JY, Kwon SJ, Kim J, Choi BS,
Lim MH, Jin M, Kim HI, de Jong H, Bancroft I, Lim YP, Park BS:
Characterization of the centromere and peri-centromere
retrotransposons in Brassica rapa and their distribution in related
Brassica species. Plant J 2007, 49:173-183.
11. Koo DH, Plaha P, Lim YP, Hur Y, Bang JW: A high-resolution karyotype of
Brassica rapa ssp. pekinensis revealed by pachytene analysis and
multicolor fluorescence in situ hybridization. Theor Appl Genet 2004,
109:1346-1352.
12. Ayele M, Haas BJ, Kumar N, Wu H, Xiao Y, Van Aken S, Utterback TR,
Wortman JR, White OR, Town CD: Whole genome shotgun sequencing of
Brassica oleracea and its application to gene discovery and annotation
in Arabidopsis. Genome Res 2005, 15:487-495.
13. Zhang X, Wessler SR: Genome-wide comparative analysis of the
transposable elements in the related species Arabidopsis thaliana and
Brassica oleracea. Proc Natl Acad Sci USA 2004, 101:5589-5594.
14. Brassica info. [o/info/about-mbgp.php].
15. The Korea Brassica rapa Genome Project. [ />BRGP/index.jsp].
16. Mun JH, Kwon SJ, Yang TJ, Kim HS, Choi BS, Baek S, Kim JS, Jin M, Kim JA,
Lim MH, Lee SI, Kim HI, Kim H, Lim YP, Park BS: The first generation of a
BAC-based physical map of
Brassica rapa. BMC Genomics 2008, 9:280.
17. Kim JS, Chung TY, King GJ, Jin M, Yang TJ, Jin YM, Kim HI, Park BS: A
sequence-tagged linkage map of Brassica rapa. Genetics 2006, 174:29-39.
18. Trick M, Kwon SJ, Choi SR, Fraser F, Soumpourou E, Drou N, Wang Z,
Lee SY, Yang TJ, Mun JH, Paterson AH, Town CD, Pires JC, Lim YP, Park BS,
Bancroft I: Complexity of genome evolution by segmental
rearrangement in Brassica rapa revealed by sequence-level analysis. BMC
Genomics 2009, 10:539.
19. Parkin IA, Gulden SM, Sharpe AG, Lukens L, Trick M, Osborn TC, Lydiate DJ:
Segmental structure of the Brassica napus genome based on
comparative analysis with Arabidopsis thaliana. Genetics 2005,
171:765-781.
20. Schranz ME, Lysak MA, Mitchell-Olds T: The ABC’s of comparative
genomics in the Brassicaceae: building blocks of crucifer genomes.
Trends Plant Sci 2006, 11:535-542.
21. Gupta V, Jagannathan V, Lakshmikumaran MS: A novel AT-rich tandem
repeat of Brassica nigra. Plant Sci 1990, 68:223-229.
22. The Arabidopsis Genome Initiative: Analysis of the genome sequence of
the flowering plant Arabidopsis thaliana. Nature 2000, 408:796-815.
23. The Arabidopsis Information Resource. [ />portals/genAnnotation].
24. Theologis A, Ecker JR, Palm CJ, Federspiel NA, Kaul S, White O, Alonso J,
Altafi H, Araujo R, Bowman CL, Brooks SY, Buehler E, Chan A, Chao Q,
Chen H, Cheuk RF, Chin CW, Chung MK, Conn L, Conway AB, Conway AR,
Creasy TH, Dewar K, Dunn P, Etgu P, Feldblyum TV, Feng J, Fong B, Fujii CY,
Gill JE, et al: Sequence and analysis of chromosome 1 of the plant
Arabidopsis thaliana. Nature 2000, 408:816-820.
25. Hsieh LC, Lin SI, Shih AC, Chen JW, Lin WY, Tseng CY, WH L, Chiou TJ:
Uncovering small RNA-mediated responses to phosphate deficiency in
Arabidopsis by deep sequencing. Plant Physiol 2009, 151:2120-2132.
26. Pant BD, Musialak-Lange M, Nuc P, May P, Buhtz A, Kehr J, Walther D,
Scheible WR: Identification of nutrient-responsive Arabidopsis and
rapeseed microRNAs by comprehensive real-time polymerase chain
reaction profiling and small RNA sequencing. Plant Physiol 2009,
150:1541-1555.
27. O’Neill CM, Bancroft I: Comparative physical mapping of segments of the
genome of Brassica oleracea var. alboglabra that are homoelogous to
sequenced regions of chromosomes 4 and 5 of Arabidopsis thaliana.
Plant J 2000, 23:233-243.
28. Town CD, Cheung F, Maiti R, Crabtree J, Haas BJ, Wortman JR, Hine EE,
Althoff R, Arbogast TS, Tallon LJ, Vigouroux M, Trick M, Bancroft I:
Comparative genomics of Brassica oleracea and Arabidopsis thaliana
reveal gene loss, fragmentation, and dispersal after polyploidy. Plant Cell
2006, 18:1348-1359.
29. Lysak MA, Berr A, Pecinka A, Schmidt R, McBreen K, Schubert I: Mechanisms
of chromosome number reduction in Arabidopsis thaliana and related
Brassicaceae species. Proc Natl Acad Sci USA 2006, 103:5224-5229.
30. The Brassica Genome Project. [ />brassica_genome_sequencing_concept.htm].
31. Ewing B, Hillier L, Wendl M, Green P: Basecalling of automated sequencer
traces using phred. I. Accuracy assessment. Genome Res 1998, 8:175-185.
32. Ewing B, Green P: Basecalling of automated sequencer traces using
phred. II. Error probabilities. Genome Res 1998, 8:186-194.
33. Gordon D, Abajian C, Green P: Consed: a graphical tool for sequence
finishing. Genome Res 1998, 8:195-202.
34. RepeatMasker. [ />35. Ouyang S, Buell CR: The TIGR Plant Repeat Databases: a collective
resource for the identification of repetitive sequences in plants. Nucleic
Acid Res 2004, 32:D360-366.
36. Munich Information Center for Protein Sequences. [http://www.
helmholtz-muenchen.de/en/ibis].
37. Haas BJ, Salzberg SL, Zhu W, Pertea M, Allen JE, Orvis J, White O, Buell CR,
Wortman JR: Automated eukaryotic gene structure annotation using
EVidenceModeler and the Program to Assemble Spliced Alignments.
Genome Biol 2008, 9:R7.
38. FGENESH. [].
39. Stanke M, Morgenstern B: AUGUSTUS: a web server for gene prediction
in eukaryotes that allows user-defined constraints. Nucleic Acid Res 2005,
33:W465-W467.
40. Majoros WH, Pertea M, Salzberg SL: TigrScan and GlimmerHMM: two
open-source ab initio eukaryotic gene-finders.
Bioinformatics 2004,
20:2878-2879.
41. Korf I: Gene finding in novel genomes. BMC Bioinformatics 2004, 5:59.
42. Haas BJ, Delcher AL, Mount SM, Wortman JR, Smith RK, Hannick LI, Maiti R,
Ronning CM, Rusch DB, Town CD, Salzberg SL, White O: Improving the
Arabidopsis genome annotation using maximal transcript alignment
assemblies. Nucleic Acid Res 2003, 31:5654-5666.
43. Huang X, Adams MD, Zhou H, Kerlavage AR: A tool for analyzing and
annotating genomic sequences. Genomics 1997, 46:37-45.
44. Bateman A, Birney E, Cerruti L, Durbin R, Etwiller L, Eddy SR, Griffiths-
Jones S, Howe KL, Marshall M, Sonnhammer EL: The Pfam protein families
database. Nucleic Acid Res 2002, 30:276-280.
45. Plant Transposon-encoded Protein Database. [ />TransposableElements/transposon_db.pep].
46. Lowe TM, Eddy SR: tRNAscan-SE: a program for inproved detection of
transfer RNA genes in genomic sequence. Nucleic Acid Res 1997,
25:955-964.
47. Altschul SF, Madden TL, Schäffer AA, Zhang J, Zhang Z, Miller W,
Lipman DJ: Gapped BLAST and PSI-BLAST: a new generation of protein
database search programs. Nucleic Acid Res 1997, 25:3389-3402.
48. Gruber AR, Lorenz R, Bernhart SH, Neuböck R, Hofacker IL: The Vienna RNA
websuite. Nucleic Acid Res 2008, 36:W70-74.
49. Cannon SB, Kozik A, Chan B, Michelmore R, Young ND: DiagHunter and
GenoPix2D: programs for genomic comparisons, large-scale homology
discovery and visualization. Genome Biol 2003, 4:R68.
doi:10.1186/gb-2010-11-9-r94
Cite this article as: Mun et al.: Sequence and structure of Brassica rapa
chromosome A3. Genome Biology 2010 11:R94.
Mun et al. Genome Biology 2010, 11:R94
/>Page 12 of 12