Báo cáo y học: "The rate of the molecular clock and the cost of gratuitous protein synthesis." pps
Bạn đang xem bản rút gọn của tài liệu. Xem và tải ngay bản đầy đủ của tài liệu tại đây (713.81 KB, 10 trang )
RESEARC H Open Access
The rate of the molecular clock and the cost of
gratuitous protein synthesis
Germán Plata
1,2
, Max E Gottesman
3,4
, Dennis Vitkup
1,5*
Abstract
Background: The nature of the protein molecular clock , the protein-specific rate of amino acid substitutions, is
among the central questions of molecular evolution. Protein expression level is the dominant determinant of the
clock rate in a number of organisms. It has been suggested that highly expressed proteins evolve slowly in all
species mainly to maintain robustness to translation errors that generate toxic misfolded proteins. Here we
investigate this hypothesis experimentally by comparing the growth rate of Escherichia coli expressing wild type
and misfolding-prone variants of the LacZ protein.
Results: We show that the cost of toxic protein misfolding is small compared to other costs associated with
protein synthesis. Complementary computational analyses demonstrate that there is also a relatively weaker, but
statistically significant, selection for increasing solubility and polarity in highly expressed E. coli proteins.
Conclusions: Although we cannot rule out the possibility that selection against misfolding toxicity significantly
affects the protein clock in species other than E. coli, our results suggest that it is unlikely to be the dominant and
universal factor determining the clock rate in all organisms. We find that in this bacterium other costs associated
with protein synthesis are likely to play an important role. Interestingly, our experiments also suggest significant
costs associated with volume effects, such as jamming of the cellular environment with unnecessary proteins.
Background
Once the first protein sequences became available, their
comparison led to the conclusion that the number of
accumulated substitutions between orthologs was mainly
a function of the evolutionary time elapsed since the last
common ancestor of corresponding species [1,2]. Conse-
quently, orthologous proteins accumulate substitutions
at an approximately constant rate over long evolutionary
intervals. This observation suggests that one can use
available protein sequences as a molecular clock to esti-
mate divergence times between different species [3].
Further studies revealed that while the pace of the mole-
cular clock is similar for orthologous proteins in differ-
ent lineages, it varies by several orders of magnitude
across non-orthologous proteins [4,5].
For several decades the dominant hypothesis explain-
ing the large variability of the molecular clock rate
between non-orthologous proteins was based on the
concept of functional protein density: the higher the
fraction of protein residues directly involv ed in its func-
tion, the slower the protein molecular clock [6,7]. It was
not until high-throughput genomics data became widely
available that multiple molecular and genetic variables
were used to investigate the dominant factors influen-
cing the molecular clock rates of different proteins. Sur-
prisingly, such features as gene e ssentiality [8-11], the
number of protein-protein interactions [12,13], and spe-
cific functional roles [14,15], have been shown to have,
on average, either non-significant or significant but rela-
tively weak correlations with protein evolutionary rates.
On the other hand, quantities directly related to gen e
expression, such as codon bias, mRNA expression, and
protein abundance, showed the strongest correlation
with the rate of protein evolution [16,17]. For example,
expression alone explains about a third of the variance
in the substitution rates in several microbial species
[14,17,18] and about a quarter of the variance in Cae-
norhabditis elegans [19]. In these and many other organ-
isms, highly expressed genes accept significantly less
synonymous and non-synonymous (amino acid
* Correspondence:
1
Center for Computational Biology and Bioinformatics, Columbia University,
1130 St Nicholas Ave, New York City, NY 10032, USA
Full list of author information is available at the end of the article
Plata et al. Genome Biology 2010, 11:R98
/>© 2010 Plata et al. ; licensee BioMed Central Ltd. This is an open access article distributed under the terms of the Creative Commons
Attribution License (http://creativecommons .org/licenses/by/2.0), which permits unrestr icted use, distribution, and reproduction in
any medium, provided the original work is properly ci ted.
changing) s ubstitutions than gene s with low expression
levels [20].
Considering the major role played by expression in
setting the rate of amino acid substitutions, it is impor-
tant to understand the main molecular mechanisms of
this effect [21]. A popular theory by Drummond et al.
[18,22,23] suggests that highly expressed proteins may
evolve slowly in all organisms, from microbes to human
[22], due to the selection against toxicity associated
with protein misfolding. The l ogic behind this interest-
ing hypothesis is that a significant fraction (>10%) of
cellular proteins may contain translation errors [24,25]
that could cause cytotoxic protein misfolding. If mis-
folded proteins indeed incur substantial toxicity costs,
greater pressure to avoid misfolding will affect highly
expressed genes since they generate relatively more mis-
folded proteins [18]. Consequently, adaptive pressure
will maintain sequences of highly expressed proteins
robust to trans lation errors, which will in turn slow the
amino acid substitution rate, that is, the protein mole-
cular clock. The misfolding toxicity hypothesis was sup-
ported by the result s of computer simulations [22], but
to the best of our knowledge, it has never been tested
experimentally.
In this study we specifically investigated whether the
toxicity of misfolded proteins or other costs associated
with protein synthesis make a dominant contribution to
cellular fitness (growth rate), and consequently constrain
the m olecular clock in Escherichia coli.Totestthis,we
used wild type (WT) and misfolding-prone variants of
the E. coli b-galactosidase gene, lacZ. We also computa-
tionally analyzed the contribution of other related fac-
tors, such as protein stability and solubility.
Results
The native biological function of the L acZ protein is to
cleave lactose for use as a source of carbon and energy
[26]; in the absence of lactose, b-galactosidase does not
participate in E. coli carbon metabolism. Therefore, we
used lacZ expression in a lactose-free medium to mea-
sure the cost of gratuitous protein expression [27,28]. To
compare that expression cost to the cost of potentially
toxic protein misfolding, we used site-directed mutagen-
esis to engineer several destab ilizi ng single-residue sub-
stitutions into LacZ. Single amino acid substitutions
should serve as a good model for translational errors
because only rarely, in about 10% of the proteins that
contain translation errors, two or more residues will be
simultaneo usly mistranslat ed in the same protein. We
expressed the misfolding-prone mutants at the same
level as the WT protein. Because the misfolded LacZ pro-
teins are both potentially toxic and also devoid of biologi-
cal function, the comparison of the growth rates of
bacteria carrying the WT and each of the destabilized
mutant s allowed us to evaluate the additional fitness cost
specifically arising from misfolding toxicity.
Destabilizing mutations in lacZ yield aggregated and
partialy soluble proteins
Amino acid substitutions in protein cores are signifi-
cantly more destabilizing than substitutions on protein
surfaces [29,30]. Therefore, we selected five buried resi-
dues encoding non-polar amino acids that could be
mutated to polar residues with single nucleotide substi-
tutions while maintaining a similar level of codon pre-
ference ( Table 1). We used the DPX server [31] to
identify buried residues of the LacZ pro tein based on its
crystal structure (Protein Data Bank (PDB) code 1dp0).
We then applie d the I-Mutant2.0 algorithm [32] to con-
firm that the selected substitutions would be indeed
destabilizing. Using site-directed mutagenesis, the five
selected substitutions were introduced separately into
plasmids containing lacZ under transcriptional control
of the isopropyl b-D-1-thiogalactopyranoside (IPTG)-
inducible lac promoter [33]. We then used a b-
galactosidase assay [34] to experimentally confirm
reductions in the catalytic activity of LacZ in all of the
generated mutants (Table 1).
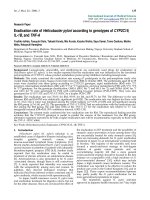
To determine whether the destabilized proteins tended
to aggregate, we separated soluble proteins and proteins
in inclusion bodies (see Materials and methods) and
analyzed them by SDS-PAGE (Figure 1a). The thre e
mutants with the lowest catalytic activity (F758S, I141N
and G353D) wer e found in inclusion bodies (Table 1),
the remaining two mutants (V567D and A880E) and
WT proteins were found mainly in the soluble protein
fraction. Next, by inspecting total cell extracts at differ-
ent time points after IPTG induction, we confirmed that
the total amount of protein synthesized in each mutant
strain was similar to that in the WT. As shown in Fig-
ure 1b, similar amounts of LacZ are produced in the
WT and either soluble (V567D) or insoluble (F758S)
mutants. Quantitative analysis of the Coomasie stained
bands also did not reveal any significant difference
between the LacZ synthesis rates in WT and mutant
strains (Figure 1c). Finally, because expression of mis-
folded proteins is expected to generate a heat shock
response [35,36], we used western blots to monitor the
amount of the GroEL heat shock protein in induced and
un-induced cells carrying WT and mutant lacZ (Figure
1d). In cells carrying WT lacZ, the concentration of
GroEL increased when IPTG was added. However, in
both the V567D and F758S mutants, the levels of
GroEL in either induced or uninduced cells were equal
or higher than that in induced WT cells.
Overall, the results described in this section demon-
strate that: all engineered mutants have significant ly
reduced catalytic activities; soluble and insoluble
Plata et al. Genome Biology 2010, 11:R98
/>Page 2 of 10
mutants are expressed at the same level as WT; and the
mutants induce a heat shock response, and in some
cases aggregate in inclusion bodies.
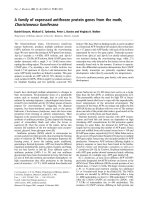
Misfolded proteins are no more toxic than wild-type
proteins
The synthesis of WT or mu tant b-galactosidase was
initially induced by adding 10 μM IPTG. Using WT
LacZ activity as a reference [37], we estimated that
about 30,000 molecules of b-galactosidase were present
in each bacterial cell at this i nduction level. This
approximately corresponds to half of the protein mole-
cules expressed by a fully induced WT lacZ operon
[34]. Cells expressing WT LacZ grew 13.5% slower on
glycerol as the sole carbon source compared to unin-
duced cells (Figure 2a). If misfolded proteins indeed
impose a significant extra cost on the bacterium, then
similarly expressed mutant strains with destabilizing
Table 1 Characteristics of destabilizing mutations engineered into E. coli b-galactosidase
Mutant
V567D F758S I141N G353D A880E
Predicted ΔΔG (kcal/mol) -2.6 -2.9 -2.4 -1.6 -0.6
Relative protein activity (%) 31 4 17 2 61
Codon substitution (WT/mutant) GTC/GAC TTT/TCT ATT/AAT GGC/GAC GCG/GAG
Codon preference % (WT/mutant) 13.5/53.9 29.0/32.4 33.5/17.3 42.8/53.9 32.3/24.7
Found in inclusion bodies (see Figure 1a) No Yes Yes Yes No
In the table, ΔΔG values represent destabilizing effects predicted by the I-Mutant2.0 server [32]. The experimentally determined enzymatic activities of the
mutants (in percentages) are shown in the table relative to WT.
Figure 1 Expression of destabilizing mutants and wild-type LacZ. (a) SDS-PAGE of soluble and insoluble fractions of cells expressing WT
LacZ and five destabilizing mutants induced with 10 μM IPTG. (b) Total b-galactosidase at different times after IPTG induction. The LacZ band is
indicated by the black arrow. (c) Relative synthesis rate of b-galactosidase. P-values were obtained using a t-test of the linear regression slopes
based on quantification of the gel images. Error bars represent the standard error of the regression slopes. (d) GroEL western blots in cells
exprerssing WT and LacZ mutants. S, soluble fraction; I, insoluble fraction; ‘-’, no IPTG; ‘+’,20μM IPTG; Δ, heat shock (1 h shift from 37 to 42°C).
Plata et al. Genome Biology 2010, 11:R98
/>Page 3 of 10
substitutions should lead to a more pronounced growth
decrease compared to the one observed with W T LacZ.
However, as shown in Figure 2a, the mutant strains
grew as well as cells expresing WT LacZ, and, despite
inclusion body formation, two of the mutants even grew
significantly faster (see Discussion).
To further explore the potential toxicity of the desta-
bilized proteins, we focused on two mutants (F758S and
V567D). These m utants are examples of a completely
aggregated and a soluble but destabilized LacZ protein,
respectively. By varying the concentration of IPTG, we
monitored the growth of cells with different levels of
expressed LacZ proteins (Figure 2b). Importantly, no
additional growth decrease was observed in the mutant
strains compared to the WT at all IPTG induction
levels. When no IPTG was added, resulting in a low
expression level from the un-induced prom oter, we also
observed the same growth rate reduction in all con-
structs relative to cells carrying an empty pBR322 plas-
mid (Figure 2b).
We investigated the possibility that the toxicity of mis-
folded proteins was more pronounced on a relatively
poor carbon source by measuring the growth of the
E. coli V567D and F758S mutants and the WT on acet-
ate. Although the overall growth rate on acetate was
only about 60% of that on glycerol, we again did not
observe any additional fitness (growth) decrease due to
the destabilizing mutations (Figure 2c). This experi ment
confirmed that the observed results are not specific to a
particular carbon source.
Figure 2 Comparison of the growth rates for wild-type and misfolding-prone LacZ. (a) Growth rates of cells expressing WT LacZ relative to
uninduced cells and cells expressing each of the five destabilizing mutants (10 μM IPTG). Mann-Whitney U P-value: *0.02; **8 × 10
-4
. (b) Growth
rates of cells expressing WT LacZ and two mutants at different induction (IPTG) levels; the growth rate of cells carrying an empty plasmid is also
shown for comparison. (c) Growth rates of cells expressing LacZ and two destabilizing mutants on acetate and glycerol as the main carbon
source; in both cases expression was induced with 10 μM ITPG). Error bars represent the standard error of the mean calculated based on
triplicate experiments.
Plata et al. Genome Biology 2010, 11:R98
/>Page 4 of 10
Nucleotide level selection, protein solubility, and stability
in E. coli
Nucleotide sequences of highly expressed genes are sig-
nificantly constrained by selection for amino acid
codons corresponding to abundant tRNAs [38-40].
A recent experimental analysis by Kudla et al. [41] sug-
gests that non-optimal codons can directly influen ce
E. coli growth (fitness). Using 154 variants of GFP with
multiple random synonymous substitutions, these
authors found a significant positive correlation between
codon optimality and bacterial growth rate. An impor-
tant role played by the nucleotide-level selection in evo-
lution of E. coli proteins is also supported by a high
correlation between the rates of non-synonymous (Ka)
and synonymous (Ks) substitutions (Figure 3b; Spear-
man’ s rank correlation r = 0.66, P-value < 10
-10
). In
addition, the partial correlation between Ka a nd mRNA
expression, controlling for Ks, is s mall (r = -0.14, P =
7×10
-9
), whereas the partial correlation between Ks
and expression, controlling for Ka, is significantly higher
(r = -0.38, P <10
-10
).
Although selection for optimal codons at the nucleotide
level should significantly affect the rates of both synon-
ymous and non-synonymous substitutions [40], there are
additional constraints specifically acting on non-
synonymous sites [42,43]. Many o f these additional con-
straints affect the propensity of proteins to misfold and
aggregate. For example, it has been reported that highly
expressed E. coli proteins are more soluble than prot eins
with lower expression [44-46]. It is likely that the observed
increase in solubility is necessary to avoid protein aggrega-
tion and non-functional binding [47] mediated by non-
Figure 3 Correlation of E. coli mRNA expression with Ka, protein solubility, and the fraction of charged residues. (a) Correlation
between expression and the rate of non-synonymous substitutions (Ka; Spearman’s r = -0.45, P <10
-10
). (b) Correlation between Ka and the rate
of synonymous substitutions (Ks; r = 0.66, P <10
-10
). (c) Correlation between expression and protein solubility measured in vitro [48] (r = 0.27,
P <10
-10
). (d) Correlation between expression and the fraction of charged residues (r = 0.28, P <10
-10
). The red lines on each panel represent a
200-point moving average.
Plata et al. Genome Biology 2010, 11:R98
/>Page 5 of 10
specific hydrophobic interactions. Using the genome-wide
protein solubility data for E. coli proteins obtained by
Niwa et al. [48], we indeed observed a significant correla-
tion between solubility and expressi on (Figure 3c; Spear-
man’ s r = 0.27, P <10
-10
). Importantly, the observed
selection for solubility does not explain the correlation
between the protein evolutionary rate and expression (Fig-
ure 3a; r = -0.45, P <10
-10
); the partial correlation between
Ka and expre ssion, co ntrolling either for solubility or for
the fraction of charged residues, is still significant (r =
-0.42 and -0.41, respectively; P <10
-10
).
The positive correlation between solubility and expres-
sion is in agreement with an increase in the fraction of
charged residues (Figure 3d; r = 0.28, P <10
-10
)anda
simultaneous decrease in the fraction of hydrophobic
residues (r = -0.16, P <10
-10
) in highly expressed E. coli
proteins. We observed similar results by analyzing E. coli
protein duplicates (paralogs) with different expression
levels . By directly comparin g duplicates expressed at dif-
ferent levels, many confounding factors, such as differ-
ences in foldi ng topology or protein secondary structure,
are removed. The analysis of 370 E. coli paralogs (see
Materials and methods) demonstrated a decrease in t he
fraction of hydrophobic residues (paired Wilcoxon signed
rank test, P =7×10
-4
) and a simultaneous increase in
the fraction of charged residues (P =7×10
-6
)inthe
duplicates with higher expression levels.
The analysis of 602 E. co li protein structures currently
available in the PDB (see Materials and methods) con-
firmed a significant increase in the fraction of solvent-
exposed charged residues in highly expressed proteins
(r = 0.18, P =6×10
-6
). While such an increase may lead
to higher protein stabilities [49], a proposed consequence
of selection for translational robustness [22], we did not
detect strong correlations between mRNA expression
and other structural features usually associated with
increased protein stability [18,22]. For example, we did
not observe a significant increase in the fraction of buried
hydrophobic residues (r = 0.06, P = 0.13) [50-52] or an
increase in the average number of contacts per residue
(contact density) in highly expressed E. coli proteins (r =
0.02, P = 0.96). Neither did we find a decrease in the frac-
tion of residues in loops or unstructured prot ein regions
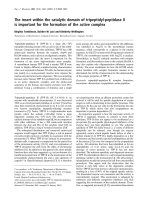
(r = 0.07, P = 0.06) [53]. Our analysis of experimentally
determined E. coli protein stabilities assembled in the
ProTherm database [54] also failed to reveal any signifi-
cant correlation between protein stability, measured
either by protein melting temperature (r = -0.14, P =
0.46) or folding free energy (ΔG, r = -0.08, P = 0.70), and
mRNA expression level (Figure 4a,b). We also did not
detect significant changes in the contact order, a struc-
tural measure strongly associated with folding speed
[55,56], in highly expressed bacterial proteins (r = -0.01,
P = 0.8).
Overall, the computational analysis d escribed above
suggests that, at least based on the curre ntly available
datasets, an increase in folding speed and/or protein sta-
bility for highly expressed bacterial proteins is unlikely
to play a major role in constraining the protein molecu-
lar clock in E. coli.
Discussion
The results presented here demonstrate that, at least in
E. coli, the cost associated with the gratuitous expression
of a protein is significantly higher than the addi tional
toxicity cost incurred by destabilization or misfolding of
thesameamountofprotein;by‘ gratuitous’ we imply
here that the protein has no effect on fitness through its
biological function. It is important to emphasize that
our growth m easurements are not sensitive enough to
detect small f itness effects - for example, decreases in
the growth rate on the order of 1% or less - and conse-
quently we canno t rule out additional costs specifically
related to misfolding toxicity [57]. In fact, a detailed
study by Lindner et al. [58] using time-lapse microscopy
showed that the presence of protein aggregates in E. coli
has an effect on growth rate at the level of individual
cells. Nevertheless, our experiments do show that the
misfolding toxicity cost is significantly smaller than
other costs associated with protein expression.
We believe that the main expression costs specifically
in this bacterium are related to translational efficiency
and jamming of the cell’scytoplasmwithuselesspro-
teins. Importantly, expre ssion costs associated with
amino acid waste, or the energy required for gratuitous
expression, were recently shown by Stoebel et al. [ 59] to
play a relatively minor role. On the other hand, both
gratuitous protein expression and suboptimal codons
can significantly slow bacterial growth, for instance, by
reducing the pool of free ribosomes in the cell [33,41].
This effect will preferentially affect highly expressed
genes bound by a re latively larger number of ribosomes.
A gene with non-optimal codons will slow the rate of
translation (speed of ribosomal motion) and thus titrate
more ribosomes. A reduced pool of free ribosomes will
necessarily slow expression of all bacterial genes and
thus decrease the rate of biomass synthesis [60].
Interestingly, we observed that bacteria expressing two
of the mutants (F758S and G353D) grew significantly
faster than cells expressing native LacZ protein (Figure
2a), although still not as fast a s uninduced E. coli.This
intriguing result demonstrates that titration of ribo-
somes cannot be the only explanation for the costs asso-
ciated with gratuitous protein synthesis. The F758S and
G353D proteins had t he lowest catalytic activities of all
constructs (Table 1) and both mutants, as well as
I141N, were found mostly in inclusion bodies. It is likely
that the localization of the LacZ proteins to inclusion
Plata et al. Genome Biology 2010, 11:R98
/>Page 6 of 10
bodies prevents jamm ing of the cytoplasm and relieves
effects associated with non-functional binding. It was
previously shown that an asymmetric partition of inclu-
sion bodies during cell division may result in a cell reju-
venationphenotype[58].Wewouldliketoemphasize
that this result does not support t he misfolding to xicity
hypothesis, as these mutants grew faster than the strain
expressing WT LacZ. Based on the growth rates of
mutants primarily localized to inclusion bodies (V567D,
F758S, I141N; average growth decrease 6.7%) and the
proteins remaining in the cytoplasm (WT, V567D,
A880E; average growth decrease 14%), one can conclude
that effects of jamming and translational efficiency make
approximately similar contributions to fitness.
An important separate question in the context of the
mistra nslation-induced misfolding hypothesis is whether
phenotypic (transcriptional or translational) mutations
can cause enough protein misfolding to be significantly
cytotoxic. Although suboptimal codons are expected to
substantially increase the translational error rate [39], no
correlation was observed between codon optimization
and the fraction of properly folded GFP by Kudla et al.
[41]. Even if relatively rare, phenotypic mutations can
sti ll be significantly damaging if they occur in function-
ally and structurally important sties. This may explain a
well-established correlation between codon optimization
and evolut ionary conservation of corresponding protein
sites [61-63]. This correlation is not necessarily a conse-
quence of selection against mistranslation-i nduced toxi-
city, and again may be primarily related to the loss of
functional proteins and the cost of additional protein
synthesis necessa ry to compensat e for the misfolding. In
fact, it has been reported that essential bacterial proteins
have lower aggregation propensities than those predicted
for non-essential proteins [46].
While our study demonstrates that misfolding toxicity
is unlikely to be a universally dominant factor connect-
ing expression and the protein molecular clock in all
species, we cannot rule out the possibility that toxicity
may play an important role in other species. We note,
however, that in higher organisms the correlations
between mRNA expression and the protein molecular
clock are generally much weaker than in some microbes.
For example, Liao et al. [64] demonstrated that expres-
sion plays a relatively minor role in constraining the
molecular clock in mammalian species. Also, by com-
paring evolutionary rate of separate and fused protein
domains in human and Arabidopsis,Wolfet al.[65]
found a comparable contribution from expression and
structural-functional constraints.
A number of elegant experimental studies have demon-
strated a cytotoxic effect of several misfolded or marginally
Figure 4 Relationship between protein stability and mRNA expression. The experimentally measured stability data were obtained from the
ProTherm database [54], and the expression data for E. coli were obtained from the study by Lu et al. [78]. (a) Correlation between mRNA
expression and melting temperature for 28 proteins (r = -0.14, P = 0.45). (b) Correlation between mRNA expression and folding free energy for
23 proteins (r = -0.08, P = 0.70). The dashed red line represents the linear regression between each variable and the natural logarithm of the
expression values.
Plata et al. Genome Biology 2010, 11:R98
/>Page 7 of 10
stable proteins in highe r organisms [66,67]. For instance,
several hu ndred muta tions in t he SOD1 pr otein were
shown to result in aggregates associated with amyotrophic
lateral sclerosis in humans [68]; also, non-natural peptides
have been used to induce cytotoxic aggregates of GFP in
C. elegans [69]. Although these studies directly demon-
strate the importance of misfolding and aggregation for
some specific proteins, the extent to which these effects
dominate the molecular clock for all proteins in these and
other species needs to be investigated and again compared
to other contributing factors.
Conclusions
Our experimental results suggest that selection against
toxic protein misfolding is unlikely to be the universal
and dominant factor determining the rate of the protein
molecular clock in all species. We demonstrate that, at
least in E. coli, other factors associated with gratuitous
protein synthesis, such as translational efficiency and
possibly jamming of the cytoplasm, are likely to be the
primary constraints. Our computational analyses also
suggest a relativ ely weaker, but statistically significant,
selection for increasing solubility and polarity in highly
expressed E. coli proteins.
Materials and methods
Strains and mutant generation
E. coli K12 strain GP4 (W3102, XA 21Z, lacI
q
) was used
in all experiments. lacZ was expressed from the IPTG-
inducible lac promoter in plasmid PIV18 [33]; PIV18 is
a pBR322 derivative that carries a mutation in the Shine
Dalgarno sequence of the lacZ transcript that increases
translation efficiency. Site directed mutagenesis was car-
ried out using St ratagene’s QuikChange Lightning kit
(Stratagene, Cedar Creek, TX, USA). pBR322 was used
as the empty plasmid control.
Growth curve analysis
For each construc t, a sweep of colonies was grown over-
night on Luria-Bertani (LB) liquid media supplemented
with 100 μg/ml ampicillin. Overnight cultures were diluted
by a 1:100 factor and grown on M9 minimal media suple-
mented with 0.5% casaminoacids, 0.25 μg/ml thiamine,
100 μg/ml ampicillin and either 0.4% glycerol or acetate as
carbon sources. We transfered 300 μl of cells with an
OD600 of 0.5 to flasks containing 5.5 ml of prewarmed
media suplemented with the appropiate amount of IPTG.
Two hours after induction, OD600 was measured every 45
minutes. Growth rate was determined as the regression
line slope of time and the logarithm of OD600.
SDS-PAGE and western blotting
The equivalent of 200 μl of cells at an OD600 of 0.7 was
collected by centrifugation and lysed using Novagen’ s
BugBuster (primary amine-free) Protein Extraction
Reagent (Novagen, Merck, Darmstadt, Ge rmany). Solu-
ble proteins were retrieved after centrifugation of the
lysed cells and aggregated proteins were then harvested
following instructions for inclusion body purification
described in the BugBuster reagent manual. Both frac-
tions were saved in a 50 μl volume including 10 μl4×
SDS loading buffer, boiled, and electrophoresed on a
10% SDS polyacrylamide gel. Gels were stained with
Coomassie blue and scanned for analysis. For the analy-
sis of total protein, cells were lysed in BugBuster reagent
containing rLysozyme and boiled after addition of 4×
SDS loading buffer. Bands were quantified using the
ImageJ program [70].
Protein samples separated by SDS-PAGE as described
above were blotted overnight onto a nitr ocellulose
membrane and incubated with Anti-GroEL antibody
produced in rabbit 1:10 000 (Sigma Aldrich, St Louis,
MO, USA). Blots were blocked with 5% non-fat dry
milk, incubated with 1:3,000 anti-rabbit horseradish per-
oxidase conjugate antibody and visualized with Amer-
sham’ s ECL Plus Western Blotting Reagent (GE
Healthcare, Munich, Germany).
Structural analysis of E. coli proteins
Intheanalysisweused602E. coli protein structures
currently available in the PDB [71]. To prevent sampling
biases, we filtered available PDB entries so that no two
protein structures used in the calculations had sequence
identity higher than 90%; similar results were obtained
without filtering. We defined buried residues as those
with a solvent accessible area smaller than 16% [72,73].
Solvent accessibility was calculated by the DSSP [74]
program. The fraction of protein residues in loops was
also calculated using DSSP. Two non-adjacent protein
residues were considered to be in contact if any two of
their non-hydrogen atoms were closer than 4.5 Å [75].
The protein contact density was defined as the average
number of non-adjacent contacts per residue. Contact
order was calculated as (L × N)
-1
× ΣΔS
ij
,whereNis
the total number of contacts, L is the to tal number of
residues in the protein and ΔS
ij
, which is summed over
all contacts, is the number of amino acids separating
contacting residues [56]. In vitro solubility data for E.
coli proteins was obtained directly from the study of
Niwa et al. [48].
Correlation of the synonymous (Ks) and non-synonymous
(Ka) substitution rates with expression
Orthologous open reading frames and protein sequences
from E. coli and Salmonella enterica were used to calcu-
late Ks and Ka values. The E. coli-Salmonella orthologs
were determined as bi-directional best hits using protein
BLAST [76]. Ka and Ks values were calculated using the
Plata et al. Genome Biology 2010, 11:R98
/>Page 8 of 10
maximum likelihood method implemented in the PAML
package [77]. The mRNA expression data reported by
Lu et al. [78] w ere used to calculate the correlations.
For the analysis of duplicated genes, we defined dupli-
catesaspairsofE. coli proteins having more than 40%
sequence identity that could b e aligned for at least 80%
of their total length using BLAST. In the analysis of
duplicates, we used expression data from 466 experi-
ments in the Many Microbes Microarrays Database [79].
We selected for t he analysis only the pairs for which
one paralog had higher expression values in more than
80% of the reported experiments.
Abbreviations
GF: green fluorescent protein; IPTG: isopropyl b-D-1-thiogalactopyranoside;
Ka: the rate of non-synonymous substitutions; Ks: the rate of synonymous
substitutions; PDB: Protein Data Bank; WT: wild type.
Acknowledgements
We would like to thank Steen Pedersen (University of Copenhagen) for
kindly providing the WT LacZ and pBR322 plasmids. We also thank Barry
Honig for many helpful discussions on protein folding and stability. This
work was supported in part by NIGMS grant GM079759 to DV, and the
National Centers for Biomedical Computing U54CA121852 grant to
Columbia University.
Author details
1
Center for Computational Biology and Bioinformatics, Columbia University,
1130 St Nicholas Ave, New York City, NY 10032, USA.
2
Integrated Program in
Cellular, Molecular, Structural, and Genetic Studies, Columbia University, 1130
St Nicholas Ave, New York City, NY 10032, USA.
3
Department of
Microbiology and Immunology, Columbia University, 701 W. 168 St, New
York City, NY 10032, USA.
4
Department of Biochemistry and Molecular
Biophysics, Columbia University, 701 W. 168 St, New York City, NY 10032,
USA.
5
Department of Biomedical Informatics, Columbia University, 1130 St
Nicholas Ave, New York City, NY 10032, USA.
Authors’ contributions
GP carried out the experiments and computational analyses. DV, MG and GP
conceived the experiments and analyzed the results. DV and GP wrote the
paper with revisions by MG. All authors read and approved the final
manuscript.
Competing interests
The authors declare that they have no competing interests.
Received: 8 June 2010 Revised: 3 September 2010
Accepted: 29 September 2010 Published: 29 September 2010
References
1. Zuckerkandl E, Pauling L: Evolutionary divergence and convergence in
proteins. In Evolving Genes and Proteins. Edited by: Bryson V, Vogel H. New
York: Academic Press; 1965:97-166.
2. Margoliash E: Primary structure and evolution of cytochrome C. Proc Natl
Acad Sci USA 1963, 50:672-679.
3. Benton MJ, Donoghue PC: Paleontological evidence to date the tree of
life. Mol Biol Evol 2007, 24:26-53.
4. Gillespie JH: The Causes of Molecular Evolution New York: Oxford University
Press 1991.
5. Ayala FJ: Molecular clock mirages. Bioessays 1999, 21:71-75.
6. Zuckerkandl E: Evolutionary processes and evolutionary noise at the
molecular level. I. Functional density in proteins. J Mol Evol 1976,
7:167-183.
7. Wilson AC, Carlson SS, White TJ: Biochemical evolution. Annu Rev Biochem
1977, 46:573-639.
8. Wang Z, Zhang JZ: Why Is the correlation between gene importance and
gene evolutionary rate so weak? PLoS Genet 2009, 5:e1000329.
9. Vitkup D, Kharchenko P, Wagner A: Influence of metabolic network
structure and function on enzyme evolution. Genome Biol 2006, 7:R39.
10. Jordan IK, Rogozin IB, Wolf YI, Koonin EV: Essential genes are more
evolutionarily conserved than are nonessential genes in bacteria.
Genome Res 2002, 12:962-968.
11. Hirsh AE, Fraser HB: Protein dispensability and rate of evolution. Nature
2001, 411:1046-1049.
12. Jordan IK, Wolf YI, Koonin EV: No simple dependence between protein
evolution rate and the number of protein-protein interactions: only the
most prolific interactors tend to evolve slowly. BMC Evol Biol 2003, 3:1.
13. Fraser HB, Hirsh AE, Steinmetz LM, Scharfe C, Feldman MW: Evolutionary
rate in the protein interaction network. Science 2002, 296:750-752.
14. Rocha EP, Danchin A: An analysis of determinants of amino acids
substitution rates in bacterial proteins. Mol Biol Evol 2004, 21:108-116.
15. Koonin EV: Systemic determinants of gene evolution and function. Mol
Syst Biol 2005, 1:2005 0021.
16. Xia Y, Franzosa EA, Gerstein MB:
Integrated assessment of genomic
correlates of protein evolutionary rate. PLoS Comput Biol 2009, 5:
e1000413.
17. Pal C, Papp B, Hurst LD: Highly expressed genes in yeast evolve slowly.
Genetics 2001, 158:927-931.
18. Drummond DA, Bloom JD, Adami C, Wilke CO, Arnold FH: Why highly
expressed proteins evolve slowly. Proc Natl Acad Sci USA 2005,
102:14338-14343.
19. Marais G, Duret L: Synonymous codon usage, accuracy of translation, and
gene length in Caenorhabditis elegans. J Mol Evol 2001, 52:275-280.
20. Rocha EP: The quest for the universals of protein evolution. Trends Genet
2006, 22:412-416.
21. Pal C, Papp B, Lercher MJ: An integrated view of protein evolution. Nat
Rev Genet 2006, 7:337-348.
22. Drummond DA, Wilke CO: Mistranslation-induced protein misfolding as a
dominant constraint on coding-sequence evolution. Cell 2008,
134:341-352.
23. Drummond DA, Wilke CO: The evolutionary consequences of erroneous
protein synthesis. Nat Rev Genet 2009, 10:715-724.
24. Kramer EB, Farabaugh PJ: The frequency of translational misreading errors
in E. coli is largely determined by tRNA competition. RNA 2007, 13:87-96.
25. Stansfield I, Jones KM, Herbert P, Lewendon A, Shaw WV, Tuite MF:
Missense translation errors in Saccharomyces cerevisiae. J Mol Biol 1998,
282:13-24.
26. Müller-Hill B: The lac Operon: A Short History of a Genetic Paradigm.
New York: Walter de Gruyter 1996.
27. Dong HJ, Nilsson L, Kurland CG: Gratuitous overexpression of genes in
Escherichia coli leads to growth inhibition and ribosome destruction. J
Bacteriol 1995, 177:1497-1504.
28. Dekel E, Alon U: Optimality and evolutionary tuning of the expression
level of a protein. Nature 2005, 436:588-592.
29. Pakula AA, Sauer RT: Genetic analysis of protein stability and function.
Annu Rev Genet 1989, 23:289-310.
30. Matthews BW: Structural and genetic analysis of the folding and function
of T4 lysozyme.
FASEB J 1996, 10:35-41.
31. Vlahovicek K, Pintar A, Parthasarathi L, Carugo O, Pongor S: CX, DPX and
PRIDE: WWW servers for the analysis and comparison of protein 3D
structures. Nucleic Acids Res 2005, 33:W252-W254.
32. Capriotti E, Fariselli P, Casadio R: I-Mutant2.0: predicting stability changes
upon mutation from the protein sequence or structure. Nucleic Acids Res
2005, 33:W306-W310.
33. Vind J, Sorensen MA, Rasmussen MD, Pedersen S: Synthesis of proteins in
Escherichia coli is limited by the concentration of free ribosomes.
Expression from reporter genes does not always reflect functional
mRNA levels. J Mol Biol 1993, 231:678-688.
34. Sambrook J, Russell DW: Molecular Cloning: A Laboratory Manual Woodbury,
NY; CSHL Press 2001.
35. Lesley SA, Graziano J, Cho CY, Knuth MW, Klock HE: Gene expression
response to misfolded protein as a screen for soluble recombinant
protein. Protein Eng 2002, 15:153-160.
36. Parsell DA, Sauer RT: Induction of a heat shock-like response by unfolded
protein in Escherichia coli: Dependence on protein level not protein
degradation. Genes Dev 1989, 3:1226-1232.
Plata et al. Genome Biology 2010, 11:R98
/>Page 9 of 10
37. Wang IN, Deaton J, Young R: Sizing the holin lesion with an endolysin-
beta-galactosidase fusion. J Bacteriol 2003, 185:779-787.
38. Andersson SG, Kurland CG: Codon preferences in free-living
microorganisms. Microbiol Rev 1990, 54:198-210.
39. Bulmer M: The selection-mutation-drift theory of synonymous codon
usage. Genetics 1991, 129:897-907.
40. Akashi H: Gene expression and molecular evolution. Curr Opin Genet Dev
2001, 11:660-666.
41. Kudla G, Murray AW, Tollervey D, Plotkin JB: Coding-sequence
determinants of gene expression in Escherichia coli. Science 2009,
324:255-258.
42. Pal C, Papp B, Lercher MJ: An integrated view of protein evolution. Nat
Rev Genet 2006, 7:337-348.
43. Koonin EV, Wolf YI: Constraints and plasticity in genome and molecular-
phenome evolution. Nat Rev Genet 2010, 11:487-498.
44. Dobson CM: Protein misfolding, evolution and disease. Trends Biochem Sci
1999, 24:329-332.
45. Tartaglia GG, Pechmann S, Dobson CM, Vendruscolo M: A relationship
between mRNA expression levels and protein solubility in E. coli. J Mol
Biol 2009, 388:381-389.
46. de Groot NS, Ventura S: Protein aggregation profile of the bacterial
cytosol. PLoS One 2010, 5:e9383.
47. Zhang J, Maslov S, Shakhnovich EI: Constraints imposed by non-functional
protein-protein interactions on gene expression and proteome size. Mol
Syst Biol 2008, 4:210.
48. Niwa T, Ying BW, Saito K, Jin W, Takada S, Ueda T, Taguchi H: Bimodal
protein solubility distribution revealed by an aggregation analysis of the
entire ensemble of Escherichia coli proteins. Proc Natl Acad Sci USA 2009,
106:4201-4206.
49. Strub C, Alies C, Lougarre A, Ladurantie C, Czaplicki J, Fournier D: Mutation
of exposed hydrophobic amino acids to arginine to increase protein
stability. BMC Biochem 2004, 5:9.
50. Baldwin RL: Energetics of protein folding. J Mol Biol
2007, 371:283-301.
51. Dill KA: Dominant forces in protein folding. Biochemistry 1990,
29:7133-7155.
52. Honig B, Yang AS: Free energy balance in protein folding. Adv Protein
Chem 1995, 46:27-58.
53. Thompson MJ, Eisenberg D: Transproteomic evidence of a loop-deletion
mechanism for enhancing protein thermostability. J Mol Biol 1999,
290:595-604.
54. Bava KA, Gromiha MM, Uedaira H, Kitajima K, Sarai A: ProTherm, version
4.0: thermodynamic database for proteins and mutants. Nucleic Acids Res
2004, 32:D120-121.
55. Ivankov DN, Garbuzynskiy SO, Alm E, Plaxco KW, Baker D, Finkelstein AV:
Contact order revisited: influence of protein size on the folding rate.
Protein Sci 2003, 12:2057-2062.
56. Plaxco KW, Simons KT, Baker D: Contact order, transition state placement
and the refolding rates of single domain proteins. J Mol Biol 1998,
277:985-994.
57. Thatcher JW, Shaw JM, Dickinson WJ: Marginal fitness contributions of
nonessential genes in yeast. Proc Natl Acad Sci USA 1998, 95:253-257.
58. Lindner AB, Madden R, Demarez A, Stewart EJ, Taddei F: Asymmetric
segregation of protein aggregates is associated with cellular aging and
rejuvenation. Proc Natl Acad Sci USA 2008, 105:3076-3081.
59. Stoebel DM, Dean AM, Dykhuizen DE: The cost of expression of
Escherichia coli lac operon proteins is in the process, not in the
products. Genetics 2008, 178:1653-1660.
60. Tuller T, Waldman YY, Kupiec M, Ruppin E: Translation efficiency is
determined by both codon bias and folding energy. Proc Natl Acad Sci
USA 2010, 107:3645-3650.
61. Akashi H: Synonymous codon usage in Drosophila melanogaster: natural
selection and translational accuracy. Genetics 1994, 136:927-935.
62. Huang Y, Koonin EV, Lipman DJ, Przytycka TM: Selection for minimization
of translational frameshifting errors as a factor in the evolution of codon
usage. Nucleic Acids Res 2009, 37:6799-6810.
63. Stoletzki N, Eyre-Walker A: Synonymous codon usage in Escherichia coli:
selection for translational accuracy. Mol Biol Evol 2007, 24:374-381.
64. Liao BY, Scott NM, Zhang J: Impacts of gene essentiality, expression
pattern, and gene compactness on the evolutionary rate of mammalian
proteins. Mol Biol Evol 2006, 23:2072-2080.
65. Wolf MY, Wolf YI, Koonin EV: Comparable contributions of structural-
functional constraints and expression level to the rate of protein
sequence evolution. Biol Direct 2008, 3:40.
66. Bucciantini M, Giannoni E, Chiti F, Baroni F, Formigli L, Zurdo J, Taddei N,
Ramponi G, Dobson CM, Stefani M: Inherent toxicity of aggregates
implies a common mechanism for protein misfolding diseases. Nature
2002, 416:507-511.
67. Gidalevitz T, Ben-Zvi A, Ho KH, Brignull HR, Morimoto RI: Progressive
disruption of cellular protein folding in models of polyglutamine
diseases. Science 2006, 311:1471-1474.
68. Munch C, Bertolotti A: Exposure of hydrophobic surfaces initiates
aggregation of diverse ALS-causing superoxide dismutase-1 mutants.
J Mol Biol 2010, 399:512-525.
69. Link CD, Fonte V, Hiester B, Yerg J, Ferguson J, Csontos S, Silverman MA,
Stein GH: Conversion of green fluorescent protein into a toxic,
aggregation-prone protein by C-terminal addition of a short peptide.
J Biol Chem 2006, 281:1808-1816.
70. Abramoff MD, Magelhaes PJ, Ram SJ: Image Processing with ImageJ.
Biophotonics Int 2004, 11:36-42.
71. Berman HM, Westbrook J, Feng Z, Gilliland G, Bhat TN, Weissig H,
Shindyalov IN, Bourne PE: The Protein Data Bank. Nucleic Acids Res 2000,
28:235-242.
72. Momen-Roknabadi A, Sadeghi M, Pezeshk H, Marashi SA: Impact of residue
accessible surface area on the prediction of protein secondary
structures. BMC Bioinformatics 2008, 9:357.
73. Rost B, Sander C: Conservation and prediction of solvent accessibility in
protein families. Proteins 1994, 20:216-226.
74. Kabsch W, Sander C: Dictionary of protein secondary structure: pattern
recognition of hydrogen-bonded and geometrical features. Biopolymers
1983, 22:2577-2637.
75. Bloom JD, Drummond DA, Arnold FH, Wilke CO: Structural determinants
of the rate of protein evolution in yeast. Mol Biol Evol 2006, 23:1751-1761.
76. Altschul SF, Madden TL, Schaffer AA, Zhang J, Zhang Z, Miller W,
Lipman DJ: Gapped BLAST and PSI-BLAST: a new generation of protein
database search programs. Nucleic Acids Res 1997, 25:3389-3402.
77. Yang ZH: PAML: a program package for phylogenetic analysis by
maximum likelihood. Comput Appl Biosci 1997, 13:555-556.
78. Lu P, Vogel C, Wang R, Yao X, Marcotte EM: Absolute protein expression
profiling estimates the relative contributions of transcriptional and
translational regulation. Nat Biotechnol 2007, 25:117-124.
79. Faith JJ, Driscoll ME, Fusaro VA, Cosgrove EJ, Hayete B, Juhn FS,
Schneider SJ, Gardner TS: Many Microbe Microarrays Database: uniformly
normalized Affymetrix compendia with structured experimental
metadata. Nucleic Acids Res 2008, 36:D866-870.
doi:10.1186/gb-2010-11-9-r98
Cite this article as: Plata et al.: The rate of the molecular clock and the
cost of gratuitous protein synthesis. Genome Biology 2010 11:R98.
Submit your next manuscript to BioMed Central
and take full advantage of:
• Convenient online submission
• Thorough peer review
• No space constraints or color figure charges
• Immediate publication on acceptance
• Inclusion in PubMed, CAS, Scopus and Google Scholar
• Research which is freely available for redistribution
Submit your manuscript at
www.biomedcentral.com/submit
Plata et al. Genome Biology 2010, 11:R98
/>Page 10 of 10