Báo cáo y học: " Comparative transcriptomics among floral organs of the basal eudicot Eschscholzia californica as reference for floral evolutionary developmental studies" pps
Bạn đang xem bản rút gọn của tài liệu. Xem và tải ngay bản đầy đủ của tài liệu tại đây (1.7 MB, 21 trang )
RESEARC H Open Access
Comparative transcriptomics among floral organs
of the basal eudicot Eschscholzia californica as
reference for floral evolutionary developmental
studies
Laura M Zahn
1,2,8†
, Xuan Ma
1,2,3†
, Naomi S Altman
2,4
, Qing Zhang
2,4,9
, P Kerr Wall
1,2,10
, Donglan Tian
1,11
,
Cynthia J Gibas
5
, Raad Gharaibeh
5
, James H Leebens-Mack
1,2,12
, Claude W dePamphilis
1,2
, Hong Ma
1,2,3,6,7*
Abstract
Background: Molecular genetic studies of floral development have concentrated on several core eudicots and
grasses (monocots), which have canalized floral forms. Basal eudicots possess a wider range of floral morphologies
than the core eudicots and grasses and can serve as an evolutionary link between core eudicots and monocots,
and provide a reference for studies of other basal angiosperms. Recent advances in genomics have enabled
researchers to profile gene activities during floral development, primarily in the eudicot Arabidopsis thaliana and
the monocots rice and maize. However, our understanding of floral developmental processes among the basal
eudicots remains limited.
Results: Using a recently generated expressed sequence tag (EST) set, we have designed an oligonucleotide
microarray for the basal eudicot Eschscholzia californica (California poppy). We performed microarray experiments
with an interwoven-loop design in order to characterize the E. californica floral transcriptome and to identify
differentially expressed genes in flower buds with pre-meiotic and meiotic cells, four floral organs at pre-anthesis
stages (sepals, petals, stamens and carpels), developing fruits, and leaves.
Conclusions: Our results provide a foundation for comparative gene expre ssion studies between eudicots and
basal angiosperms. We identified whorl-specific gene expression patterns in E. californica and examined the floral
expression of several gene families. Interestingly, most E. californica homologs of Arabidopsis genes important for
flower development, except for genes encoding MADS-box transcription factors, show different expression patterns
between the two species. Our comparative transcriptomics study highlights the unique evolutionary position of E.
californica compared with basal angiosperms and core eudicots.
Background
The eudicots are believed to have originated approxi-
mately 130 million years ago [1]. They include about
70% of all flowering plant species and consist of core
eudicots [2-4], which include the groups containing Ara-
bidopsis thaliana and Antirrhinum majus,andspecies
that branched earlier from these groups and are at basal
positions within the eudicot clade. The earliest
branching lineage of the eudicots, the Ranunculales,
contains the Papaveraceae (poppy) family, of which
Eschscholzia cal ifornica (California poppy) is a member
[3].Thecoreeudicotscommonlyhavestable(thatis,
canalized) flower architecture(Figure1a);bycontrast,
the basal eudicots exhibit a wider r ange of floral pat-
terns [5] (see examples in Figure 1a). Comp aring the
morphology and the underlying mechanisms of flower
development between the core and basal eudicots may
help us better understand the evolution of flower struc-
tures and development.
Molecular genetic studies in Arabidopsis, Antirrhinu m
and other core eudicots have uncovered the functions of
* Correspondence:
† Contributed equally
1
Department of Biology, The Pennsylvania State University, University Park,
PA 16802, USA
Full list of author information is available at the end of the article
Zahn et al. Genome Biology 2010, 11:R101
/>© 2010 Zahn et al.; licensee BioMed Central Ltd. This is an ope n access article distribut ed under the t erms of the Crea tive Commons
Attribution License (http://creativecommons .org/licenses/by/2.0), which permits unrestr icted use, distribution, and reproduct ion in
any medium, provided the original work is properly cited.
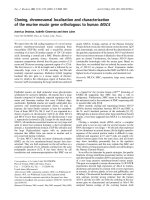
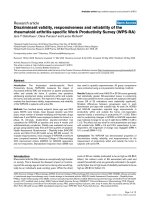
Figure 1 An angiosperm phylogram with illustrations of flower structures and the loo p design of the E. californica microarray
experiments. (a) A phylogram of angiosperms with flower architectures for several representative species. C, carpel; It, inner tepals; Ot, outer
tepals; P, petal; S, sepal; St, stamen; Std, staminodia. (b) We sampled from eight different tissues, including leaves, small floral buds, medium floral
buds, four floral organs (sepals, petals, stamens, and pistils) at anthesis, and young fruits (four replicates for each tissue, 32 in total). Each line
connects samples from two tissues in one microarray hybridization reaction, and four different colors represent four replicates of each tissue. The
points of the arrows point to the samples labeled with Cy5 dyes while the bases of the arrows point to the samples labeled with Cy3 dyes.
Zahn et al. Genome Biology 2010, 11:R101
/>Page 2 of 21
many genes involve d in regulating flowering time and
floral organ identity and development [6-8]. In particu-
lar, it is known that several MADS-box genes are
required to control flowering time and floral organ iden-
tities, as well as anther, ovule and fruit development.
These include the well-known ABC genes APETALA1
(A function), APETALA3 and PISTILLATA (B function),
and AGAMOUS (C function) from Arabidopsis,and
their respective functional homologs from Antirrhinum
(SQUAMOS A, DEFICIENS, GLOBOSA ,andPLENA)
[9-11]. Comparative studies of core e udicots suggest
that homologs of B- and C-function genes have rela-
tively conserved functions, although some divergences
have also been observed. Putative ortholo gs of these
MADS-box genes may have diverged expression pat-
terns in different species and t he expression difference
between recent duplicates is often associated with sub-
functionalization [10,11]. In addition, several MADS-box
genes have been found to be important for floral organ
identities in the monocots [12-15]. However, b oth the
long evolutionary distance and the highly diverged
flower architectures between monocots and core eudi-
cots have made it difficult to study the evolution of
floral gene function.
The investigation of floral gene function in the basal
eudicots serves to bridge the gap between core eudicots
and monocots. Molecular and expression studies of
floral genes have been reported for some basal eudicots,
providing informative initial knowledge on the conserva-
tion and divergence of floral gene activities among eudi-
cots [16-18]. Molecular evolutionary studies of several
MADS-box subfamilies, complemented by expression
analyses, support that some of the MADS-box genes
have maintained conserved functions throughout angios-
perm evolution [10,19-22]. For example, expression stu-
dies of floral MADS-box genes in E. californica
demonstrated that genes in the AGAMOUS, GLOBOSA
and SEPALLATA subfamilies are highly conserved
between basal and core eudicots [10,11,20]. Additionally,
in other ranunculids, expression divergences have also
been observed between recently duplicated MADS-box
genes [10,11].
High-throughput technologies, including microarrays,
can be used to analyze transcriptomes of individual
floral organs at specific developmental stages. Transcrip-
tome studies have been performed extensively for Arabi-
dopsis and, to a lesser extent, several other highly
derived core eudicots [18,23-28]. Among basal eudicots,
such studies have only been carried out recently in the
basal eudicot Aquilegia, w hich represents a different
ranunculid lin eage th an E. californica [29] . E. californica
is a potential model organism because it has a relatively
small plant size , many seeds per fruit and a short gen-
eration time, which facilitate genetic studies; because it
does not have determinate flowering and produces mul-
tiple flowers over its lifespan, providing easy access to
floral materials [30]; because it has a relatively small
genome; and because it both has an efficient system for
virally induced gene silencing and is transformable
[20,31-34]. Previous gene expression studies in E. cali-
fornica showed that there is very good co rrelation
between regions of gene expression and domains of
gene function [18,33,35,36]. An E. ca lifornica EST col-
lection of over 6,000 unigenes was constructed from a
pre-meiotic floral cDNA library [20], which provides
gen e sequence informat ion for microarray analysis of E.
californica leaf and floral transcriptomes. A t ranscrip-
tome-level analysis facilitates our understanding of floral
development in basal eudicots and sheds light on poten-
tial floral regulatory genes in E. californica.
In th is study, we used microarray technology to inves-
tigate transcriptomes in E. californica and to identify
differentially expressed genes in developing leaves and
floral buds at pre-meiotic (small buds) and meiotic
(medium buds) st ages. Additionally, we examined the
transcriptomes of developing fruits and four types of
floral organs (sepals, petals, stamens, and carpels) at the
pre-anthesis stage. We identified genes that are signifi-
cantly differentially expressed in different floral organs
or at different floral stages, in comparison with develop-
ing fruit and leaf tissues. We also analyzed the expres-
sion of genes in several regulatory gene families, some
of which contain homologs of known floral genes from
other organisms. Finally, wecomparedourresultswith
similar studies in Arabidop sis and recent studies [29,37]
in Aquilegia and Persea (avocado), a basal angiosperm
related to magnolia, to assess conservation and diver-
gence in gene expression and discuss their implications
for evolution of floral development in the eudicots.
Results and discussion
Construction and use of a microarray chip for E.
californica
To investigate the leaf and reproductive transcriptomes
of E. californica, we generated a custom Agilent micro-
array chip with features for 6,446 unigenes from the E.
californica EST collection [20] (see Materi als and meth-
ods for additional information). The oligo nucleotide
sequences for the probes were selected using available
sequence information from E. californica ESTs, as well
as other pub lic sequence information, avoiding non-spe-
cific hybridization as much as possible. Additional cri-
teria were used to consider potential secondary
structure and hybridization tempera ture (see Materials
and methods).
A primary objective was to obtain expression profiles
with the power to detect differential expression between
vegetative (leaves) and reproductive organs, between
Zahn et al. Genome Biology 2010, 11:R101
/>Page 3 of 21
different floral stages, and between different floral
organs. Therefore, we sampled the E. californica plants
for the following eight representative organs and stages
(for convenience, referred to generally as tissues here-
after): leaves, early floral buds, medium floral buds, four
floral organs (sepals, petals, stamens, and carpels) at
pre-anthesis, and young fruits. Four sets of plants were
sampled at t he same time daily (8:30 to 10:30 am) to
minimize variation due to circadian rhythms, yielding
four biological replicates. R NAs from these 32 samples
were used to generate cDNAs and labeled with Cy3 and
Cy5 dyes for two-channel mic roarray experiments.
Finally, w e used an interwoven loop design (Figure 1b)
to maximize th e comparative statistical power using a
limited number of hybridizations [38].
In an interwoven loop design, differences in gene
expressio n can be estimated for all pairs of tissu es with a
relatively small number of hybridizations [39]. Each of
the eight tissues was directly compared on the same slide
with one of four other tissues, with one biological repli-
cate for each comparison, resulting in a total of 16 hybri-
dizations. The comparison of the two tissues on the same
arrays allowed more precise results than those compared
indirectly via other tissues. The specific pairings on the
same array were chosen to optimize precision of compar-
isons for biologically important comparisons, while keep-
ing the precision of different comparisons as similar as
possible. Because our EST library was constructed with
floral bud mRNAs, we compared developing floral buds
at different stages wit h each of the four floral organs, and
compared each of these tissues with leaves, the only vege-
tative organ in this study, and developing fruits. The
comparison between small buds and leaves was aimed at
identifying differentially expressed genes at early repro-
ductive stages. We hypothesized that the sepal should be
the most leaf-like tissue among all floral organs ; wher eas
previous stu dies [24] suggest that the s tamens might
have the most complex transcriptome among the four
major floral organs [26]. In this study, the fruit tissue
represents the only post-anthes is tissue. We also consid-
ered the ABC model, which posits that sepals and petals
both require A-function genes, petals and stamens both
need B-function genes, and stamens and carpels both
depend on C-function genes. In addition, carpels and
fruits were developmentally related tissues, with small
and medium buds representing two consecutive stages in
floral development.
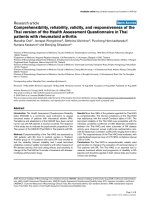
After microarray hybridizations, we tested the quality
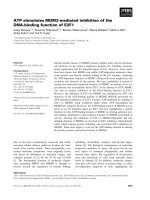
of the microarray experiments. We assessed the repro-
ducibility of the microarray hybridizations by determin-
ing the Pearson’ s correlation coefficients between the
biological replicates for each of the eight tissues (see
Figure 2 for an exam ple; the plots for the remaining
seven tissues can be found in Figure S1 in Additional
file 1). As shown in Figure 2, the Pearson’ s correlation
coefficients between any pair of the four biological repli-
cates of small buds, one of the most complex tissues in
this study, ranged from 0.94 to 0.97. The high c orrela-
tion values indicate that our results were highly
reproducible.
In addition, we examined signal intensities. Because
the EST library used for the probe design was con-
structed f rom mRNAs of flower buds, we assumed t hat
expression of most genes should be detected in our
microarray experiments from mostly flower-related tis-
sues. The value of 5.41 for log2 of hyb ridization inten-
sity (10% quantile of all genes on the chip) was
selected as a cutoff to identify ‘ present’ signal (Table 1;
for alternative cutoffs, see Additional file 2 for gene
numbers with 5% or 15% quantiles) similar to previous
microarray experiments in Arabidopsis [28]. For the
10% quantile, we identified the number of genes
detected in leaves (5,905), small buds (5,906), medium
buds (5,876), sepals (5,876), p etals (5,870), stamens
(5,877), carpels (5,851) and fruits (5,881). These results
were not surprising because the unigenes were derived
from EST data, which tend to favor genes that are
expressed at relatively high levels. Therefore, our
microarray chip and hybridization experiments were
able to detect the expression of several thousand genes
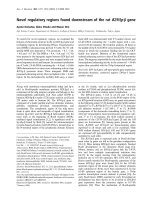
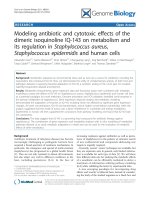
in eight major tissues of E. californica.Ofthegenes
examined, the majority of genes present in leaf were
also observed in small buds and medium buds (Figure
3a). In addition, most genes expressed in sepal were
also expressed in pet al (Figure 3b), suggesting simil ar
gene expression levels between these two tissues.
There was significant overlap of genes expressed in
petal and/or sepal with genes expressed in carpel and
stamen (Figure 3c). Similarly, there was c onsiderable
overlap of expressed genes between the carpel and
fruit (Figure 3d); this is not surprising since fruit is
derived from the ovary containi ng large carpel tissues.
Using the same cutoff for detection of expression,
5,554 genes were expressed in all 8 tissues (Table S1
in Additional file 2). We then examined Gene Ontol-
ogy (GO) categorization of all 5,554 genes and foun d
that the ‘unknown’ genes (homolog of genes annotated
as unknown in Arabidopsis) were under-represented
whilesomespecificfunctional categories were slightly
over-represented, including transferase and protein
binding group (Additional file 3 and Figure S2 in
Additional file 1). The observation that most of the
genes in this study were expressed in all tissues might
be because our EST collection represented relatively
abundant genes, including most house-keeping genes.
This might also explain why the ‘ unknown’ category
was under-represented because widely expressed genes
tend to have known annotations.
Zahn et al. Genome Biology 2010, 11:R101
/>Page 4 of 21
To verify our microarray results, real-time reverse-
transcription PCR (RT-PCR) was performed using
RNAs from the same e ight tissues as those in microa r-
ray experiments. Nine representative genes were exam-
ined relative to our reference gene (Figure S3 in
Additional file 1), including three MADS-box gene s,
EScaAGL2 (87251), EScaAGL6 (86583), and ES caDEF1
(83744) [10]. The o ther genes were homologs of a tran-
scription factor MYB35 (86850), a gamma-tip protein
(84392), a putative ferrodoxin (85140), a transducin
family/WD-40 repeat family protein (84618), and homo-
logs (86386 and 88941) of two Arabidopsis genes
encoding different ‘expressed proteins’ without a known
function. The real time RT-PCR results indicate that
the gene expression patterns were generally supportive
of the microarray resul ts, and were also consistent with
previous RNA in situ hyb ridization experiments
[10,11,40,41].
Figure 2 Correlation coefficients between signal intensities from four biological replicates of the small floral buds. Pearson’s correlation
coefficients were between 0.94 and 0.97 between any pair of the four biological replicates, indicating that the results were highly reproducible.
Zahn et al. Genome Biology 2010, 11:R101
/>Page 5 of 21
An overview of differential expression profiling of floral
development
Although the E. californica ESTs were obtained from a
cDNA library that was constructed with mRNAs from
multiple stages of floral developm ent [20], many of
the corresponding genes were also expressed in leaves,
differentstagesandvariousorgansoftheflower,as
wellasfruits.Todetermineadditional transcriptome
characteristics, we investigated whether specific genes
were expressed similarly or differentially in the tissues
tested. Of the 6,446 unigenes examined, most genes
(4,513 of 6,446) were not significantly differe ntially
expressed with more than a two-fold change between
any t wo of the eight tissues (with P-value < 0.05).
Nevertheless, 1,933 genes were found to be differen-
tially expressed between at least two tissues (Table S2 in
Additional file 4); however, most of t hese 1,933 genes
showed similar expression levels i n the other tissues
(Figure 4a). Not surprisingly, carpel and fruit, as well as
small and medium buds, showed the most similar
expression patterns at sequential development stages.
Leaf, the only vegetative organ in our study, had similar
expression patterns to those of the green organs (carpel
and fruit), which may be due to shared high expression
of photosynthesis-related genes (see below). Interest-
ingly, stamen had the most different expression profile,
suggesting a distinct developmental process relative to
the other floral organs.
To obtain additional insights into functions of those
differentially expressed genes, we exami ned the GO
categorization for the most similar Arabidopsis homo-
logs of each poppy gene using functions within The
Arabidopsis Information Resource (TAIR) website [42]
(Additional file 3). Genes encoding proteins categor-
ized as ‘ other enzyme activity’ (chi-square test wit h
P-value < 0.01) and ‘ struc tural molecule’ (P-value <
0.001) were en riched among those genes differentially
expressed between at least two tissues (Figure 4c) rela-
tive to the control group of all genes on the microar-
ray chip (Figure 4b). These results suggested that
variation in the expression of metabolic genes across
those tissues might be r esponsible, in part, for their
morphological and/or physiological differences in
E. californica.
Table 1 California poppy genes preferentially expressed in pre-meiotic and meiotic stage buds and in fruit
Gene BestATHit L SB MB S P ST C F Annotation
Preferentially expressed in pre-meiotic buds
89282 AT2G31210.1 5.3 9.0 7.1 5.6 5.3 5.3 5.3 5.1 bHLH
83967 AT5G16920.1 7.1 9.9 8.5 7.3 7.0 6.9 6.9 6.9
84082 AT1G68540.1 6.8 10.2 8.9 6.8 6.9 6.7 6.5 6.2 Oxidoreductase
87393 AT1G44970.1 5.1 7.9 5.9 5.1 5.0 5.0 5.6 5.2 Peroxidase
86946 AT4G33870.1 7.8 9.5 8.1 8.0 7.8 7.9 7.8 7.8 Peroxidase
86850 AT3G28470.1 6.2 7.5 6.4 6.1 6.1 6.1 6.1 6.0 ATMYB35
85123 AT5G09970.1 5.9 9.5 7.6 5.4 5.4 5.1 6.5 7.3 CYP78A7
Preferentially expressed in meiotic buds
84975 AT5G35630.2 6.9 6.7 8.5 6.8 6.6 6.7 6.6 6.9 GS2
85233 AT1G11910.1 5.6 7.4 10.2 9.1 6.1 8.5 6.1 8.4 Aspartyl protease
86094 AT1G54220.1 6.8 7.8 9.9 7.5 7.3 8.6 7.0 7.2 Dihydrolipoamide S-acetyltransferase
88004 AT4G16260.1 5.7 7.5 9.7 6.0 5.9 6.1 5.4 5.8 Hydrolase
88092 AT4G12910.1 9.1 9.3 10.9 8.9 8.5 8.4 9.0 9.4 scpl20
88096 AT3G11450.1 7.8 8.2 9.9 7.8 7.8 8.2 7.9 7.9 Cell division protein-related
88675 AT4G35160.1 6.3 6.6 7.9 6.6 6.3 6.2 6.1 6.2 O-methyltransferase
89901 AT5G03880.1 7.6 7.6 8.7 7.7 7.4 7.6 7.3 7.5 Electron carrier
Preferentially expressed in fruits
83998 6.4 5.8 5.7 6.3 6.5 5.8 6.2 8.5
84097 AT5G54160.1 9.4 9.1 10.0 9.1 8.6 8.1 9.0 11.1 ATOMT1
86118 AT5G62200.1 7.6 7.0 7.4 7.6 7.6 7.7 7.3 9.3 Embryo-specific protein
86486 AT1G07080.1 6.5 6.6 6.9 6.8 6.3 6.8 6.6 10.1 GILT
87027 5.8 5.5 5.5 5.7 5.6 6.0 5.8 7.3
87195 AT5G12380.1 6.6 6.2 6.5 6.7 6.4 6.5 7.2 9.6 Annexin
87830 AT5G08260.1 6.0 5.9 6.2 6.0 6.1 5.9 6.1 7.4 scpl35
88106 AT1G20030.2 6.6 6.3 6.8 7.3 5.9 6.4 6.5 9.0 Pathogenesis-related thaumatin
89333 8.8 6.5 8.0 8.4 5.9 7.6 7.1 10.5
The first column is the gene number for genes represented by poppy ESTs. The second column is the closest Arabidopsis homolog of each poppy gene. All
expression values are log2 ratio. C, carpel; F, fruit; L, leaf; MB, medium bud; P, petal; S, sepal; SB, small bud; ST, stamen. Annotations are from TAIR version 9.
Zahn et al. Genome Biology 2010, 11:R101
/>Page 6 of 21
Similar expression pattern of vegetative preferential
genes in E. californica and in Arabidopsis
To identify genes with greater expression in either vege-
tative or r eproductive tissues, we performed pairwise
comparisons among all tissues as well as groups of floral
organs and/or stages. Only one gene, 90036 (with no
significant BLASTX hits to Arabidopsis predicted pro-
teome, nor th e NCBI NR database), was signific antly
twofold greater in all reproductive tissues and through
all stages, including fruit, compared to leaf tissue. How-
ever, 65 genes were expressed s ignificantly higher in
leaves compared to all floral tissues and stages (Table
Figure 3 Venn diagrams of genes expressed in reproductive tissues. (a-d) Genes expressed in different tissues and their intersect ions. (e-f)
Genes significantly preferentially expressed compared with leaf with more than two-fold differences and their intersections. C, carpel; F, fruit; L,
leaf; MB, medium bud; P, petal; S, sepal; SB, small bud; St, stamen.
Zahn et al. Genome Biology 2010, 11:R101
/>Page 7 of 21
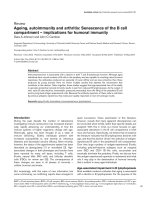
Figure 4 Heat maps and GO annotation pie chart of genes differentially exp ressed between any two tis sues . (a) Heat map for the
mRNA profiles of 1,921 genes differentially expressed between any two tissues. Red color represents high expression while green color
represents low expression. HCL clustering was performed on transcript ratios of all tissues across tissues and genes. Two major clusters had been
identified as C1 and C2. C, carpel; F, fruit; L, leaf; MB, medium bud; P, petal; S, sepal; SB, small bud; ST, stamen. (b) GO categorization of all
Arabidopsis homologs of poppy genes included in our chip as control. (c) GO categorization of all Arabidopsis homologs of poppy genes that
were statistically significantly differentially expressed.
Zahn et al. Genome Biology 2010, 11:R101
/>Page 8 of 21
Figure 5 Heat maps of genes preferentially expressed in different tissues. Red color represents high expression while green color
represents low expression. (a-c) Heat map of genes preferentially expressed in leaf compared with all the other tissues (a), sepal compared with
all the other tissues (b), and petal compared with all the other tissues (c). (d) stamen compared with all the other tissues. C, carpel; F, fruit; L,
leaf; MB, medium bud; P, petal; S, sepal; SB, small bud; ST, stamen.
Zahn et al. Genome Biology 2010, 11:R101
/>Page 9 of 21
S2 in Additional file 4). To obtain over all expression
patterns of vegetative genes, we constructed a heat-map
(Figure 5a) resulting in two main clusters. In t he first
cluster, most genes that were highly expressed in leaves
were also highly expressed in floral tissues except sta-
mens. In the seco nd cluster, most genes were highly
expressed in leaves but not in the other tissues.
To compare gene expression pattern of leaf-preferen-
tial genes in E. californica and their homologs i n Arabi-
dopsis, we used BLAST to search the E. californica EST
sequences against the Arabidopsis genome. Our B LAST
results (with 10E
-10
as cutoff) indicate that 58 out of the
65 leaf-preferential genes have identifiable homologs in
Arabidopsis. On the basis of previous microarray data,
of these 58 genes all but one (RBCS1A)oftheirArabi-
dopsis homologs were also preferentially expressed in
leaves (Table S4 in Additional file 5) [43]. According to
TAIR9 annotation, most of these genes encode proteins
that are localized in the chloroplast. GO categorization
on the basis of gene function (methods) indicate that
most of these genes are likely to be i nvolved in photo-
synthesis, encoding homologs of protochlorophyllide
reductases, photosystem I reaction center subunits and
oxygen-evolving enhancer proteins.
Comparing transcriptome profiles at crucial stages of
floral development in E. californica and in Arabidopsis
To identify developmental stage-specific genes in E. cali-
fornica flo wers, we ex amined the expression patterns of
genes in the pre-meiotic (small buds), meiotic (medium
buds) and pre-anthesis stages (four floral organs: sepals,
petals, stamens and carpels). Pre-meiotic buds (small
buds < 5 mm) had 49 diffe rentially expressed g enes in
comparison with any other tissues examined (P-value <
0.05 and two-fold cutoff; Table S2 in Additional file 4).
Among these genes, 30 had identifiable Arabidopsis
homologs, 24 of which have expression data available
(Table S4 in Additional file 5). Unlike l eaf-preferential
genes, only 7 of these 24 genes showed expression peaks
in early Arabidopsis flower buds while the rest were pre-
dominately expressed in specific floral organs at higher
levels than in leaves. The proteins encoded by these
seven genes include two transcription factors, one oxi-
doreductase, two peroxidases, one electron carrier and
one gene of unknown fu nction (Table 1, genes and
annotations with peak expression in small floral buds;
information obtained from Markus Schmid’ sresults
[43]. The Arabido psis homologs for two transcription
factors, MYB35, which regulates anther cell laye r forma-
tion at ear ly stages, an d a bas ic helix-loop-helix (bHLH)
gene that has not been fully studied [44,45], were also
preferentially expressed in anthers (X Ma and B Feng,
unpublished data). Howev er, the corresponding E. cali-
fornica genes were expressed at low levels in the pre-
anthesis stamens, possibly because either these genes are
not highly expressed in E. californica stamens or our
stamen expression data from pre-a nthesis stamens were
too late relative to the stages of highest expression in
Arabidopsis, which may be during earlier anther devel-
opmental stages.
In medium buds (which span the meiotic stage), we
found eight genes that were expressed twofold signifi-
cantly higher and none that were significantly down-
regulated compared with a ny of the other tissues
examined (Table 1). All of these genes have homologs
in Arabidopsis and most encode proteins that may have
enzymatic activities (Table 1). However, none of the
Arabidopsis homologs of these genes show expression
peaks in the equivalent stages to our medium buds in
Arabidopsis [43] (Table 1; Table S4 in Additional file 5).
Interestingly, the homolog of E. californica gene 88096
in Arabidopsis (AT3G11450) encodes a DnaJ heat shock
protein proposed to be involved in either mitosis or
meiosis. The expression pattern of these homologs dif-
fers in that it is highly expressed in both vegetative and
reproductive tissues in Arabidopsis.Itispossiblethat
the gene function might have diverged after the separa-
tion of basal eudicots from core eudicots.
In fruits, nine genes were expressed significantly two-
fold higher than the other tissues in E. californica
(Table 1). None of their homologs showed an expression
peak in the Arabidopsis fruit. Among the genes of parti-
cular interest, the Arabidopsis homolog of 86118
(At5g62200, MMI9) plays an important role in embryo
development [46], and its high expression in the fruits
suggests that its E. californica homolog might have a
similar function.
Identification of putative genes under control of certain
genes in the ABC model
According to the ABC model, A-function genes are
transcription factors that are required to properly spe-
cify the sepal (alone) and petal (along with B-function
genes) identities, with B-function genes specifying the
stamen (along with C-function genes), and C function
specifying the carpel. Thus, genes expressed in sepals
and petals (regions encompassing the A domain) are
called A-domain genes, genes expressed in petals and
stamens are called B-domain genes, and genes expressed
in stamens and carpels are called C-domain genes.
Although the homologs of Arabidopsis A-function genes
(such as AP1 and AP2) might not have conserved func-
tions in other eudicots [45-47], because of the distinct
sepals and petals in E. calif ornica, we tried to identify
putative A-function genes on the basis of regulatory
genes expressed in the A domain, hypothesizing that
they may function in specifying the sepal and petal iden-
tities in E. californica .
Zahn et al. Genome Biology 2010, 11:R101
/>Page 10 of 21
From our hypothesis that A-domain genes should be
more highly expressed in sepals, and possibly in pe tals,
than in the other floral organs, we compared them with
three tissues: leaf, stamen and carpel collected approxi-
mately 1 day pre-anthesis. We found significantly
greater expression of 64 genes in sepals over each of the
above 3 tissues and 49 genes in petals over each of the
3 tissues, respectively (Table S5 in Additional file 6).
When compared with all 7 other tissues, 34 genes in
sepals and 29 genes in petals were significantly preferen-
tially expressed (Table S2 in Additional file 4). Whereas
geneshighlyexpressedinsepalsorpetalstendedtobe
expressed in all tissue s at moderately high levels (Figure
5b,c), genes with lower expression in sepals and/or
petals w ere scarcely expressed in other tissues. On the
basis of comparisons of petals and sepals with leaves,
stamens and carpels, only five gene s were expressed
twofold greater in tissues controlled by A-function
genes (Table 2). Interestingly, two of these genes are
members of the MADS-box family. However, the
expression of their closest Arabidopsis homologs, AGL2/
SEP1 and AG L6, is not sepal-, petal- or even floral-spe-
cific (Figure 6d,f). SEP1 is an E-function gene [47,48],
and is involved in the development of all floral organs
in Arabidopsis.AhomologofSEP1 in soybean
(GmSEP1) is expressed in reproductive development,
especially in petals and seed coats [49]. AGL6 and its
homologs have been shown to function in flower devel-
opment not only in eudicots, like A rabidopsis and Petu-
nia, but also in orchid, rice, and other monocots. In the
grasses, AGL6 has high expression in paleas, lodicules,
car pels and ovule integuments, as well as the receptacle
[50-54]. We hypothesize that other MADS genes, possi-
bly SEP homologs, may serve as A-function genes in
E. californica instead of AP1 and AP2 in Arabidopsis,in
part because the AP1 subfamily is closely related to the
AGL6 and SEP subfamilies [55].
B-function genes , such as the Arabidopsis APETALA3
and PI STILLATA genes,arerequiredfortheidentities
of petals and stamens [9,11,56]. In monocots like tulip,
Table 2 Expression levels of putative ABC genes in poppy
Gene BestATHit L SB MB S P ST C F Annotation
A-function genes
84392 AT2G36830.1 14.4 13.9 14.3 16.2 16.3 15.1 14.5 14.4 GAMMA-TIP
86583 AT2G45650.1 6.4 10.1 10.4 11.9 10.7 7.0 8.9 8.9 AGL6
87043 AT3G05490.1 8.9 9.1 9.8 10.6 10.9 9.6 9.2 9.3 RALFL22
87251 AT5G15800.1 6.3 9.2 9.4 10.5 9.5 6.9 8.4 8.3 SEP1, AGL2
85671 7.3 7.0 6.9 10.5 11.1 8.4 7.3 7.7
B-function genes
83744 AT3G54340.1 8.2 11.4 12 9.1 11.9 13.1 9.9 9.1 AP3
83763 AT1G69500.1 5.2 5.7 6.1 5.9 7.7 7.3 6.1 5.7 Electron carrier
83991 AT5G19770.1 10.0 10.1 10.3 9.0 11 11.2 9.8 10.1 TUA3
84789 AT5G64250.2 11.9 11.4 13.2 13.8 15.6 15.0 13.9 13.2 2-Nitropropane dioxygenase
85140 AT2G27510.1 9.2 11.1 12.2 10.8 13.8 11.9 10.5 10.0 Ferredoxin 3
85166 AT5G62690.1 9.2 10.0 10.2 8.3 10.4 10.9 9.3 9.8 TUB2
85610 AT4G36250.1 5.4 6.5 8.5 6.4 7.8 7.6 6.1 5.5 Aldehyde dehydrogenase 3F1
87005 AT3G54340.1 4.6 7.8 8.3 6.0 10.2 8.1 5.3 5.1 AP3
87035 AT3G58120.1 5.6 5.5 5.7 5.5 7.9 8.0 5.1 5.2 ATBZIP61
87167 AT5G20240.1 7.3 11.2 12.0 9.2 12.8 11.9 8.4 8.1 PI
87294 AT5G03690.2 8.0 9.3 10.0 7.8 9.8 10.0 8.7 9.2 Fructose-bisphosphate aldolase
89750 AT4G37990.1 8.2 8.8 9.6 8.5 11.4 10.2 7.7 7.9 Mannitol dehydrogenase
89805 AT5G66310.1 5.9 6.5 6.8 5.3 7.2 7.8 6.1 6.4 Kinesin motor
C-function genes
84248 AT4G18960.1 6.7 10.6 11.1 7.2 6.6 11.5 11.6 11.6 AG
84252 AT4G26220.1 7.3 10.9 10.9 7.0 7.2 10.9 10.1 6.6 Caffeoyl-CoA 3-O-methyltransferase
84340 AT3G44260.1 7.9 8.4 8.3 7.8 8 9.9 9.2 8.6 CCR4-NOT transcription complex protein
84512 AT1G11910.1 7.2 9.5 10.1 7.0 7.2 8.8 9.1 9.1 Aspartyl protease
84691 AT2G44480.1 9.1 12.4 12.8 8.7 8.6 12.6 12 12.9 BETA GLUCOSIDASE 17
89115 AT3G20240.1 6.4 7.4 7.3 6.3 6.2 8.2 7.6 7.0 Mitochondrial substrate carrier
89980 AT1G35720.1 7.1 8.8 9.5 7.2 7.9 10.1 9.2 8.5 ANNEXIN ARABIDOPSIS 1
The first column is the gene number for genes represented by poppy ESTs. The second column is the closest Arabidopsis homolog of each poppy gene. All
expression values are log2 ratio. C, carpel; F, fruit; L, leaf; MB, medium bud; P, petal; S, sepal; SB, small bud; ST, stamen. Annotations are from TAIR version 9.
Zahn et al. Genome Biology 2010, 11:R101
/>Page 11 of 21
homologs of AP3 and PI are expressed in the tepals
(petal-like organs found in the outer two whorls). We
searched for putative B-domain genes on the basis of
their expression patterns i n E. californica and found
that 60 genes in petals and 1 80 genes in stamens were
expressed significantly higher in these o rgans than in
sepals, carpels and leaves (Table S5 in Additional file 6).
And 94 genes were expressed twofold significantly
greater in stamens t han all the other organs (Table S2
in Additional file 4). The large number of genes with
stamen-preferential expression patterns suggests that the
development of stamen requires more specialized genes.
Alternatively, the larger number of stamen-preferential
genes identified here may be explained by the fact that
stamens comprise much of the biomass of developing E.
californica buds, relative to other developing floral
organs (Figure 5d).
We combined the expression data from petals and sta-
mens to represent the B-domain group and compared
their expressio n levels with those of leaves, sepals, car-
pels and fruits (Table 2), identifying 13 genes as prefer-
entially expressed in the B-domain organs. A homolog
of PI (87167) and two homologs of AP3 (83744 and
87005) were identified in this group [11 ] (Table S5 in
Additional file 6). S ince PI and AP3 are B-function
genes in Arabidopsis and other species, such as lily
Figure 6 The expression levels of MADS transcription factor families. (a-f) Expression of E. californica homologs of B function genes AP3 (a)
and PI (b), C function gene AG (c), E function genes, SEP1 (d) and SEP3 (e), and AGL6 (f) in eight tissues compared with their counterparts in
Arabidopsis. All the expression values are log2 ratio. The y-axis is the log2 ratio of gene expression levels. C, carpel; F, fruit; L, leaf; MB, medium
bud; P, petal; S, sepal; SB, small bud; St, stamen.
Zahn et al. Genome Biology 2010, 11:R101
/>Page 12 of 21
[57-59], it is possible that their homologs in E. califor-
nica function in a s imilar manner. It should also be
noted that in si tu analysis showed that the AP3 homo-
logs are also expressed i n ovules in E. californica [11],
suggesting that they may have roles outside of B-
function.
Of the genes preferentially expressed in the B-domain,
one is a homolog o f the AtbZIP61 gene, which encodes
a putative transcription factor and is expressed in Arabi-
dopsis flowers, with especially high expression in petals.
It is not known whether AtbZIP61 regulates floral devel-
opment in Arabidopsis. However, on the basis of its
expression pattern and that of its homolog in E. califor-
nica, we speculate that it functions to regulate petal
development and is downstream of the B-function
genes.
In Arabidopsis, C function is controlled by AGA-
MOUS, which specifies stamens and carpels. When
compared with leaves, sepals and petals, 26 genes were
preferentially expressed in carpels (compared to 168
genes in stamens; Table S5 in Additional file 6). We
searched for C-domain genes and found that seven
genes (Table S5 in Addition al file 6) were expressed
twofold significantly great er in stamens and carpels than
in leaves, sepals and petals. Among them was a homolog
of the Arabidopsis C-function gene AG [59]. Since both
monocots (rice) and other eudicots have AG homologs
functioning in stamen and carpel development, we
hypothesize that the AG homolog in E. californica has
similar functions [10,60,61]. It has been proposed that
D-domain genes are required for ovule development,
but only one E. californica gene (88769) was expressed
in carpels twofold significantly higher over all other tis-
sues. This EST did not have an identifiable Arabidopsis
homolog.
To uncove r additional can didates of A- , B- or C-
domain genes, we used less stringent criteria and
selected genes with expression levels at least twofold
higher in each pre-anthesis reproductive tissue than in
leaves (with false discovery rate (FDR) < 0.05; Figure
3e,f; Table S6 in Additional file 7). We found that
most of these genes were expressed in a whorl-specific
manner and only a small numbers of genes were co-
upregulated in sepals and petals, in petals and stamens,
or in stamens and carpels. Furthermore, the overlap of
A/B-domain and that of B/C-domain genes were even
smaller (Figure 3e,f). Unlike studies in Persea and
Aquilegia, whose floral transcriptomes were interpreted
as support for a ‘fading borders’ model of floral organ
identity [29,62], the E. californica floral transcriptomes
were rather distinctive, providing a molecular explana-
tion for the morphologically different sepals and petals.
Therefore, E. californica might have adopted an ABC
model with relatively sharp borders, similar to those
found in core eudicots. Because E. californica is basal
to Aquilegia within the Ranunculales, as determined by
phylogenetic analyses [37], it may be that sharply
defined floral organ borders represent an ancestral
state for all eudicots, but has been lost in some more
derived lineages.
Expression profiles of members of regulatory gene
families
To gain further insights into the transcriptional activities
of putative r egulatory genes in floral development, we
focused on gene families that are homologous to known
regulators of plant development, particularly those
encoding known or putative transcription factors. For
convenience, we will refer to their predicted functions
without using the words putative or predicted.
MADS-box genes
Genes encoding proteins containing a MADS-box DNA
binding domain represent the best-studied floral gene
family, of which multiple members are crucial for floral
development. In E. califor nica the expression of
EscaAG1 (84248), EscaAG2 (86612), EScaAGL2 (87251),
EScaAGL9 (87125), EScaAGL11 (89484), EScaGLO
(87167), EScaDEF1 (83744) and EScaDEF2 (87005) have
been studied with in situ hybridization [10,11,40,41].
Additionally, MADS-box genes homologous to those
lacking characterized functions in Arabidopsis were
included on our array, such as EScaAGL54 (87912).
Expression of EScaAGL54 was highest in small buds,
but showed similar levels in all the other tissues, sug-
gesting a putative function in early floral stages.
To further understand the expression of the E. califor-
nica MADS-box genes, we plotted E. californica unigene
expression profiles in comparison to the closest Arabi-
dopsis homologs [11]. Expression patterns were largely
similar between the two species, but there were some
interesting differences (Figure 6). Both of the E. califor-
nica AP3 homologs showed simi lar expression patterns
to AP3, differing only in that 87005 (EscaDEF2)showed
lower expression in all tissues relative to 83744 (Esca-
DEF1)orAP3 in Arabidopsis (Figure 6a). At the same
time, 87167 (EscaGLO), a homolog of PI, showed similar
expression to PI in Arabidopsis (Figure 6b). Additionally,
an E. californica homolog of the Arabidopsis C-function
gene AG showed similar expression to that of AG (Figure
6c) . Besides those key MADS-box genes regulating floral
development, we found that E. californica homologs of
E-function genes also have similar expression patterns to
E-function genes in Arabidopsis (Figure 6d,e).
Homologs of other MADS-box genes demonstrated
different expression patterns. Unigene 84248 (EscaAG1,
an AG homolog [63]) was highly expressed in stamens
and carpels as expected, while 86612 (EscaAG2,a
Zahn et al. Genome Biology 2010, 11:R101
/>Page 13 of 21
second AG homolog [63]) exhibited similar levels of
expression in all floral tissues, suggesting a divergent
function for this gene in E. californica flower develop-
ment (Figure 6c). Also, the homolog of AGL6 (86583)
also showed higher expression in sepals and petals (Fig-
ure 6f), in contrast to the low expression of the Arabi-
dopsis AGL6 gene in sepals on the basis of microarray
expression [43]. Since a homolog of A-function gene has
not been found in E. californica, it is possible that 86583
may function in the outer two whorls as an A-function
gene (Figure 6f).
AGO
The ARGONAUTE (AGO) family is involved in RNA
post-transcriptional regulation [64]. In Arabidopsis,
members of the AGO family are involved in floral devel-
opment, most likely through microRNA and small inter-
fering RNA silencing. Our microarray included ten
members of the AGO family, all of which were differen-
tially expressed in at least one tissue (Figure 7a,b;
expression data of fa mily members are listed in Addi-
tional file 8). Among those genes, there was an int erest-
ing pattern, which identified three genes that were
Figure 7 The expression levels of members of the ARGONAUTE, MYB, Zinc-finger, Homeodomain, ARF, bZIP and bHLH families. (a) The
AGO gene family; (b) The PAZ gene family; (c) The MYB gene family; (d) The ZHD gene family; (e) The ARF gene family; (f) The bZIP gene
family and (g) The bHLH gene family in eight tissues. All the expression values are log2 ratio. The same abbreviations of different tissues were
used as in figure 5.
Zahn et al. Genome Biology 2010, 11:R101
/>Page 14 of 21
generallyhighlyexpressedinallorganswhilethe
remaining seven genes were expressed at moderate to
low levels.
Among the genes examined in this study, three AGO1
homologs (one in the high expression group and two in
the low expression group) shared similar expression pat-
terns: twofold higher expression in petals, pre-meiotic and
meiotic buds than in sepals. The AGO genes in Arabidop-
sis encode proteins with a PAZ domain (with nucleic acid
binding activity [65]) and are expressed at similar levels in
different tissues, except for PAZ-1, which was preferen-
tially expressed in carpel, pre-meiotic and meiotic buds
compared with se pal with more than twofold changes.
MYB
MYB t ranscription factors c ontain DNA binding
domains and some have been identified as flower devel-
opmental regulators [66,67]. Eleven E. californica MYB
genes were included on our microarray. Most MYB
genes showed dramatic differential expression among
tissues, but two were not differentially expressed among
any of the tissues tested (Figure 7c; Additional file 8).
One homolog of At4g32730 (MYB1) was expressed at
higher levels in mature petals and stamens, suggesting
that this gene may have a role in B function. A homolog
of At4g32730 (AtMYB3R1) was significantly preferen-
tially ex pressed (more than twofold higher) in the pre-
meiotic bud in comparison with sepals, petals, and sta-
mens and carpels. A homolog of At3g28470 (AtMYB35)
was also p referentially expressed in pre-meiotic buds
compared with all seven other tissues. A homolog of
At4g01680 (AtMYB55) w as significantly preferentially
expressed in fruit in comparison with leaves, pre-meiotic
and meiotic buds, petals, sepals and stamens. An
At2g37630 (AtMYB91/AS1) homolog was more varied
in expression but generally sh owed lower expression in
stamens than in carpels, fruits, leaves, pre-meiotic and
meiotic buds and lesser down-regulation in petals rela-
tive to carpels, leaves and pre-meiotic buds. Last but not
least, a homolog of At3g61250 (AtMYB17)was
expressed twofold significantly higher in meiotic buds
compared with fruits.
Zinc Finger Homeodomain genes
Zinc Finger Homeodomain (ZHD) genes are expressed
during floral development in Arabido psis [68]. Our
microarray contained four genes in this family. Two
homologs of At1g75240 (ATHB33) were expressed with-
out significan t difference across all tissues. Of these two
genes, one (88691) was ex pressed highly in bot h vegeta-
tive and reproductive organs while the other was barely
expressed in all tissues, suggesting a functional diver-
gence between these two paralogs (Figure 7d).
ARF
Auxin-response factors (ARFs) are believed to regulate
auxin responsive genes [69,70]. This family contains
ETTIN (At2G33860), a developmental regulatory gene
that acts on regional identity in the perianth, stamen s
and carpels [71]. Most of the poppy ARF genes that
were included on our micro array showed no differential
expression among the tissues examined (Figure 7e).
Only one gene, a homolog of At 5g62000 (ARF2, 84471),
showed twofold significantly different expression: two-
fold lower in stamens when compared with all tissues
but sepal; and twofold lower in sepals compared with
carpels, fruits and pre-meiotic buds.
bZIP
The bZIP (basic-leucine zipper) protein family contains
the Arabidopsis FD (At4G35900, FD-1) and PE RI-
ANTHIA (At1G68640) genes, which are involved in
flower development and the HY5 (At5G11260) gene
involved in root development. Our array contained 12
members of this family, one of which was not differen-
tially expressed among all tissue s examined (Figure 7f;
Additional file 8). From o ur microarray results, mos t of
these genes showed only slightly different expression
levels except the homologs of bZIP7 (83748) and bZIP8
(87035), both of which were expressed highly in sta-
mens, with bZIP8 also highly expressed in p etals. Pre-
vious studies of gen es of the bZIP family suggested that
some of them may act downstream of B-function genes
to regulate floral development [72-74]. Because the
homolog of bZIP8 was co-expressed with B-function
genes, we speculate that this gene might have a function
similar to that of the Arabidopsis homolog. In addition,
a homolog of At4g38900 is expressed at a level twofold
higher in sepals than in stamens.
bHLH
The basic helix-loop-helix family contains several Arabi-
dopsis genes regulating flower development, including
SPATULA, which controls the development of the car-
pel margins [75]. Eleven members of this family were
included on our microarray, seven of which showed no
significant differential expression (Figure 7g; Additional
file 8). The other four genes demonstrated twofold dif-
ferential expression among tissues examined. A homolog
of At2g31210 (bHLH91, 89282) was most highly
expressed in pre-meiotic buds and the expression level
was at least twofold higher than in all the other tissues;
also, its expression level in meiotic buds was at least
twofold higher than any other floral organs. Since
At2g31210 has an important role in anther development
in Arabidopsis [45], its homolog in E. californica may
function in a similar manner. Another gene, a homolog
of At5g09460 (bHLH143), was also expressed at a higher
level in the pre-meiotic buds than in sepals, petals and
stamens and in meiotic buds. Additionally, this gene
was expressed twofold higher in carpels and fruits than
in stamens. A homolog of At1g26260 (bHLH76, CIB5)
was expressed in pre-meiotic buds significantly twofold
Zahn et al. Genome Biology 2010, 11:R101
/>Page 15 of 21
higher than in fruits and stamens. A homolog of
At3g26744 (bHLH116/ICE1) was significantly down-
regulated by twofold in stamens relative to carpels,
fruits, leaves, meiotic buds and petals. This gene was
alsosignificantlymorehighlyexpressedbytwofoldin
petals over sepals. The expression patterns of bHLH
genes suggest that they might regulate several aspects of
floral development and/or physiology, but are not neces-
sarily associated with ABC functions. F urther study of
bHLH genes, and indeed many of the floral gene
families examined here, in Arabidopsis and other spe-
cies, including E. californica,mayuncovertheirfunc-
tions and reveal possible functional conservation among
the eudicots.
Conclusions
We examined transcriptome landscapes from eight tis-
sues of the basal eudicot E. californica and identified
preferentially expressed genes within and among floral
developmental tissues, fruits and leaves. By comparing
genes showing tissue-preferential expression patterns in
E. californica, we found that genes preferentially
expressed in specific reproductive organs or at certain
stages tended to have less conserved e xpression levels
compared with Arabidopsis than those preferentially
expressed in leaves (Tables 1 and 2; Table S4 in Addi-
tional file 5). One possible explanation is that most of
the leaf-preferential gen es encode highly conserved
chloroplast proteins.
We also identified the co-expressed and tissue-specific
floral genes and characterized the signature of ABC
domain genes. Our comparison of the gene expression
patterns in E. californica, Aquilegia, Pe rsea and Arabi-
dopsis showed that the E. californica resu lts suppor t a
‘sharp border ’ model, similar to that for core eudicots
such as Arabidop sis, rather than the ‘ fading border ’
model in other basal angiosperms [29,62]. This is con-
sistent with the clear morphological distinction of sepals
and petals, and the lack of intermediate floral organs
such as staminodes in E. californica flowers. In contrast,
Aquilegia flowers have similar outer perianth organs
and a distinct type of floral organ between stamens and
the carpels, which is in good agreement with the micro-
array results of the floral organs [29]. Therefore,
although bot h E. californica and Aquilegia are basal
eudicots, the morphological and expression characteris-
tics strongly suggested that they have divergent develop-
mental programs, with E. californica more similar to
core eudicots and Aquilegia resembling basal angios-
perms. Our analysis of E. californica f urther suggested
that flowers with distinct perianth organs might have
originated at an earlier time than the ancestor of core
eudicots. This study along with oth er works [21,29]
highlight the importance of careful analysis of basal
eudicots as an intermediate group of flowering plants to
provide crucial informationtobridgethegapbetween
highly canalized core eudicots and morphological flex-
ible basal angiosperms.
Our data also provide an overview of divergence and
conservation between different species. The highly simi-
lar expression patterns of B- and C-function genes com-
pared with the varied expression levels of o ther MADS-
box genes in Arabidopsis and E. californica suggest that
the conserved expression of only a few key genes may
result in the high simi larity of flo wer morphology
between Arabidopsis and E. californica. The transcrip-
tome analysis of other families with known functions in
floral development indicates their possible roles in E.
californica. Recent study of protein-protein interactions
in basal eudicots (Euptelea pleiospermum, Akebia trifo-
liata and Pachysandra terminalis) suggested th at
MADS-box genes that interact with each other have co-
evolved. This is most likely due to the fact that the
majority of the protein-protein interactions are expected
to be conserved to some extent to orchestrate floral
architecture [76]. However, Zhao et al. [70] showed the
AP1 lineage had a distinct interaction pattern; this,
together with our results that AGL6 and SEP homologs
are expressed in the A-domain, supports that A-function
genesshowlessconservation[56].InArabidopsis
, AP1
not only regul ates the dev elopment of sepal and petal,
but also integrates growth, patterning and hormonal
pathways [77]. This dual function of AP1 obs erved in
the core eudicots might be a more recent i nnovation
that evolved since the divergence o f the core from the
basal eudicots.
Many of the genes showing tissue-specific expression
noted in this study have homologs in Arabidopsis that
are currently lacking in functional analyses. This study,
when compared with similar studies in Arabidopsis and
other species, should help us i dentify genes of interest
that may play important, conserved roles in floral devel-
opment [26,28,29]. We have identified a number of can-
didate genes that share similar expression patterns
between E. californica and Arabidopsis but have not
been functionally characterized. Our results suggest that
E. californica has a similar floral program to the core
eudicots, despite a mostly divergent set of genes outsid e
of the MADS-box family. These results not only indicate
that different regulatory machinery may operate among
basal eudicots, but that cana lized floral development
might have originated prior to the core eudicots. Our
findings also allow for informative comparisons with
other species, allowing hypothesis formulation and sti-
mulating further experimentation in model organisms,
which now includes E. californica.
Zahn et al. Genome Biology 2010, 11:R101
/>Page 16 of 21
Materials and methods
Tissue collection and RNA isolation
Sixteen E. californica cv. ‘Aurantica Orange’ (JL Hudson
Seedsman, La Honda, California, USA) plants were
grown from s eeds in a controlled greenhouse environ-
ment at the Pennsylvania State University (University
Park, PA) under 16 hours light and watered and ferti-
lized as needed. To avoid potential expression differ-
ences among collections due to circadian rhythms,
leaves and floral tissues were only collected fr om in divi-
dual plants between 8:30 and 10:30 am. Developing
leaves of less than 5 mm length, developing fruits, pre-
meiotic (small) buds less than 5 mm long, meiotic (med-
ium) buds of 5 to 10 mm length and pre-anthesis sepals,
petals, stamens and carpels were collected from 16
plants, immediately placed in liquid nitrogen and stored
in a -80°C freezer until RNA extraction. Tissues from a
group of four plants were then pooled to create one bio-
logical replicate, for a total of four replicates.
Probe design for the E. californica transcriptome
To design oligonucleotide probes for E. californica,a
two-stage pipeline for oligonucleotide probe design,
Microarray Oligonucleotide Design and Integration Tool
(MODIT) was used (probe information provided in
Additional file 9). Briefly, MODIT integrates two exist-
ing programs: Array Oligo Selector (v.6; AOS) and Oli-
goArray (v.8; OA), with subsequent independent
evaluation and optimization steps. The pipeline enables
one to design a set of probes having well-defined
sequence and thermodynamic properties by first taking
advantage of the strict thermodyna mic criteria of OA to
produce a partial set o f optimized probes, and then fill-
ing in the set from among the large number of probes
selected by AOS, after screening them for thermody-
namic compatibility.
The MODIT pipeline screens candidate probes based
on three parameters: high sequence specificity, appropri-
ate melting temperature T
m
, and lack of sta ble second-
ary structure. The first criterion, sequence specificity,
was determin ed using BLAST and Smith -Waterman
local alignment tools to eliminate probes having a
match to any non-target sequences of more than 15
consecutive nucleotides, or an overall match of more
than 30 nucleotides [78-80]. The second criterion was
that the probe set should have very similar T
m
.The
MODIT user is informed of pro bes with T
m
outside a
recommended range by flagging in the database, and
she/he can decide whether to use such probes. A third
criterion was the lack of stable secondary structure.
MODIT allows values of probe ΔG
SS
above -0.5 kcal.
mol
-1
, less than the energy of one hydrogen bond
between bases [81]. We use melting temperature to
independently recalculate a consistent set of
thermodynamic properties for the probes and check for
consistency [82]. The pipeline stores comprehensive
info rmation about probe thermodynamic properties and
potential cross-reactions in a MySQL database, so that
they can subsequently be used in array data analysis.
The MODIT pipeline was used to generate one 60-
base probe for each gene in the 6,846 E. californica
Unigene set [83,84], after masking regions that were
conserved in multigene families in Arabidopsis ,rice
(Oryza)andPopulus. Unigenes were sorted into gene
families using PlantTribes [85] and conserved sites in
the multiple sequence alignment were identified using
the column score metric calculated by CLUSTAL [86].
A sodium concentration of 0.5 M was used in model-
ing of thermodynamic properties, following hybridiza-
tion conditions recommended by Agilent for their
60-mer Arabidopsis Oligo Microarray Kit, and the
conditions modeled by Lee et al.[87].Theprobecon-
centration r ange that was used in the thermodynamics
calculations is 2.44 mM following the calculations of
Riccelli et al. [88] and assuming the default 1 nM tar-
get recommended in [89]. In the OA run, duplex
melting temperature T
m
was constrained above 70°C,
and the duplex T
m
for predicted cross-reactions and
stable secondary structures was constrained b elow 60°
C. For the AOS run, the constraint on GC content
was maintained around 52%. Duplex melting tempera-
ture was constrained to keep 20°C separatio n between
the upper and lower T
m
limits, to allow for selection
of more candidate probes. The probe maximum and
minimum match for non-target sequences were main-
tained at 15 and 10 nucleotides, respectively. When
the two sets of probes were merged, the constraints
applied to the merged set were: 80°C ≤ T
m
≤ 90°C,
overall match with non-target as well as with consen-
sus sequences should be less than 30 nucleotides and
ΔG
SS
above -0.5 kcal.mol
-1
.Sinceonegoalofthis
design was to obtain complete coverage of all target
sequences, a selection of known suboptimal probes
was added b ack to the final design (Additional file 9,
column 5), and their sequence and thermodynamic
properties tracked in the MODIT database. The
design results obtained using MODIT for the target
sequences from E. californica are summarized in
Additional file 9. No application, including MODIT,
could p rovide 100% target coverage while satisfying all
of the design criteria for each probe. However,
MODIT improved on target coverage and signif icantly
limited potential cross-reactions relative to OA, while
nearly eliminating probes that were predicted to form
stable secondary structure.
Oligonucleotides of 60-bp length were designed from
6,446 E. californica unigenes obtained from a floral EST
library [20] and cell culture suspension library [90].
Zahn et al. Genome Biology 2010, 11:R101
/>Page 17 of 21
Unigene builds were perfo rmed as described by Carlson
et al. [20] and then sorted into putative gene families
using the PlantTribes database [85]. Because the com-
plete genome of E. californica is not yet sequenced, oli-
gos were designed to specifically exclude conserved
regions, when identified, so that expression analyses
putatively represent single genes (see above). Oligonu-
cleotide probes were arrayed on glass slides by Agilent
(La Jolla, CA, USA).
RNA extraction, microarray hybridization and scanning
RNA was isolated from eight tissues examined each with
four biological replicate pools and cleaned using the
RNeasy plant mini Kit (Qiagen, Valencia, California,
USA) following Agilent’s instructions. RNA concentra-
tions were quantified u sing an Agilent 2100 Bioanalyzer
and stored at -80°C before use, with yields of 20 to 35
micrograms of total RNAs from approximately 100 mg of
tissues. Approximately 400 ng of total RNAs were used
for cRNA synthesis with Cyanine 3-dCTP and Cyanine5-
dCTP (Perkin-Elmer Life Sciences, Inc., Downers Grove,
Illinois, USA) incorporation, using the Agilent Low RNA
Input Kit (Agilent), according to the manufacturers’ pro-
tocol. Qiagen’s RNeasy mini-spin columns were used to
purify amplified cRNA samples. Sample concentrations
were quantified using a NanoDrop spectrometer (Nano-
Drop Technologies, Wilmington, Delaware , USA). Hybri-
dization was performed using the In situ Hybridization
Kit (Agilent) with 35 ng of Cy3- and Cy5-labeled cRNA
following the manufacturer’ s instructions at 65°C for 17
hours. Prior to scanning, each slide was washed, rinsed
and dried in Agilent’s Stabilization and Drying Solution,
as directed. Scanning was performed using a Gene Pix
4000A scanner and the Gene Pix Pro 3.0.6 Software
(Axon Instruments (now Molecular Devices), Union City,
California, USA) to produce two TIFF images at 532 nm
and 635 nm. The microarray data have been submitted
to the Gene Expression Omnibus database, with acces-
sion number [GEO:GSE24237].
Statistical analyses of genes differentially expressed
among tissues and developmental stages
Analyses were performed with the R programming lan-
guage [91] and the limma package Bioconductor [92].
Arrays were background corrected and loess normalized
within arrays and Aq normalized between arrays [93].
Agilent controls and other control probes were removed
from the data. For the 93 E. californica oligos with mul-
tiple probes, we chose the probe with the highest 75%
quantile value among the normalized ‘A’ intensities o f
all 16 arrays. A one-way single-channel empirical Bayes
ANOVA was used to identify those genes [94,95] that
were significantly differentially expressed among the
seven floral RNAs and one leaf RNA examined, with an
FDR of 0.05. Additionally, significant differences
between combinations of more than one floral organ
and leaf were also identified under the same parameters.
In order t o identify those genes that were most likely
to be organ/stage-specific in E. californica,weexamined
those genes with a significantly (FDR = 0.05) twofold
greater expression in a single organ/stage relative to all
other tissue stages examined. The expression of these
genes was t hen compared to the expression, as deter-
mined by Affymetrix arrays [28], to their closest identi-
fied Arabidopsis homolog based on a tribe-MCL
analysis, when available, to determine which genes may
have conserved expression profiles. We were able to
directly compa re expression in pre -meiotic and meiotic
buds in E. californi ca versus inflorescences containing
stage 1 to 9 flowers in Arabidopsis (developing inflores-
cences), the E. californica fruit, capsules, versus the Ara-
bidopsis fruit, siliques, Arabidopsis flowers a t stage 12
nearing pre-anthesis versus sepals, petals stamens and
carpels at anthesis in E. californica and genes preferen-
tially expressed in leaves in both organisms.
Real-time PCR experiments
To test the reliability of our microarray hybridizations,
nine genes and one reference were investigated using
quantitative RT-PCR. RNA (1 μg) of each tissue was trea-
ted with DNase (Invitrogen, Eugene, Oregon, USA), fol-
lowed by reverse transcription using the Superscript III
reverse transcriptase (Invitrogen). We then performed real
time PCR using DyNAmo SYBR Green qPCR Kit from
New England Biolabs (Ipswitch, Massachusetts, USA)
under the following parameters: 95°C for 10 minutes, 40
cycles at 95°C for 30 s, 60°C for 1 minute. Fluorescence
intensity was measured using Applied Biosystems’ 7300
Sequence Detection System (Carlsbad, California, USA).
Eca_2514 (Unigene84142) was chosen as the reference
gene as it was not significantly differentially expressed
among any of our examined tissues in the microarray
experiments and it was expressed at a moderate level in all
our tissues compared to all other genes. The relative
amounts of cRNA converted from a messenger RNA wa s
calculated using intensities corresponding to ‘experimen-
tal’ genes relative to the reference gene. We performed tri-
plicate reactions for all tissues with samples containing no
reverse transcriptase and no RNA as negative controls. All
primer information is provided in Additional file 9.
Additional material
Additional file 1: Supplemental figures. Supplemental Figure 1:
correlation coefficients between signal intensities from four biological
replicates of seven tissues. Pearson’s correlation coefficients were
between 0.88 and 0.97 between any pair of the four biological replicates,
indicating that the results were highly reproducible. Suppleme ntal Figure
2: GO annotation pie chart of genes present across all tissues. GO
Zahn et al. Genome Biology 2010, 11:R101
/>Page 18 of 21
categorization of all Arabidopsis homologs of poppy genes that were
expressed across all the eight tissues with log2 values of signal intensity
larger than 5.41 (10% percentile; control provided in Figure 4).
Supplemental Figure 3: RT-PCR results consistent with microarray data.
Nine genes were verified using RT-PCR. The lines in blue represent the
RT-PCR results and red the microarray results. All the numbers shown in
this figure are the fold changes of expression intensities in reproductive
tissues compared with leaf. The left y-axis is for microarray results and
right y-axis for RT-PCR results.
Additional file 2: Numbers of genes expressed in eight tissues
using different cutoff and gene lists. Table S1: a summary of numbers
of genes expressed in eight tissues using different cutoff percentiles (5%,
10%, 15%). Table S2: genes expressed in both leaves and medium buds.
Table S3: genes expressed in leaves, small buds and medium buds. Table
S4: genes expressed in both leaves and small buds. Table S5: genes
expressed in both small buds and medium buds. Table S6: genes
expressed in leaves, sepals and petals. Table S6: genes expressed in both
carpels and stamens. Table S7: genes expressed in either sepals and/or
petals. Table S8: genes expressed in carpels and either sepals and/or
petals. Table S9: genes expressed in carpels, stamens and either sepals
and/or petals. Table S10: genes expressed in stamens and either sepals
and/or petals.
Additional file 3: GO comparison between all genes on the chip
and differentially expressed genes. Gene numbers comparing all
genes on the chip, genes expressed across different tissues and those
differentially expressed between any two tissues in each GO category.
Additional file 4: Genes preferentially expressed in eight tissues
and all the genes differentially expressed. This additional file contains
lists of all the genes preferentially and differentially expressed between
any two tissues and lists of genes preferentially expressed in each tissue
over all the other tissues. Column sequence, abbreviation and the
version of annotation are the same as those used in Table 1 and all the
other supplemental tables in Additional file 2. All the expression values
are log2 ratio.
Additional file 5: Expression levels of Arabidopsis homologs of
selected poppy genes. This additional file contains information about
the expression levels of Arabidopsis homologs of selected poppy genes
of interest listed in the tables in our study.
Additional file 6: Genes identified as putative A-, B- and C-domain
genes.
Additional file 7: Genes preferentially expressed in reproductive
tissues compared with leaf.
Additional file 8: Gene expression of different gene families.
Additional file 9: Probe design in the microarray and properties of
E. californica probe sets designed by MODIT and other methods
and primers used for RT-PCR experiments. This additional file contains
probe design and orientation of the custom microarray, properties of
probe sets and primers for RT-PCR.
Abbreviations
AG: AGAMOUS; AGL: AGAMOUS-like gene; AGO: ARGONAUTE; AOS: Array
Oligo Selector; AP: APETALA; ARF: Auxin-response factor; bHLH: basic helix-
loop-helix; bZIP: basic-leucine zipper; DEF: DEFICIENS; ESca: Eschscholzia
californica; EST: expressed sequence tag; FDR: false discovery rate; GLO:
GLOBOSA; GO: Gene Ontology; MYB: Myeloblastosis-like gene; OA:
OligoArray; PI: PISTILLATA; RT-PCR: real-time reverse-transcription PCR; TAIR:
The Arabidopsis Information Resource.
Acknowledgements
We would like to acknowledge Philip Larkin and Toni Kutchin for providing
EST data included in the microarray designs, and thank Xiaofan Zhou and
Dihong Lu for comments on the manuscript. This work was supported by
the Floral Genome Project (NSF NSF Plant Genome Award DBI-0115684) and
Ancestral Angiosperm Genome Project (NSF Plant Genome Comparative
Sequencing DEB-0638595) to CWD, HM, and JLM. RG was supported by an
NIH grant (R01-GM072619) and HM was also supported by funds from
Fudan University.
Author details
1
Department of Biology, The Pennsylvania State University, University Park,
PA 16802, USA.
2
The Huck Institutes of the Life Sciences, The Pennsylvania
State University, University Park, PA 16802, USA.
3
The Intercollege Graduate
Program in Cell and Developmental Biology, The Pennsylvania State
University, University Park, PA 16802, USA.
4
Department of Statistics, The
Pennsylvania State University, University Park, PA 16802, USA.
5
Department
of Bioinformatics and Genomics, The University of North Carolina at
Charlotte, 9201 University City Boulevard, Charlotte, NC 28223, USA.
6
State
Key Laboratory of Genetic Engineering and School of Life Sciences, Fudan
University, 220 Handan Road, Shanghai 200433, China.
7
Institutes of
Biomedical Sciences, Fudan University, 138 Yixueyuan Road, Shanghai
200032, China.
8
Current address: American Association for the Advancement
of Science, 1200 New York Avenue NW, Washington DC 20005, USA.
9
Current address: 2367 Setter Run Lane, State College, PA 16802, USA.
10
Current address: BASF Plant Science, 26 Davis Drive, Research Triangle Park,
NC 27709, USA.
11
Current address: Department of Entomology, The
Pennsylvania State University, University Park, PA 16802, USA.
12
Current
address: Department of Plant Biology, University of Georgia, 120 Carlton
Street, Athens, GA 30602, USA.
Authors’ contributions
LMZ, HM, NSA, JLM and CWD designed the study; DT and LMZ performed
tissue collection and RNA isolation; CJG and RG designed the
oligonucleotides for the probes used in the microarray chip; XM, LMZ and
DT performed RT-PCR experiments; LMZ, XM, NSA, QZ, and PKW performed
data analysis; LMZ, XM, and HM wrote the manuscript drafts; LMZ, XM, HM,
NSA, JLM, CWD, CJG, RG, and PKW edited the manuscript; all authors
approved the manuscript.
Received: 11 June 2010 Revised: 3 August 2010
Accepted: 15 October 2010 Published: 15 October 2010
References
1. Friis EM, Pedersen KR, Crane PR: Cretaceous angiosperm flowers:
innovation and evolution in plant reproduction. Palaeogeogr
Palaeoclimatol Palaeoecol 2006, 232:251-293.
2. Moore MJ, Soltis PS, Bell CD, Burleigh JG, Soltis DE: Phylogenetic analysis
of 83 plastid genes further resolves the early diversification of eudicots.
Proc Natl Acad Sci USA 2010, 107:4623-4628.
3. Anderson CL, Bremer K, Friis EM: Dating phylogenetically basal eudicots
using rbcL sequences and multiple fossil reference points. Am J Bot
2005, 92:1737-1748.
4. Leebens-Mack J, Raubeson LA, Cui L, Kuehl JV, Fourcade MH, Chumley TW,
Boore JL, Jansen RK, depamphilis CW: Identifying the basal angiosperm
node in chloroplast genome phylogenies: sampling one’s way out of
the Felsenstein zone. Mol Biol Evol 2005, 22:1948-1963.
5. Endress PK, Doyle JA: Floral phyllotaxis in basal angiosperms:
development and evolution. Curr Opin Plant Biol 2007, 10:52-57.
6. Putterill J, Laurie R, Macknight R: It’s time to flower: the genetic control of
flowering time. Bioessays 2004, 26:363-373.
7. Baek IS, Park HY, You MK, Lee JH, Kim JK: Functional conservation and
divergence of FVE genes that control flowering time and cold response
in rice and Arabidopsis. Mol Cells 2008, 26:368-372.
8. Liu C, Thong Z, Yu H: Coming into bloom: the specification of floral
meristems. Development 2009, 136:3379-3391.
9. Soltis DE, Ma H, Frohlich MW, Soltis PS, Albert VA, Oppenheimer DG,
Altman NS, dePamphilis C, Leebens-Mack J: The floral genome: an
evolutionary history of gene duplication and shifting patterns of gene
expression. Trends Plant Sci 2007, 12:358-367.
10. Zahn LM, Kong H, Leebens-Mack JH, Kim S, Soltis PS, Landherr LL, Soltis DE,
dePamphilis CW, Ma H: The evolution of the SEPALLATA subfamily of
MADS-box genes: a preangiosperm origin with multiple duplications
throughout angiosperm history. Genetics 2005, 169:2209-2223.
11. Zahn LM, Leebens-Mack J, DePamphilis CW, Ma H, Theissen G: To B or not
to B a flower: the role of DEFICIENS and GLOBOSA orthologs in the
evolution of the angiosperms. J Hered 2005, 96:225-240.
Zahn et al. Genome Biology 2010, 11:R101
/>Page 19 of 21
12. Paolacci AR, Tanzarella OA, Porceddu E, Varotto S, Ciaffi M: Molecular and
phylogenetic analysis of MADS-box genes of MIKC type and
chromosome location of SEP-like genes in wheat (Triticum aestivum L.).
Mol Genet Genomics 2007, 278:689-708.
13. Yamaguchi T, Hirano HY: Function and diversification of MADS-box genes
in rice. ScientificWorldJournal 2006, 6:1923-1932.
14. Ma H, dePamphilis C: The ABCs of floral evolution. Cell 2000, 101:5-8.
15. Theissen G, Becker A, Di Rosa A, Kanno A, Kim JT, Munster T, Winter KU,
Saedler H: A short history of MADS-box genes in plants. Plant Mol Biol
2000, 42:115-149.
16. Soltis DE, Bell CD, Kim S, Soltis PS: Origin and early evolution of
angiosperms. Ann N Y Acad Sci 2008, 1133:3-25.
17. Cui L, Wall PK, Leebens-Mack JH, Lindsay BG, Soltis DE, Doyle JJ, Soltis PS,
Carlson JE, Arumuganathan K, Barakat A, Albert VA, Ma H, dePamphilis CW:
Widespread genome duplications throughout the history of flowering
plants. Genome Res 2006, 16:738-749.
18. Orashakova S, Lange M, Lange S, Wege S, Becker A: The CRABS CLAW
ortholog from California poppy (Eschscholzia californica, Papaveraceae),
EcCRC, is involved in floral meristem termination, gynoecium
differentiation and ovule initiation. Plant J 2009, 58:682-693.
19. Jaramillo MA, Kramer EM: Molecular evolution of the petal and stamen
identity genes, APETALA3 and PISTILLATA, after petal loss in the
Piperales. Mol Phylogenet Evol 2007, 44:598-609.
20. Carlson JE, Leebens-Mack JH, Wall PK, Zahn LM, Mueller LA, Landherr LL,
Hu Y, Ilut DC, Arrington JM, Choirean S, Becker A, Field D, Tanksley SD,
Ma H, dePamphilis CW: EST database for early flower development in
California poppy (Eschscholzia californica Cham., Papaveraceae) tags over
6,000 genes from a basal eudicot. Plant Mol Biol 2006, 62:351-369.
21. Nam J, Kim J, Lee S, An G, Ma H, Nei M: Type I MADS-box genes have
experienced faster birth-and-death evolution than type II MADS-box
genes in angiosperms. Proc Natl Acad Sci USA 2004, 101:1910-1915.
22. Kramer EM, Dorit RL, Irish VF: Molecular evolution of genes controlling
petal and stamen development: duplication and divergence within the
APETALA3 and PISTILLATA MADS-box gene lineages. Genetics 1998,
149:765-783.
23. Galbraith DW: DNA microarray analyses in higher plants.
OMICS 2006,
10:455-473.
24. Ma H: Molecular genetic analyses of microsporogenesis and
microgametogenesis in flowering plants. Annu Rev Plant Biol 2005,
56:393-434.
25. Tung CW, Dwyer KG, Nasrallah ME, Nasrallah JB: Genome-wide
identification of genes expressed in Arabidopsis pistils specifically along
the path of pollen tube growth. Plant Physiol 2005, 138:977-989.
26. Wellmer F, Riechmann JL, Alves-Ferreira M, Meyerowitz EM: Genome-wide
analysis of spatial gene expression in Arabidopsis flowers. Plant Cell 2004,
16:1314-1326.
27. Yang WY, Yu Y, Zhang Y, Hu XR, Wang Y, Zhou YC, Lu BR: Inheritance and
expression of stripe rust resistance in common wheat (Triticum aestivum)
transferred from Aegilops tauschii and its utilization. Hereditas 2003,
139:49-55.
28. Zhang X, Feng B, Zhang Q, Zhang D, Altman N, Ma H: Genome-wide
expression profiling and identification of gene activities during early
flower development in Arabidopsis. Plant Mol Biol 2005, 58:401-419.
29. Voelckel C, Borevitz JO, Kramer EM, Hodges SA: Within and between
whorls: comparative transcriptional profiling of Aquilegia and
Arabidopsis. PLoS One 2010, 5:e9735.
30. Becker A, Gleissberg S, Smyth DR: Floral and vegetative morphogenesis in
California poppy (Eschscholzia californica Cham.). Int J Plant Sci 2005,
166:537-555.
31. Bennett MD, Leitch IJ: Nuclear DNA amounts in angiosperms: progress,
problems and prospects. Ann Bot 2005, 95:45-90.
32. Park SU, Facchini PJ: Agrobacterium rhizogenes-mediated transformation
of opium poppy, Papaver somniferum l., and California poppy,
Eschscholzia californica Cham., root cultures. J Exp Bot 2000, 51:1005-1016.
33. Becker A, Lange M: VIGS - genomics goes functional. Trends Plant Sci 2010,
15:1-4.
34. Wege S, Scholz A, Gleissberg S, Becker A: Highly efficient virus-induced
gene silencing (VIGS) in California poppy (Eschscholzia californica): an
evaluation of VIGS as a strategy to obtain functional data from non-
model plants.
Ann Bot 2007, 100:641-649.
35. Liscombe DK, Ziegler J, Schmidt J, Ammer C, Facchini PJ: Targeted
metabolite and transcript profiling for elucidating enzyme function:
isolation of novel N-methyltransferases from three benzylisoquinoline
alkaloid-producing species. Plant J 2009, 60:729-743.
36. Wall PK, Leebens-Mack J, Chanderbali AS, Barakat A, Wolcott E, Liang H,
Landherr L, Tomsho LP, Hu Y, Carlson JE, Ma H, Schuster SC, Soltis DE,
Soltis PS, Altman N, dePamphilis CW: Comparison of next generation
sequencing technologies for transcriptome characterization. BMC
Genomics 2009, 10:347.
37. Moore MJ, Bell CD, Soltis PS, Soltis DE: Using plastid genome-scale data to
resolve enigmatic relationships among basal angiosperms. Proc Natl
Acad Sci USA 2007, 104:19363-19368.
38. Sacan A, Ferhatosmanoglu N, Ferhatosmanoglu H: MicroarrayDesigner: an
online search tool and repository for near-optimal microarray
experimental designs. BMC Bioinformatics 2009, 10:304.
39. Altman NS, Hua J: Extending the loop design for two-channel microarray
experiments. Genet Res 2006, 88:153-163.
40. Kim S, Koh J, Yoo MJ, Kong H, Hu Y, Ma H, Soltis PS, Soltis DE: Expression
of floral MADS-box genes in basal angiosperms: implications for the
evolution of floral regulators. Plant J 2005, 43:724-744.
41. Drea S, Hileman LC, de Martino G, Irish VF: Functional analyses of genetic
pathways controlling petal specification in poppy. Development 2007,
134:4157-4166.
42. The Arabidopsis Information Resource. [ />43. Schmid M, Davison TS, Henz SR, Pape UJ, Demar M, Vingron M,
Scholkopf B, Weigel D, Lohmann JU: A gene expression map of
Arabidopsis thaliana development. Nat Genet 2005, 37:501-506.
44. Zhu J, Chen H, Li H, Gao JF, Jiang H, Wang C, Guan YF, Yang ZN: Defective
in Tapetal Development and Function 1 is essential for anther
development and tapetal function for microspore maturation in
Arabidopsis. Plant J 2008, 55:266-277.
45. Zhang W, Sun Y, Timofejeva L, Chen C, Grossniklaus U, Ma H: Regulation of
Arabidopsis tapetum development and function by DYSFUNCTIONAL
TAPETUM1 (DYT1) encoding a putative bHLH transcription factor.
Development 2006, 133:3085-3095.
46. Ascencio-Ibanez JT, Sozzani R, Lee TJ, Chu TM, Wolfinger RD, Cella R,
Hanley-Bowdoin L: Global analysis of Arabidopsis gene expression
uncovers a complex array of changes impacting pathogen response and
cell cycle during geminivirus infection. Plant Physiol 2008, 148:436-454.
47. Cui R, Han J, Zhao S, Su K, Wu F, Du X, Xu Q, Chong K, Theissen G, Meng Z:
Functional conservation and diversification of class E floral homeotic
genes in rice (Oryza sativa). Plant J 2010, 61:767-781.
48. Ma H, Yanofsky MF, Meyerowitz EM: AGL1-AGL6,anArabidopsis gene
family with similarity to floral homeotic and transcription factor genes.
Genes Dev 1991, 5:484-495.
49. Huang F, Chi Y, Gai J, Yu D: Identification of transcription factors
predominantly expressed in soybean flowers and characterization of
GmSEP1 encoding a SEPALLATA1-like protein. Gene 2009, 438:40-48.
50. Li H, Liang W, Jia R, Yin C, Zong J, Kong H, Zhang D: The AGL6-like gene
OsMADS6 regulates floral organ and meristem identities in rice. Cell Res
2010, 20:299-313.
51. Ohmori S, Kimizu M, Sugita M, Miyao A, Hirochika H, Uchida E, Nagato Y,
Yoshida H: MOSAIC FLORAL ORGANS1,anAGL6-like MADS box gene,
regulates floral organ identity and meristem fate in rice. Plant Cell 2009,
21:3008-3025.
52. Reinheimer R, Kellogg EA: Evolution of AGL6-like MADS box genes in
grasses (Poaceae): ovule expression is ancient and palea expression is
new. Plant Cell 2009, 21:2591-2605.
53. Rijpkema AS, Zethof J, Gerats T, Vandenbussche M: The petunia AGL6 gene
has a SEPALLATA-like function in floral patterning. Plant J 2009, 60:1-9.
54. Hsu HF, Huang CH, Chou LT, Yang CH: Ectopic expression of an orchid
(Oncidium Gower Ramsey) AGL6-like gene promotes flowering by
activating flowering time genes in Arabidopsis thaliana. Plant Cell Physiol
2003, 44:783-794.
55. Litt A, Irish VF: Duplication and diversification in the APETALA1/FRUITFULL
floral homeotic gene lineage: implications for the evolution of floral
development. Genetics 2003, 165:821-833.
56. Kanno A, Nakada M, Akita Y, Hirai M: Class B gene expression and the
modified ABC model in nongrass monocots. ScientificWorldJournal 2007,
19:268-279.
Zahn et al. Genome Biology 2010, 11:R101
/>Page 20 of 21
57. Schultz EA, Pickett FB, Haughn GW: The FLO10 gene product regulates
the expression domain of homeotic genes AP3 and PI in Arabidopsis
flowers. Plant Cell 1991, 3:1221-1237.
58. Tzeng TY, Kong LR, Chen CH, Shaw CC, Yang CH: Overexpression of the
lily p70(s6k) gene in Arabidopsis affects elongation of flower organs and
indicates TOR-dependent regulation of AP3, PI and SUP translation. Plant
Cell Physiol 2009, 50:1695-1709.
59. Riechmann JL, Meyerowitz EM: Determination of floral organ identity by
Arabidopsis MADS domain homeotic proteins AP1, AP3, PI, and AG is
independent of their DNA-binding specificity. Mol Biol Cell 1997,
8:1243-1259.
60. Lee S, Kim J, Han JJ, Han MJ, An G: Functional analyses of the flowering
time gene OsMADS50, the putative SUPPRESSOR OF OVEREXPRESSION OF
CO 1/AGAMOUS-LIKE 20 (SOC1/AGL20) ortholog in rice. Plant J 2004,
38:754-764.
61. Kyozuka J, Shimamoto K: Ectopic expression of OsMADS3, a rice ortholog
of AGAMOUS, caused a homeotic transformation of lodicules to stamens
in transgenic rice plants. Plant Cell Physiol 2002, 43:130-135.
62. Chanderbali AS, Albert VA, Leebens-Mack J, Altman NS, Soltis DE, Soltis PS:
Transcriptional signatures of ancient floral developmental genetics in
avocado (Persea americana; Lauraceae). Proc Natl Acad Sci USA 2009,
106:8929-8934.
63. Zahn LM, Leebens-Mack JH, Arrington JM, Hu Y, Landherr LL,
dePamphilis CW, Becker A, Theissen G, Ma H: Conservation and
divergence in the AGAMOUS subfamily of MADS-box genes: evidence of
independent sub- and neofunctionalization events. Evol Dev 2006,
8:30-45.
64. Chen X: Small RNAs and their roles in plant development. Annu Rev Cell
Dev Biol 2009, 25:21-44.
65. Lingel A, Simon B, Izaurralde E, Sattler M: Structure and nucleic-acid
binding of the Drosophila Argonaute 2 PAZ domain. Nature 2003,
426:465-469.
66. Peng J: Gibberellin and jasmonate crosstalk during stamen
development.
J Integr Plant Biol 2009, 51:1064-1070.
67. Martin C, Bhatt K, Baumann K, Jin H, Zachgo S, Roberts K, Schwarz-
Sommer Z, Glover B, Perez-Rodrigues M: The mechanics of cell fate
determination in petals. Philos Trans R Soc Lond B Biol Sci 2002,
357:809-813.
68. Tan QK, Irish VF: The Arabidopsis zinc finger-homeodomain genes encode
proteins with unique biochemical properties that are coordinately
expressed during floral development. Plant Physiol 2006, 140:1095-1108.
69. Ellis CM, Nagpal P, Young JC, Hagen G, Guilfoyle TJ, Reed JW: AUXIN
RESPONSE FACTOR1 and AUXIN RESPONSE FACTOR2 regulate
senescence and floral organ abscission in Arabidopsis thaliana.
Development 2005, 132:4563-4574.
70. Goetz M, Hooper LC, Johnson SD, Rodrigues JCM, Vivian-Smith A,
Koltunow AM: Expression of aberrant forms of AUXIN RESPONSE
FACTOR8 stimulates parthenocarpy in Arabidopsis and tomato. Plant
Physiol 2007, 145:351-366.
71. Sessions A, Nemhauser JL, McColl A, Roe JL, Feldmann KA, Zambryski PC:
ETTIN patterns the Arabidopsis floral meristem and reproductive organs.
Development 1997, 124:4481-4491.
72. Jakoby M, Weisshaar B, Droge-Laser W, Vicente-Carbajosa J, Tiedemann J,
Kroj T, Parcy F: bZIP transcription factors in Arabidopsis. Trends Plant Sci
2002, 7:106-111.
73. Gibalova A, Renak D, Matczuk K, Dupl’akova N, Chab D, Twell D, Honys D:
AtbZIP34 is required for Arabidopsis pollen wall patterning and the
control of several metabolic pathways in developing pollen. Plant Mol
Biol 2009, 70:581-601.
74. Das P, Ito T, Wellmer F, Vernoux T, Dedieu A, Traas J, Meyerowitz EM: Floral
stem cell termination involves the direct regulation of AGAMOUS by
PERIANTHIA. Development 2009, 136:1605-1611.
75. Heisler MG, Atkinson A, Bylstra YH, Walsh R, Smyth DR: SPATULA, a gene
that controls development of carpel margin tissues in Arabidopsis,
encodes a bHLH protein. Development 2001, 128:1089-1098.
76. Davies B, EgeaCortines M, Silva ED, Saedler H, Sommer H: Multiple
interactions amongst floral homeotic MADS box proteins. EMBO J 1996,
15:4330-4343.
77. Kaufmann K, Wellmer F, Muiño JM, Ferrier T, Wuest SE, Kumar V, Serrano-
Mislata A, Madueño F, Krajewski P, Meyerowitz EM, Angenent GC,
Riechmann JL: Orchestration of floral initiation by APETALA1. Science 2010,
328:85-89.
78. Kane MD, Jatkoe TA, Stumpf CR, Lu J, Thomas JD, Madore SJ: Assessment
of the sensitivity and specificity of oligonucleotide (50 mer) microarrays.
Nucleic Acids Res 2000, 28:4552-4557.
79. Li F, Stormo GD: Selection of optimal DNA oligos for gene expression
arrays. Bioinformatics 2001, 17:1067-1076.
80. Relogio A, Schwager C, Richter A, Ansorge W, Valcarcel J: Optimization of
oligonucleotide-based DNA microarrays. Nucleic Acids Res 2002, 30:e51.
81. Bloomfield VA, Crothers DM, Tinoco I Jr: Nucleic Acids: Structures, Properties,
and Functions Sausalito, CA: University Science Books; 2000.
82. Le Novere N: MELTING, computing the melting temperature of nucleic
acid duplex. Bioinformatics 2001, 17:1226-1227.
83. Wang Y, Kong F, Yang Y, Gilbert GL: A multiplex PCR-based reverse line
blot hybridization (mPCR/RLB) assay for detection of bacterial
respiratory pathogens in children with pneumonia. Pediatr Pulmonol
2008, 43:150-159.
84. Wang JP, Lindsay BG, Leebens-Mack J, Cui L, Wall K, Miller WC,
dePamphilis CW: EST clustering error evaluation and correction.
Bioinformatics 2004, 20:2973-2984.
85. Wall PK, Leebens-Mack J, Muller KF, Field D, Altman NS, dePamphilis CW:
PlantTribes: a gene and gene family resource for comparative genomics
in plants. Nucleic Acids Res 2008, 36:D970-D976.
86. Thompson JD, Gibson TJ, Plewniak F, Jeanmougin F, Higgins DG: The
CLUSTAL_X windows interface: flexible strategies for multiple sequence
alignment aided by quality analysis tools. Nucleic Acids Res 1997,
25:4876-4882.
87. Lee I, Dombkowski AA, Athey BD: Guidelines for incorporating non-
perfectly matched oligonucleotides into target-specific hybridization
probes for a DNA microarray. Nucleic Acids Res 2004, 32:681-690.
88. Riccelli PV, Merante F, Leung KT, Bortolin S, Zastawny RL, Janeczko R,
Benight AS: Hybridization of single-stranded DNA targets to immobilized
complementary DNA probes: comparison of hairpin versus linear
capture probes. Nucleic Acids Res 2001, 29:996-1004.
89. Chou HH, Hsia AP, Mooney DL, Schnable PS: Picky: oligo microarray
design for large genomes. Bioinformatics 2004, 20:2893-2902.
90. Lin HC, Morcillo F, Dussert S, Tranchant-Dubreuil C, Tregear JW,
Tranbarger TJ: Transcriptome analysis during somatic embryogenesis of
the tropical monocot Elaeis guineensis: evidence for conserved gene
functions in early development. Plant Mol Biol 2009, 70:173-192.
91. The R Project for Statistical Computing. [ />92. Bioconductor. [ />93. Yang YH, Thorne NP: Normalization for two-color cDNA microarray data.
In Statistics and Science: A Festschrift for Terry Speed. Volume 40. Edited by:
Goldstein DR. Beachwood, OH: Institute of Mathematical Statistics;
2003:403-418.
94. Smyth GK: Linear models and empirical bayes methods for assessing
differential expression in microarray experiments. Stat Appl Genet Mol Biol
2004, 3:Article3.
95. Limma: Linear Models for Microarray Data - User’s Guide.
[ />usersguide.pdf].
doi:10.1186/gb-2010-11-10-r101
Cite this article as: Zahn et al.: Comparative transcriptomics among
floral organs of the basal eudicot Eschscholzia californica as reference
for floral evolutionary developmental studies. Genome Biology 2010 11:
R101.
Zahn et al. Genome Biology 2010, 11:R101
/>Page 21 of 21