Báo cáo y học: " Detecting sequence polymorphisms associated with meiotic recombination hotspots in the human genome" pptx
Bạn đang xem bản rút gọn của tài liệu. Xem và tải ngay bản đầy đủ của tài liệu tại đây (738.75 KB, 15 trang )
RESEARC H Open Access
Detecting sequence polymorphisms associated
with meiotic recombination hotspots in the
human genome
Jie Zheng
1
, Pavel P Khil
2
, R Daniel Camerini-Otero
2*
, Teresa M Przytycka
1*
Abstract
Background: Meiotic recombination events tend to cluster into narrow spans of a few kilobases long, called
recombination hotspots. Such hotspots are not conse rved between human and chimpanzee and vary between
different human ethnic groups. At the same time, recombination hotspots are heritable. Previous studies showed
instances where differences in recombination rate could be associated with sequence polymorphisms.
Results: In this work we developed a novel computational approach, LDsplit, to perform a large-scale association
study of recombination hotspots with genetic polymorphisms. LDsplit was able to correctly predict the association
between the FG11 SNP and the DNA2 hotspot observed by sperm typing. Extensive simulation demonstrated the
accuracy of LDsplit under various conditions. Applying LDsplit to human chromosome 6, we found that for a
significant fraction of hotspots, there is an association between variations in intensity of historical recombination
and sequence polymorphisms . From flanking regions of the SNPs output by LDsplit we identified a conserved
11-mer motif GGNGGNAGGGG, whose complement partially matches 13-mer CCNCCNTNNCCNC, a critical motif for
the regulation of recombination hotspots.
Conclusions: Our result suggests that computational approaches based on historical recombination events are
likely to be more powerful than previously anticipated. The putative associations we identified may be a promising
step toward uncovering the mechanisms of recombination hotspots.
Background
Meiotic recombination is an important cellular process.
Errors in meiotic recombination can result in chromoso-
mal abnorm alities that underlie diseases and aneuploidy
[1,2]. A main driving force of e volution, recombination
provides natural new combinations of genetic variations.
Recombination events tend to cluster into narrow spans
of a few kilobases long, called ‘recombination hotspots’,
which have been observed in the human genome [3,4]
as well as in other species [5-7]. Understanding recom-
bination hotspots can provide insight into linkage dise-
quilibrium patterns and help create an accurate linkage
map for disease-association studies. Despite the
importance of meiotic recombination hotspots, the
mechanism behi nd them is still poorly understood.
Intriguing questions remain to be answered: for exam-
ple, how the hotspots are originated, how their locations
and intensities are regulated, how inheritable they are,
and so on.
There are three methods for estimating recombination
rates. Sperm-typing is an experimental method that
allows the recombination rate for an individual man to
be measured [8]. It has highly sensitivity due to a large
number of sperm cells analyzed. However, it can only
be used for short genomic regions due to limitations on
thePCRproductsizeandmultiplexing.Thesecond
method to identify recombination events uses pedigree
data [9-11]. This method allows genome-wide recombi-
nation rates to be studied, and allows identification of
recombination events in individuals. At present, how-
ever, the pedigree-based method has a low r esolution
and a high variance due to the usually low number of
* Correspondence: ;
1
Computational Biology Branch, NCBI, NLM, National Institutes of Health,
8600 Rockville Pike, Bethesda, MD 20894, USA
2
Genetics and Biochemistry Branch, NIDDK, National Institutes of Health , 5
Memorial Drive, Bethesda, Maryland 20892, USA
Full list of author information is available at the end of the article
Zheng et al. Genome Biology 2010, 11:R103
/>© 2010 Zheng et al.; licensee BioMed Central Ltd. This is an open access article distributed under the terms of the Creative Commons
Attribution License ( which permits unrestricted use, distribution, and reproduction in
any medium, provide d the origin al work is properly cited.
meioses examined. Since recombination hotspots are
usually a few kilobases w ide, it is difficult to accurately
detect hotspots with the current techniques of pedigree
studies. The third method is the inference of historical
recombination rates by studying linkage disequil ibrium
(LD) patterns using a coalescent model [4,12]. As high-
throughput, genome-wide and dense SNP data are avail-
able from the HapMap project [13,14], the LD-based
method is gaining more popularity. This approach
allows for high resolution genome-wide studies. It is
cheap, relatively fast, and provides clues about evolu-
tionary history. An important caveat related to this
method is that the computed rates are averaged over
thousands of past generations. However, since the
majority of hotspots persist over thousands of genera-
tions and there is a good agreement between the experi-
mental and ‘his torical’ hotspots, computationally derived
hotspots provide a good representation of hotspots in
the population [12,15].
Using the above methods, extensive variation in
recombination hotspots has been observed across spe-
cies, implying that hotspots evolve rapidly [16,17].
Despite over 98% sequence identity between the human
and chimpanzee genomes, there is no correlation in the
positions of their hotspots [18-20]. Differences in
recombination also exist among different human ethnic
groups [3,21,22]. Moreover, there is evidence for inter-
individual variation in recombination [10,23].
This interplay between conservation and variability has
been difficult to model. One model explaini ng the rapid
evolution of recombination hotspots is the biased trans-
mission of non-hotspot alleles, as a result of which a
hotspot tends to disappear [24,25]. This model, however,
is in conflict with the fact that recom bination hotspots
persist for many generations, which leads to the ‘ hotspot
paradox’ [26,27]. Various models have been proposed to
solve the paradox [27-29]. In particular, it has been pro-
posed that the hotspot paradox can be explained by a
combination of cis-andtrans-acting elements that
jointly influence hotspot activity [29,30].
One approach to correlating recombination with
sequence features is to divide the genome into regions of
high recombination rates (called ‘ jungles’ )andlow
recombination rates (called ‘ deserts’), and then measure
the correlation by comparing the enrichment for candi-
date elements in jungles and deserts. Using this method
and LD-based historical recombination hotspots in
human, Myers et al. [12] observed some motifs that are
enriched in hotspots, among which CCTCCCT and
CCCCACCCC are the most prominent. Applying a simi-
lar method to mouse data, Shifman et al. [31] observed
an enrichment for the same two motifs as well as repeats.
More recently, using the phase 2 HapMap data, Myers
et al. [32] extended the CCTCCCT motif to a family
of motifs based around the degenerate 13-mer CCNC
CNTNNCCNC, which was found to occur in about 40%
of human hotspots. Examining the variation of recombi-
nation rates across either the genome or populations, stu-
dies have shown a correlation between recombination
and genomic regions of special properties (for example,
GC content, chromatin structure) [12,14,33]. None of
these elements, however, can c onsistently explain the
presence of recombination hotspots.
Pedigree-based methods have been used to search for
sequence polymorphisms associated with genome-wide
recombination phenotype. Kong et al. [11] identified
three SNPs that are associated with high recombination
rate in males, but associated with low recombination
rate in females. Interestingly, the three SNPs are located
in the RNF212 gene, a putative ortholog of the ZHP-3
gene in Caenorhabditis elegans whose functions a re
involved in recombination and chiasma formation.
Chowdhury et al. [34] identified six genetic loci asso-
ciated with recombination phenotype, including one in
the RNF212 gene, and also found differences in
sequence polymorphisms associated with male and
female recombination.
Molecular experimental approaches have also been
used to predict trans-andcis-factors of recombination
hotspots. Using a PCR-based method on mouse germ-
lines, Baudat and de Massy [30] identified a trans-acting
element that activates by 2,000-fold the recombination
activity of a hotspot near the Psmb9 gene in the mouse
major histoco mpatibility complex, as well as a cis-acting
element that represses the hotspot. By comparing cross-
over rates in very short regions among different males
using sperm genotyping experiments, Jeffreys and Neu-
mann [24, 35] identified SNPs inside two ho tspots
(DNA2 and NID1) such that individuals with a particu-
lar genotype at such a SNP have a much higher recom-
bination rate at the corresponding hotspot than other
individuals; that is, the alleles of such a SNP correlate
with the varia tion of recombination rate. Interestingly,
one of these SNPs is located within CCTCCCT, one of
the aforementioned motifs [12]. It is known that the
mouse Prdm9 gene is uniquely expressed in early meio-
sis, capable of trimethylation of histone H3 lysine 4, and
has a role in infertility and double-strand break repair
[36]. Recently, three groups of researchers identified
Prdm9 as a trans-acting protein for recombination hot-
spots of human and mouse [37-39]. Importantly, human
Prdm9 protein was predicted to recognize the aforemen-
tioned 13-mer motif CCNCCNTNNCCNC in a zinc fin-
ger binding array. The f ast evolution of Prdm9 protein
and its binding motif can explain the lack of hotspot
conservation between human and chimpanzee [39].
Even more recent work of Berg et al. [40] demonstrated
that human sequence variation in the Prdm9 locus has a
Zheng et al. Genome Biology 2010, 11:R103
/>Page 2 of 15
strong effect on sperm hotspot activity. However, since
the 13-mer motif occurs in only about 40% of human
hotspots [32] and the variation in the zinc finger array
of the Prdm9 gene can expl ain only about 18% of varia-
tion in human recombination phenotype [38], it is unli-
kely that the 13-mer motif and the Prdm9 protein are
the sole regulators of recombination hotspots.
In this work we investigated whether SNP population
data, such as that in the HapMap databa se, could be
used to uncover associations between differences in hot-
spot strength and sequence polymorphisms. Hellenthal
et al. [41] argued that such genotype-dependent recom-
bination may be difficult to uncover due to biased gene
conversion (BGC). Specifically, they argued that it can-
not be guaranteed that a chromosome that is cold in
the current generation underwent a smaller number of
recombinations in the past than a chromosome that is
currently hot. The a rgument of Hellenthal et al. as well
as other comparisons between LD patterns and sperm
typing observations [42] highlights the difficulty of the
problem, but it does not exclude the possibility that
meaningful associations can be identified.
We developed a simple method called LDsplit that
divides the population of chromosomes into two subpo-
pulations by SNP alleles (that is, all members in each
set have the same allele at that SNP), estimates the
recombination rates for both subpopulations of chromo-
somes, and compares the difference between these rates
to the difference expected by chance. To correct for
potential bias due to different allelic backgrounds, we
standardized the hotspot difference of each hotspot-SNP
pair by the empirical distribution of SNPs with the same
minor allele frequency (MAF) in a chromosome.
First, running on HapMap SNP data, LDsplit was able
to uncover the known asso ciation between the FG 11
SNP and the DNA2 hotspot [24], with the strongest
association in the larger set of combined Chinese and
Japanese populations (CHB + JPT). Then, we used simu-
lation to show that LDsplit was robust to confounding
evolutionary factors of recurrent mutation and BGC.
Running LDsplit on the SNP data of human chromo-
some 6 of Chinese and Japanese populations (CHB +
JPT), HapMap phase II, we found that 15.36% (120 out
of 781) tested recombination hotspots are associated
with at least one SNP. We showed that this is unlikely
to occur by chance, and unlikely to be due to LD pat-
terns generated by different allelic backgrounds or selec-
tive sweep. We extend ed the identified SNPs to flanking
regions and found enriched elements, such as self-chains
and open chromatins. In addition, we identified an
enriched motif, GGNGGNAGGGG, whose complemen-
tary sequence partially matches the 13-mer motif
CCNCCNTNNCCNC, which was previously reported to
be critical in recombination hotspots [32,37].
Our results suggested that LD-based computational
methods for associating sequence polymorphisms with
recombination hotspots are likely to be more powerful
than previously anticipated. Moreover, the putative asso-
ciations that we identified using LDsplit would be an
important step toward uncovering regulatory mechan-
isms of recombination hotspots. The hotspot-SNP pairs
in chromosome 6 of the HapMap CHB + JPT popula-
tion and their LDsplit q-values are available in Addi-
tional file 1. The computer source code of L Dsplit and
simulation is freely available in Additional file 2, or can
be downloaded from the LDsplit website [43].
Results
Outline of LDsplit
We first provide an overview of the LDsplit approach.
Technical details of the approach are provided in the
Materials and methods section. For each candidate SNP,
LDsplit divides the population of chromosomes into two
subpopulations: one subpopulation containing chromo-
somes having allele 0 of this SNP, and the other subpo-
pulation having allele 1. If the SNP is associated with
the hotspot, then different alleles of the SNP may puta-
tively correspond to different levels of recombination
activities in the hotspot. For example, while one allele
could enhance the hotspot, the other allele could sup-
press it. Using the LDhat method we estimated the
population recombination rate r =4N
e
r for each seg-
ment (that is, the region between two consecutive
SNPs), and the recombination activity of a segment is
measured by the product of r and physical length of the
segment. The recombination activity of a hotspot, also
called hotspot ‘strength’, was then measured by the sum
of recombination activities of the segments that the hot-
spot spans. Since the actual level of hotspot strength in
each chromosome is unknown, we u sed the difference
of historical hotspot activities between the two subpopu-
lations as a proxy for the current hotspot differences
between the subpopulations (see Materials and methods
for details). Let r
0
and r
1
denote the strengths of the
same hotspot of two different subpopulations, then the
difference of recombination activities between the two
subpopulations, denoted Δr, is defined as ( r
0
- r
1
)/(r
0
+
r
1
), that is, the difference of hotspot strengths no rmal-
ized by the sum. To measure the significance of a hot-
spot-SNP association, we estimated the P-value of the
alternative hypothesis that the observed Δr is non-zero,
using permutation tests (see Materials and methods). In
computing P-value, we assumed that the Δr from the
random split should be normally distributed around
zero. We used the Shapiro test to filter out the hotspots
that violated this assumption. However, we observed
that hotpots with non-normal distributions of random
Δr typically contain a few ‘outlier’ chromosomes. We
Zheng et al. Genome Biology 2010, 11:R103
/>Page 3 of 15
developed a method to identify such outlier chromo-
somes (see Materials and methods section for details)
and observed that after their removal from the popula-
tion, the distribution of Δr often passed the normality
test.
There might be a potential bias in estimating differ-
ences in recombination rates as a result of the frequency
difference between the two alleles of a SNP. The allele
with lower frequency tends to be younger and its subpo-
pulation is likely to have str onger LD around the SNP
than the allele with higher frequency [44]. Moreover,
the younger allele has less time to accumulate historical
crossover events, which m akes it harder for LDhat to
detect a hotspot in that sample. As a result, the more
frequent allele of a candidate SNP tends to appear ‘hot-
ter’ than the rare allele. This trend has been indeed
observed in our data set (not shown). To control for
such artifacts, we adopted a strategy similar to [44] as
follows. First, let us define Δr as the r ofthemorefre-
quent allele minus the r of the rare allele. Then, for
each hotspot-SNP pair, we estimated the expectation,
denoted E( Δr), and standard deviation of Δr, denoted
SD(Δr), from the empirical distribution of those SNPs
with equal MAF values from the chromosome that con-
tains the hotspot-SNP pair. Then, the standardized ver-
sion of hotspot difference is defined as (Δr - E(Δr))/SD
(Δr). We applied the same standardization to the per-
mutation data, and obtained the standardized P-values.
Sperm typing case study
We first tested if LDsplit was ab le to correc tly predict a
hotspot-SNP association that had been shown to exist
by sperm typing experiments [24], namely the FG11
SNP with the DNA2 ho tspot in the MHC class II
region.ItwasobservedthatindividualswiththeTTor
TC allele at the FG11 SNP have a recombination rate
about 20 times higher than thos e with the CC allele.
Hence, we call the T allele ‘hot’ and the C a llele ‘cold’.
Interestingly, FG11 is located in the aforementioned
CCTCCCT motif [12]. Moreover, it was reported that
recombinant meioses from he terozygous individuals
were more likely to have the T allele (68 to 87%) than
the C allele, indicating the existence of BGC at the
DNA2 hotspot. Hellenthal et al. [41] used the DNA2
hotspot and the FG11 SNP as an example to argue that,
due to BGC, it might be difficult to uncover such differ-
ences in recombination rates between hot and cold
alleles using an LD-based method.
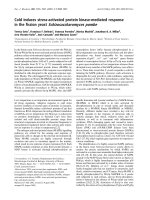
Despite the presence of BGC, however, LDsplit was
able to confirm the sperm typing result. As shown in
Figure 1, the ‘hot’ T allele indeed has a higher popula-
tion recombination activity at the DNA2 hotspot (esti-
mated by LDhat) than the ‘ cold’ C allele. The small
recombination rate of the C allele is unlik ely to be due
totheartifactofasmallsamplesizebecauseinthe
CHB + JPT (Han Chinese in Beijing, China and Japanese
in Tokyo, Japan) population there are more chromo-
somes with the C allele than with the T allele (117 ver-
sus 63), and in the other populations the numbers of
chromosomes with C versus T alleles are similar (58
versus 62 in CEU (Utah residents with Northern and
Western European ancestry) and 51 versus 69 in YRI
(Yoruba in Ibadan, Nigeria)). Moreover, as shown in the
last column of Table 1, the associatio n between the SNP
FG11 and the hotspot DNA2 is statistically significant in
the CHB + JPT (P < 0.000447) and the YRI (P < 0.0235)
populations. In the CEU population, the association is
not statistically significant, but the T allele still has a
higher population recombination rate than the C allele,
consistent with those in the other p opulations (Figure
1). We noticed that in this case the distribution of Δr in
random permutations was not normal (see P-values of
Shapiro’s tests in Table 1; note that a small P-value for
the normality test indicates that the distribution deviates
from the normal distribution). Therefore, we identified
the outlier chromosomes and removed them from the
corresponding populations. After the removal of the
outlier chromosomes, we observed: (1) the distribution
of Δr passed the normality test; (2) the association
between FG11 and DNA2 in the CHB + JPT population
became even more significant, and the association in the
YRI population also became significant (Table 1). We
repeated multiple runs for each population and obtained
consistent results (data not shown). The case study
result implies that, despite complicating factors such as
BGC, it is possible, at least in some cases, to use a com-
putational approach base d on historical recombination
rates t o identify the associ ations of sequence poly-
morphisms with allele-specific recombination hotspots.
In addition, we tested LDsplit on another sperm typ-
ing case. It was reported that sperm typing analysis
could not find any local polymorphisms associated with
the variation i n crossover rate in hotspots MSTM1a and
MSTM1b on human chromosome 1 [45]. Since the two
hotspots are within 2 kb of each other, and HapMap
SNPs at this region are not dense enough to distinguish
them, we consider them as one hotspot. We applied
LDsplit on th e 200-kb region around the hotspot, and
found no SNPs with a P-value <0.01 within the 200-kb
window. The neare st SNPs with P-values <0.05 for the
CEU, CHB + JPT and YRI populations are about 7 kb,
13 kb and 8 kb away from the hotspot. This result is
consistent with the lack of local associated polymorph-
isms observed by sperm typing. It might be possible that
there are associated SNPs among the SNPs with
P-values <0.05. However, due to the relatively low
Zheng et al. Genome Biology 2010, 11:R103
/>Page 4 of 15
Figure 1 Profiles of recombination rate at the DNA2 hotspot in the MHC region in chromosome 6 of the three populations (HapMap
phase II). For simplicity, we set the position of FG11 SNP at 0. The DNA2 hotspot spans from about -1 kb to 0.5 kb. In each population, the top
profile is from the whole sample (T or C allele at FG11); the middle profile is from the subpopulation with the T allele (hot); the bottom profile is
from the subpopulation with the C allele (cold). The population and the alleles at FG11 are labeled above each plot.
Table 1 Effect of removing outliers in the case study of the DNA2 hotspot and FG11 SNP
Before removal of outliers After removal of outliers
Population Outlier
chromosome
Grubbs P-value
for outlier
Shapiro P-value
(normality of Δr)
Association P-value
for FG11
Shapiro P-value
(normality of Δr)
Association P-value
for FG11
CHB + JPT 29 6.6e-7 0.00193 0.006258 0.5014 0.0004474
32 6.9e-6
56 0.051
CEU 102 0.00111 0.003336 0.08024 0.3915 0.2129
YRI 116 0.03 0.04887 0.1884 0.1302 0.02349
52 0.028
Zheng et al. Genome Biology 2010, 11:R103
/>Page 5 of 15
resolution of Ha pMap SNPs near this hotspot compared
with the sperm typing data, the putative association sug-
gested by LDsplit may not have high confidence.
Simulation study
The recombination h istory might be quite complicated
and it is possible that a chromosome that is cold in the
current generation underwent more crossovers in the
past than a currently hot chromosome. To test whet her
LDsplit is able to d etect signals of hotspot-SNP associa-
tion from the LD patterns, we carried out forward simu-
lations of crossover and BGC in which the causal SNP
and its hot and cold alleles were specified (see Materials
and methods section for details). Running on simulated
SNP data, LDsplit calculated for SNPs with MAF ≥ 0.3
(including the causal SNP) the P-values indicating the
strength of association with the simulated hotspot.
When the hot allele frequency of causal SNP in the
population was close to 0.3, it could happen that its
MAFinasamplewaslowerthan0.3.Suchrarecases
would be discarded from evaluation.
We tested different values of key parameters, namely
the positions of causal SNPs and hot a llele frequencies
at the beginning and the end of the simulation (Tables
S1, S2, and S3 in Additional file 3). If the hot allele fre-
quency at the beginning of evolution was 100%, it is
called the ‘cooling’ model; otherwise, if the beginning
hot allele frequency was 0%, it is called the ‘ heating’
model. Both cooling and heating models were simulated.
For all the combinations of parameters, we simulated 30
populations, and from each population we randomly
sampled 10 subsets, each consisting of 90 individuals
(180 haplotypes) as benchmark data. The relatively
small numbers of samples per population were due to
the high computational cost of LDsplit.
We then evaluated the performance of LDsplit as fol-
lows. First, we measured how likely LDsplit was to pre-
dict the hot and cold alleles of the causal SNP. If the
hotspot strength in the subpopulation of the hot allele
was bigger than that of the cold allele, we counted it as
a correct prediction of direction. We report the propor-
tion of correct predictions in the samples of a popula-
tion as a measure of performance. Second, we tested if
the LDsplit P-value could accurately measure the hot-
spot-SNP associati on. If the P-value is < 0.05, it is a
positive result; otherwise, it is a negative result. The
causal SNP is a ‘ true’ result, and all other SNPs are
‘false’. To correct for redundancy of SNPs in str ong LD,
we clustered SNPs into LD blocks (r
2
≥ 0.8) using the
ldSelect program [46], and from each block picked tag
SNPs as causal SNPs or otherwise SNPs with the smal-
lest P-values. By these criteria, we counted true positive
(TP) SNPs as the number of tag SNPs that are both
true and positive, and similarly for f alse positive (FP),
true negative (TN) and false negative (FN) SNPs. The
sensitivity, specificity, and positive predictiv e value
(PPV) are TP/(TP + FN), TN/(TN + FP) and TP/(TP +
FP), respectively. Note that we inserted only one causal
SNP while there were usually much more non-causal
SNPs, which might amplify the effect of false positives
in the calculation of the PPV. For each population, we
assessed the above measures of performance among
haplotype samp les. The average performance of LDsplit
on these populations is shown in Table 2. In most cases
LDsplit was able to correctly predict the direction of hot
versus cold alleles. The sensitivity and specificity are
about 60%.
In the abo ve simulation, we assumed that the causal
SNP was produced by a single mutation event that split
the coales cent tree into two subtrees. We consider these
simulations to be run under ‘ normal’ conditions. In
addition, we tested the robustness of LDsplit under
some unusual conditions. The first case is recurrent
mutation at the causal SNP. During evolution, multiple
mutation events were allowed to occur at the causal
SNP after its birth, and its mutation rate was specified
to be ten times higher than the background rate. As
shown in Table 2, under recurrent mutation at the cau-
sal SNP, the accuracy of direction prediction and sensi-
tivity even increases slightly, but specificity and PPV
decrease. This result implies that the performance of
LDsplit is robust to recurrent mutation. Under the nor-
mal conditions, the probability of BGC conditional on a
crossover was set to be 50%. As a result, the proportion
of recombinant gamete chromosomes with a cold allele
from a heterozygous parent would be 75%. Thus, the
normal conditions already take into account a quite
strong effect of BGC. We next tested LDsplit under
more severe BGC by increasing the average length of
BGC tract length from 500 bases to 10 kb. As shown in
Table 2, LDsplit is ro bust to more severe BGC effect,
and its specificity and PPV even increase, although the
sensitivity decreases.
Large scale analysis
Encouraged by the results for the sperm typing case
study and the simulation, we performed a large-scale
analysis. First, we identified a list of recombination hot-
spots from the SNP data for chromosome 6 of the CHB
+ JPT population of the HapMap dataset, phase II, from
which we filtered out hotspots of weak intensity com-
pared to the background (as described in the Materials
and methods section). In this way we identified 5,149
hotspots. As mentioned in the outline of LDsplit, to
estimate the P-values of associations, we assumed that
the distribution of random Δr (that is Δr of random
splits into two subpopulations) could be reasonably
approximated by the normal distribution. For each
Zheng et al. Genome Biology 2010, 11:R103
/>Page 6 of 15
hotspot, we estimated the distribution of Δr based on
200 random splits. We rejected hotspots with non-nor-
mal distributions of random Δr (Shapiro’s normality
test P < 0.05), and were left with 781 hotspots.
For each selected hotspot, we consi dered all SNPs that
were within a distance of 200 SNPs on either side of the
hotspot and with an MAF of at least 0.3. The lower
bound of the MAF value was needed for an accurate esti-
mation of the recombination rate for each subpopulation.
In this study, as in most genome-wide studies where
the number of features tested is typically more than tens
of thousands, an important concern is multiple testing.
To achieve a balance between the number of false posi-
tives and the number of true positives, we used the false
discovery rate (FDR). The FDR is defined as the
expected proportion of false positives among those fea-
tures claimed to be significant [47]. In addition, to
attach a measure of significance to each individual hot-
spot-SNP associati on, we mapped every P-value to a
q-value [48]. Specifically, in the set of hotspot-S NP pairs
selected by requiring their q-values to be no more than
a, the expected proportion of false positives (FDR) is
also no more than a.
To test further if these hotspot-SNP pairs could have
been selected by chance, we simulated the null model
(that is, there is no association between hotspots and
SNPs) as follows. For each hotspot-SNP pair tested in the
real case, we randomly divided the population into two
subpopulations whose sizes were equal to the sizes of the
real case. T hen we calculated P-values and q-values for
these artificial hotspot-SNP pairs, in one-to-one corre-
spondence with the real pairs. As shown in the histo-
grams of real and random P-values (Figure S1 in
Additional file 3), the vast majority of random P-values
are uniformly distributed, indicating that they correspond
to the truly null hypothesis. Compared with the real case,
the set of artificial hotspot-SNP pairs contains fewer
small q-values and a large number of q-values close to 1
(Figure S2 i n Additional file 3). This provided additional
support that the identification of hotspot-SNP pairs (q <
0.01) was not by chance. As shown in Table 3, we
observed that 15.36% (120 out of 781) of recombination
hotspots were associated with at least one SNP.
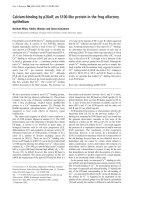
Next, we studied the distribution of the hotspot-SNP
distances of significant hotspot-SNP pairs (q <0.01)
measured by: (1) the physical distance (in kilobases)
from the SNP to the center of the hotspo t; and (2) the
number of SNPs between the candidate SNP and the
proximal boundary (also a SNP) of the hotspot. Figure 2
shows the distribution of the physical distances. The dis-
tances measured by numbersofSNPsshowasimilar
trend (Figure S3 in Additional file 3). LDsplit uncovered
more associated SNPs at short distances from the hot-
spots.Wecannotasserttowhatextentthisproperty
should be attributed to the loss of the power of the
method over larger distances versus the distribution of
the distance from a candidate SNP to an associated
hotspot.
As mentioned above, the difference between the
recombination rates of the two alleles of a SNP, which
is used by LDsplit to assess the significance of associa-
tion, might be due to different allelic backgrounds; that
is, the ancestral allele might have a higher historical
recombination rate because it has a longer time to accu-
mulate crossover events than the derived allele. Note
that this issue has been addressed, at least in part, by
the aforementioned standardization with allele frequen-
cies. In the following, w e show that while some effects
of the artifact might still exist, they do not dominate the
results of LDsplit.
To assess a possible impact of allelic ages on the esti-
mation of recombination rates, we counted the numbers
of hotspot-SNP p airs in which the SNP derived allele is
‘ cold’ and the number of such pairs when the derived
allele is ‘hot’. An allele is called ‘cold’ when the chromo-
some sample with that allele has a smaller hotspot
strength, and ‘ hot’ otherwise. For simplicity, when a
derived SNP allele is cold (or hot), we call the hotspot-
SNP pair ‘ derived-cold’ (or ‘derived-hot’). The ancestral
states of HapMap SNPs were obtained from dbSNP and
alignment between human and chimpanzee genomes
[44]. Suppose that, despite the standardization with allele
frequencies, this artifact still dominates the LDsplit
results, then the hotspot-SNP pairs with small q-values
wouldbeexpectedtobemoreenrichedwithderived-
cold pairs than pairs with big q-values. However, as
shown in Table 4, the pairs with small q-values are even
less enriched than those with big q-values, except when
SNPs are outside but within 50 kb of hotspots. Even
in the latter exceptional case, the ratio for p airs with
Table 2 Average performance of LDsplit on simulation data
Condition Correct prediction of hot/cold alleles (%) Sensitivity (%) Specificity (%) Positive predictive value (%)
Normal 89.26 ± 18.23 63.15 ± 26.42 58.71 ± 26.53 46.29 ± 22.22
Recurrent mutation 93 ± 9.88 70 ± 27.16 51.78 ± 21.99 43.58 ± 22.49
Long BGC tract (10 kb) 84.29 ± 22.77 53.4 ± 28.34 75.65 ± 12.94 52.60 ± 25.27
The standard deviations are slightly high because we sampled only ten sets of haplotypes for each parameter configuration due to the high computational cost
of LDsplit.
Zheng et al. Genome Biology 2010, 11:R103
/>Page 7 of 15
q < 0.01 is not much bigger than the o verall ratio of
1.342. This suggests that the difference in allelic ages did
not contribute to small LDsplit q-values significantly.
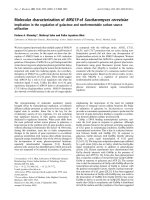
Some of the hotspot differences might also be caused
by the extended haplotype block created by selective
sweep at one allele. T o estimate the confounding effect
between LDsplit and selection, we correlated the LDsplit
q-values with signals of selective sweep estimated using
iHS scores from Haplotter [44]. For a SNP associated
with multiple hotspots, we picked the hotspot that is
nearest to the SNP. If a large fraction of SNPs identified
by LDsplit could be attributed to the signal of se lection,
there should be a strong positive correlation between
the two variables. However, the scatter plots between
iHS and q-values in Figure 3 suggest that the correlation
is weak. The coefficient of determination R
2
, which mea-
sures the fraction of variance explained, is mostly less
than 0.01. The strongest correlation is when SNPs are
inside hotspots and the derived allele is cold, with R
2
=
0.00602. Therefore, most signals o f hotspot differences
in LDsplit cannot be explained by selective sweep.
Genomic feature analysis
From the large scale analysis, we identified a list of can-
didate SNPs associated with recombination hotspots in
chromosome 6 of the human genome. In this section,
we analyze these SNPs in search of genomic features
that might be associated with the regulation of recombi-
nation hotspots. After controlling for confounding
effects such as hotspot-SNP distance and LD blocks, we
selected 498 candidate SNPs and 604 contro l SNPs (see
Materials and methods section for details). The goal was
to identify genomic features that preferentially occur
near candidate SNPs but not control SNPs.
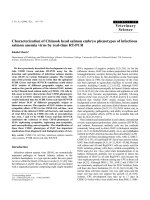
First, we searched for conserved motifs near candidate
SNPs. The SNPs were extended on both sides to flank-
ing windows of 90 bases long. Running MEME on can-
didate and control windows, respectively, we identified
three motifs in candidate windows and two motifs in
control windows. The first two motifs in candidate win-
dows are C-rich and T-rich sequences, and are similar
or approximately complementary to the two motifs in
the control windows (data not shown). The third 11-
mer motif (Figure 4) pre ferentially occurs around candi-
date SNPs (sites = 34, E-value = 2.7e-7). Interestingly,
its complementary sequence partially matches the well-
known 13-mer motif CCNCCNTNNCCNC, which was
previously discovered [32] and recently identified as
binding sites of the Prdm9 protein [37]. The 90-base
windows around candidate SNPs have an average GC%
of 0.418 ± 0.0976, slightly higher than the control aver-
age GC% of 0.408 ± 0.100 (P = 0.0616, Wilcoxon test).
Next,wesearchedforgenomicelementsthatoverlap
with windows around candidate SNPs. To catch more
complete information, we extended SNPs to windows of
200 bases long. Using the intersection operation of the
UCSC genome browser, we counted the proportions of
candidate and control windows that overlap with a cer-
tain genomic element, and assessed the significance of
enrichment by Fisher’s test. Of the 20 genomic elemen ts
(Table S4 in Additional file 3) we studied, self-chain
(alignment of human genome regions with itself indica-
tive of duplications within t he genome) and open chro-
matin (AoSMC DNase Pk) have significant enrichment
in candidate windows (Table 5).
Overall, there is no difference in enrichment of repeats
between candidate and control SNPs in general (Table S6
in Additional file 3). To further analyze particular
Table 3 The numbers of hotspot-SNP pairs, and the numbers of hotspots and SNPs involved in those pairs
Number of hotspot-SNP pairs Number of hotspots in the pairs Number of SNPs in the pairs
SNPs outside hotspots
Total 99,899 781 44,713
Real (q < 0.01) 1,430 115 1,361
Random (q < 0.01) 85 18 85
Intersection of real and random 45 11 45
SNPs inside hotspots
Total 1,440 615 1,436
Real (q < 0.01) 67 44 67
Random (q < 0.01) 4 2 4
Intersection of real and random 3 2 3
SNPs inside or outside hotspots
Total 101,339 781 44,896
Real (q < 0.01) 1,497 120 1,426
Random (q < 0.01) 89 18 89
Intersection of real and random 48 11 48
If a hotspot or a SNP is involved in multiple pairs, we counted it only once.
Zheng et al. Genome Biology 2010, 11:R103
/>Page 8 of 15
repeats, we counted the members of the Repeat Masker
dataset that overlap with candidate and control windows.
The top five repeats that overlap with the highest num-
bers of candidate windows are not preferentially located
near candidate SNPs ( Table S6 in Additional file 3). The
only repeat with more occurrences near candidate SNPs
is MER4D1 (P = 0.0414), while (TG)n and MIR3 occur
more frequently near control SNPs (P = 0.0268).
Ten candidate SNPs fall inside coding exons while
only two control SNPs are coding; thus, the majority of
candidate and control SNPs are non-coding. There is no
significant difference in MAF and ancestral allele fre-
quencies between candidat e and contro l SNPs (data not
shown).
Finally, we analyzed the relationship between hotspot-
SNP distance and genomic feature enrichment. First, we
Figure 2 Distribution of physical distances of candidate hotspot-SNP pairs (q < 0.01). When a SNP is inside a hotspot, the distanc e is 0;
when a SNP is to the left of a hotspot, the distance is negative.
Table 4 The numbers of hotspot-SNP pairs in which the SNP-derived allele is cold versus hot
SNP inside hotspot 0 <D ≤ 50 kb 50 kb <D ≤ 100 kb D > 100 kb
q < 0.01 34/31 (1.097) 596/354 (1.684) 141/118 (1.195) 92/92 (1.000)
0.01 ≤ q < 0.05 55/48 (1.146) 1,066/673 (1.584) 402/271 (1.483) 386/277 (1.394)
0.05 ≤ q < 0.5 437/375 (1.165) 11,227/8,030 (1.398) 8,081/6,187 (1.306) 10,182/7,764 (1.311)
q ≥ 0.5 229/162 (1.414) 6,399/4,877 (1.312) 7,034/5,217 (1.348) 10,164/7,676 (1.324)
Ratios are given in parentheses. The pairs are classified by LDsplit q-values and the physical distance D between a hotspot and a SNP.
Zheng et al. Genome Biology 2010, 11:R103
/>Page 9 of 15
observed a positive Pearson correlation between hotspot-
SNP distances and q-values output by LDsplit (P =0.0346;
Figure S4 in Additional file 3). The distances have a posi-
tive correlation with MAF, and a negative correlation with
GC% around candidate SNPs, but neither are significant
(Figure S4 in Additional file 3). Furthermore, we compared
candidate SNPs within 2 kb of hotspot centers (proximal
SNPs) with SNPs 50 kb away (distant SNPs). Similar to
the aforementioned analysis using the UCSC genome
browser, we counted the numbers of features overlapping
with 200-bp windows around proximal and distant SNPs.
It turns out that self-chains are more enriched near proxi-
mal SNPs than distant SNPs (P = 0.00512, Fisher’stest),
but none of the other elements is significantly enriched or
depleted (Table S5 in Additional file 3). However, since
only 23 out of 178 SN Ps that overlap with self-chains are
within 2 kb o f hotspots, the enrichment of self-chains
reported for all candidate SNPs (Table S4 in Additional
file 3) is not due to SNPs within hotspots only. Second, we
ran MEME on the 200-bp windows around proximal and
dis tant candidate SNPs but did not find any significantly
conserved motif.
Discussion
Although our approach achieved promising perfor-
mance on both real and simulation data, it has a few
caveats. First, we used historical recombination hot-
spots inferred from LD patterns to approximate extant
Figure 3 Scatter plots between LDsplit’s q-values that are less than 0.1 and Haplotter’s iHS s cores. The three columns are, respectively,
hotspot-SNP pairs where the SNP-derived allele is cold, hot, and both; the three rows correspond to three ranges of hotspot-SNP physical
distances D. The red line in each panel is the least square regression line, and R
2
at the top is the coefficient of determination, measuring the
fraction of variance of iHS scores explained by q-values.
Zheng et al. Genome Biology 2010, 11:R103
/>Page 10 of 15
hotspots that are needed as phenotypes in such asso-
ciation studies. Thus, we might miss very young hot-
spots that have no time to leave a signature in the LD
patterns, and some hotspots inferred from LD might
have already died. However, it has been observed that
extant hotspots largely agree with hotspots inferred by
LD-based methods [15].
Next, our method looks for single-locus cis-association
of the variation in hotspot strength with genetic poly-
morphism in relatively proximal loci. It is possible, as
demonstrated in [30], that hotspot activity is influenced
by more than one locus including a long range trans-
effect. The genome-wide study of such epistatic effects
and long range trans-effects are rather limited due to
statistical issues, including multiple testing. In our study
this problem is amplified by the computational cost of
the permutation test. In the current implementation,
each permutation requires re-computing of r ecombina-
tion rates using the computationally intensive LDhat
algorithm.
Finally, to accurately estimate the population recombi-
nation rate, our computational method requires that
both subpopulations are relatively large. Thus, if just a
few chromosomes are much hotter or colder than the
rest, our method would be less powerful at ident ifying a
corresponding association. For similar reasons, in our
large scale study we excluded hotspots for which the
distribution of differences in recombination rates in ran-
domly split subpopulations deviated significantly from
the normal distribution.
In the sperm typing case study, LDsplit identified the
most significant association for the CHB + JPT popula-
tion, and less significant association for the CEU and
YRI populations. This might be due to various reasons.
For example, the combined CHB + JPT population has
a bigger s ample size (90 individuals) than eithe r of the
CEU or YRI populations (60 individuals). Moreover, the
CEU and the YRI samples have a trio family struc ture,
which may make it more difficult for LDhat to accu-
rately estimate the recombination rates. Another reason
might be the difference in demographic history.
Conclusions
In this work, we demonstrate that the variations in
strengths of recombination hotspots could be associated
with sequence polymorphisms, and we propose a
method called LDsplit to map such associations based
on LD patterns in HapMap data. Previous work sug-
gested that it is difficult, if not impossible, to uncover
allele-specific recombination hotspots from L D patterns.
However, LDsplit was able to correctly predict the asso-
ciation of the FG11 SNP with the DNA2 hotspot in the
MHC class II region that had been directly observed by
sperm typing experiments. Moreover, we carried out
forward simulations of causal SNPs of recombination
hotspots, and tested the performance of LDsplit on the
simulated data. Despite BGC, the performance of
LDsplit turned out to be reasonab ly good, implying that
the extant hot alleles tend to experience more historical
crossovers than cold alleles. Then we applied LDsplit to
chromosome 6 of the CHB + JPT population and
observed widespread associations of sequence poly-
morphisms with hotspots unlikely to occur by chance.
Taking into account the ancestral states of SNPs, we
showed that LDsplit is not confounded by the artifact of
different allelic ba ckgrounds or selective sweeps. From
flanking regions of the SNPs identified by LDsplit with
significant association with hotspots, we found a con-
served 11-mer motif, whose complement partially
matches the 13-mer CCNCCNTNNCCNC, a critical
motif for the regulation of recombination hotspots. This
result not only confirms previous work [32,37] about
Figure 4 The 11-mer motif found using MEME to be conserved
only around candidate SNPs (sites = 34, E-value = 2.7e-7). Its
complementary sequence partially matches the CCNCCNTNNCCNC
motif previously reported to be associated with recombination
hotspots.
Table 5 Significant enrichment of genomic elements near candidate SNPs
Candidate Control P-value
Genomic element Number of hits Number of misses Number of hits Number of misses (Fisher’s test greater)
Self-chain 178 320 165 439 0.00165
Open chromatin (AoSMC DNase Pk) 25 473 17 587 0.0408
Coding exon 10 488 2 602 0.00789
Zheng et al. Genome Biology 2010, 11:R103
/>Page 11 of 15
the regulatory role of the 13-mer motif, but also demon-
strates the utility of LDsplit to find such motifs.
Given the aforementioned restrictions, the LDsplit
method is not expected to uncover all associations.
Nevertheless, the agreement between the LDsplit predic-
tion and sperm typing result suggests that LDsplit is
promising in connecting historical recombination w ith
the extant phenotype of a recombination hotspot. The
SNPs predicted by LDsplit may co-segregate with some
evolutionarily inheritable factors that regulate the
increase and decrease of recombination rates. Therefore,
this work should provide an important step towards
understanding the regulatory mechanism behind recom-
bination hotspot activity.
Materials and methods
Data
We used a subset of the phased data of HapMap phase
II, release 22, which consists of 90 JPT and 90 CHB
samples of chromosome 6. In total, there are 176,352
SNPs, out of which 56,510 have a MAF ≥ 0.3. We used
the latter SNPs for association with hotspots (because
SNPs with a MAF that is too small will give small sam-
ples of chromosomes for which an LD-based method i s
not powerful enough to detect recombination hotspots).
Recombination rate profiles were estimated using the
program ‘ interval’ from the LDhat package version 2.1
[49]. Hotspots were defined as peaks in the recombination
rate profile with widths no more than 20 kb and an aver-
age rate above 1 cM/Mb. First, we detected all th e peaks
in the map (the first derivative is equal to 0 and the second
derivativ e is negative) and fitted a normal distribution to
the part of the map from the 50-kb genome region sur-
rounding the center of each peak. Then we extended hot-
spot boundaries to include all map segments with
recombination rates above the mean recombination rate
inside the smaller of 2 × fitted peak width, full width at
half maximum (FWHM) ob tained from the curve fitting,
or a 50-kb region centered at the peak. If two adjacent
hotspots defined in such a way overlap, we set the peak
boundaries in the middle of the valley between the peaks.
Comparing strengths of a hotspot between two
populations
Given a hotspot detected from a combined population
(for example, JPT + CHB), we first fixed the boundaries
of the hotspot region. Then we estimated the recombi-
nation rates of the region for the two subpopulations
separately. The two subpopulations could be either true
or pseudo. To measure the difference of a hotspot
between two subpopulations, we calculated the strength
of the hotspot in each subpopulatio n, denoted by r.Let
r
0
and r
1
represent the hotspot strengths of the two
subpopulations, and define their difference by:
Δ
=− +( )/( )
01 01
Then, we standardized the hotspot difference as (Δr - E
(Δr))/SD(Δr), where the expectation E(Δr)andstandard
deviation SD(Δr) were estimated from the empirical dis-
tribution of SNPs with equal MAF values from the chro-
mosome that contains the SNP in question.
Permutation tests
To measure the significance of a hotspot-SNP associa-
tion, we simulated the null hypothesis that there is no
difference i n hotspot strengths between two split subpo-
pulations, using 200 random permutations. For each
permutation, we randomly split the sample of chromo-
somes into two subsamples each co ntaining at least 30%
chromosomes, and then calculated the random Δr
between the two subsamples as described previously.
We estimated the P-value of the h otspot-SNP associa-
tion by the proportion of random |Δr| bigger than the
observed | Δ r|.
Due to the formidable computational cost of the per-
mutation tests, we reused the permutation data that one
of the authors (PPK) had generated previously - over a
month long computation on the NIH Biowulf cluster. In
those permutations the chromosomes were divided into
two random sets of equal size, and homologous chro-
mosomes of the same person were always permuted
tog ether. In the current study, however, we allowed our
subpopulations to be of different sizes (albeit still
balanced in that the smaller subpopulation consists of at
least 30% chromosomes as we considered only SNPs
with a MAF of at least 0.3). Furthermore homologous
chromosomes of the same individual could be separated.
Thus, our permutation test should ideally have consid-
ered all possible partition sizes with the smaller partition
at least 30%. To test if this difference o f permutations
would cause artifacts, we randomly sampled ten hot-
spots and calculated P-values using ‘ideal’ permutation
tests and compared them to the results obtained with
the 50/50 permutations. Let us call the two types of
P-values P
1
and P
2
. Of the sampled hotspot-SNP pairs,
756 pairs had P
1
>P
2
, and 745 pairs had P
1
≤ P
2.
The
distribution of differences P
1
- P
2
was very close to the
normal distribution centered at 0 ( data not shown).
Therefore, the test on the sampled hotspots showed that
there should be no significant difference between the
two types o f permutations with regard to P-values.
However,wereportedthemoreconservativeresultsfor
an FDR (q-value) of 0.01 rather than t he customary
Zheng et al. Genome Biology 2010, 11:R103
/>Page 12 of 15
0.05, taking into account that the FDR might be slightly
underestimated using the 50/50 permutation tests.
Identifying outlier chromosomes
To deal with the cases when the random Δr at a hot-
spot deviates significantly from the normal distribution,
we identified outlier chromosomes using a side score
defined as follows. For each permutation, we kept track
of which subpopulation the chromosome belongs to. If
it is in the subpopulati on with the higher hotspot
strength,itgainsacreditof|Δr|; otherwise, it loses by
|Δr|. The side-sc ore for a chromosome is the sum of
the gains and losses, that is:
S
i
i
=
∈
∑
Δ
Π
where Δr
i
is positive if the chromosome is i n the hot-
ter subpopulation in the ith permutation, and negative
otherwise. The side-scores of most chromosomes were
distributed normally, except for a few outliers. We used
Grubbs’ method to detect the chromosomes with outlier
side-scores, and estimated the P-value of being an out-
lier using the student’s t-distribution.
Simulation test
Our simulation program was developed using Python
2.6 and ba sed on simuPOP (v ersion 1.0.3), an ope n
source framework for forward simulation of population
genetics [50]. We simulated the evolution of a popula-
tion of 5,000 individuals for a specified number of
generations (for example, 3,000) using a neutral for-
ward-time model. Each individual had a genotype,
which consisted of two homologous haplotypes of length
200 kb. Each haplotype was represented by a list of
SNPs, each having two alleles 0 and 1. A SNP was gen-
erated by a mutation event, simulated using the infinite-
site model and Poisson process. When an allele of a
SNP became fixed in the population, the SNP was
removed from every haplotype.
A hotspot was inserted with its center at 100 kb, and
a causal SNP, whose alleles determined different recom-
bination rates at the hotspot, was inserted at various
positions (for example , 75, 100 and 125 kb). In each
generation, we r andomly picked pairs of individuals of
opposite sex as parents. For each parent we simulated
the meiosis, specifically focusing on the process of
recombination, as follows. If both alleles at the causal
SNP were cold, then there was no hotspot, and the
crossover position was uniformly distributed along the
200 kb. For simplicity, we assumed that there was one
crossover in a chromosome of 200 Mb per meiosis;
thus, in 200 kb the probability was 0.001. If the causal
SNP was hete rozygous, then the probability of crossover
was increased by ten times the background rate; if both
alleles at the causal SNP were hot, then the probability
increased by 20 times. Moreover, the crossover position
was simulated under normal distribution centered at the
position of 100 kb where the hotspot center is l ocated.
We also simulated BGC by repairing a small region
(called the tract) f rom the chromosome that initiates a
double-strand break by copying from the other chromo-
some. At the center of the tract was the breakpoint of
the crossover, and the tract length was simulated in
Gaussian distribution with mean equal to 500. To simu-
late severe BGC, we increased the mean tract length to
10 kb. A fter meiosis, the parents transmitted their
gamete chromosomes to the next generation.
At the beginning of evolution, the causal SNP had
either the cold or hot allele fixed in the population.
Then a derived allele was introduced by a mutation
event and invaded the population by some evolutionary
force. The frequency of the hot allele in the last genera-
tion was specified as a simulation parameter. Changes in
the hot allele frequency followed a linear trajectory, dic-
tated by t he reject-sampling algorithm [51]. If the hot
allele frequency decreased during evolution, we call it a
‘cooling’ model; otherwise, we call it a ‘ heating’ model.
At the end of each simulation, a population of geno-
types was exported, from which we randomly sampled
10 subsets each of 90 individuals ( 180 haplotypes) as
benchmark SNP data.
Sliding windows of population split
Some hotspots tend to be near each other, and i t is
computationally costly to estimate recombination rates.
Thus, to avoid redundant splits for closely located hot-
spots, we searc hed for association using sliding windows
centered at candidate SNPs. N ote that we may estimate
different recombination rates for the same segment in
the overlapping region of two sliding windows, due to
the differenc e of non-overlapping SNPs. We resolved
this issue by setting each sliding window to span 500
segments and discarding recombination rates of 50 seg-
ments a t both ends of the window. As we observed, the
estimation of the recomb ination rate of a segment
usually depended on no more than 100 SNP s surround-
ing it.
Genomic feature analysis
To search for genomic features associated with candidate
SNPs, we first selected candidate and control SNPs as fol-
lows. From the output of LDsplit on chromosome 6 of
the HapMap JPT + CHB population, we chose split SNPs
with q ≤ 0.01 as candidates and SNPs with q > 0.5 as con-
trols. Then, to correct for redundancy of linked SNPs, we
clustered SNPs into LD blocks using the ldSelect pro-
gram [46] with r
2
≥ 0.8. To control for hotspot-SNP
Zheng et al. Genome Biology 2010, 11:R103
/>Page 13 of 15
distance, for each hotspot with at least one candid ate LD
block, we selected control blocks so that the distances
between the block centers and the hotspot center were
closest to the corresponding distance of the candidate
block. For each candidate block, we picked two control
blocks, if available, for a more complete coverage of back-
ground signals. Then, we selected the SNP from each
candidate LD block with the smallest q-value as the tag
candidate SNP, and similarly from the control blocks.
The resulting 498 candidate and 604 control tag SNPs
were compared in the following analysis.
First, we extracted 90-base DNA sequences around
the candidate and control tag SNPs from human gen-
ome reference NCBI b36.2, and uploaded them onto the
MEME web server [52,53] to search for conserved
motifs, with the minimum number of sites equal to 10
and default values for other parameters. Second, we ana-
lyzed genomic features in 200-bp windows extending
the candidate SNPs, using the UCSC Table Browser [54]
on human genome assembly ‘ Mar. 2006 (NCBI36/
hg18)’. We uploaded the boundaries of windows in the
browser extensible data (BED) format as custom tracks,
andusedtheintersectionfunctionality to count the
overlapping elements.
Additional material
Additional file 1: A tab-delimited table in which each row is a
hotspot-SNP pair in our original dataset, and columns are positions
of hotspots and SNPs, rs (reference SNP ID) number of SNPs and
LDsplit P-values and q-values.
Additional file 2: Source code for the LDsplit program and
simulation along with a user’s manual.
Additional file 3: Figures S1 to S4 and Tables S1 to S6.
Abbreviations
BGC: biased gene conversion; FDR: false discovery rate; LD: linkage
disequilibrium; MAF: minor allele frequency; PPV: positive predictive value;
SNP: single nucleotide polymorphism.
Acknowledgements
This work was supported by the Intramural Research Program of the
National Institutes of Health, National Library of Medicine and the National
Institute of Diabetes and Digestive and Kidney Diseases. This study utilized
the high-performance computational capabilities of the Biowulf PC/Linux
cluster [55] at the National Institutes of Health.
Author details
1
Computational Biology Branch, NCBI, NLM, National Institutes of Health,
8600 Rockville Pike, Bethesda, MD 20894, USA.
2
Genetics and Biochemistry
Branch, NIDDK, National Institutes of Health, 5 Memorial Drive, Bethesda,
Maryland 20892, USA.
Authors’ contributions
JZ, PPK, DRC, and TMP designed the study. JZ implemented all algorithms
and performed all computations with the exception of generating genome
scale permutation data, which was done by PPK. JZ, PPK, DRC, and TMP
analyzed the results. JZ and TMP wrote the paper with input from PPK and
DRC.
Received: 5 August 2010 Revised: 25 September 2010
Accepted: 20 October 2010 Published: 20 October 2010
References
1. Hassold T, Hunt P: To err (meiotically) is human: the genesis of human
aneuploidy. Nat Rev Genet 2001, 2:280-291.
2. Inoue K, Lupski JR: Molecular mechanisms for genomic disorders. Annu
Rev Genomics Hum Genet 2002, 3:199-242.
3. Crawford DC, Bhangale T, Li N, Hellenthal G, Rieder MJ, Nickerson DA,
Stephens M: Evidence for substantial fine-scale variation in
recombination rates across the human genome. Nat Genet 2004,
36:700-706.
4. McVean GA, Myers SR, Hunt S, Deloukas P, Bentley DR, Donnelly P: The
fine-scale structure of recombination rate variation in the human
genome. Science 2004, 304:581-584.
5. Gerton JL, DeRisi J, Shroff R, Lichten M, Brown PO, Petes TD: Inaugural
article: global mapping of meiotic recombination hotspots and
coldspots in the yeast Saccharomyces cerevisiae. Proc Natl Acad Sci USA
2000, 97:11383-11390.
6. Kauppi L, Jeffreys AJ, Keeney S: Where the crossovers are: recombination
distributions in mammals. Nat Rev Genet 2004, 5:413-424.
7. Mezard C: Meiotic recombination hotspots in plants. Biochem Soc Trans
2006, 34:531-534.
8. Hubert R, MacDonald M, Gusella J, Arnheim N: High resolution localization
of recombination hot spots using sperm typing. Nat Genet 1994,
7:420-424.
9. Kong A, Gudbjartsson DF, Sainz J, Jonsdottir GM, Gudjonsson SA,
Richardsson B, Sigurdardottir S, Barnard J, Hallbeck B, Masson G, Shlien A,
Palsson ST, Frigge ML, Thorgeirsson TE, Gulcher JR, Stefansson K: A high-
resolution recombination map of the human genome. Nat Genet 2002,
31:241-247.
10. Coop G, Wen X, Ober C, Pritchard JK, Przeworski M: High-resolution
mapping of crossovers reveals extensive variation in fine-scale
recombination patterns among humans. Science 2008, 319:1395-1398.
11. Kong A, Thorleifsson G, Stefansson H, Masson G, Helgason A,
Gudbjartsson DF, Jonsdottir GM, Gudjonsson SA, Sverrisson S, Thorlacius T,
Jonasdottir A, Hardarson GA, Palsson ST, Frigge ML, Gulcher JR,
Thorsteinsdottir U, Stefansson K: Sequence variants in the RNF212 gene
associate with genome-wide recombination rate. Science 2008,
319:1398-1401.
12. Myers S, Bottolo L, Freeman C, McVean G, Donnelly P: A fine-scale map of
recombination rates and hotspots across the human genome. Science
2005, 310:321-324.
13. Consortium IH: A haplotype map of the human genome. Nature 2005,
437:1299-1320.
14. Frazer KA, Ballinger DG, Cox DR, Hinds DA, Stuve LL, Gibbs RA, Belmont JW,
Boudreau A, Hardenbol P, Leal SM, Pasternak S, Wheeler DA, Willis TD, Yu F,
Yang H, Zeng C, Gao Y, Hu H, Hu W, Li C, Lin W, Liu S, Pan H, Tang X,
Wang J, Wang W, Yu J, Zhang B, Zhang Q, Zhao H, et al: A second
generation human haplotype map of over 3.1 million SNPs.
Nature 2007,
449:851-861.
15. Khil PP, Camerini-Otero RD: Genetic crossovers are predicted accurately
by the computed human recombination map. PLoS Genet 2010, 6:
e1000831.
16. Lynn A, Ashley T, Hassold T: Variation in human meiotic recombination.
Annu Rev Genomics Hum Genet 2004, 5:317-349.
17. Hellenthal G, Stephens M: Insights into recombination from population
genetic variation. Curr Opin Genet Dev 2006, 16:565-572.
18. Ptak SE, Roeder AD, Stephens M, Gilad Y, Paabo S, Przeworski M: Absence
of the TAP2 human recombination hotspot in chimpanzees. PLoS Biol
2004, 2:e155.
19. Ptak SE, Hinds DA, Koehler K, Nickel B, Patil N, Ballinger DG, Przeworski M,
Frazer KA, Paabo S: Fine-scale recombination patterns differ between
chimpanzees and humans. Nat Genet 2005, 37:429-434.
20. Winckler W, Myers SR, Richter DJ, Onofrio RC, McDonald GJ, Bontrop RE,
McVean GA, Gabriel SB, Reich D, Donnelly P, Altshuler D: Comparison of
fine-scale recombination rates in humans and chimpanzees. Science
2005, 308:107-111.
21. Evans DM, Cardon LR: A comparison of linkage disequilibrium patterns
and estimated population recombination rates across multiple
populations. Am J Hum Genet 2005, 76:681-687.
Zheng et al. Genome Biology 2010, 11:R103
/>Page 14 of 15
22. Conrad DF, Jakobsson M, Coop G, Wen X, Wall JD, Rosenberg NA,
Pritchard JK: A worldwide survey of haplotype variation and linkage
disequilibrium in the human genome. Nat Genet 2006, 38:1251-1260.
23. Cheung VG, Burdick JT, Hirschmann D, Morley M: Polymorphic variation in
human meiotic recombination. Am J Hum Genet 2007, 80:526-530.
24. Jeffreys AJ, Neumann R: Reciprocal crossover asymmetry and meiotic
drive in a human recombination hot spot. Nat Genet 2002, 31:267-271.
25. Coop G, Myers SR: Live hot, die young: transmission distortion in
recombination hotspots. PLoS Genet 2007, 3:e35.
26. Boulton A, Myers RS, Redfield RJ: The hotspot conversion paradox and the
evolution of meiotic recombination. Proc Natl Acad Sci USA 1997,
94:8058-8063.
27. Pineda-Krch M, Redfield RJ: Persistence and loss of meiotic recombination
hotspots. Genetics 2005, 169:2319-2333.
28. Calabrese P: A population genetics model with recombination hotspots
that are heterogeneous across the population. Proc Natl Acad Sci USA
2007, 104:4748-4752.
29. Peters AD: A combination of cis and trans control can solve the hotspot
conversion paradox. Genetics 2008, 178:1579-1593.
30. Baudat F, de Massy B: Cis- and trans-acting elements regulate the mouse
Psmb9 meiotic recombination hotspot. PLoS Genet 2007, 3:e100.
31. Shifman S, Bell JT, Copley RR, Taylor MS, Williams RW, Mott R, Flint J: A
high-resolution single nucleotide polymorphism genetic map of the
mouse genome. PLoS Biol 2006, 4:e395.
32. Myers S, Freeman C, Auton A, Donnelly P, McVean G: A common sequence
motif associated with recombination hot spots and genome instability
in humans. Nat Genet 2008, 40:1124-1129.
33. Nishant KT, Rao MR: Molecular features of meiotic recombination hot
spots. Bioessays 2006, 28:45-56.
34. Chowdhury R, Bois PR, Feingold E, Sherman SL, Cheung VG: Genetic
analysis of variation in human meiotic recombination. PLoS Genet 2009,
5:e1000648.
35. Jeffreys AJ, Neumann R: Factors influencing recombination frequency and
distribution in a human meiotic crossover hotspot. Hum Mol Genet 2005,
14:2277-2287.
36. Hayashi K, Yoshida K, Matsui Y: A histone H3 methyltransferase controls
epigenetic events required for meiotic prophase. Nature 2005,
438:374-378.
37. Myers S, Bowden R, Tumian A, Bontrop RE, Freeman C, MacFie TS,
McVean G, Donnelly P: Drive against hotspot motifs in primates
implicates the PRDM9 gene in meiotic recombination. Science 2010,
327:876-879.
38. Baudat F, Buard J, Grey C, Fledel-Alon A, Ober C, Przeworski M, Coop G, de
Massy B: PRDM9 is a major determinant of meiotic recombination
hotspots in humans and mice. Science 2010, 327:836-840.
39. Parvanov ED, Petkov PM, Paigen K: Prdm9 controls activation of
mammalian recombination hotspots. Science 2010, 327:835.
40. Berg IL, Neumann R, Lam K-WG, Sarbajna S, Odenthal-Hesse L, May CA,
Jeffreys AJ: PRDM9 variation strongly influences recombination hot-spot
activity and meiotic instability in humans. Nat Genet 2010, 42:859-863.
41. Hellenthal G, Pritchard JK, Stephens M: The effects of genotype-
dependent recombination, and transmission asymmetry, on linkage
disequilibrium. Genetics 2006, 172:2001-2005.
42. Jeffreys AJ, Neumann R, Panayi M, Myers S, Donnelly P: Human
recombination hot spots hidden in regions of strong marker association.
Nat Genet 2005, 37:601-606.
43. LD Split. [ />44. Voight BF, Kudaravalli S, Wen X, Pritchard JK: A map of recent positive
selection in the human genome. PLoS Biol 2006, 4:e72.
45. Neumann R, Jeffreys AJ: Polymorphism in the activity of human crossover
hotspots independent of local DNA sequence variation. Hum Mol Genet
2006, 15:1401-1411.
46. Carlson CS, Eberle MA, Rieder MJ, Yi Q, Kruglyak L, Nickerson DA: Selecting
a maximally informative set of single-nucleotide polymorphisms for
association analyses using linkage disequilibrium. Am J Hum Genet 2004,
74:106-120.
47. Benjamini Y, Hochberg Y: Controlling the false discovery rate: a practical
and powerful approach to multiple testing. J Roy Statist Soc Ser B 1995,
57:289-300.
48. Storey JD, Tibshirani R: Statistical significance for genomewide studies.
Proc Natl Acad Sci U S A 2003, 100:9440-9445.
49. Auton A, McVean G: Recombination rate estimation in the presence of
hotspots. Genome Res 2007, 17:1219-1227.
50. Peng B, Kimmel M: simuPOP: a forward-time population genetics
simulation environment. Bioinformatics 2005, 21:3686-3687.
51. Peng B, Amos CI, Kimmel M: Forward-time simulations of human
populations with complex diseases. PLoS Genet 2007, 3:e47.
52. Bailey TL, Elkan C: Fitting a mixture model by expectation maximization
to discover motifs in biopolymers. Proc Int Conf Intell Syst Mol Biol 1994,
2:28-36.
53. MEME server version 4.3.0. [ />meme.cgi].
54. Karolchik D, Hinrichs AS, Furey TS, Roskin KM, Sugnet CW, Haussler D,
Kent WJ: The UCSC Table Browser data retrieval tool. Nucleic Acids Res
2004, 32:D493-496.
55. Biowulf PC/Linux cluster. [].
doi:10.1186/gb-2010-11-10-r103
Cite this article as: Zheng et al.: Detecting sequence polymorphisms
associated with meiotic recombination hotspots in the human genome.
Genome Biology 2010 11:R103.
Submit your next manuscript to BioMed Central
and take full advantage of:
• Convenient online submission
• Thorough peer review
• No space constraints or color figure charges
• Immediate publication on acceptance
• Inclusion in PubMed, CAS, Scopus and Google Scholar
• Research which is freely available for redistribution
Submit your manuscript at
www.biomedcentral.com/submit
Zheng et al. Genome Biology 2010, 11:R103
/>Page 15 of 15