Báo cáo y học: "Structure and dynamics of the pan-genome of Streptococcus pneumoniae and closely related species" docx
Bạn đang xem bản rút gọn của tài liệu. Xem và tải ngay bản đầy đủ của tài liệu tại đây (1.31 MB, 19 trang )
Donati et al. Genome Biology 2010, 11:R107
/>
RESEARCH
Open Access
Structure and dynamics of the pan-genome
of Streptococcus pneumoniae and closely
related species
Claudio Donati1*, N Luisa Hiller2, Hervé Tettelin3, Alessandro Muzzi1, Nicholas J Croucher4, Samuel V Angiuoli3,
Marco Oggioni5, Julie C Dunning Hotopp3, Fen Z Hu2, David R Riley3, Antonello Covacci1, Tim J Mitchell6,
Stephen D Bentley4, Morgens Kilian7, Garth D Ehrlich2, Rino Rappuoli1, E Richard Moxon8, Vega Masignani1
Abstract
Background: Streptococcus pneumoniae is one of the most important causes of microbial diseases in humans. The
genomes of 44 diverse strains of S. pneumoniae were analyzed and compared with strains of non-pathogenic
streptococci of the Mitis group.
Results: Despite evidence of extensive recombination, the S. pneumoniae phylogenetic tree revealed six major
lineages. With the exception of serotype 1, the tree correlated poorly with capsular serotype, geographical site of
isolation and disease outcome. The distribution of dispensable genes - genes present in more than one strain but
not in all strains - was consistent with phylogeny, although horizontal gene transfer events attenuated this
correlation in the case of ancient lineages. Homologous recombination, involving short stretches of DNA, was the
dominant evolutionary process of the core genome of S. pneumoniae. Genetic exchange occurred both within and
across the borders of the species, and S. mitis was the main reservoir of genetic diversity of S. pneumoniae. The
pan-genome size of S. pneumoniae increased logarithmically with the number of strains and linearly with the
number of polymorphic sites of the sampled genomes, suggesting that acquired genes accumulate
proportionately to the age of clones. Most genes associated with pathogenicity were shared by all S. pneumoniae
strains, but were also present in S. mitis, S. oralis and S. infantis, indicating that these genes are not sufficient to
determine virulence.
Conclusions: Genetic exchange with related species sharing the same ecological niche is the main mechanism of
evolution of S. pneumoniae. The open pan-genome guarantees the species a quick and economical response to
diverse environments.
Background
Streptococcus pneumoniae is a major causative agent of
human diseases, which include chronic otitis media,
sinusitis, pneumonia, septicemia, and meningitis. While
other pathogenic streptococci can be easily identified
both phenotypically and through molecular phylogenetic
analysis, S. pneumoniae is very similar to commensal
species of the Mitis group, in particular Streptococcus
mitis, Streptococcus oralis and Streptococcus infantis [1].
* Correspondence:
1
Novartis Vaccines and Diagnostics, Via Fiorentina 1, 53100 Siena, Italy
Full list of author information is available at the end of the article
Most strains of these species can take up DNA from the
environment and recombine sequences into their chromosome [2], resulting in both substitution of DNA fragments
by homologous sequences from other clones and acquisition of novel genes from donor organisms, a process
termed horizontal gene transfer (HGT). Due to the
dynamic effects on genome content and organization
resulting from HGT, it has been argued that the evolution
of individual strains is substantially shaped by recombination-dependent novel acquisitions of DNA, commensurate
with the genetic diversity of the species. The repertoire of
genetic sequences of named species, such as S. pneumoniae, has been termed the pan-genome [3,4]. The maintenance of these HGT systems is particularly striking when
© 2010 Donati et al.; licensee BioMed Central Ltd. This is an open access article distributed under the terms of the Creative Commons
Attribution License ( which permits unrestricted use, distribution, and reproduction in
any medium, provided the original work is properly cited
Donati et al. Genome Biology 2010, 11:R107
/>
viewed from a genomic perspective. Commensal and
pathogenic bacteria that are exclusively adapted to a
restricted range of hosts maintain relatively small genome
sizes, in the range of 1.5 to 3 megabases, when compared
to free-living environmental species. The reduction in genome size, reflecting evolutionary constraints on the retention and build up of nonessential genes, occurs despite the
conservation of multiple operons that support HGT. It has
been proposed that the ability of some bacterial commensal pathogens to generate diversity through HGT provides
a selective advantage to these microbes in their adaptation
to host econiches and evasion of immune responses [5,6].
Isolates of S. pneumoniae are traditionally characterized in terms of the chemical composition of their polysaccharide capsules, of which there are more than 90
serotypes. Different serotypes display different pathogenic
potential and geographic distribution [7,8]. However,
genomic variability among strains of S. pneumoniae is
more accurately inferred from a comparison of allelic
profiles of housekeeping genes [9], multi-locus sequence
typing (MLST) [10], than by capsular serotyping [2,4].
This assertion has been strengthened by analyzing the
distributions of the pilus-encoding rlrA and PI-2 islets in
large collections of strains [11,12]. Although frequent
recombination violates the paradigm of strict clonal
inheritance, recently evolved clones maintain a high level
of genomic similarity. This raises the question as to the
extent of the distribution of dispensable genes, how these
might be understood in terms of a clonal population
structure and which genes, or classes of genes, violate
this structure.
Most of these aspects of molecular evolution, traditionally addressed by population genetics methods, can be
more advantageously studied by comparing whole genome sequences [3,13,14]. There are several complete genome sequences of individual strains of S. pneumoniae
[15-20] and a comparative analysis of 17 complete and
draft sequences predicted that the complement of genes
that can be found in the genome of S. pneumoniae comprises more than 5,000 families of orthologs [4]. Here we
report the genomic variability in 44 strains (24 newly
sequenced and 20 already present in public databases) of
S. pneumoniae in comparison with four newly sequenced
genomes of S. mitis and one newly sequenced genome
each of S. oralis and S. infantis. This genome scale study
uses the most complete sampling of the diversity of the
S. pneumoniae species to date, including the first analysis
of multiple strains of the same serotype or MLST clonal
complex (CC), to investigate the evolutionary processes
that lead to the divergence of S. pneumoniae from other
related commensal species.
Our analysis is divided in two parts. In the first section, we present data on the genomic variability of
Page 2 of 19
S. pneumoniae in the context of previous studies on the
population structure of this species. In the second section we focus on genome dynamics, extending the analysis to the non-pathogenic streptococcal strains, and
discuss possible evolutionary implications.
Results and Discussion
Genomic variability of S. pneumoniae
An average of 74% of any individual genome is shared by
all strains
We aligned the genome sequences of 44 S. pneumoniae
strains, 14 complete and 30 draft (Additional file 1). The
collection spanned 19 different serotypes, 24 MLST
CCs, as defined by the eBURST algorithm [21], and a
set of laboratory (n = 1), disease-associated (n = 37) and
carriage-associated (n = 6) strains isolated in different
geographic locations. The sampled CCs accounted for
53% (1,715 0f 3,222) of the known sequence types (STs)
as of March 2009 if singletons are excluded (that is, STs
that are not part of any CC), or 42% (1,715 of 4,098) if
singletons are included.
Excluding gap-containing aligned areas, the cumulative
length of the alignment shared by all strains, the core
genome, was 1,536,569 bp. Given an average genome
length of 2,088,534 bp, on average 74% of each sequence
is conserved by all strains. This core genome alignment
had 79,171 polymorphic sites, of which 50,924 were
informative, that is, the substitution was common to at
least two sequences.
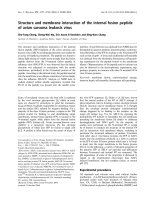
Based on the polymorphic sites, we computed a maximum likelihood phylogenetic tree that was rooted using
the S. mitis genomes as outgroup (Figure 1). This phylogeny had high bootstrap values in both the inner and
outer branches. Strains of the same ST or CC were monophyletic. In addition, six major monophyletic lineages (I to
VI in Figure 1) that included closely related STs or CCs
were identified. While details on the mutual relationships
between the lineages varied depending on the tree reconstruction method tested, the lineages themselves were supported with high confidence from alternative analyses
(Additional files 2 and 3). Since CCs always formed monophyletic branches in the genome-based tree and given the
coverage of our strain collection and of the MLST database, we estimate that about half of the circulating strains
of S. pneumoniae fall into one of the six lineages.
To quantify the correlation between phylogeny and
genome composition, we measured the average association value V [22] (see Materials and methods) of lineages
I to VI and the CCs with the presence/absence of dispensable genes (that is, genes present in more than one
strain but not in all strains; Additional file 4). Values of
V = 0.5 for lineages and V = 0.82 for CCs were obtained.
An even stronger association was found between the
Donati et al. Genome Biology 2010, 11:R107
/>
Page 3 of 19
Figure 1 Maximum likelihood phylogenetic tree obtained using the SNPs of the core genome of the 44 S. pneumoniae genomes. The
tree has been rooted using the four S. mitis genomes as outgroup, but note that the branch connecting the S. pneumoniae clade to the S. mitis
clade is not to scale. The branches are annotated with their bootstrap support (numbers in italics). Red bars indicate strains belonging to the
same sequence type (ST), while blue bars indicate strains belonging to the same clonal complex (CC). The six major lineages are identified by
roman numbers I to VI.
allelic form of core genes and the classification into
lineages I to VI and CCs (V = 0.747 and V = 0.94,
respectively).
In general, the position on the tree (Figure 1) did
not reveal patterns predictive of whether strains were
associated with carriage or disease, nor their geographical site of isolation. In particular, the eight strains
isolated at a single institution in a short time window
[4] were distributed randomly across the tree, supporting a model of global circulation of pneumococcal
strains.
Frequent recombination distorts but does not obliterate
phylogenetic signals of descent from a common ancestor
Most S. pneumoniae strains and other related species are
naturally competent, that is, they can take up genetic
material from the environment and recombine it into
their chromosome [2,13,23], weakening the phylogenetic
signal contained in sequence alignments. To determine
the effect of homologous recombination on the phylogeny, we used split networks [24] to visualize the contrasting phylogenetic signals (Figure 2). The main groups
highlighted in Figure 1 are confirmed by the network
Donati et al. Genome Biology 2010, 11:R107
/>
Page 4 of 19
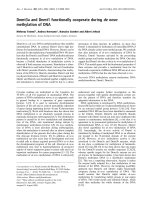
Figure 2 Split network obtained using the SNPs of the core genome to depict the impact of recombination on 44 S. pneumoniae
strains. In this representation, all the conflicting phylogenetic signals due to each SNP are represented as alternative bipartitions that account
for the non-tree-like structure of the inner part of the network. The six lineages highlighted in Figure 1 are also indicated.
analysis. Lineage V is split into two subgroups, one composed of the serotype 1 strains, and the other composed
of the two serotype 6B CC90 strains (670-6B and SP18),
which appear to be more similar to Taiwan19F-14. The
role of recombination was evident from the non tree-like
structure of the inner connections between the different
lineages, the presumed consequence of DNA exchange
amongst unrelated strains. However, the long branches
separating groups of strains closely related to the lineages
(I to VI) of Figure 1 support the idea that, while the inner
structure of the inferred genealogy of S. pneumoniae is
heavily influenced by recombination, molecular phylogenetic methods based on whole genomes are able to correctly reconstruct recent genealogical relationships.
Frequent recombination disrupts associations between
capsular serotypes and clonal complexes, except for
serotype 1
Poor correlation was observed between the serotype of a
strain and its position in the tree. The notable exceptions
were strains of serotypes 1 and 3, which formed two
monophyletic branches. However, while all serotype 3
strains (except SpnA45) were of a single ST (ST180), serotype 1 strains constituted three major lineages belonging to a single cluster with significant bootstrap support.
These lineages represent the three CCs (CC217, CC306
and CC2296) of circulating serotype 1 strains that are
associated with distinct geographical areas [25]. The
robustness of our sampling of serotype 1 was supported
Donati et al. Genome Biology 2010, 11:R107
/>
by an analysis of the MLST database (see Materials and
methods). The three CCs present in our dataset
accounted for 87% of all serotype 1 strains, and five CCs
made up 97%, a situation very different from other serotypes that were much more heterogeneous in terms of
genotype composition. For comparison, 97% coverage
required 12 CCs for serotype 3, 14 CCs for serotype 14,
and 27 CCs for serotype 19F.
We tested the hypothesis that genetic exchange in serotype 1 strains is restricted by estimating the fraction of
680 core genes that displayed evidence of recombination
(see Materials and methods) in the serotype 1 strains.
We found evidence of recombination in 205 of 680 loci,
suggesting that the correlation between capsular serotype and position on the tree cannot be attributed only
to the low probability of exchange of genetic material
with strains of different serotypes.
The pan-genome of S. pneumoniae
Sequence variability can be described from static and
dynamic points of view. While a description of the
dynamics requires a realistic model of the relevant evolutionary processes, here we report a static description
that provides a synthetic representation of the genome
variability of the species in terms of a few parameters.
We calculated the size of the total S. pneumoniae gene
pool accessible to the species, or pan-genome, using two
different methodologies, namely the finite supragenome
model [26] and the power law regression model [3,27].
The finite supragenome model allows prediction of
the number of genes present in a given fraction of the
circulating strains, varying from rare genes (less then 3%
of the strains) to core genes (all the strains). Based on
the 44 sequenced strains, giving a total of 3,221 clusters
(Table 1), the number of core, dispensable and total
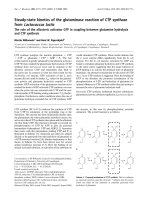
genes that would be expected for a 100-strain comparison was estimated. The model predicted a strong
decline in the number of new genes identified (1 per
genome at 100 strains) (Figure 3a) and stabilization in
the number of core genes at 1,647 (Figure 3b). The
supragenome model predicted that 48% of the genes are
core and approximately 27% are rare, that is, present in
less than 3% of the strains. Given that, by construction,
this model predicts a finite number of genes in the species, the maximum likelihood size of the pan-genome
was estimated to be 3,473 genes (range 3,300 to 5,000;
see Materials and methods). Thus, we estimate that the
44 strains taken together encompass 92.7% (3,221 of
3,473) of the pneumococcal pan-genome.
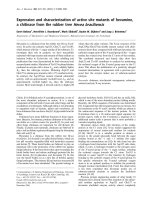
In contrast to the supragenome model, the power law
regression model [3] (Figure 4) allowed the extrapolation to an infinite number of strains, providing a prediction of whether the number of distinct genes that can
be found in S. pneumoniae is finite (closed pan-genome)
or unlimited (open pan-genome). A comparison of the
Page 5 of 19
data from Figures 3 and 4 showed that, for an intermediate number of genomes (<40) the predictions of
the two models were consistent. For large numbers of
genomes (>40), the finite supragenome model sharply
goes to zero, while in the regression model the average
number of new genes as a function of the number of
genomes is well described by a power law, with a fitted
exponent ξ = -1.0 ± 0.15 (Figure 4). Thus, the pan-genome is open, its size increasing logarithmically, findings
that position the pneumococcal species on the edge
between an open (ξ >-1) and closed (ξ <-1) pan-genome
(see Materials and methods).
To investigate how the size of the pan-genome is
related to the genetic diversity within the sample of
strains, and to estimate how the rate of acquisition of
new genes compares to the mutation rate, the pan-genome size was plotted versus the number of polymorphic
sites for samples of different sizes (Figure 5; see Materials and methods). The results show a linear correlation
between these two quantities. This result can be
explained if we assume that new genes and mutations
are acquired by pneumococci with constant rates (ω and
θ, respectively) over time. While these parameters cannot be estimated separately from the data, from the
slope of a linear fit of the two quantities plotted one
versus the other (Figure 5), the ratio ω/θ between the
rate of acquisition of new genes and the population
mutation rate can be estimated: ω/θ = 0.017 ± 0.002.
This result indicates that, on average, a new gene is
acquired by the population every 59 mutations.
Genome dynamics and evolution
Dispensable sequences are recent acquisition events, and
are frequently transferred among strains
To investigate how the dispensable genome is distributed in
the pneumococcal population, the frequency distribution of
the genome segments that were absent from at least one
strain was studied. To avoid bias and give equal weight to all
acquisition and loss events, we selected the 1,030 genomic
regions longer than 500 bp that were not present in all
strains, irrespective of the number of genes that they encoded
(see Materials and methods). Figure 6 depicts a histogram
counting the number of strains sharing a particular region.
The distribution is bi-modal, since the variable regions were
present either in most of the 44 strains, likely representing a
recent deletion, or in a small proportion of strains (less than
10), probably including recent acquisition events.
To gain insight into the dynamics of the dispensable
genome, the most parsimonious pattern of acquisitions
and losses compatible with the tree in Figure 1 was
reconstructed for each variable region. In Figure 7 we
show a histogram counting the number of segments
that have undergone a given number of acquisition or
loss events during the evolution of the species. The
Donati et al. Genome Biology 2010, 11:R107
/>
Page 6 of 19
Table 1 Number of clusters of orthologous genes
S. pneumoniae
Number of genes
S. pneumoniae , S. mitis, S. oralis, S. infantis
S. pneumoniae , S. mitis, S. oralis, S. infantis,
S. Sanguinis, S. pyogenes
3,221
7,031
1,111 (23%)
3,793 (77%)
522 (7%)
6,509 (93%)
389 (12%)
Strain-specific
4,904
1,666 (52%)
1,555 (48%)
Core
Dispensable
1,565 (32%)
3,552 (51%)
We report the total number of clusters of orthologous genes and the number of core, dispensable (that is, missing in at least one strain), and strain-specific
genes for S. pneumoniae alone, for S. pneumoniae, S. mitis, S. oralis, and S. infantis, and for S. pneumoniae, S. mitis, S. oralis, S. infantis, S. sanguinis and S. pyogenes.
columns are partitioned by the number of acquisitions.
Of the 1,030 selected regions, 109 segments were present in the ancestral genome and were subsequently lost
by some strains (red bars in Figure 7); 321 segments
were acquired once (orange bars in Figure 7); while the
remaining 600 segments have undergone repeated
N. of new genes
Linkage disequilibrium patterns demonstrate that
recombination proceeds through gene conversion
a
1000
100
10
1
1
2
4
6 8
2
10
4
6 8
100
N. of genomes
b
N. of core genes
2000
1900
1800
1700
20
40
60
80
acquisitions, suggesting that they encode highly mobile
elements (yellow bars in Figure 7).
On the basis of these data, the presence or absence of
dispensable regions can be used to discriminate only
recently diverging groups of strains, whereas they give a
much weaker signal for older differentiation events, indicating that the dispensable genome composition cannot
resolve the inner structure of the phylogenetic tree of
the species (Additional file 5).
100
N. of genomes
Figure 3 The S. pneumoniae pan-genome according to the
finite supragenome model. (a) Number of new genes as a
function of the number of sequenced genomes. The predicted
number of new genes drops sharply to zero when the number of
genomes exceeds 50. (b) Number of core genes as a function of
the number of sequenced genomes. The number of core genes
converges to 1,647 for number of genomes n®∞.
Despite the presence of widespread recombination, the
persistence of a detectable phylogenetic signal in whole
genome alignments indicates that recombination, although
frequent, did not completely obscure the non-random
association of polymorphisms at distant loci. To further
investigate this phenomenon, the correlation between
polymorphisms at different loci, or linkage disequilibrium
(LD), was characterized by measuring the Lewontin’s D’
parameter [28] as a function of the distance along the
chromosome (Figure 8). D’ quickly converged to a plateau,
as expected under a gene conversion model, where
exchange of DNA sequences occurs through the substitution of short stretches of DNA with homologous DNA
from a different cell. An exponential fit to the data (green
line in Figure 8) revealed a decay length x0 = 896 ± 7 bp,
and a plateau value A = 0.7103 ± 0.002. These results do
not change appreciably if closely related strains are
excluded from the analysis by retaining only one representative strain for each ST.
The value of the characteristic length of the recombining
segments, close to the average length of genes (855 bp in
the sequenced strains), is probably the result of a bias
towards events in which entire genes are exchanged, and
is similar to the estimates previously obtained in a different species [29]. The relatively high value of the D’ plateau
indicates that recombination, although frequent, did not
completely obscure the non-random association of distant
alleles, implying that long sequences contain a coherent
phylogenetic signal even in the presence of recombination,
as recently found by simulations [14].
To quantify the relative contribution of mutation and
recombination to sequence variability, for each of the
locally collinear blocks (LCBs) of the core alignment we
Donati et al. Genome Biology 2010, 11:R107
/>
Figure 4 The S. pneumoniae pan-genome according to the
power law model. The number of specific genes is plotted as a
function of the number (n) of strains sequentially added (see
Materials and methods). For each n, points are the values obtained
for the different strain combinations; red symbols are the average of
these values, and error bars represent standard deviations. The
superimposed line is a fit with a decaying power law y = A/nB. The
fit parameters are A = 295 ± 117 and B = 1.0 ± 0.15.
have computed the per-site Watterson mutation rate θ
and per-site recombination rate r, which is the per-site
probability of a recombination breakpoint, using LDhat
[30]. There was a considerable spread in the values of
both θ and r for the different regions of the alignment.
θ ranged between 7.06 × 10⁻⁵ and 0.019, with an average
of 0.0032, while r ranged between 9.3 × 10⁻⁵ and 0.98,
Page 7 of 19
Figure 6 Histogram of the number of genomes sharing
variable regions of size greater than 500 bp. The distribution is
bimodal, with most of the variable regions either being present in
most of the strains, or being present only in a small number of
strains.
with an average of 0.018. The average value of the ratio
r/θ between the recombination rate r and the mutation
rate θ was equal to 5.57. We estimated the relative
impact of recombination and mutation in generating the
sequence diversity of S. pneumoniae by computing the
rate θr at which a mutation is introduced by a recombination event and the ratio θr/θ, where θ is the mutation
rate. θr was estimated using the formula θr = θ·r·l, where
l is the average length of the recombining segments, and
θ and r are the mutation and recombination rates,
respectively. Considering l = 896 bp, as determined from
the linkage disequilibrium decay length (Figure 8), we
estimated that the rate θr was θr = θ·r·l = 0.052, and the
average value of the ratio θ r /θ was θ r /θ = 16.2, to be
compared with the previous estimate of θ r /θ = 50
obtained for housekeeping genes [31].
S. pneumoniae is closely related to S. mitis
Figure 5 Size of the pan-genome versus the number of
polymorphic sites. The slope of the fitted line gives the ratio
between the rate of acquisition of new genes and the population
mutation rate ω/θ = 0.017 ± 0.0017. In the inset, the size of the
pan-genome (red dots) and number of polymorphic sites (black
dots) as a function of the number of genomes are shown. The lines
are least squares fit with a logarithmic law. The error bars represent
the standard deviation of the data.
To gain insight into the differences underlying closely
related pathogenic and non-pathogenic streptococcal
species, the comparative analysis performed on the 44
genomes of S. pneumoniae was extended to include four
S. mitis, one S. oralis and one S. infantis strains (Additional file 1).
The whole genome alignment of the 50 strains was
computed. Excluding gaps, 998,057 bp of each sequence
can be aligned against all other sequences, representing,
on average, 48% of the pneumococcal genomes, 51% of
the S. mitis genomes (average genome length of
1,949,224 bp), and 53% and 55% of the S. oralis and
S. infantis genomes, respectively. Of these, 283,596 positions were polymorphic. A phylogenetic tree based on
these polymorphic sites (Figure 9, where the S. pneumoniae branch is collapsed for readability) revealed that
Donati et al. Genome Biology 2010, 11:R107
/>
Page 8 of 19
value calculated among S. mitis strains was much larger
(0.066 ± 0.007), and only slightly smaller than that
between strains of S. mitis and S. pneumoniae (0.081 ±
0.010), confirming the high variability of the S. mitis
species [1] and suggesting that S. pneumoniae is a
pathogenic and epidemiologically successful clone of a
larger distinct and coherent population that includes the
numerous S. mitis lineages.
The core and pan-genome analysis of the S. pneumoniaeS. mitis complex supports the close relationship between
the two species
Figure 7 Histogram of the parsimony score Sp of the presence/
absence of the variable regions of size greater than 500 bp,
computed for the tree shown in Figure 1. For a given dispensable
region, Sp represents the number of acquisition and loss events (Sp =
Na + Nl, where Na and Nl are the number of acquisitions and losses,
respectively) required for its pattern of presence/absence on the tree
in Figure 1. The colors indicate the number of acquisitions Na, while
the number of losses can be calculated as Nl = Sp -Na. For simplicity, all
segments with Na > 1 have been collapsed in a single bar. Since an
acquisition followed by a recombination event can always be
explained by multiple acquisitions, events with Na > 1 are possible
intra-species recombination events.
the most divergent species from S. pneumoniae is
S. infantis, followed by S. oralis, while the S. mitis
strains are the most closely related to S. pneumoniae.
Interestingly, while the average genetic distance among
the S. pneumoniae strains was 0.010 ± 0.001, the same
To characterize the differences in the genomic composition between the different species, we computed the set
of cluster of ortholog genes shared by all S. pneumoniae
isolates and by S. pneumoniae, S. mitis, S. infantis, and
S. oralis (Table 1). In total, these four species contained
4,904 clusters of orthologs, of which 1,111 are present in
all strains. We investigated how the size of the pan- and
core genome is influenced by the addition of strains
belonging to closely related species (Figure 10). The addition of the first S. mitis strain contributed approximately
200 new genes to the pneumococcal pan-genome. As an
additional three strains were added, each introduced
approximately 200 new genes, providing further evidence
for the high variability of the dispensable part of the genome of S. mitis.
On the other hand, as might be expected for the addition of a different species, the first S. mitis strain caused
a drop in the core genome from approximately 51% to
approximately 39% of the total clusters, showing that
some of the essential pneumococcal genes are not core
in S. mitis. Yet, additional S. mitis strains had a minimal
effect on the core genome, reflecting stabilization in the
number of core genes shared between these species. The
effect of the S. mitis strains on the streptococcus pangenome calculation stood in stark contrast to the effect
of S. pyogenes and/or S. sanguinis strains, since addition
of any of these added over 1,000 new genes and caused
a sharp drop in the core genome to less then 14% of the
total genes. The difference in magnitude between the
increase in variability observed from the inclusion of
S. mitis strains relative to that observed with S. sanguinis or S. pyogenes strains highlights the close relationship between S. pneumoniae and S. mitis.
S. mitis evolved by genome reduction from its common
ancestor with S. pneumoniae
Figure 8 Average value of D’ plotted as a function of the
distance (in base pairs) along the chromosome between the
pairs of polymorphic sites. The green line is a least-square fit with
the exponential function y = A + Be-x/x0, with A = 0.07103 ± 0.0002,
B = 0.201 ± 0.001 and x0 = 896 ± 7.
To gain insight into the speciation of the S. pneumoniaeS. mitis complex, we inferred the genomic content of the
common ancestors of S. pneumoniae (node 1 in Figure 9),
S. mitis (node 2 in Figure 9) and of the S. pneumoniae-S.
mitis complex (node 3 in Figure 9) using maximum likelihood. According to this reconstruction, the ancestral genome of all S. pneumoniae strains was composed of 2,281
genes, while the ancestral genome of S. mitis was
Donati et al. Genome Biology 2010, 11:R107
/>
Page 9 of 19
S. oralis SK23
Number of core genes
S. mitis SK597
3
S. mitis SK564
1 S. pneumoniae
S. infantis
0.1
Figure 9 Maximum likelihood phylogenetic tree obtained
using the SNPs of the core genome of the 44 strains of S.
pneumoniae, 4 strains of S. mitis and 1 strain each of S. oralis
and S. infantis. For clarity the clade containing the S. pneumoniae
strains has been collapsed. The numbers on the internal nodes label
the last common ancestor of the S. pneumoniae species (1), of the
S. mitis species (2), and of the S. pneumoniae-S. mitis complex (3).
composed of 1,888 genes, and the genome of the common ancestor of S. pneumoniae and S. mitis encoded
2,039 genes. For comparison, the average number of
genes of S. pneumoniae is 2,104, and the average number
of genes in S. mitis is 1,900. Although probably biased by
the different number of sequenced S. mitis and S. pneumoniae strains, these results indicate that while the size
of the S. mitis genomes has reduced since their diversification from S. pneumoniae, the ancestral S. pneumoniae
genome has grown since its diversification from S. mitis
while contemporary S. pneumoniae strains are now in a
process of genome reduction. Interestingly, S. pneumoniae strains were more closely related to the ancestor of
S. mitis (node 2 in Figure 10) than to the contemporary
sequenced S. mitis strains themselves. Indeed, while contemporary S. pneumoniae strains shared between 71%
(Hungary19A_16) and 67% (CDC0288) of their genome
with the reconstructed ancestral S. mitis genome (node 2
in Figure 9), contemporary S. mitis strains conserved
only between 67% and 64% of the genome of their common ancestor. These observations support the recently
proposed theory that S. mitis evolved by genome reduction from a bacterium closely related to S. pneumoniae
[1].
S. mitis and other streptococci are the main reservoir of
genetic variability for S. pnemoniae
S. pneumoniae and S. mitis are known to colonize the
same ecological niche and to actively exchange genetic
material [32]. It is therefore interesting to quantify the
degree by which homologous recombination and HGT
between these two species contributed to the evolution
of their core and dispensable genomes.
N. of genes
2
S. mitis NCTC12261
II III
Total number of genes
8000
S. mitis SK321
I
I S. mitis
II S. oralis and S. infantis
6000
III S. sanguinis and S. pyogenes
4000
2000
0
0
10
20
30
40
N. of genomes
50
Figure 10 Variation of the number of dispensable and core
genes upon the addition of new species or strains. Strains are
added sequentially, starting with the 44 S. pneumoniae strains
followed by the S. mitis (region I), S. oralis and S. infantis (region II),
S sanguinis and S. pyogenes (region III) strains.
To estimate the fraction of the genome shared by
S. pneumoniae and S. mitis that has been exchanged by
homologous recombination, we have computed the number of bi-allelic SNPs in the multiple alignment of the 50
genomes that are polymorphic both in S. pneumoniae
and in S. mitis. We found that of the 49,670 SNPs in
S. pneumoniae (107,602 in S. mitis), 14,655 were bi-allelic
also in S. mitis. Although the directionality of the
exchange events cannot be established, these data suggest
that as much as 30% of the sequence variability in the
part of the genome of S. pneumoniae shared with S. mitis
could be due to homologous recombination with the latter. This fraction is likely to be an underestimate, due to
the small number of sequenced S. mitis strains.
In order to identify the most likely origin of genes
recently acquired by S. pneumoniae and to estimate the
contribution of HGT between S. pneumoniae and S. mitis
to the evolution of the dispensable genome of the former,
all dispensable genes present in less than 50% of the
S. pneumoniae strains were searched against a database
of 792 complete bacterial genomes, supplemented by the
newly sequenced S. mitis, S. oralis and S. infantis. The
choice to restrict the analysis to genes present in a minority of the sequenced strains is aimed at minimizing the
probability that these genes were present in the ancestor
of S. pneumoniae and lost by some lineages, although
this possibility cannot be ruled out. To select only recent
acquisitions, hits with >90% identity over >90% of the
sequence of the query gene were considered. Of 1,286
Donati et al. Genome Biology 2010, 11:R107
/>
genes, only 16% (200) had a hit satisfying the cutoff. The
vast majority of these (183 of 200) shared the highest
homology with other streptococci. In particular, 62%
(113) of the hits are in at least one of the S. mitis strains,
followed by 31 hits in Streptococcus suis, 24 in Streptococcus pyogenes, 5 in Streptococcus agalactiae and S. oralis, 4
in S. infantis and 1 in Streptococcus gordonii. Hits outside
the Streptococcus genus are: 7 in Finegoldia magna, 3 in
Staphylococcus aureus, 2 in Staphylococcus epidermidis,
2 in Macrococcus caseolyticus, and 1 in each of Clostridium difficile, Enterococcus fecalis, and Lacobacillus reuteri. These data demonstrate that although most genes
acquired by S. pneumoniae come from an unknown
source, most of the genes with hits to the 792 complete
bacterial genomes appear in other streptococci, and in
particular in S. mitis, although HGT between distant species is also occasionally possible. Given the high variability of the S. mitis species, it is possible that many of the
remaining 1,086 genes of unknown origin were acquired
from S. mitis strains not yet sequenced, or more generally, from other still unknown bacterial species.
Strain distribution of genes involved in host-pathogen
interaction and virulence
To elucidate the relationship between virulence potential
and the evolution of S. pneumoniae, we have determined
the distribution and conservation level of a set of 47
proteins that are either surface exposed, or known to be
involved in interaction with the host and virulence [15].
The panel of selected proteins includes the entire set of
LPXTG cell wall anchored molecules, and the choline
binding proteins, a family of surface proteins that are
specific to pneumococci and that are involved in bacterium-host cell adhesion [33]. Furthermore, we have
added pneumolysin (Ply), a cholesterol-dependent cytotoxin implicated in multiple steps of pneumococcal
pathogenesis [34,35], and a number of proteins that
have been investigated as potential vaccine candidates
[36], including the histidine triad proteins PhtA, B, D, E
[37], PpmA [38], PsaA [39], PppA [40], and PcsB and
StkP [41]. The distribution and level of conservation of
each of these proteins within pneumococcal strains and
the presence in S. mitis, S. oralis and S. infantis are
reported in Table 2 and Additional file 6.
Out of 47 selected proteins, 31 are part of the core
genome of S. pneumoniae (since our dataset includes
several draft genomes, we consider proteins present in
43 of 44 genomes to be conserved in all strains). Of
these, 27 have an average percentage of identity greater
than 90%, while the remaining are the well-known
hypervariable proteins PspA, PspC, ZmpB and the IgA1
protease, four of the most important virulence factors
expressed by S. pneumoniae [42-46].
According to sequence conservation, PspA is subdivided
into three families, which in turn are classified into different
Page 10 of 19
clades: family 1 is composed of two clades (clade 1 and 2),
family 2 comprises three clades (clades 3, 4 and 5), and
family 3 has only one divergent clade (clade 6) [42]. Similarly, PspC has been classified in 11 major variants, based
on sequence similarity and gene organization [47]. To verify
whether the allelic profile of antigens correlates with pneumococcal phylogeny, we have mapped the allelic variants of
PspA and PspC onto the tree of the species (Figure 11). As
is generally found for most core genes, an overall strong
association between allelic variants and MLST was
observed, in agreement with recent data on PspA [48].
However, we found instances where a single ST or CC corresponds to more than one allelic variant (for example, the
two antigens exist in two different variants within ST180
strains; similarly PspA,C in CC15, PspC in CC156, PspC in
CC90), and little correlation was found with the lineages I
to VI.
The remaining 16 proteins, including the structural
components of the pneumococcal pili PI-1 (RrgA, RrgB
and RrgC) and PI-2 (PitA and PitB), the serine-rich repeat
protein PsrP [49], the putative neuraminidase NanC, five
members of the choline binding proteins family (CbpC, I,
J, F, and PcpA), the histidine triad proteins PhtA, D, E and
the zinc metalloprotease ZmpC, were present in a variable
number of strains (from 6 to 39).
The poor correlation between phylogeny and protein
presence (Figure 11; Additional file 4) suggested that
genes encoding proteins with antigenic properties might
be acquired and lost easily. A good level of association was
noted for PI-1 and PI-2 components, as previously
reported [11,12], and for PsrP. According to a parsimonious reconstruction, the PI-1 islet appears to be present
in the root of the S. pneumoniae tree, and to have been
repeatedly lost during the course of evolution.
The patchy distribution of most of the surface-exposed
proteins with antigenic properties is probably due to the
selection exerted by the immune system, which selects for
strains able to vary their repertoire of virulence-related
genes. In the case of PI-1, evidence of selection driven by
host immune response has recently been shown [50].
Furthermore, 34, 24 and 20 of the 47 putative virulence
factors were also present in S. mitis, S. oralis and S. infantis, respectively, further supporting the concept that these
commensals act as main gene reservoirs for S. pneumoniae.
A closer look at the differences between S. pneumoniae
and S. mitis revealed that some of the putative virulence
factors that are always present and extremely conserved in
S. pneumoniae are absent from all S. mitis strains. This
group includes the hyalorunidase HysA, in agreement with
the finding that S. mitis does not have hyaluronidase activity [1], StrH, which is involved in early colonization of the
nasopharynx [51] and resistance to phagocytic killing [52],
the choline binding protein G CbpG, and the two cell wall
anchor proteins SP_0368 and SP_1992. Although the
TIGR ID
R6 Id
INV104B
Length Annotation
Predicted cell
localization
Presence in
Spn strains
Conservation
(average % ID)
Present in
S. mitisa
Present in
S. oralis
Present in
S. infantis
1,035
Neuraminidase A (NanA)
LPXTG cell-wall
anchored
44
92.59
Yes
Yes
Yes
SP_0057
spr0057
1,312
Beta-N-acetylhexosaminidase (StrH)
LPXTG cell-wall
anchored
44
97.59
No
Yes
Yes
SP_0069
Absent
211
Choline binding protein I (CbpI)
Choline binding,
surface
6
85.73
Yes
No
No
SP_0071
Absent
1,856
Zinc metalloprotease ZmpC
LPXTG cell-wall
anchored
6
89.79
Yes
No
No
SP_0082
spr0075
857
Cell wall surface anchor family protein
LPXTG cell-wall
anchored
44
91.92
Yes
Yes
Yes
SP_0117
spr0097
744
Pneumococcal surface protein A (PspA)
Choline binding,
surface
44
81.35
No
No
No
SP_0268
spr0247
1,280
Alkaline amylopullulanase, putative
LPXTG cell-wall
anchored
44
97.53
Yes
Yes
No
SP_0314
spr0286
1,066
Hyaluronidase (HysA)
LPXTG cell-wall
anchored
44
99.38
No
No
No
SP_0368
spr0328
1,767
Cell wall surface anchor family protein
44
96.96
No
Yes
Yes
SP_0377
spr0337
340
Choline binding protein C (CbpC)
31
93.86
Yes
Yes
No
SP_0378
Absent
332
Choline binding protein J (CbpJ)
36
88.97
Yes
Yes
Yes
SP_0390
spr0349
285
Choline binding protein G (CbpG)
44
95.21
No
No
No
SP_0391
spr0350
340
Choline binding protein F (CbpF)
LPXTG cell-wall
anchored
Choline binding,
surface
Choline binding,
surface
Choline binding,
surface
Choline binding,
surface
16
90.33
Yes
Yes
Yes
SP_0462
Absent
893
RrgA pilus subunit, adhesin
LPXTG cell-wall
anchored
8
91.66
No
No
No
SP_0463
Absent
665
RrgB pilus subunit, backbone
LPXTG cell-wall
anchored
8
66.5
No
No
No
SP_0464
Absent
393
RrgC pilus subunit
LPXTG cell-wall
anchored
8
99.09
No
No
No
SP_0498
spr0440
1,659
Endo-beta-N-acetylglucosaminidase, putative LPXTG cell-wall
anchored
44
97.02
Yes
Yes
Yes
SP_0641
spr0561
2,140
Serine protease, subtilase family
LPXTG cell-wall
anchored
44
96.54
Yes
Yes
No
SP_0648
spr0565
2,233
Beta-galactosidase (BgaA)
LPXTG cell-wall
anchored
44
96.54
Yes
Yes
No
SP_0664
spr0581
1,881
Zinc metalloprotease, putative (ZmpB)
LPXTG cell-wall
anchored
43
71.13
Yes
No
Yes
SP_0667
spr0583
332
Pneumococcal surface protein, putative
Choline binding,
surface
44
90
Yes
No
Yes
SP_0930
spr0831
627
Choline binding protein E (CbpE)
Choline binding,
surface
44
96.64
Yes
No
No
Page 11 of 19
Frameshiftedb spr1536
Donati et al. Genome Biology 2010, 11:R107
/>
Table 2 Presence, cellular localization and level of conservation of a selection of genes that are either surface exposed, or known to be involved in
interaction with the host and virulence
SP_0965
spr0867
658
Endo-beta-N-acetylglucosaminidase (LytB)
SP_0981
spr0884
313
SP_1003
SP_1004
spr0907
spr0908
839
1,039
SP_1154
spr1042
2,004
SP_1174
Absent
819
Histidine triad protein
Lipoprotein
16
95.39
Yes
Yes
Yes
SP_1175
spr1061
802
Histidine triad protein
Lipoprotein
33
92.95
Yes
Yes
Yes
SP_1326
Absent
740
Putative neuraminidase (NanC)
Outer
membrane/
secreted
16
94.21
No
No
No
SP_1492
spr1345
202
Cell wall surface anchor family protein
LPXTG cell-wall
anchored
44
91
Yes
Yes
Yes
SP_1572
spr1430
178
Non-heme iron-containing ferritin (PppA)
Surface
44
94.5
Yes
Yes
Yes
SP_1573
spr1431
490
Lysozyme (LytC)
Choline binding,
surface
44
96.46
Yes
No
No
SP_1650
spr1494
309
Manganese ABC transporter, manganesebinding adhesion liprotein (PsaA)
Lipoprotein
44
97.92
Yes
Yes
Yes
SP_1687
spr1531
697
Neuraminidase B (NanB)
Surface
43
93.85
Yes
No
No
SP_1732
spr1577
Serine threonine kinase protein (StkP)
Membrane
44
95.33
Yes
Yes
Yes
SP_1772
Absent
4,776
Cell wall surface anchor family protein (PsrP) LPXTG cell-wall
anchored
14
99.7
No
No
No
SP_1833
spr1652
708
Cell wall surface anchor family protein
LPXTG cell-wall
anchored
44
97.63
Yes
No
Yes
SP_1923
spr1739
471
Pneumolysin (Ply)
Secreted
44
99.5
Yes
No
No
SP_1937
spr1754
318
Autolysin (LytA)
Choline binding,
surface
44
98.74
Yes
No
No
SP_1992
spr1806
LPXTG cell-wall
anchored
44
99.01
No
No
No
SP_2136
spr1945
621
Choline binding protein PcpA (PcpA)
Choline binding,
surface
32
99.05
Yes
No
No
SP_2190c
spr1995
693
Choline binding protein A (CbpA) (PspC)
Choline binding,
surface
44
Yes
No
No
SP_2201
Absent
448
Choline binding protein D (CbpD)
Choline binding,
surface
43
98.94
Yes
No
No
221
44
98.42
Yes
No
No
Putative protease maturation protein (PpmA) Lipoprotein
44
96.77
Yes
Yes
Yes
Histidine triad protein
Histidine triad protein
Lipoprotein
Lipoprotein
39
44
91.34
99.67
Yes
Yes
Yes
Yes
Yes
Yes
Immunoglobulin A1 protease
LPXTG cell-wall
anchored
44
79.85
Yes
Yes
No
Cell wall surface anchor family protein
Choline binding,
surface
Donati et al. Genome Biology 2010, 11:R107
/>
Table 2 Presence, cellular localization and level of conservation of a selection of genes that are either surface exposed, or known to be involved in interaction with the host and virulence (Continued)
spr2021
392
Secreted 45 kDa protein (PcsB)
Secreted
44
96.75
Yes
Yes
Yes
Absent
Absent
SPNINV104_08710
410
PitB pilus 2 subunit, backbone
LPXTG cell-wall
anchored
8
100
No
Yes
No
Absent
Absent
SPNINV104_08690
589
PitA pilus 2 subunit, ancillary
LPXTG cell-wall
anchored
8
100
No
Yes
No
Due to the presence of unfinished genomes, we considered genes present in 43 S. pneumoniae genomes to be core. a’Yes’ indicates genes that are present in at least one of the strains of S. mitis, while ‘no’ indicates
genes that are absent in the four analyzed strains. bNanA is annotated as frameshifted in the TIGR4 strain, but it is known to be expressed by all pneumococcal strains. cPspC has been classified in 11 major variants
that cannot be aligned due to different gene organization.
Page 12 of 19
SP_2216
Group I
Group II
Group III
Group IV
Group V
Group VI
ST180
ST124
ST595
CC15
CC156
ST217
CC90 CC306
ST62
1
1
3
1
1
3
3
3
3
3
3
4
3
4
4
4
2
2
2
2
4
4
2
1
1
3
3
3
3
1
1
1
1
1
1
1
1
1
4
3
3
3
3
5
pspC
pspA
psrP
PI-2
Page 13 of 19
PI-1
Donati et al. Genome Biology 2010, 11:R107
/>
3a
6
3b
6
6
8
8
8
8
8
8
3b
5
4
4
4
5
3a
3a
1
3a
6 + 10
6
4
3a
3b
3a
3a
2
2
2
6
6
6
6
6
5
6+9
7
6
6
6
6+9
6+9
70585, Serotype 5
SpnA45, Serotype3
CDC1087, Serotype 7F
Spn072838, Serotype 3
Spn034156, Serotype 3
SpnOXC141, Serotype 3
Spn034183, Serotype 3
Spn994039, Serotype 3
Spn994038, Serotype 3
Spn021198, Serotype 3
SP3, Serotype 3
CDC0288, Serotype 12F
CDC1873, Serotype 6A
SP14, Serotype 14
McGill_CCRI1974, Serotype 14
McGill_CCRI1974M2, Serotype 14
SP23, Serotype 23
D39, Serotype 2
R6, Serotype 2
SP6, Serotype 6
TIGR4, Serotype 4
SP19, Serotye 19
CGSP14, Serotype 14
SpnINV200, serotype 14
CDC3059_06, Serotype 19A
JJA, Serotype 14
SpnATCC700669, Serotype 23F
SP195, Serotype 9V
SP9, Serotype 9
SpnP1041, Serotype 1
P1031, Serotype 1
SpnNCTC7565, Serotype 1
SpnINV104, Serotype 1
Spn061370, Serotype 1
Spn033038, Serotype 1
Spn032672, Serotype 1
sp670, Serotype 6B
SP18, Serotype 18
G54, Serotype 19F
MLV_016, Serotype 11A
SP11, Serotype 11
AP200, Serotype 11A
Taiwan19F_14, Serotype 19F
Hungary19A_6, Serotype 19A
Figure 11 Presence/absence pattern of the PI-1, PI-2 pilus-encoding islets, psrP, and allelic variants of the core pspA and pspC genes.
To show the degree of correlation with the phylogeny of S. pneumoniae, the data are reported on the phylogenetic tree of the S. pneumoniae
strains. Only the topology of the tree is shown, branch lengths are not to scale. Red bars mark strains of the same ST, and blue bars mark strains
of different STs, but of the same CC. For PI-1, PI2 and psrP, green squares indicate presence while gray squares indicate absence. For pspA and
pspC, the numbers indicate the allelic variants defined according to [42,47].
sampling of S. mitis is far from being exhaustive of the
diversity of this species, this observation could suggest that
these protein factors are crucial for pathogenicity.
Conclusions
We have studied the genomic variability of S. pneumoniae in a large panel of isolates, including multiple serotypes and clonal complexes. Despite the effect of
widespread recombination, the phylogeny inferred by a
whole genome alignment is well supported and confirms
the MLST-based classification. In particular, we found
that strains of the same CC are highly correlated, both
in terms of the composition of their dispensable genome
and in the allelic variants of core genes. Given that the
CCs represented in our collection account for 44% of
the STs in the MLST database (56% excluding singletons), this study provides a good sample of the overall
species diversity of S. pneumoniae. We identified six
lineages broader than MLST classification that reveal
more ancient relationships. However, since recombination events accumulate with time, these ancient groups
are more affected than MLST-based CCs. As a consequence, the strength of the association with the composition of the genome is stronger for MLST than for
lineage-based classification.
The dispensable genes are usually shared by small
groups of strains and are frequently acquired and lost,
suggesting that most of them are not fixed in the long
term. This is compatible with previous analyses on the
dispensable genome of Escherichia coli, where it was
estimated that, on average, dispensable sequences are
lost after 6.7 million years, to be compared with the 100
million years since the speciation of E. coli from Salmonella enterica [53].
Donati et al. Genome Biology 2010, 11:R107
/>
The pan-genome of the S. pneumoniae species is
open, and newly sequenced strains contribute a decreasing number of genes, as expected if the natural population of S. pneumoniae derived from a common ancestor.
The longer an individual has evolved independently, the
more new genes it will potentially contribute to the species pan-genome. The size of the pan-genome therefore
reflects the degree to which the sequenced strains are
phylogenetically related, and it yields information on the
evolution of the species. A fast growing pan-genome,
with strains that are quickly diversifying by integrating
new genes, indicates that the species is exploring novel
evolutionary possibilities. This process, we suppose, is
only transient in the evolution of S. pneumoniae or any
other species, since there are constraints on this diversification if the natural population is to remain a species.
The position of S. pneumoniae on the extreme limit of
being open is likely not due to chance. The species is
possibly adapted to its current ecological niche, but is
just open to the acquisition of new genes while maintaining stability. Analyzing the origin of dispensable
sequences, we found that S. mitis is the main external
reservoir of genetic variability of S. pneumoniae, and
that most events of HGT involve closely related species
that share a similar ecological niche.
Given these results, it is legitimate to ask why these
organisms maintain a costly system to acquire, modify
and lose genetic material. Experimental and simulation
studies have shown that, under certain environmental
conditions, intra-species homologous recombination
increases the fitness of bacterial populations [54-56], at
the same time limiting the divergence of lineages due to
drift [57]. Similarly, it is conceivable that an open pangenome, together with a mechanism to spread genes
through unrelated strains, guarantees the species a quick
and economical response to fluctuating environments.
These findings have obvious implications for vaccine
design. Subunit vaccines based on variable genes with
alleles that do not cross-protect might be subject to allele
replacement. Similarly, dispensable genes used for vaccination might be discarded under the effect of immune
pressure, unless they confer a selective advantage to the
harboring strain. Although the estimated turnover timescale of the dispensable genome appears to be long, the
selective pressure exerted by widespread vaccination
could speed up these processes, as indicated by capsular
switching events reported following the introduction of
the heptavalent conjugate vaccine [58].
Materials and methods
Genome sequences
All genome sequences used in this study are listed in
Additional file 1. They include complete genomes where
Page 14 of 19
all gaps remaining after assembly of shotgun reads have
been closed. The TIGR4 genome sequence, the first one
published [15], meets the absolute definition of a
sequencing gold standard with all nucleotides covered
by at least two reads, in most cases in opposite directions, all the repeated sequences confirmed for proper
assembly, and all consensus bases inspected manually.
Because this is an extremely time consuming effort,
bringing all genomes to gold standard is not practically
feasible. Thus, the other complete genomes do not meet
the absolute gold standard but were nevertheless
inspected for proper assembly and manually inspected
for ambiguous consensus base calls.
The quality of draft genomes is highly dependent on the
sequencing technology or technologies used and the
amount of sequence coverage generated (Additional file 1).
All the draft genomes used in this study display a minimum average sequence coverage per base of 10 ×. This
combined with the requirement to identify SNPs shared by
at least two genomes (see below) warrants that the SNPs
used in this study are of high quality.
Multiple genome alignments and identification of SNPs
Multiple genome alignments have been computed using
the progressiveMauve algorithm of the Mauve software
[59] using default options. Mauve produces an output file
containing separate alignments for each LCB. We have
extracted and concatenated each LCB containing
sequences from each of the 44 genomes to build a core
genome multiple alignment. From the concatenated multiple alignment the polymorphic sites were determined.
Polymorphic sites were identified from this core genome alignment as the loci where at least one sequence
had a mutated base. We identified 79,171 polymorphic
sites, of which 50,924 were informative, that is, the
mutation was common to at least two sequences. While
it is possible that some of the SNPs that are specific to
a single sequence are due to sequencing errors, this possibility becomes very unlikely in the case of informative
sites. Strain-specific SNPs can have an effect on the estimated value of the mutation rate and on the branch
length of the phylogenetic tree. However, they do not
affect the structure of the tree and the estimates of the
recombination rate.
Clonal complex designation
CCs were defined running eBurst [21] on the whole
S. pneumoniae MLST database downloaded from the
MLST website [60] in March 2009. Briefly, internal fragments of the aroE, gdh, gki, recP, spi, xpt, and ddl genes
are sequenced and compared to alleles from the S. pneumoniae MLST website [60] for ST determination. In
MLST, an ST is uniquely determined by the allelic profile.
CCs are groups of STs that share a recent common
Donati et al. Genome Biology 2010, 11:R107
/>
Page 15 of 19
Maximum likelihood phylogenetic trees were computed
using RaxML [61] using the GTR model and discrete
Gamma distributed rate parameters with four categories
with bootstrap. RAxML first conducts a bootstrap
search then identifies the best scoring tree with maximum likelihood and reports the support values for each
branch of the best scoring tree. Branch support was
computed by bootstrap with 1,000 replicates.
statistical software [63]. Briefly, for the presence/absence
profiles of each gene, we have computed the Cramer’s V
association index and the P-value of the Pearson correlation [22] with both the lineages defined in Figure 1
and the CCs. A value of V equal to 1 indicates perfect
association between the partitions of the strains and the
presence/absence, while V = 0 means that dispensable
genes are randomly distributed amongst the groups. The
P-values give the statistical significance of the
association.
The allelic forms of the 680 selected core genes were
assigned from the multiple alignments by giving a different ID to each different sequence. Similarly to the analysis performed for the presence/absence profiles of
dispensable genes, for each gene we computed the Cramer’s V and the P-value of the Pearson correlation
between the allelic designation and the lineages and
CCs.
Phylogenetic networks
Identification of putatively recombining loci
Phylogenetic networks were generated using the program SplitsTree v.4 [24] using the NeighborNet method
and distances computed with the Kimura 2 parameters
substitution model.
For a given monophyletic group, we selected those of
the 680 core genes that have at least two distinct
alleles within the group, both of which are also present in other strains outside the group. In an infinite
sites model it is guaranteed that, if the group is monophyletic, at least one of the two alleles has undergone
recombination. This method provides a conservative
estimate of the fraction of genes that underwent
homologous recombination, since it cannot identify
recombination where only a fraction of a gene is
transferred and it is limited to cases in which both the
parent and recombinant alleles are present in the
dataset.
ancestor. The eBURST algorithm [21] defines clonal complexes by partitioning the MLST data set into groups of
single-locus variants, that is, profiles that differ at one of
the seven MLST loci. This partitioning associates each ST
with a CC and identifies the most likely founder ST, which
is defined as being the ST with the greatest number of single-locus variants within the CC. Computed CCs were
named after the ST of the predicted founder.
Phylogenetic trees
Clustering of orthologous genes
A complete description of the algorithms used to create the orthologous clusters is given by Hogg et al.
[26]. Briefly, to allocate the genes into core or dispensable gene clusters, tfasty34 (Fasta package, version
3.4) was used for six-frame translation homology
searches of all predicted proteins against all possible
translations [62]. Software designed at the Center for
Genomic Sciences was used to parse this output,
grouping the genes into clusters that share 70% identity over 70% of the length with one or more of the
other genes in the cluster. These parameters were
selected because they minimize the change in the
number of clusters per change in parameters and thus
may represent a good estimate to distinguish orthologs
from paralogs [26]. To account for the cases where
genes were missed in the gene-calling step, fasta34
(Fasta package, version 3.4) was used to align all predicted genes against the contigs. If an alignment with
the required score was detected in the contig, the gene
was considered present even if the prediction software
did not identify the gene.
Calculation of pan-genome size
Finite supragenome model
The finite supragenome model predicts the number of
clusters of orthologous genes present in six population
frequencies, varying from rare genes (less then 3% of the
strains) to core genes (all the strains) [26]. The finite
supragenome model trained on 44 sequenced strains
identified a total of 3,221 clusters (Table 1) that were
used to predict the number of core, dispensable and
total clusters of orthologous genes expected for a 100strain comparison. At 100 sequenced strains, the supragenome model predicts that 48% of the clusters are core
and approximately 27% of the clusters are rare, that is,
present in less than 3% of the strains.
Allelic designation of core genes and association tests
Power law model
The association between presence/absence of dispensable genes and the allelic form of core genes with the
lineages I to VI and the CCs has been tested using the
function ‘assocstats’ of the vcd v.1.2-3 package of the R
The average size Ω(n) of the pan-genome as a function
of the number of strains n can be computed from the
number of new genes N(n) found by sequencing the
n-th genome by the following relation:
Donati et al. Genome Biology 2010, 11:R107
/>
Ω ( n ) = Ω0 +
n
∑N(i)
i =2
where Ω0 is the average number of genes in a strain.
By assuming N(n) = A*nξ we obtain:
⎧ C + A n 1 +
> −1
1
⎪ 1
⎪
Ω ( n ) ≅ ⎨ C 2 + A2 ln ( n ) = −1 n → ∞
⎪
A3
< −1
⎪
⎩
where A1, A2, A3, C1 and C2 are constants. The pangenome is ‘open’, that is, diverges as a power law for
n ® ∞ for ξ > -1, logarithmically for ξ = -1, while it
converges to a constant, that is, it is closed for ξ < -1.
Dependency of the pan-genome size and the number of
polymorphic sites
If we assume that each strain has a constant probability
ω per unit of time to acquire a gene, the average number of new genes contributed by a strain to the pan-genome is proportional to the time t(n) since this has
evolved independently from the n already sequenced
strains. t(n), on average, decreases with n, since it is
increasingly difficult to find new strains that are not closely related to the already sequenced ones. The average
size Ω(n) of the pan-genome in a sample of n strains is
given by:
Ω ( n ) ≅ Ω 0 + T ( n )
where T(n) is the average length of the phylogenetic
tree of the strains and Ω 0 is the average size of a S.
pneumoniae genome. If the tree distribution is well
described by a coalescent process both with and without
recombination, t(n) and T(n) are proportional to 1/n
and 1n(n), respectively, for n ® ∞ [64], in agreement
with our data (Figure 4 and Figure 5 inset). Similarly,
the number of segregating sites in a set of n sequences
is given by:
S ( n ) ≅ T ( n )
where θ is the population mutation rate. Substituting
the average tree length, we obtain:
Ω ( n ) ≅ Ω0 +
S(n)
Therefore, by a linear fit of the relation between S(n)
and Ω(n) we can estimate the ratio between the rate of
acquisition of new genes and the mutation rate.
Page 16 of 19
Linkage disequilibrium
For each pair of polymorphic sites, we computed D’
using the formula:
D
⎧
⎪ min p , q , p q
( 1 2 2 1)
⎪
D’ = ⎨
D
⎪−
⎪ min ( p1q1 , p 2q 2 )
⎩
D>0
D<0
D = p11p22 - p12p21 where pij is the proportion of individuals carrying allele i at site 1 and allele j at site 2, and
pi,qi are the proportion of individuals carrying allele i at
site 1 and 2, respectively. D’ was then averaged over all
pairs of polymorphic sites within a given alignment
block as a function of their distance along the
chromosome.
Definition of the dispensable sequences
From the multiple genome alignment obtained using
Mauve we selected 1,958 variable regions, that is, LCBs
that are absent in one or more genomes and are longer
than 500 bp, in order to avoid small regions where
alignments could be problematic. Due to the alignment
algorithm of Mauve, these regions are not split by indels
in one or more of the genomes [59]. Of these regions,
1,030 are present in two or more strains and therefore
are informative from the point of view of phylogenetic
reconstruction.
Genetic distances
The average genetic distance within and between the
S. pneumoniae and the S. mitis groups was calculated by
selecting the portions of the multiple genome alignment
that were common to 50 genomes, concatenating those
aligned sequences into a single multiple alignment and
then computing on the concatenated sequences the pairwise per-site number of substitutions using the maximum composite likelihood method [65] for the TamuraNei substitution model [66] using Mega 4.1 [67].
Reconstruction of acquisition/loss events with parsimony
We represented the presence/absence of each of the
1,030 informative variable segments as a 0/1 character,
and we computed the parsimony score Sp of the tree for
each of these characters. The parsimony score of a discrete character on a tree is the minimum number of
state transitions that a character must have undergone if
it evolved on a given tree, and in this case represents
the minimum number of independent acquisition/loss
events that are necessary for a given pattern of presence/absence. If the distribution of a given character
can be explained by a single acquisition/loss, its
Donati et al. Genome Biology 2010, 11:R107
/>
Page 17 of 19
parsimony score is 1, while if multiple events of acquisition/loss are necessary, its parsimony score is greater
than 1 according to the rule Sp = Na + Nl where Na and
N l are the number of acquisitions and losses, respectively. Since an acquisition followed by a recombination
event can always be explained by multiple acquisitions,
events with Na > 1 are possible intra-species recombination events.
Genome Sciences, Department of Microbiology and Immunology, University
of Maryland School of Medicine, 801 West Baltimore Street, MD 21201, USA.
4
The Sanger Institute, Wellcome Trust Genome Campus, Hinxton, Cambridge
CB10 1SA, UK. 5Laboratorio di Microbiologia Molecolare e Biotecnologia,
Dipartimento di Biologia Molecolare, Universita’ di Siena, Policlinico Le
Scotte, 53100 Siena, Italy. 6Division of Infection and Immunity, Glasgow
Biomedical Research Centre, University of Glasgow, 120 University Place,
Glasgow G12 8TA, UK. 7Institute of Medical Microbiology and Immunology,
Aarhus University, DK-8000 Aarhus, Denmark. 8University of Oxford
Department of Paediatrics, Medical Sciences Division, John Radcliffe Hospital,
Headington OX3 9DU, UK.
Reconstruction of ancestral genomes
Authors’ contributions
CD, NLH, AM and VM conceived the project, designed research, performed
research, analyzed data, and wrote the manuscript; HT, SDB, MK, and ERM
conceived the project, designed research, and wrote the manuscript; NJC
performed research, analyzed data, and wrote the manuscript; HT, DRR,
JCDH, SVA, FZH, NLH, and TJM contributed to shotgun sequencing,
sequence assembly, annotation and database development; MO analyzed
data and wrote the manuscript; DRR performed pan-genome analysis; GDE,
AC, and RR wrote the manuscript.
Ancestral genomes were reconstructed using the ‘ace’
function of the package ape v. 2.3 of the R software [68].
The presence/absence of each gene in a given strain was
indicated as a two state discrete character (1 for presence,
0 for absence), and an asymmetric transition matrix
between the two states with different acquisition/loss
rates was assumed. The rates of acquisition/loss and the
states in the internal nodes were determined by maximizing the likelihood of the observed distribution assuming
that strains evolve on the three shown in Figure 1. A
gene was considered to be present in a given node if the
likelihood of the state ‘1’ exceeded 0.5.
Additional material
Additional file 1: Table S1.
Additional file 2: Supporting online materials.
Additional file 3: Figure S1.
Additional file 4: Table S2.
Additional file 5: Figure S2.
Additional file 6: Table S3.
Abbreviations
BP: base pair; CC: clonal complex; HGT: horizontal gene transfer; LCB: locally
collinear block; MLST: multi-locus sequence type; SNP: single-nucleotide
polymorphism; ST: sequence type.
Acknowledgements
This project was supported in part by: federal funds from the National
Institute of Allergy and Infectious Diseases, National Institutes of Health,
Department of Health and Human Services under contract number N01-AI30071 and grant number AI080935, and the National Institute of Deafness
and other Communication Disorders grant numbers DC04173, DC02148,
DC05659; funds from PATH, an international nonprofit organization that
improves the health of people around the world; University of Maryland,
internal funds; the Karen Elise Jensen Foundation; and EC FP7 grant
HEALTH-F4-2008-222983. We also would like to acknowledge Luke J Tallon,
Kristine M Jones, and Xinyue Liu for genome sequencing; Beth Neuendorf,
Diana Radune, Nadia B Fedorova, and Hoda M Khouri for genome closure;
and Robert J Dodson and Sean C Daugherty for genome annotation. The
Sanger Institute is core funded by the Wellcome Trust. We thank the Sanger
Institute Sequencing and Informatics groups for general support. Finally, we
would like to thank Annalisa Pantosti for providing early access to the
AP200 genome sequences.
Author details
Novartis Vaccines and Diagnostics, Via Fiorentina 1, 53100 Siena, Italy.
Allegheny General Hospital, Allegheny-Singer Research Institute, Center for
Genomic Sciences, Pittsburgh, Pennsylvania 152123, USA. 3Institute for
1
2
Received: 7 June 2010 Revised: 19 October 2010
Accepted: 29 October 2010 Published: 29 October 2010
References
1. Kilian M, Poulsen K, Blomqvist T, Havarstein LS, Bek-Thomsen M, Tettelin H,
Sorensen UB: Evolution of Streptococcus pneumoniae and its close
commensal relatives. PLoS ONE 2008, 3:e2683.
2. Hakenbeck R, Balmelle N, Weber B, Gardes C, Keck W, de Saizieu A: Mosaic
genes and mosaic chromosomes: intra- and interspecies genomic
variation of Streptococcus pneumoniae. Infect Immun 2001, 69:2477-2486.
3. Tettelin H, Masignani V, Cieslewicz MJ, Donati C, Medini D, Ward NL,
Angiuoli SV, Crabtree J, Jones AL, Durkin AS, Deboy RT, Davidsen TM,
Mora M, Scarselli M, Margarity Ros I, Peterson JD, Hauser CR, Sundaram JP,
Nelson WC, Madupu R, Brinkac LM, Dodson RJ, Rosovitz MJ, Sullivan SA,
Daugherty SC, Haft DH, Selengut J, Gwinn ML, Zhou L, Zafar N, et al:
Genome analysis of multiple pathogenic isolates of Streptococcus
agalactiae: implications for the microbial “pan-genome”. Proc Natl Acad
Sci USA 2005, 102:13950-13955.
4. Hiller NL, Janto B, Hogg JS, Boissy R, Yu S, Powell E, Keefe R, Ehrlich NE,
Shen K, Hayes J, Barbadora K, Klimke W, Dernovoy D, Tatusova T, Parkhill J,
Bentley SD, Post JC, Ehrlich GD, Hu FZ: Comparative genomic analyses of
seventeen Streptococcus pneumoniae strains: insights into the
pneumococcal supragenome. J Bacteriol 2007, 189:8186-8195.
5. Redfield RJ, Findlay WA, Bosse J, Kroll JS, Cameron AD, Nash JH: Evolution
of competence and DNA uptake specificity in the Pasteurellaceae. BMC
Evol Biol 2006, 6:82.
6. Ehrlich GD, Hu FZ, Shen K, Stoodley P, Post JC: Bacterial plurality as a
general mechanism driving persistence in chronic infections. Clin Orthop
Relat Res 2005, 20-24.
7. Brueggemann AB, Griffiths DT, Meats E, Peto T, Crook DW, Spratt BG: Clonal
relationships between invasive and carriage Streptococcus pneumoniae
and serotype- and clone-specific differences in invasive disease
potential. J Infect Dis 2003, 187:1424-1432.
8. Henriques-Normark B, Blomberg C, Dagerhamn J, Battig P, Normark S: The
rise and fall of bacterial clones: Streptococcus pneumoniae. Nat Rev
Microbiol 2008, 6:827-837.
9. Enright MC, Spratt BG: A multilocus sequence typing scheme for
Streptococcus pneumoniae: identification of clones associated with
serious invasive disease. Microbiology 1998, 144:3049-3060.
10. Dagerhamn J, Blomberg C, Browall S, Sjostrom K, Morfeldt E, HenriquesNormark B: Determination of accessory gene patterns predicts the same
relatedness among strains of Streptococcus pneumoniae as sequencing
of housekeeping genes does and represents a novel approach in
molecular epidemiology. J Clin Microbiol 2008, 46:863-868.
11. Moschioni M, Donati C, Muzzi A, Masignani V, Censini S, Hanage WP,
Bishop CJ, Reis JN, Normark S, Henriques-Normark B, Covacci A, Rappuoli R,
Barocchi MA: Streptococcus pneumoniae contains 3 rlrA pilus variants that
are clonally related. J Infect Dis 2008, 197:888-896.
Donati et al. Genome Biology 2010, 11:R107
/>
12. Bagnoli F, Moschioni M, Donati C, Dimitrovska V, Ferlenghi I, Facciotti C,
Muzzi A, Giusti F, Emolo C, Sinisi A, Hilleringmann M, Pansegrau W,
Censini S, Rappuoli R, Covacci A, Masignani V, Barocchi MA: A second pilus
type in Streptococcus pneumoniae is prevalent in emerging serotypes
and mediates adhesion to host cells. J Bacteriol 2008, 190:5480-5492.
13. Lefebure T, Stanhope MJ: Evolution of the core and pan-genome of
Streptococcus: positive selection, recombination, and genome
composition. Genome Biol 2007, 8:R71.
14. Touchon M, Hoede C, Tenaillon O, Barbe V, Baeriswyl S, Bidet P, Bingen E,
Bonacorsi S, Bouchier C, Bouvet O, Calteau A, Chiapello H, Clermont O,
Cruveiller S, Danchin A, Diard M, Dossat C, Karoui ME, Frapy E, Garry L,
Ghigo JM, Gilles AM, Johnson J, Le Bouguenec C, Lescat M, Mangenot S,
Martinez-Jehanne V, Matic I, Nassif X, Oztas S, et al: Organised genome
dynamics in the Escherichia coli species results in highly diverse
adaptive paths. PLoS Genet 2009, 5:e1000344.
15. Tettelin H, Nelson KE, Paulsen IT, Eisen JA, Read TD, Peterson S,
Heidelberg J, DeBoy RT, Haft DH, Dodson RJ, Durkin AS, Gwinn M,
Kolonay JF, Nelson WC, Peterson JD, Umayam LA, White O, Salzberg SL,
Lewis MR, Radune D, Holtzapple E, Khouri H, Wolf AM, Utterback TR,
Hansen CL, McDonald LA, Feldblyum TV, Angiuoli S, Dickinson T, Hickey EK,
et al: Complete genome sequence of a virulent isolate of Streptococcus
pneumoniae. Science 2001, 293:498-506.
16. Hoskins J, Alborn WE Jr, Arnold J, Blaszczak LC, Burgett S, DeHoff BS,
Estrem ST, Fritz L, Fu DJ, Fuller W, Geringer C, Gilmour R, Glass JS, Khoja H,
Kraft AR, Lagace RE, LeBlanc DJ, Lee LN, Lefkowitz EJ, Lu J, Matsushima P,
McAhren SM, McHenney M, McLeaster K, Mundy CW, Nicas TI, Norris FH,
O’Gara M, Peery RB, Robertson GT, et al: Genome of the bacterium
Streptococcus pneumoniae strain R6. J Bacteriol 2001, 183:5709-5717.
17. Lanie JA, Ng WL, Kazmierczak KM, Andrzejewski TM, Davidsen TM,
Wayne KJ, Tettelin H, Glass JI, Winkler ME: Genome sequence of Avery’s
virulent serotype 2 strain D39 of Streptococcus pneumoniae and
comparison with that of unencapsulated laboratory strain R6. J Bacteriol
2007, 189:38-51.
18. Ding F, Tang P, Hsu MH, Cui P, Hu S, Yu J, Chiu CH: Genome evolution
driven by host adaptations results in a more virulent and antimicrobialresistant Streptococcus pneumoniae serotype 14. BMC Genomics 2009,
10:158.
19. Croucher NJ, Walker D, Romero P, Lennard N, Paterson GK, Bason NC,
Mitchell AM, Quail MA, Andrew PW, Parkhill J, Bentley SD, Mitchell TJ: Role
of conjugative elements in the evolution of the multidrug-resistant
pandemic clone Streptococcus pneumoniaeSpain23F ST81. J Bacteriol
2009, 191:1480-1489.
20. Feng J, Lupien A, Gingras H, Wasserscheid J, Dewar K, Legare D,
Ouellette M: Genome sequencing of linezolid-resistant Streptococcus
pneumoniae mutants reveals novel mechanisms of resistance. Genome
Res 2009, 19:1214-1223.
21. Feil EJ, Li BC, Aanensen DM, Hanage WP, Spratt BG: eBURST: inferring
patterns of evolutionary descent among clusters of related bacterial
genotypes from multilocus sequence typing data. J Bacteriol 2004,
186:1518-1530.
22. Friendly M: Visualizing Categorical Data SAS Publishing; 2001.
23. Feil EJ, Holmes EC, Bessen DE, Chan MS, Day NP, Enright MC, Goldstein R,
Hood DW, Kalia A, Moore CE, Zhou J, Spratt BG: Recombination within
natural populations of pathogenic bacteria: short-term empirical
estimates and long-term phylogenetic consequences. Proc Natl Acad Sci
USA 2001, 98:182-187.
24. Huson DH, Bryant D: Application of phylogenetic networks in
evolutionary studies. Mol Biol Evol 2006, 23:254-267.
25. Brueggemann AB, Spratt BG: Geographic distribution and clonal diversity
of Streptococcus pneumoniae serotype 1 isolates. J Clin Microbiol 2003,
41:4966-4970.
26. Hogg JS, Hu FZ, Janto B, Boissy R, Hayes J, Keefe R, Post JC, Ehrlich GD:
Characterization and modeling of the Haemophilus influenzae core and
supragenomes based on the complete genomic sequences of Rd and
12 clinical nontypeable strains. Genome Biol 2007, 8:R103.
27. Tettelin H, Riley D, Cattuto C, Medini D: Comparative genomics: the
bacterial pan-genome. Curr Opin Microbiol 2008, 11:472-477.
28. Lewontin RC: The interaction of selection and linkage. I. General
considerations; heterotic models. Genetics 1964, 49:49-67.
29. Jolley KA, Wilson DJ, Kriz P, McVean G, Maiden MC: The influence of
mutation, recombination, population history, and selection on patterns
Page 18 of 19
30.
31.
32.
33.
34.
35.
36.
37.
38.
39.
40.
41.
42.
43.
44.
45.
46.
47.
48.
49.
50.
of genetic diversity in Neisseria meningitidis. Mol Biol Evol 2005,
22:562-569.
McVean G, Awadalla P, Fearnhead P: A coalescent-based method for
detecting and estimating recombination from gene sequences. Genetics
2002, 160:1231-1241.
Feil EJ, Smith JM, Enright MC, Spratt BG: Estimating recombinational
parameters in Streptococcus pneumoniae from multilocus sequence
typing data. Genetics 2000, 154:1439-1450.
Chi F, Nolte O, Bergmann C, Ip M, Hakenbeck R: Crossing the barrier:
evolution and spread of a major class of mosaic pbp2x in Streptococcus
pneumoniae, S. mitis and S. oralis. Int J Med Microbiol 2007, 297:503-512.
Swiatlo E, Champlin FR, Holman SC, Wilson WW, Watt JM: Contribution of
choline-binding proteins to cell surface properties of Streptococcus
pneumoniae. Infect Immun 2002, 70:412-415.
Paton JC: The contribution of pneumolysin to the pathogenicity of
Streptococcus pneumoniae. Trends Microbiol 1996, 4:103-106.
Steinfort C, Wilson R, Mitchell T, Feldman C, Rutman A, Todd H, Sykes D,
Walker J, Saunders K, Andrew PW, et al: Effect of Streptococcus
pneumoniae on human respiratory epithelium in vitro. Infect Immun 1989,
57:2006-2013.
Tai SS: Streptococcus pneumoniae protein vaccine candidates: properties,
activities and animal studies. Crit Rev Microbiol 2006, 32:139-153.
Hamel J, Charland N, Pineau I, Ouellet C, Rioux S, Martin D, Brodeur BR:
Prevention of pneumococcal disease in mice immunized with conserved
surface-accessible proteins. Infect Immun 2004, 72:2659-2670.
Overweg K, Kerr A, Sluijter M, Jackson MH, Mitchell TJ, de Jong AP, de
Groot R, Hermans PW: The putative proteinase maturation protein A of
Streptococcus pneumoniae is a conserved surface protein with potential
to elicit protective immune responses. Infect Immun 2000, 68:4180-4188.
Briles DE, Ades E, Paton JC, Sampson JS, Carlone GM, Huebner RC,
Virolainen A, Swiatlo E, Hollingshead SK: Intranasal immunization of mice
with a mixture of the pneumococcal proteins PsaA and PspA is highly
protective against nasopharyngeal carriage of Streptococcus pneumoniae.
Infect Immun 2000, 68:796-800.
Green BA, Zhang Y, Masi AW, Barniak V, Wetherell M, Smith RP, Reddy MS,
Zhu D: PppA, a surface-exposed protein of Streptococcus pneumoniae,
elicits cross-reactive antibodies that reduce colonization in a murine
intranasal immunization and challenge model. Infect Immun 2005,
73:981-989.
Giefing C, Meinke AL, Hanner M, Henics T, Bui MD, Gelbmann D,
Lundberg U, Senn BM, Schunn M, Habel A, Henriques-Normark B,
Ortqvist A, Kalin M, von Gabain A, Nagy E: Discovery of a novel class of
highly conserved vaccine antigens using genomic scale antigenic
fingerprinting of pneumococcus with human antibodies. J Exp Med 2008,
205:117-131.
Hollingshead SK, Becker R, Briles DE: Diversity of PspA: mosaic genes and
evidence for past recombination in Streptococcus pneumoniae. Infect
Immun 2000, 68:5889-5900.
Polissi A, Pontiggia A, Feger G, Altieri M, Mottl H, Ferrari L, Simon D: Largescale identification of virulence genes from Streptococcus pneumoniae.
Infect Immun 1998, 66:5620-5629.
Hava DL, Camilli A: Large-scale identification of serotype 4 Streptococcus
pneumoniae virulence factors. Mol Microbiol 2002, 45:1389-1406.
Chiavolini D, Memmi G, Maggi T, Iannelli F, Pozzi G, Oggioni MR: The three
extra-cellular zinc metalloproteinases of Streptococcus pneumoniae have
a different impact on virulence in mice. BMC Microbiol 2003, 3:14.
Kilian M, Husby S, Host A, Halken S: Increased proportions of bacteria
capable of cleaving IgA1 in the pharynx of infants with atopic disease.
Pediatr Res 1995, 38:182-186.
Iannelli F, Oggioni MR, Pozzi G: Allelic variation in the highly polymorphic
locus pspC of Streptococcus pneumoniae. Gene 2002, 284:63-71.
Rolo D, Ardanuy C, Fleites A, Martin R, Linares J: Diversity of
pneumococcal surface protein A (PspA) among prevalent clones in
Spain. BMC Microbiol 2009, 9:80.
Obert C, Sublett J, Kaushal D, Hinojosa E, Barton T, Tuomanen EI,
Orihuela CJ: Identification of a candidate Streptococcus pneumoniae core
genome and regions of diversity correlated with invasive pneumococcal
disease. Infect Immun 2006, 74:4766-4777.
Muzzi A, Moschioni M, Covacci A, Rappuoli R, Donati C: Pilus operon
evolution in Streptococcus pneumoniae is driven by positive selection
and recombination. PLoS One 2008, 3:e3660.
Donati et al. Genome Biology 2010, 11:R107
/>
Page 19 of 19
51. King SJ, Hippe KR, Weiser JN: Deglycosylation of human glycoconjugates
by the sequential activities of exoglycosidases expressed by
Streptococcus pneumoniae. Mol Microbiol 2006, 59:961-974.
52. Dalia AB, Standish AJ, Weiser JN: Three surface exoglycosidases from
Streptococcus pneumoniae, NanA, BgaA, and StrH, promote resistance to
opsonophagocytic killing by human neutrophils. Infect Immun 78:2108-2116.
53. Lawrence JG, Ochman H: Molecular archaeology of the Escherichia coli
genome. Proc Natl Acad Sci USA 1998, 95:9413-9417.
54. Baltrus DA, Guillemin K, Phillips PC: Natural transformation increases the
rate of adaptation in the human pathogen Helicobacter pylori. Evolution
2008, 62:39-49.
55. Cooper TF: Recombination speeds adaptation by reducing competition
between beneficial mutations in populations of Escherichia coli. PLoS Biol
2007, 5:e225.
56. Levin BR, Cornejo OE: The population and evolutionary dynamics of
homologous gene recombination in bacterial populations. PLoS Genet
2009, 5:e1000601.
57. Fraser C, Hanage WP, Spratt BG: Recombination and the nature of
bacterial speciation. Science 2007, 315:476-480.
58. Brueggemann AB, Pai R, Crook DW, Beall B: Vaccine escape recombinants
emerge after pneumococcal vaccination in the United States. PLoS
Pathog 2007, 3:e168.
59. Darling AC, Mau B, Blattner FR, Perna NT: Mauve: multiple alignment of
conserved genomic sequence with rearrangements. Genome Res 2004,
14:1394-1403.
60. MLST - S. pneumoniae. [].
61. Stamatakis A: RAxML-VI-HPC: maximum likelihood-based phylogenetic
analyses with thousands of taxa and mixed models. Bioinformatics 2006,
22:2688-2690.
62. Pearson WR, Lipman DJ: Improved tools for biological sequence
comparison. Proc Natl Acad Sci USA 1988, 85:2444-2448.
63. R Development Core Team: R: A Language and Environment for Statistical
Computing Vienna: R Foundation for Statistical Computing; 2005.
64. Hein J, Schierup MH, Wiuf C: Gene Genealogies, Variation and Evolution: a
Primer in Coalescent Theory Oxford, New York: Oxford University Press; 2005.
65. Tamura K, Nei M, Kumar S: Prospects for inferring very large phylogenies
by using the neighbor-joining method. Proc Natl Acad Sci USA 2004,
101:11030-11035.
66. Tamura K, Nei M: Estimation of the number of nucleotide substitutions in
the control region of mitochondrial DNA in humans and chimpanzees.
Mol Biol Evol 1993, 10:512-526.
67. Tamura K, Dudley J, Nei M, Kumar S: MEGA4: Molecular Evolutionary
Genetics Analysis (MEGA) software version 4.0. Mol Biol Evol 2007,
24:1596-1599.
68. Paradis E, Claude J, Strimmer K: APE: Analyses of Phylogenetics and
Evolution in R language. Bioinformatics 2004, 20:289-290.
69. Drummond AJ, Rambaut A: BEAST: Bayesian evolutionary analysis by
sampling trees. BMC Evol Biol 2007, 7:214.
70. Shimodaira H: An approximately unbiased test of phylogenetic tree
selection. Syst Biol 2002, 51:492-508.
71. Suzuki R, Shimodaira H: Pvclust: an R package for assessing the
uncertainty in hierarchical clustering. Bioinformatics 2006, 22:1540-1542.
doi:10.1186/gb-2010-11-10-r107
Cite this article as: Donati et al.: Structure and dynamics of the pangenome of Streptococcus pneumoniae and closely related species.
Genome Biology 2010 11:R107.
Submit your next manuscript to BioMed Central
and take full advantage of:
• Convenient online submission
• Thorough peer review
• No space constraints or color figure charges
• Immediate publication on acceptance
• Inclusion in PubMed, CAS, Scopus and Google Scholar
• Research which is freely available for redistribution
Submit your manuscript at
www.biomedcentral.com/submit