Báo cáo y học: "Predictive network modeling of the highresolution dynamic plant transcriptome in response to nitrate" pps
Bạn đang xem bản rút gọn của tài liệu. Xem và tải ngay bản đầy đủ của tài liệu tại đây (2.11 MB, 19 trang )
RESEARCH Open Access
Predictive network modeling of the high-
resolution dynamic plant transcriptome in
response to nitrate
Gabriel Krouk
1,2
, Piotr Mirowski
3
, Yann LeCun
3
, Dennis E Shasha
3
, Gloria M Coruzzi
1*
Abstract
Background: Nitrate, acting as both a nitrogen source and a signaling molecule, controls many aspects of plant
development. However, gene networks involved in plant adaptation to flu ctuating nitrate environments have not
yet been identified.
Results: Here we use time-series transcriptome data to decipher gene relationships and consequently to build
core regulatory netw orks involved in Arabidopsis root adaptation to nitrate provision. The experimental approach
has been to monitor genome-wide responses to nitrate at 3, 6, 9, 12, 15 and 20 minutes using Affymetrix ATH1
gene chips. This high-resolution time course analysis demonstrated that the previously known primary nitrate
response is actua lly preceded by a very fast gene expression modulation, involving genes and functions needed to
prepare plants to use or reduce nitrate. A state-space model inferred from this microarray time-series data
successfully predicts gene behavior in unlearnt conditions.
Conclusions: The experiments and methods allow us to propose a temporal working model for nitrate-driven
gene networks. This network model is tested both in silico and experimentally. For example, the over-expression of
a predicted gene hub encoding a transcription factor induced early in the cascade indeed leads to the
modification of the kinetic nitrate response of sentinel genes such as NIR, NIA2, and NRT1.1, and several other
transcription factors. The potential nitrate/hormone connections implicated by this time-series data are also
evaluated.
Background
Higher plants, which constitute a main entry of nitrogen
in to the food chain, acquire nitrogen mainly as nitrate
(NO
3
-
). Soil concentrations of this mineral ion can fluc-
tuate dramatically in the rhizosphere , often re sulting in
limited growth and yield [1]. Thus , understanding plant
adaptation to fluctuating nitrogen levels in the soil is a
challenging task with potential consequences for health,
the environment, and economies [2-4].
The first genomic studies on N O
3
-
responses in plants
were published 10 years ago [5]. To date, data monitor-
ing gene expression in response to NO
3
-
provision from
more than 100 Affymetrix ATH1 chips have been
published [5-12]. Meta-analysis of microarray data sets
from several different labs demonstrated that at least a
tenth of the genome can potentially be regula ted by
nitrogen provision, depending on the context [2,9,13,14].
Despite these extensive e fforts of characterizati on, only
a limited number of molecular actors that alter NO
3
-
-
induced gene regulation have been identified so far. The
first molecular actor identified is NRT1.1, a dual affinity
NO
3
-
transporter that has recently been proposed to
also participate in a NO
3
-
-sensing system by several
studies from different laboratories. A mutation in the
NRT1.1 gene has been shown to alter plant responses to
NO
3
-
prov ision by changing lateral root development in
NO
3
-
-rich patches of soil [15,16] and to affect control
of gene expression [17-20]. Addit ionally, mutations in
the genes CIPK8 and CIPK23, encoding kinases, the
NIN-like protein gene NLP7,andtheLBD37/38/39
genes have b een shown to alter inductio n of downstream
* Correspondence:
1
Center for Genomics and Systems Biology, Department of Biology, New
York University, 100 Washington Square East, 1009 Main Building, New York,
NY 10003, USA
Full list of author information is available at the end of the article
Krouk et al. Genome Biology 2010, 11:R123
/>© 2010 Krouk et al.; licensee BioMed Central Ltd. This is an open access article distributed under the terms of the Creative Commons
Attribution License (http://c reativecommons.org/licenses/by/2.0), which permits unrestricted use, distribution, and reproduction in
any medium, provided the original work is prop erly cited.
genes by NO
3
-
[20-23]. Other regulatory proteins have
bee n shown to control plant de velopment in response to
NO
3
-
provision (such as ANR1 for lateral root develop-
ment), but no evidence has so far demonstrated their role
in the control of gene expression in response to NO
3
-
provision [24]. Importantly, the downstrea m networks of
genes affected by such regulatory proteins have not be en
identified.
In this study, our aim is to provide a systems-wide
view of NO
3
-
signal propagation through dynamic regu-
latorygenenetworks.Todoso,wegeneratedahigh-
resolution dynamic NO
3
-
transcriptome from plants
treated with nitrate from 0 to 20 minutes, and modeled
the resulting sequence using a dynamical model. Instead
of learning the dynamics directly from the gene expres-
sion sequence, we took into account uncertainty and
acquisition errors, and used a state-space model (SSM).
The latter defined the observed gene expression time
series (denoted as y(t)) as being generated by a hidden
‘true’ sequence of gene expressions z(t). This approach
enabled us to both incorporate uncertainty about the
measured mRNA and model the gene regulation net-
work by simple linear dynamics on the hidden variables
x(t) (so-called ‘ states’ ), thus reducing the number of
(unknown) free parameters and the associated risk of
over-fitting the observed data. We used a specific
machine learning algorithm known as ‘dynamical factor
graphs’ [25] with an additional sparsity constraint on
the gene regulation network. Interestingly, the coher-
ence of the generated regulatory model is good enough
that it is able to predict the direction of gene change
(up-regulation or down-regulation) on future data
points. This coherence allows us to propose a gene
influence network involving transcription factors and
‘sentinel genes’ involved in the primary NO
3
-
response
(such as NO
3
-
transporters or NO
3
-
ass imilation genes).
The role o f a predicted hub in this network is evaluated
by over-expressing it, and indeed leads to changes in the
NO
3
-
-driven gene expression of sentinel genes. The
initial gene response to NO
3
-
is also analyzed and d is-
cussed for its insights into molecular physiology.
Results and discussion
Molecular physiology: assessing molecular
reprogramming preceding the ‘primary’ nitrate response
To investigate genomic responses that precede the
response of sentinel ‘primary NO
3
-
response’ genes
(NIR, NRT2.1, NIA1, NIR1) to nitrate application, we
first generated several time- series exper iments (data not
shown). These allowed us to identify the earliest time at
which we were able to detect unambiguous NO
3
-
induc-
tion of these sentinel response genes using real time
quantitative PCR (RT-QPCR). Figure 1a shows the
expression of selected sentinel genes over time (0, 3, 6,
9, 12, 15, 20, 25, 35, 45, 60 minutes) in response to
treatment with 1 mM KNO
3
or controls of 1 mM KCl.
These results (Figure 1 a) demonstrate that a sentinel
gene such as NRT1.1 is induced at 20 minutes (com-
pared to KCl controls, and in comparison to gene
expression at time 0 minutes). The timing of induction
of other sentinel genes involved in the ‘primary NO
3
-
response’ are NIR1 at 12 minutes and NRT2.1 and NIA1
at 15 minutes. Following these preliminary experiments,
we next ran Affymetrix ATH1 chips on biological repli-
cates corresponding to the beginning of sentinel gene
induction and their preceding time points (0, 3, 6, 9, 12,
15, 20 minutes). Note that we kept the 20-minute time
point as a referenc e, since it was the earliest time point
that had previously been studied [6].
The resulting nitrate-responsive transcriptome kinetic
dataset corresponded to 26 ATH1 chips with 22,810
probes each. A sequent ial analysis involving linear mod-
eling (detailed in Materials and m ethods) was carried
out to identify genes regulated at each particular time
point with highly stringent criteria (including control of
the false discovery rate (FDR)). We detected 83, 192, 55,
149, 190, and 229 genes significantly regulated by nitrate
treatment at the 3, 6, 9, 12, 15 and 20 minute time
points, respectively (Additional file 1). The union of
these gene lists corresponds to 550 distinct nitrate-
responsive genes. We demonstrate that a large majority
of the newly identified NO
3
-
-regulated genes are con-
trolled at the earliest time points (3 and 6 minutes),
which have never before been a ssayed (Figure 1b). In
order to support these new findings, 15 genes have been
validated by QPCR (Additional file 2) on three replicates
(two were used for the microarray chips and one for
QPCR only). The predicted behaviors of these genes
were validated by the QPCR approach, as follows. One
set of genes is shown to have a transient response to
NO
3
-
(for example, At1g55120, At3g50750, At1g64370,
At4g16780, At1g27900, At1g22640, At1g52060,and
At2g42200). While a second gene set is validated to be
very early responsive genes (for example, At1g13300,
At1g49000, At4g31910, At5g15830, At2g27830,
At3g25790,andAt5g65210). Quantitatively, the correla-
tion between the NO
3
-
induction (KNO
3
/KCl ratio)
detected by both approaches (ATH1 chip and QPCR) is
R
2
> 0.5 for 8 genes, 0.5 > R
2
> 0.4 for 3 genes, R
2
<0.4
for 4 genes. It is noteworthy that for the genes having a
low correlation, their overall behavior is validated by
QPCR (for example, constant versus transient induction
by NO
3
-
; Figure 2b; Additional file 2).
To probe the biological significance of these kinetic
patterns of nitrate regulation of gene expression, we
determined the functional categories that are over-repre-
sented in the lists of nitrate-regulated genes at each time
point, separating the induced and repressed gene lists
Krouk et al. Genome Biology 2010, 11:R123
/>Page 2 of 19
20 12 15 9 3 6
mi
n
Log 2 (KNO
3
/ KCl)
>2
<2
1
0 50 100
3min
6min
9min
12min
15min
20min
% of new regulated genes
when compared to Wan
g
et al; 2003
(a)
(c)
mRNA level
NIA1
KNO
3
KCl
Time (min)
15min
0.0
0.5
1.0
1.5
2.0
2.5
NIR1
12min
0 10 20 30 40 50 60 70
0
1
2
3
4
NRT1.1
20min
0
1
2
3
4
NRT2.1
15min
0.0
0.5
1.0
1.5
2.0
2.5
3.0
3.5
transcriptome
measurements
(b)
0 10 20 30 40 50 60 70
Affy Signal
Affy Signal
Affy Signal
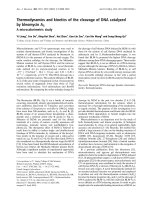
Affy Signal
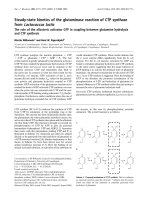
Figure 1 High-resolution kinetics of transcriptome responses to NO
3
-
treatment. (a) Levels of mRNA for nitrogen-responsive sentinel genes
in Arabidopsis roots in response to NO
3
-
treatment. Fourteen-day-old plants grown in the presence of ammonium succinate were treated with
1 mM KNO
3
or KCL (as a mock treatment). Plants were collected at 0 minutes (before treatment) and 3, 6, 9, 12, 15, 20, 25, 35, 45, and 60
minutes after treatment. Sentinel transcripts were measured in RNA from roots using RT-QPCR and normalized to two housekeeping genes (see
Materials and methods). The insets show the Affymetrix MAS5 normalized signal for the sentinel genes on the 0- to 20-minute samples. The data
represent the mean ± standard error of three and two biological replicates for QPCR and Affymetrix measurements, respectively. (b) Percentage
of genes not detected as NO
3
-
regulated in Wang et al. [6]. (c) Overall behavior (relative expression) of 550 regulated genes (Log base 2(Signal
KNO
3
/Signal KCl)) between 0 and 20 minutes. These data correspond to ATH1 measurement of the samples collected for the RT-PCR presented
in (a) (grey shades; see also Materials and methods for further details).
Krouk et al. Genome Biology 2010, 11:R123
/>Page 3 of 19
>2
<2
1
Log
2
(KNO
3
/ KCl)
1
2 3
4
5
6
7 8
9
10
11
12 13
14
15
16
17 18
19
20
Time (min)
12 9 20 15 6 3
12 9 20 15 6 3
12 9 20 15 6 3
12 9 20 15 6 3
12 9 20 15 6 3
(b)
(
a
)
6 min
12 min
mRNA levels
Transitory response
Early response
Late response
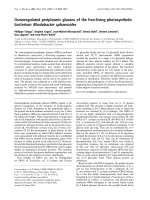
Figure 2 Clustering analysis and QPCR reveals different patterns of expression in response to short-term NO
3
-
treatment. (a) Cluster
analysis of the relative expression of 550 regulated genes (Log base 2(Signal KNO
3
/Signal KCl)) between 0 and 20 minutes. These data
correspond to ATH1 measurement of the samples collected for the RT-PCR shown in Figure 1 (see Materials and methods for further details). For
clusters including genes with a significant over-representation of biological functions see Additional file 4. (b) Examples of three different gene
behaviors (transitory, early, late responses) after NO
3
-
provision.
Krouk et al. Genome Biology 2010, 11:R123
/>Page 4 of 19
(Additional file 2). Interestingly, the biological functions
induced earliest after nitrate addition do not concern
nitrogen direct ly. Instead, within 3 minutes, the very first
statistically significant over-represented functional cate-
gory is ribosomal proteins (P-value 6.58e
-6
). This finding
generates the hypothesis that nitrogen could trigger a
transient and very rapid reprogramming of key elements
of the translation machinery needed tosynthesizenew
proteins required for nitrogen acquisition. This idea
might be further supported b y the fact that many more
genes are induced by the addition of nitrate than are
repressed (see below). Moreover, lat er on in the
time-course (as early as 9 minutes), the next biological
function to be significantly induced is the oxidative pen-
tose-phosphate-pathway, a function that is known to be a
critical step providing reductants needed to assimilate
NO
3
-
[26]. The oxidative pentose-phosphate-pathway has
also been shown to generate a signal controlling key
effectors of the NO
3
-
response, such as NRT2.1, NRT2.4,
NRT1.1, NRT1.5,andAMT1. 3 [27]. Taken together,
these o bservations suggest that the early nitrat e response
involves mechanisms needed to prepare the plant to
respond to nitrate rather than mechanisms that relate
directly to nitrogen. Such mechanisms - for example,
nitrate transport and amino acid metabolism - are regu-
lated later on in the time series (Additional file 3).
To begin to decipher the pattern of nitrate-regulated
gene expression over the entire time series, we first clus-
tered the gene expression ratio (Log
2
(Signal KNO
3
/Sig-
nal KCl) of the 550 significantly regulated genes) in
order to gain insigh t into the genom ic reprogramming
during the first 20 minutes o f KNO
3
treatment (Figure
1c).Thevastmajorityofthereprogrammingisan
induction of gene expression by NO
3
-
, rather than a
repression. To quantify this observati on, the numbers of
genes that are detected as significantly induced by NO
3
-
at 3, 6, 9, 12, 15, and 20 minu tes are 63 (76% of regu-
lated genes), 146 (76% of regulated genes), 54 (98% of
regulated genes), 123 (82% of regulated genes), 164 (87%
of regulated genes), and 209 (92% of regulated genes),
respectively. One interpretation is that NO
3
-
induces an
adaptation program that is on ‘stand-by’ in NO
3
-
-free
conditions, rather than a shut-down of a putative
‘ N-free-condition’ program. Clustering analysis also
allowed us to sort gene responses according to their
overall behavior. This analysis demonstrated that rapid
gene expression responses to nitrate could be classified
into up to 20 clusters (according to figure of merit
(FOM) analysis; see Materials and methods; Figure 2).
Considering each cluster independently, we were able to
identify over-represented biological functions f or eight
clusters, including chloroplast, the oxidative p entose-
phosphate-pathway, and ribosomal proteins (Figure 2;
see Additional file 4 for details).
Moreover, we identified and analyzed 146 genes that
were consistently induced over the 20 minutes of nitrate
treatment (corresponding to clusters 1, 9, 11, 13, and
14). This group of consistently nitrate-induced genes
includes over-represented biological functions such as
oxidoreduction coenzyme process (P-valu e = 0.00027),
nicotinamide metabolic process (P-value = 6.50e-05),
regulation of transcription (P-value = 0.00167), pentose
phosphate shunt (P-value = 0.00073). We also identified
219 genes showing responses to nitrate that seem to
represent a general pattern of transient regulation (clus-
ters 2, 3, 4, 6, 7, 8, 10, 12, 16, 17, and 18). Interestingly,
the oxygen and redox state of the cell seems to be a
general function that is transiently adapted by KNO
3
treatment. Indeed, Munich Information Center for Pro-
tein Sequence (MIPS) functions such as oxygen radical
detoxification (P-value = 0.00018), peroxidase reaction
(P-value = 0.01479), and superoxide metabolism
(P-value = 0.02472) are over-represented gene ontology
terms in this group. This observation might indicate the
effect of NO
3
-
on the redox state of the cell. Finally, we
show that 124 genes are repressed by NO
3
-
treatment,
transiently or otherwise (corresponding to clusters 5, 19,
and 20). The common function overrepresented in this
group is transcription (P-value = 0.00312). This could
result from the extinction of the pre-existing transcrip-
tome program preceding the NO
3
-
treatment. Since the
plants had been nitrogen starved for 24 hours before
NO
3
-
treatment, this might correspond to genes that are
up-regulated by the pre-treatmen t (nitrogen starvation)
anddown-regulatedbyNO
3
-
provision. To statistically
test this hypothesis, we set up a randomization test (see
Materials and methods) to quantify whether the genes
that are down-regulated in our conditions correspond to
genes that were up-regulated by nitrogen starvation in
Peng et al. [28]; this occurred with a P-value of 0.0089.
Conversely, no significant overlap was detected for
clusters induced bi NO
3
-
(clusters1,2,4,9,10,11,13,
14). This finding validates the idea that NO
3
-
-down-
regulated clusters correspond to genes involved in the
response of plants to the pre-treatment conditions. In
summary, a large part of the NO
3
-
gene expressi on
reprogramming has been missed by previous genomic
studies. The time-varying e xpression modulation newly
identified here involves physiological functions that
could be components of the nitrate signaling system
itself.
In order to further document the potential of this
dynamic transcriptome response to mediate cross-talk
between nitrate signaling and other well-studied signal-
ing pathways in plants, we e valuated if the gene sets
regulated by NO
3
-
at the different time points in our
analysis overlap more than expected by chance with
genes regulated by hormones using data generated by
Krouk et al. Genome Biology 2010, 11:R123
/>Page 5 of 19
the Chory lab [29]. To do this, we compared the nitrate-
regulated gene lists (over six time points) with the lists
of hormone-regulated genes [29] and generated a matrix
that assembled the randomization test P-values (see
Materials and methods) between each pair of gene lists.
The lists included genes regulated by NO
3
-
across each
of the six time points (our study), and lists of genes
regulated by seven different hormones by the Chory lab
(abscisic acid, cytokinins, auxin (IAA), methyl jasmo-
nate, brassinolides, gibberellic acid, ethylene)] [29].
These results (Figure 3) lead to three main conclusions
supporting the existence of gene modules responding to
nitrate and hormone signaling.
First, we considered only the overlap between the
NO
3
-
-responsive gene lists at different time points. We
found evidence for two linked ‘modules’ of nitrate-regu-
lated gene expression (modules 1 and 2 in Figure 3b).
The first nitrate-regulated module consists of the
nitrate-regulated genes in the union of the 3- and
6-minute gene lists. The overlap between these two lists
is far beyond what we would expect by chance (P-value
< 0.001). However, the 3-minute gene list overlaps very
little w ith the rest of the nitrate-regulated genes in the
time-course study. As such, the second nitrate-regulated
module is made up o f the union of the 6-, 9-, 12-, 15-,
and 20-minute gene lists (these gene lists overlap signifi-
cantly more than random). The 6-minute gene list acts
as the link between the very early nitrate-response genes
(before 6 minutes) and the more delayed ones (after
6 minutes).
Second, the overlap of the nitrate-regulated genes with
the hormone-regulated genes (modules 3 and 4 in
Figure 3b) is significantly higher than expected at the
9-minute nitrate time point fo r abscisic acid-, indole
this work
Nemhauser
et al 2006
# genes in
Above the diagonal:
Size of the overlap
6min
3min
12min
9min
20min
15min
ABA
IAA
BL MJ
CK
NO
3
-
response
Module 2
Module 4
(b)
(
a
)
Below the diagonal:
Randomization test p-value.
# genes in
Each gene list
Module 2
Module 1
Module 3
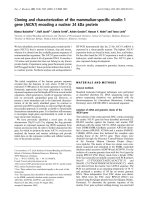
Figure 3 Identification of NO
3
-
response and hormonal cross-talk modules. (a) For each pair of gene lists (NO
3
-
responsive (this work) or
hormone responsive [29]), a P-value (randomization test; see Materials and methods) was computed and is shown in the table below the blue
diagonal. Entries in the blue diagonal give the gene list size in number of genes. Above the diagonal the size of the intersection of each pair of
studied gene lists is given. Note that P-value = 0 means P-value < 0.001. Analysis of the P-values included within the yellow outline led to the
building of gene modules depicted in the conceptual model provided in (b). ABA, absisic acid; ACC, 1-aminocyclopropane-1-carboxylic-acid
(ethylene precursor); BL, brassinolides; CK, cytokinins; GA, gibberellic acid; IAA, indole acetic acid (auxin); MJ, methyl jasmonate.
Krouk et al. Genome Biology 2010, 11:R123
/>Page 6 of 19
acetic acid-, brassinolide- and methyl jasmonate-regu-
lated genes, while the 12-minute nitrate time point over-
laps significantly with cytokinin-regulated genes. This
suggests that the interaction of nitrate signaling with
other hormone signals is likely to involve the genes
regulated by nitrate after 9 minutes. This leads to the
hypothesis that, f rom 0 to 6 minutes, the genomic
reprogramming concerns a pure NO
3
-
signaling path-
way, and thereaft er (for example, 9 minutes after nitrate
treatment) interactions with developmental signals such
as hormones occur (Figure 3). This enables us to derive
the hypothesis that the early nitrate controllers (for
example, transcription factors, kinases, and so on) regu-
latedat3,6,and9minutesareinvolvedinthecontrol
of the nitrat e sig naling itself, rather than in the interac-
tion between NO
3
-
and other signals such as hormones.
Third, this analysis shows that the different hormonal
treatments control largely overlapping gene modules, as
has been described previously [29].
In conclusion, connections between NO
3
-
and hormone-
related signaling are common features of plant molecular
networks at several layers of integration (for a review, see
[30]). For instance, transcriptional connections have been
identified where genes involved in a NO
3
-
-responsive ‘bio-
module’ have been shown to be more responsive to NO
3
-
if they are also strongly regulated by hormones [13]. More
recently, we provided a mechanistic hypothesis to explain
theroleofNRT1.1asaNO
3
-
sensor controlling lateral
root development. Indeed, NRT1.1 is a transceptor able to
transport both auxin and nitrate. The sensing mechanism
results from the ability of nitrate to inhibit auxin transport
by NRT1.1, leading to low lateral root development at low
nitrate co ncentrations [ 16]. To determine whether this
mechanism is also involved in the transcriptional induc-
tion studied in the present work will require further inves-
tigation. However, the fact that hormones can be involved
at the beginning of NO
3
-
sensing mechanisms [13,16] and
downstream of NO
3
-
transcriptional activation (this analy-
sis) is an intriguing observation that deserves further
investigation to understand what is the purpose of such
signal entanglement.
Machine learning approach: modeling of regulatory gene
influences through predictive models
Dynamical predictive modeling of regulatory gene networks
Time-series datasets of gene expression levels, as mea-
sured by microarrays, can provide us with a detailed pic-
ture of the behavior of the genetic network over time,
but they contain this information in a highly noisy form
requiring reverse engineering [31]. A n additional chal-
lengeofsystemsbiologyistobeabletomodelsystems
precisely enough that they can predict u ntested condi-
tions, especially given the paucity of data relative to the
number of possible connections.
Among the several approaches to t his modeling
problem, dynamical models have gained prominence as
they simultaneously encode the topology of the gene
interaction graph and its functional evolution model.
Such a model can in turn be used for predi ctive model-
ing of gene expression at later time points or upon
perturbation. Such dynamical models essentially consist
of a mathematical function that governs the transitions
of the state of a gene regulatory network over time.
Typically, dynamical models of mRNA concentrations
consist of ordinary differential equations (ODEs) [31].
For a given gene i, ODEs can, for instance, define the
rate of change of mRNA concentration y
i
(t)(witha
kinetic constant τ), as a function g
i
of the influences of
transcription factors (which we assume in this article to
consist of the vectors y(t)ofallobservedmRNA
measures, because protein levels are unavailable to us),
with an optional mRNA’s degradation term, as in the
equation below:
d
d
yt
t
gt yt
i
ii
()
(()) ()=−y
In our study, we have considered dynamics with the
mRNA degradation term (the so-called ‘ kinetic’ model
[32,33]) and without it (the so-called ‘Brownian motion’
model [34]). Assuming degradation ( kinetic ODE)
worked better.
Since microarray data are discretely sampled over
time, the above equation is linear ized; hence, it explains
how gene expressions at time t influence gene expres-
sions at time t +1.
In our study, the sequence of microarrays contained
seven full-genome mRNA measures (with two replicates)
at 0, 3, 6, 9, 12, 15 and 20 minutes; in the cross-valida-
tion leave-out-last study, we used measures between 0
and 15 minutes to fit the model for each gene i (by tun-
ing the parameters of associated dynamical functions),
and tested the fitted model on the last time point ( pre-
diction of the mRNA level at 20 minutes).
Choosing the model
In a review article, Jaeger and Monk [31] pointed out
that the inference of biological networks in the presence
of few time-point measurements, many genes, measu re-
ment errors and random fluctuations in the environ-
ment is inherently difficult. Because of this limitation,
methods for comput ational inference of gene regulation
networks can be crudely divided into two approaches:
non-linear or state-space based modeling of the complex
interactions between a restricted number of genes (typi-
cally ten) with hidden protein transcription factors; or
simpler, but linear, models of transcription factor-gene
interactions [32-35], relying on larger (hundreds to
thousands) numbers of microarray measurements.
Krouk et al. Genome Biology 2010, 11:R123
/>Page 7 of 19
State-space models (SSM) are a general category of
machine l earning algorithms that model the dynamics of
asequenceofdatabyencodingthejointlikelihoodof
observed and hidden variables. A popul ar probabilistic
example of SSMs that have been ap plied to gene exp res-
sion data are dynamical bayesian networks [36], such as
linear dynamical systems [37,38]. SSMs assume an
observed sequence y(t) (in our case, gene expression
data) to be generated from an underlying unknown
sequence z(t), also called ‘hidden states’. Consecutive hid-
den states form a Markov chain {z(0) , z(1), ., z(T-2), z
(T- 1)} (in our case, the sequence contains seven states at
0, 3, 6, 9, 12, 15 and 20 minutes); each transition in the
chain corresponds to the same stationary (that is, time
invariant) dynamical model f.
As a first example of complex SS Ms, Zhang et al.used
gaussian processes dynamical models with nonlinear
dynamics to infer the profile of a single transcription factor
(the tumor suppressor p53) and explained the activity of a
large c ollection of genes using that transcription factor
only (without any other transcription factor-gene interac-
tion) [39]. Another example is the linear dynamical system,
which Beal et al. [37] as well as Angus et al. [38] used to
infer the profiles of 14 hidden transcription factors for 10
observed genes only, either without predictive cross-valida-
tion [37], or on synthetically generated data [38].
Examples of first-order linear dynamical models for
gene expression include the Inferelator by Bonneau et al.
[32,33]. The Inferelator consists of a kinetic ODE that
follows the Wahde and Hertz equation [40] and where
transcription factors contribute linearly. This ODE also
includes an mRNA degradation term. Some instances of
the Inferelator introduce nonlinear AND, OR and XOR
relationships between pa irs of genes, based on a previous
bi-clustering of genes. One has to note that the Inferela-
tor has bee n mostly applied to datasets with hundreds of
data-points (for example, Halobacterium).
Other examples include the f irst-order vector autoregres-
sive model VAR(1) [35] and the ‘Brownian motion’ model
(which is a VAR (1) m odel of changes in mRNA concentra-
tion) [34]. Lozano et al. [41] suggested using a dynamic
dependency on the past 2, 3, or 4 time points, but this was
impractical in our case given the r elatively s mall number of
microarray measurements in our experiments.
Two microarray replicates were acquired in this study.
Since each replicate is independent of all microarrays
preceding and following in time, there were four possi-
ble transitions between any two time points t and t +1,
and we t herefore used four replicate sequences to train
the machine learning algorithm.
A noise reduction approach to state-space modeling of
regulatory gene networks
In a departure from previous SSM frameworks, our
noise-reduction approach uses the hidden variables to
represent an idealized, ‘true’ sequence of gene expres-
sions z(t) that would be measured if there were no
noise. The set of all genes at time t is modeled by a
‘latent’ (that is, hidden but correct) variable (denoted
z(t)), about which noisy observations y(t) are made.
Specifically, we a) model the dyn amics on hidden
states z(t) instead of modeling them directly on the
Affymetrix data y(t), as well as b) have the hidden
sequence z(t) generate th e actual observed sequence y(t)
of mRNA, while incorporating measurement uncer-
tainty. Such an approach has been used in robotics to
cope with errors coming from sensors. Our proposed
SSM is depicted in Figure 4a, where each node y(t)or
z(t) represents a vector of all gene expressions at a par-
ticular time point, and where latent variables are repre-
sented by large red circles, and observed variables by
large black circles.
Our goal is to learn the function f that determines the
change in expression of a target gene z
j
, as a linear com-
bination o f the expressio n of a relatively small number
of transcription factors, and that relates the values of
latent variables z( t) and z(t + 1) corresponding to conse-
cutive time measurements (function f is represented by a
red square in Figure 4a). The relationship between latent
and observed variables is assumed to be the identity
function h with added Gaussian noise (represented by a
black square in Figure 4a).
The function f is modeled as a linear dynamical sy s-
tem (that is, a matrix F). This linear Markovian model,
which represents a kinetic (RNA degrades) or Brow-
nian motion (RNA does not degrade) ODE, is the sim-
plest and requires the fewest parameters (there is one
parameter per transcription factor-gene interaction,
and an additional offset for each target gene). This
model thus helps to avoid over-fitting scarce gene data.
The linear model operates on hidden variables, which
become a smoothed version of the observed gene
expression data.
Because our noise reduction state-space modeling
algorithm is efficient, simple and tractable, as explained
in the Materials and methods section, it can handle lar-
ger numbers of genes (we focused on 76 genes) than
other SSM approaches, given enough genes [37-39].
Comparative study of state-space model optimization
Outofthe550nitrogen-regulated genes, we extracted
67 genes that correspond to all t he predicted transcrip-
tion fa ctors and 9 N-regulated target genes t hat belong
to the primary nitrogen assimil ation pathway. The tran-
scription factors have been used as explanatory variables
(inputs to f) as w ell as explained values (output from f)
(Figure 4b), whereas the nitrogen assimilation target
genes are only explained values. We then optimized our
SSM, using different algorithms, in o rder to fit it to the
observed data matrix, and compare all our results in
Krouk et al. Genome Biology 2010, 11:R123
/>Page 8 of 19
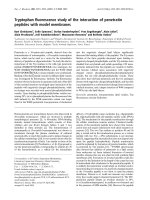
(b)
Regulators (IN)
Regulated (OUT)
Sentinels
Level of influence
SPL9 as a
controlled gene
Z(t+n)
Observation
model g
Y(t+1) Y(t+n) Y(t) Y(t+2)
Z(t)
Z(t+1)
Z(t+1)
dynamic
model f
(
a
)
SPL9 as a controller
Diagonal: Self-influences
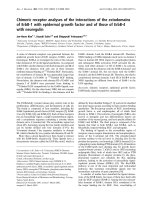
Figure 4 State space modeling predicts transcription factor influence. (a) Conceptual scheme of the state spac e modeling. An unknown
function f (red square) relates the values of latent variables Z(t) and Z(t + 1) (for all t) corresponding to consecutive time measurements.
Learning algorithms iteratively optimize the function f mapping latent values of transcription factors to changes to target genes (and
transcription factors themselves at time t + 1). (b) The whole dataset (from 0 to 20 minutes of KNO
3
treatment) has been learnt by state space
modeling (validated to be predictive in a leave-one-last approach; Table 2). The resulting f function has learnt possible connections and can be
displayed as an influence matrix. SPL9 is a transcription factor predicted to be a potential bottleneck and is further experimentally studied.
Krouk et al. Genome Biology 2010, 11:R123
/>Page 9 of 19
Table 1. We also compared our SSM approach to non-
SSM approaches [32-35,42,43] (Table 2).
Iterative learning algorithms, described in this study,
alternate between two steps: learning the function f
mapping lat ent values of transcription factors at time t
to changes to target genes (and transcription factors
themselves)attimet + 1; and recomputing (inferring)
the values o f the latent variables. In the first step, learn-
ing the function f corresponds to finding parameters of
F that minimize the prediction error and that involve
few transcription factors, thanks to a sparsity constraint
on F. In the second step, the sum of quadratic errors on
functions f and g is minimized with respect to latent
var iables z(t) by gradient descent in the hidden variable
space [25]. The learning proced ure is repeated (learning
model parameters, inferring latent variables ) on training
data until F stabilizes (see Materials and methods).
Using a bootstrapping approach based on random initia-
lization of latent variables z(t), we further repeat the
SSM iterative procedure 20 times and take the final
average network F (see Materials and methods).
Three hyper-parameters were explored in our learning
experiments: the kinetic time constant τ (unless the
ODE was ‘Brownian motion’), the amount of L1-norm
Table 1 The kinetic ODE and both the conjugate gradient and LARS optimization algorithms obtain the best fit to the
0 to 15 minutes data, with good leave-out-last predictions
Best hyperparameters (with respect to SNR on
leave-1 training dataset)
Performed on
training set:
Performed on test set:
Dynamics Normalization Optimization Gamma (state-
space
coefficient)
Tau (kinetic
time
constant)
Lambda
(regularization
parameter)
SNR (in dB) on
leave-1 training
dataset
percentage of correct
signs on leave-1 test
dataset
Kinetic MAS5 Gradient 1 3 0.0001 32.4 68%
Kinetic MAS5 LARS 0.1 3 0.1 32.4 74%
Kinetic MAS5 Elastic Nets 0.1 7 0.05 32.2 71%
Brownian MAS5 Gradient 0.1 NA 0.0001 32.1 65%
Brownian MAS5 LARS 0 NA 0.05 32.1 63%
Brownian MAS5 Elastic Nets 0 NA 0.05 32.1 63%
Naïve
trend
prediction
MAS5 NA NA NA NA 52%
Each line in the table represents the type of ODE for the dynamical model of transcription factor-gene regulation (either kinetic, with mRNA degradation, or
‘Brownian motion’, without mRNA degradation), the type of microarray data normalization, and the optimization algorithm for learning the parameters of the
dynamical model. For each of these, we selected the best hyperparameters, namely the state-space coefficient gamma, the kinetic time constant (in minutes) and
the parameter regularization coefficient lambda, based on the quality of fit to the training data (from 0 to 15 minutes), as measured by the signal-to-noise ratio
(SNR), in dB. We then performed a leave-out-last (leave-1) prediction and counted the number of times the sign of the mRNA change between 15 minutes and
20 minutes was correct. We compared these results to a naïve extrapolation (based on the trend between 12 and 15 minutes) and obtained statistically
significant results at P = 0.0145.
Table 2 The quality of fit of our state-space model approach slightly outperforms the non-SSM approaches
Best hyper parameters (with respect to
SNR on leave-1 training dataset)
Performed on
training set:
Performed on test
set:
Dynamics Normalization Optimization Gamma
(state-space
coefficient)
Tau
(kinetic
time
constant)
Lambda
(regularization
parameter)
SNR (in dB) on
leave-1 training
dataset
percentage of correct
signs on leave-1 test
dataset
Reference
Kinetic MAS5 Gradient 1 3 0.0001 32.4 68% This work
Kinetic MAS5 LARS 0.1 3 0.1 32.4 74% This work
Kinetic MAS5 LARS 0 3 0.05 32.1 74% [33]
kinetic MAS5 Elastic Nets 0 3 0.05 32.1 74% [35]
Brownian MAS5 Gradient 0 NA 0.005 32.1 66% [34]
Brownian MAS5 LARS 0 NA 0.05 32.1 63% [34]
Brownian MAS5 Elastic Nets 0 NA 0.05 32.1 63% [34]
Naïve
trend
prediction
MAS5 NA NA NA NA 52%
We compared our SSM-based technique (with a non-zero SSM parameter gamma) to previously published algorithms for learning gene regulation networks by
enforcing gamma = 0 (see Materials and methods). We notice that the LARS algorithm [42], used in the Inferelator by Bonneau et al. [32,33], as well as Elastic
Nets [35,43], obtain a slightly worse quality of fit (signal-to-noise ratio (SNR), in dB) than when combined with our state-space modeling for the same leave-out-
last (leave-1) performance as our SSM plus LARS. Not using an mRNA degradation term, as in Wang et al. [34], degrades the leave-out-last performance.
Krouk et al. Genome Biology 2010, 11:R123
/>Page 10 of 19
regularization l (explained in Materials and methods),
and a variable g linked to the SSM.
When the state-space coefficient is g = 0, we can recover
non-SSM algorithms: LARS (least-angle regre ssion and
shrinkage) [42], as used for instanc e by Bonneau et al.
[32,33] and Elastic Nets [43], as used, for instance, by
Shimamura et al. [35]. LARS is a fast implementation of
Tibshirani’s popular LASSO (least absolute shrinkage and
selection operator) regression with L1-norm regularization
[44]. Elastic Nets are an improvement over LARS and
LASSO, and their main advantage is to group variables (in
our case genes) as opposed to choosing one gene a nd leav-
ing out correlated ones. Moreover, if we do not use the
mRNA degradation term in the kinetic ODE, and use
instead ‘Brownian motion ’ dy namics, and if we set t he state-
space coefficient to g = 0, we rec over an approach compar-
able to the one published by Wang et al. [34] (although
their optimization algorithm was based on the singular
value decomposition ( SVD) of the microarray d ata).
For each type of ODE (kinetic or ‘Brownian motion’)
and type of optimization algorithm, we exhaustively
explore d the space of hyper-parameters (τ, g, l) in order
to optimize the quality of fit of each model to the first
six time points (0, 3, 6, 9, 12 and 15 minutes). We
repeated the experiment using two different ways of
normalizing microarray gene expression data: MAS5
and RMA (Robust Multi-array Average). Interestin gly, it
appears that machine learning (ML) approaches better
fit MAS5 data (32.4 db) co mpared to RMA data (30.8
db). Thus, the study was continued on MAS5 normal-
ized data, as it was for the vast majority of the studies
that we reviewed in this work. As can be seen in
Table 1, we identified the SSM relying on the kinetic
ODE, and with either LARS or conjugate gradient opti-
mizations, as the two best (having the highest signal-to-
noise ratio) optimization algorithms on the MAS5 train-
ing datasets. The signal-to-noise ratio is a monotonic
function of the normalized mean square error on the
predicted values of mRNA; all algorithms used in this
article a im at minimizing the normalized mean square
error, that is, at maximizing the signal-to-noise ratio.
Having chosen the two best algorithms using a ll time
points up to and including 15 minutes as training data,
we performed a ‘leave-out-last’ test, consisting of pre-
dicting both the direction and magnitude of the change
of the gene expression states between 15 and 20 min-
utes. Using those algorithms with those parameter set-
tings, we made predictions about whether gene
expression levels would be increased (positive sign) or
decreased(negativesign)at20minutescomparedwith
at 15 minutes.
AsTable1shows,aSSMrelyingonthekineticODE
and with LARS optimization (kinetic LARS) gives cor-
rect results 74% of the time on a set of 53 genes (47
transcription factors and 6 nitrogen assimilation genes)
that are ‘ consistent’ among the two b iological repli-
cates in their behavior (consistently up- or down-regu-
lated in both replicates) for the transition from 15
minutes to 20 minutes. W hen we considered all 76
genes, regardless of their ‘ consistency’ across replicates,
kinetic LARS still gave correct results 71% of the time.
The other chosen algorithm (kinetic ODE with conju-
gate gradient optimization), yielded 68% correct results
on both the 53 consistent genes and on all 76 genes.
By contrast, a naïve ‘trend forecast’ algorithm to extra-
polate the trend between 12 minutes and 15 minutes
was correct for only 52% of the consistent genes, just
slightly better than random (this result implies that
48% of the consistent genes changed ‘direction’ at 15
minutes). Thus, our SSM does significantly better
(P-value = 0.0145) than the naïve trend forecast based
on a binomial test (see Materials and methods) on a
coin that is biased to be correct 52% of the time.
Using the hyper-parameters (τ,
g, l)
corresponding to
the two best solutions (kine tic LARS and kinet ic conju-
gate gradient), we retrained two SSMs on all the avail-
able data (0 to 20 minutes) to obtain corresponding
gene regulatory networks. Finally, we performed a statis-
tical analysis of the bootstrap networks in order to
retain transcription factor-gene links that were
statistically significant at P = 0.001 (see Materials and
methods). We ultimately selected the conjugate gradi-
ent-optimized network as it gave a less sparse solution
(394 links) than t he LARS-optimized gene regulato ry
network (GRN) (22 links). We used this network (next
section) to analyze the NO
3
-
response of sentinel genes
to transcription factors.
We are confident in dynamical modeling, and in our
SSM in p articular, because in the leave-out-last tests, we
were able to learn the system well enough to predict the
direction of changes to gene expression. This suggests that
we might have learnt some consistent and biologically
meaningful networks involved in NO
3
-
response pathway.
Since function f models the gene regulation network
learned during the leave-out-last test, we conclude by pre-
senting the function f obtained from the full time sequence
0to20minutes.Thisfunctionf can be displayed as an
influence matrix (Figure 4b). The study of this netwo rk/
matrix as a whole system is discussed below.
Over-expression of a potential network hub (SPL9)
modifies the NO
3
-
response of sentinel and transcription
factor genes
In order to probe the role of a transcription factor/hub
in the predicted regulatory network presented in Figure
4b, transgenic plants (pSLP9:rSPL9) expressing an
altered versi on of the mRNA for the SPL9 transcription
factor were compared to wild-type plants for their
Krouk et al. Genome Biology 2010, 11:R123
/>Page 11 of 19
response to NO
3
-
provision. This gene has been selected
for several reasons: (i) it is induced at very early time
points (3 and 6 minutes); (ii) the inferred network pre-
dicts that SPL9 potentially controls at least six genes,
including two nitrogen assimilation sentinel genes - this
places it as the third-most influential transcription factor
on the nitrogen assimilation gene sentinels; (iii) it is also
the most strongly in fluenced gene in both its number of
‘in’ connection s, and by the magnitude of the regula-
tions controlling it (Figure 4b); and (iv) SPL9 displays
some strong correlations with key regulators across the
NASC (Nottingham Arabidopsis Stock Centre) array
dataset ( see below). As such, SPL9 constitutes a poten-
tial crucial bottleneck in the flux of information
mediated by the proposed nitrogen regulatory network
(Figure 4). We first considered SPL9 mutants and moni-
tored sentinel expression in this genetic background.
However, even if some defects have been observed, no
consistent phenotype can be reported (data not shown).
This may be readily explained by the topological redun-
dancy of the network (Figure 4). Thus, one could expect
that over-expression of SPL9 mRNA would t rigger a
detectable effect on the predicted sentinel targets and
on the network behavior. SPL9 is a miR156-targeted
SBP-box transcription factor identified to control shoot
development [45] and flowering transition [46,47], and it
also appears as a potential central regulator in the net-
work derived from the SSM (Figure 4). SBP-box tran-
scription factors are potentially redundant, but the use
of miR156-resistant SPL9 transgenic plan ts (resulting in
over-expression/gain of function plants) has been exten-
sively used to decipher their role. In our experimental
set-up, transgenic SPL9 mRNA is over-expressed 4- to
20-fold in the miR156-resistant plants compared to wild
type (Figure 5). Moreover, although the rSPL9 mRNA
resulting from the modified ge ne is resistant to degrada-
tion by miR156 (explaining the over-expression) the
transgene i s still under the control of its native promo-
ter. Thus, this over-expression reflects, at least in part,
the promoter activity or the effect of other post-tran-
scriptional controls (independent of miR156). This
demonstrates that the SPL9 promoter activity is poten-
tially also under the effect of NO
3
-
,sincerSPL9 mRNA
exhibits a transitory depression in the transgenic plants
(Figure 5).
mRNA transcription l evels of several sentinel genes
have been followed in this pSPL9:rSPL9 transgenic
line. The most dramatic effect recorded is for the
NIR target sentinel gene. Interestingly, the NIR gene
has previously been demonstrated to be one of the
most robustly NO
3
-
-regulated genes based on a meta-
analysis of microarray data from nitrogen treated
plants [14]. In support of this, over-expression of the
SPL9 gene leads to a significant advance in the NIR
NO
3
-
response by about 10 minutes, and attenuates
its magnitude of regulation at later time points (60
minutes). Less dramatic but stil l significant effects
(over three independent experiments) have been
recorded for NRT1.1/CIPK23 genes, belonging to the
NO
3
-
sensing module [20], and for the NIA2 gene.
These results demonstrate a role of the SPL9 tran-
scription factor in the control of genes involved in
the NO
3
-
primary response. We also further investi-
gated the role of SPL9 over-expression on the tr an-
scription levels of genes in the network over time
(Figure 4b). Interestingly, SPL9 seems to have an
effect on the vast majority of the genes in the reg ula-
tory network that we have tested (Additional file 5).
The diversity of the misregulation of gene expression
is high. For instance, 4 out of t he 14 genes tested dis-
play an early effect (between 0 and 20 minutes) after
the SPL9 over-expression. However, 11 genes display
modified gene expression at later time points (40 and
60 minutes).
An observation needs to be made a t this point. We
compared the predicted effect of SPL9 on its putative
targets (inf erred by ML), with the actual effect of over-
expression of SPL9 on these genes measured by Q-PCR.
The only systematic effect that we found is that genes
predicted to be negatively regulated by SPL9 display an
early induction in the pSPL9:rSPL9 line and are indeed
less induced at later time points (this is an interesting
feature found for four genes, including NIR,At1g13300,
At5g10030, and At5g65 210). However, the opposite is
not true, since the genes predicted to be up-regulated
by SPL9 also display a ‘down-regulation’ at later t ime
points (by 60 minutes), but no ‘up-regulation’ at early
time points (10 to 2 0 minutes), in response to rSPL9
over-expression. This relative absence of logic can be
ver y easily explained by the predicted functional redun-
dancy found in the network (also discussed below). The
question about predicting the over-expression of a net-
work hub is intriguing and will ne ed further investiga-
tion, including the generation of transcriptome data to
probe and learn how the whole system is perturbed b y
gene over-expression.
On the other hand, it is noteworthy that with its
intrinsically highly connected topology, the network is
able to amplify effects (such as SPL9 over-expression)
across steps/time. Indeed, consider a simple positive
feedback loop where A®BandalsoB®A; if the coeffi-
cient of A®B and B®A is only 10%, this is enough that
when the e xpression of A and B is 100 at time 0, it will
reach 160 after 5 steps. Here, we hypothesize that this is
what happens for SPL9; that it takes time (more than
20 minutes) to amplify the differences recorded for the
11 genes with modified gene expression at later time
points.
Krouk et al. Genome Biology 2010, 11:R123
/>Page 12 of 19
*
*
***
S
PL9
x 2.6
x 4.4
*
18.9
8.6
time (min)
25.1
27.7
30.3
35.5
NIR
WT (Col)
pSPL9:rSPL9
*
***
*
*
**
NRT2.1 NRT1.1
*
x 1.1
x 1.9
3.7
1.9
4.2
5.4
8.2
5.8
***
*
NIR SPL9 NRT2.1 NRT1.1
NIA1
NRT3.1
NIA
2
CIPK23
Figure 5 rSPL9 over-expression modifies NO
3
-
kinetic responses. Sentinel gene mRNA levels in roots of wild type (WT) and transgenic
pSPL9:rSPL9 plants in response to NO
3
-
treatment. Fourteen-day-old plants grown in ammonium succinate were treated with 1 mM KNO
3
versus
KCl. Roots were collected at 0 minutes (before treatment) and 10, 20, 40, and 60 minutes after the treatment. Sentinel transcripts were measured
in roots using RT-QPCR and normalized to two housekeeping genes (see Materials and methods). The data represent the mean ± standard error
of three biological replicates (three independent experiments). Differences between the two genotypes are statistically significant at *P < 0.05;
**P < 0.01 and ***P < 0.001 (t-test). When a gene presents significant differences, the NO
3
-
induction ratio compared to time 0 is indicated by
the numbers close to the plots. The inserts display a zoom of the early time points. More genes (transcription factors) are displayed in Additional
file 5.
Krouk et al. Genome Biology 2010, 11:R123
/>Page 13 of 19
This analysis defined SPL9 as a potential hub for short
time scale regulatory behavior, with small-amplitude
regulatory effects (36% maximum). Those effects are
going to be amplified across consecut ive time steps and
have longer-term (beyond 40 minutes) effects on addi-
tional genes. Thus, the interesting part of machine
learning approach is that it can be used to predict the
eventual behavior at time points that were not used in
the ML process.
Interestingly, in our experimental setup, pSPL9:rSPL9
does not display any obvious developmental phenotype,
contrary to what was described by Wang et al. [48].
These diverging results may be explain ed by the differ-
ent plant growth conditions used in the two studies. In
particular, in our pre-treatment conditions, plants were
grown for 14 days in ammonium succinate without any
NO
3
-
. By contrast, in the Wang et al. studies the pheno-
typeswereobservedinplantsgrownonnitrateasa
nitrogen source. The hypothesis that the phenotypes are
nitrate-dependent is supported by the fact that the
majority of the pSPL9:rSPL9 gene regulation phenotypes
(Figure 5; Additional file 5) are triggered by NO
3
-
provi-
sion. Out of the 18 genes displaying a mis-regulation in
the transgenic plants, only the CIPK23 gene displays a
phenotype before nitrate treatment. For the 17 other
genes, NO
3
-
is necessary to promote the rSPL9 over-
expression effect.
In order to test the hypothesis that nitrate induces the
phenotypes in transgenic plants, plants (wild type and
pSPL9:rSPL9) were plated on the same background
media used for the kinetic experiments (see Materials
and methods) and complemented with 0.5 mM (NH
4
)
2
-
succinate or 1 mM KNO
3
. Following 8 days after germi-
nation, different root traits were scored. These results
show that indeed the presence of NO
3
-
enhances pSPL9:
rSPL9 phenotypes (Additional file 6). Overall, only minor
develop mental differences were recorded on the (NH
4
)
2
-
succinate m edia that cannot explain the distinct molecu-
lar phenotypes shown in Figure 5 and Additional file 5.
From a biological point of view, the modification of
the nitrogen status of t he plant (induced by nitrogen
deprivation) has been shown to increase pri-miR156
accumulation [49] and mature miR156 in Hsieh et al.
[50]. However, it is noteworthy that miR156 induction is
not restricted to nitrogen deprivation, as phosphorus
deprivation can also induce miR156 accumulation [50].
On the SPL9 side, we found that its expression across
the Affymetrix NASC dataset is either positi vely or
neg atively correlated with key molecular actors in NO
3
-
sensing, metabolism and development (NRT1.1, -0.68;
NRT1.2, -0.55; ARF8, 0.73). These results provide addi-
tional support for a role for the mir156/SPL9 partners
in the control of the nitr ogen response in plants and
potentially in its coordination with other signals, such as
phosphorus status.
A highly complex connected network: causes and
consequences?
Our machine learning approach (state-space modeling)
proposes a regulatory network learned f rom a high-
resolution d ynamic transcriptome analysis made in
response to KNO
3
provision. A first interesting feature
of this regulatory network is that it predicts a high level
of connectivity (Figure 4b). Indeed, for the 76 studied
genes, 60 have 500 significant connections ( P-value
< 0 .001; see Materials and methods). This high level of
connectivity (favoring functional redundancy) may
expl ain why, to d ate, experimental analyses have uncov-
ered only few molecular actors specifically involved
in the control of NO
3
-
-induced gene expression
(NRT1.1, CIPK8, CIPK23, NLP7, LBD37/LBD38/LBD39)
[2,20-23]. Moreover, this level of potential transcription
factor redundancy can be a cause of the variable and
conditional NO
3
-
genomic responses registered over dif-
ferent laboratories and discussed in Gutierrez et al. [14]
and Krouk et al. [2].
Predicted regulatory network influences
The identification of regulatory networks is a major aim
of systems biology. Relatively few studies have det er-
mined regulatory networks precisely enough so that the
model can predict behavior in untested conditions; the
successful studies concern unicellular organisms such as
Halobacterium salinarum [32,33]. Our regulatory net-
work model is far more simple; it includes les s than a
hundred genes and is much less predic tive than the one
developed for Halobacterium since our model is fed
only with transcriptomic data and vastly fewer exper i-
ments. Interestingly, however, both approaches predict
rather low transcription factor influences. Indeed, the
maximum predicted influence of one transcription fac-
tor on one gene of our model ranges between 1 0% and
30% (positive or negative influences). Low influence rate
might reinforce the notion that functional redundancy is
a built-in feature of regulatory networks that helps
organisms adapt themselves to the context of interacting
environmental and/or evolutionary forces. Also, the fact
that Arabidopsis is a multicellular organism suggests a
potential for some ‘hidde n’ regulatory networks, as cell-
specific studies have suggested [10]. This level of com-
plexity, combined with the fact that genes in plants are
not organized in functional clusters (as they are in bac-
teria), are likely to be some of the numerous reasons
why our model is less predictive compared to t hat
for Halobacterium. T hus, the next challenge of the
plant systems approach will be to reach a level of
Krouk et al. Genome Biology 2010, 11:R123
/>Page 14 of 19
understanding able to infer regulatory networks at
several levels of integration [3].
Comparative study of state-space model optimization
versus non-state-space methods
In order to measure the improvement of our SSM over
the non-state-space methods, given our Arabidopsis
dataset, we also ran our SSM with the state-space coeffi-
cient set to g = 0 for the following methods: 1) kinetic
ODE with LARS optimization, as in Bonneau et al .
[32,33]; 2) first-order vector-autoregressive model wit h
Elastic Nets optimization, as in Shimamura et al.[35];
and 3) ‘Brownian motion’ ODE, without mRNA deg ra-
dation, similar in principle to the method used in Wang
et al. [34].
As Table 2 shows , the quality of fit (signal-to-noise
ratio) on the training data was slig htly worse (32.1 dB)
in all non-SSM methods than in our SSM (32.4 dB).
The predictive performance on the training data set was
90% of correct signs for all methods. The leave-out-last
performance of 3) was worse (below 65% correct signs
on the test set), while it was the same for 1) and 2) as
in the LARS-based SSM, that is, 74% correct signs on
the test set.
The non-SSM approaches that we considered in Table
2wouldeachgiveauniquesolution,whileourSSM
would give slightly different solutions over consecutive
runs, t hus enabling a bootstrapping procedure. For this
reason, our SSM offers a more principled way to deal
with uncertainty and avoid over-fitting in microarray
measurements than non-SSM methods. Second, our
SSM is flexible because it enables adding unobserved
variables as additional transcription factors.
Conclusions
This systems biology study uses machine learning on
time series of transcriptome data to generate testable
hypotheses for the potential mecha nisms underlying the
NO
3
-
transduction signal. We demonstrate that a part of
the NO
3
-
response (h appening within minutes after
NO
3
-
provision) has been missed by previ ous transcrip-
tional approaches. This early response contains candi-
date transcription factors such a s SPL9 that can modify
the characteristics of NO
3
-
signal propagation in gene
networks. Furthermore, we demonstrate that state-space
modeling can infer putative regulatory networks on
sparse datasets and thereby suggest hypotheses that will
help to decipher poorly understood signaling pathways.
Materials and methods
Plant material and treatments
Arabidopsis plants, ecotype Columbia or transgenic
plants (pSPL9:rSPL9) [46], were grown in sterile hydro-
ponics as adapted from [10]. In detail, sterilized seeds
were sown on Nitex 03-250/47 mesh (Sefar America,
Bricarcliff Manor, NY, USA) supported by a plastic plat-
form to allow roo ts to grow in hydroponics ins ide a
sterile Phytatray (Sigma-Aldrich, St Louis, MO, USA).
Hydroponic media consisted of 1X Murashige and
Skoog basal medium containing no nitrogen or sucrose
(custom-ordered, GibcoBRL, Gaithersburg, MD, USA)
supplemented with 3 mM sucrose , 0.5 mM ammonium
succinate, MES buffered at pH 5.7 (0.5 g.l
-1
). Plants
were grown for 14 to 16 days in day/night c ycles (16/8
h; 150 μmol photons m
-2
.s
-1
; Percival Scientific Inc.,
Perry, IA, USA) at 22°C. Twenty-four ho urs before t he
treatments, plants were transferred toward an equivalent
fresh nitrog en-free medium in continuous light to avoid
gene regulation induced by light. KNO
3
was added to
the media at 1 mM, or otherwise as stated in the figures.
Control plants were mock-treated by adding the same
concentration of KCl. The samples corresponding to
time 0 were fir st harvested and then the treatment
(KNO
3
or KCl was applied by transferring the plants
onto the refreshed nitrogen-free complemented media
(with KNO
3
and KCL). Then, the stopwatch was started.
Roots were then harvested every 3 minutes and immedi-
ately frozen in liquid nitrogen. It takes an average of 20
to 30 seconds to harvest a sample. For growth experi-
ments, plants were directly plated on petri dishes con-
taining agar (1%) so lidified media identical to the
hydroponic one described above.
RNA preparation and RT-QPCR analysis
Total RNA extraction was performed using Trizol™
Reagent acco rding to the manufacturer’s recommenda-
tions (Invitrogen, San Diego, CA, USA). Total RNA
(1 to 2 μg) was digested by DNase I (Sigma). RNA was
then revers e transcribed to one-st rand cDNA using
Thermo™ script RT (Invitrogen) according to the manu-
facturer’s protocol. Gene expression was determined b y
RT-QPCR (LightCycler; Roche Diagnostics, Basel, Swit-
zerland) using gene-specific primers (Additional file 7)
and LightCycler FastStart DNA Master SYBR Green
(Roche Diagnostics). Expression levels of tested genes
were normalized to expression levels of the ACT2/8 and
clathrin genes as described in [17].
Microarray hybridization
cDNA was synthesized from 2 μgtotalRNAusing
T7- Oligo(dT) promoter primer and reagents recom-
mended by Affymetrix (Santa Clara, CA, USA). Biotin-
labeled cRNA was synthesized according to the manu-
facturer’s protocol . Labeled cRNA (8 μg) was hybridized
to Arabidopsis ATH1 Affymetrix gene chip for 16 h at
45°C. Washing, staining and scanning were performed
as recommended by Affymetrix. Image analysis and nor-
malization to a target median intensity of 150 was
Krouk et al. Genome Biology 2010, 11:R123
/>Page 15 of 19
performed w ith the Affymetrix MAS v5.0 set at default
values. We analyzed the reproducibility of replicates
using the correlation coefficient and visual inspection of
scatter plots of pairs of replicates.
Modeling of gene expression patterns: clustering
methods
The microarray data reported in this paper have been
deposited in the Gene Expression Omnibus (GEO) data-
base [GEO:GSE20044]. Data manipulations were per-
formed in R [51]. All filtering steps were carried out by
controlling the FDR. The data set, corresponding to 26
ATH1 c hips times 22,810 probes, were analyzed in two
successive steps in order to increase the stringency and
precision of the analysis. The intent of the first step was
to narrow the focus to genes regulated by nitrate over
the entire data set or in intera ction with time. Thus, we
ran an ANOVA (aov() function) over the data set where
the signal of a probe i is Pi ~ μ + aN+bT+gT*N + ε,
where N is the effect of the nitrate treatment, T is the
effect of t ime, and T*N is the effect of their interaction,
μ is the mean signal over the data set, and ε the unex-
plained variance. We sorted out probes having a signifi-
cant call (P-value < 0.01; corresponding to 10% < FDR <
15%), for the effect of N and T* N. This first pass identi-
fied 2,159 probes corresponding to nitrogen-regulated
genes. On this narrowed data set (26 ATH1 chips times
2,159 probes), we modeled the gene e xpression using a
linear modeling approach (lm()) in order to determine
for each gene the particular time point that showed the
most marked effect of nitrate. Thus, the expression of a
gene (signal of a probe) was modeled such as P i = a
0
+
a
1
T+a
2
N+a
3
T*N + ε,wherea
0
represents th e signal
at ‘ time 0’ (before the treatment). This modeling
approach forces the model to take ‘time 0’ as a baseline
for the possible effe ct of NO
3
-
or KCl, allowing us to
eventually discriminate between the KNO
3
and KCl
effects. Thus, we called a probe regulated if it has a
positive call (FDR < 5%) for interaction with nitrate at a
particular time point.
The clustering shown in Figures 1 and 2 was per-
formed through MeV software [52]. The number of
clusters was determined using the figure of merit
(FOM) method [53], followed by a c lustering using
Pearson correlation as the distance, and the average as
method of aggregation. Additional file 8 provides the
KNO
3
/KCl ratio along the kinetic for the entire 550
regulated genes.
Randomization test
Data manipulations were performed in R [51]. We set
up a test to monitor whether the overlap between two
gene lists is higher than expected by chance. The test
consists of randomly selecting 10,000 gene lists of
Arabidopsis thaliana Gene Index (AGI) numbers, out of
thegenome,havingthesamesizeastheobservedlists.
Thus, we counted the number (n) of times that the
intersection size of the random lists is equal or higher
than the intersection observed for the two tested gene
lists. A P-value is thus generated equal to n/10,000. For
the generation of the matrix in Figure 3, the randomiza-
tion test was limited to 1,000 gene lists in order t o
speed up the analysis.
State-space model
Our SSM involves noisy but o bserved gene expression
data y(t) (black circles in Figure 4a), as well as idealized
but unobserved (’latent’) ge ne expression values z(t)(red
circles in Figure 4a). A s shown in Figure 4a, the relation-
ship between consecutive latent variables z(t
k
) and z(t
k+1
)
is a Markov chain: each latent gene’s expression value at
time t
k+1
is assumed to depend only on the state of
potentially all the latent gene expressions at the previous
time point t. For each gene i, this relationship stems from
the kinetic ODE involving the rate of m RNA change
(with a kinetic time constant τ), mRNA degradation, and
a linear function fi of transcription factor concentrations
for that specific gene. So-called ‘Brownian motion’
dynamics correspond to kinetic dynamics without the
mRNA degradation term. In linearized (discretized) form,
the overall dynamical model f can be represented by an n
×mmatri x F where n is the total number of genes and
m the number of transcription factors ( m<n,andtran-
scription factors are given indexes from 1 to m), plus a
bias term b an d a Gaussia n error term with z ero mean
and fixed covariance:
d
d
zt
t
zt f t t
tt
zt zt z
i
ii i
kk
ik ik i
()
() ( ()) ()
(( ) ())
+= +
−
−+
+
+
z
1
1
(() () ()
,,
tFztbt
kijjkiik
j
N
i
=++
=
∑
0
1
The obser vation model h is essentially an n×niden-
tity matrix with a Gaussian error term:
yt hzt t
yt zt t
iii
ik ik ik
() ( ()) ()
() () ()
=+
=+
An iterative procedure tries to learn the dynamical
relationship between latent gene expression variables
z(t) while maintaining the latent variables z(t)asclose
as possible to the observed Affimetrix measures y(t).
The algorithm consists of a) minimizing the sum of
quadratic errors of the dynamical and the observation
models with respect to the latent variables Z by using
gradient descent on the latent variables [25] (this is the
inference step), and b) minimizing the sum of quadratic
Krouk et al. Genome Biology 2010, 11:R123
/>Page 16 of 19
errors of the dynamical model using conjugate gradient,
LARS [42] or Elastic Nets [43] optimization on the para-
meters of F (this is the learning step). On a sequence Y of
T microarray measurements (including replicate sequences)
over n genes, corresponding latent variable s Z ,undera
dynamic model parameterized by transcription factor-gene
influence matrix F and bias term b, and for a given hyper-
param eter g (which controls the weight of the dynamical
and observation errors), the total error term for the infer-
ence step is:
ett
ik ik
k
T
i
n
γ
γ( , ; , ) || ( )|| || ( )||YZFb=+
()
==
∑∑
2
2
2
2
11
The solution of a non-SSM can be recovered by set-
ting g = 0, which amounts to having exactly Y = Z.
During the l earning step, sparse gene regulation net-
works are obtained by penalizing dense solutions using
L1-norm regularization, which amounts to addi ng a
l-weighted penalty to the dynamical error term, as in
the LASSO initially described by Ti bshirani [44].
Employing regularization on parameters of F also helps
to avoid local optima in the solutions.
The learning algorithm is run for 100 consecutive epochs
over all the replicate sequences (four replicate sequences
here). In order to retain the optimal set of parameters of f,
one selects the epoch where the dynamic error on t he
training dataset is mi nimal. The cross-validation data are
unseen during the optimization procedure. One run of the
learning procedure yields a matrix F of signed (positive
(excitatory) or negative (inhibitory)) interactions between
transcription factors a nd gen es. E ach eleme nt F
i,j
represents
the action of the j-th transcription f actor on the i-th gene.
Selection of gene regulation network by bootstrapping
The algorithm described above for learning SSMs starts
with random initial values for both the dynamical model
(in other words, matrix F) and for the latent variables Z.
We repeat the whole procedure 20 times in order to
perform the following bootstrapping evaluation. Each
run k of the algorithm might converge to a slightly dif-
ferent solution F
*(k)
. We then take the average transcrip-
tion factor-gene interaction weights obtained from all
solutions F
*(k)
and call it F*. Table 1 reports compara-
tive results on the average solutions.
In parallel, we also generate 1,000 random permutations
P
*(k,1)
, P
*(k,2)
, , P
*(k,1000)
of each matrix F*
(k)
,andthen
compute 1,000 average matrices P
*(1)
, P
*(2)
, ,P
*(1000)
of
those ‘scrambled’ matrices (we take th e averages over the
20 runs). We compare each average element F
i,j
* to the
empirical distribution of the 1,000 permuted averages and
thus obtain an empirical P-value. The final genetic regula-
tion network consists of elements F
i,j
* that have a P-value
< 0.001.
Software package
We provide online [54] our own SSM software, which is
based on publication [25] and implements the algorithm
described above. The software runs under Matlab (The
Mathworks Inc., Natick, MA, USA) and requires the
LARS library, designed by Karl Skoglund (IMM, DTU),
which is available as part of the BoLASSO Matlab package.
Additional material
Additional file 1: Description of significantly regulated genes and
their cluster assignment.
Additional file 2: High-resolution kinetics of response of genes to
NO
3
-
treatment. Levels of mRNA for nitrogen-responsive genes in
Arabidopsis roots in response to NO
3
-
treatment. Fourteen-day-old plants
grown in the presence of ammonium succinate were treated with 1 mM
KNO
3
or KCL (as a mock treatment). Plants were collected at 0 minutes
(before treatment) and 3, 6, 9, 12, 15, and 20 minutes after treatment.
Transcripts were measured in RNA from roots using RT-QPCR and Affy
ATH1 chips and normalized to two housekeeping genes (see Materials
and methods). The data represent the mean ± standard error of three
and two biological replicates for QPCR and Affymetrix measurements,
respectively. Correlations between QPCR- and Affy-detected fold change
results are provided in the third column.
Additional file 3: Gene Ontology functions over-represented in
NO
3
-
-regulated gene lists.
Additional file 4: Gene Ontology functions over-represented in NO
3
-
clusters.
Additional file 5: SPL9 over-expression modifies NO
3
-
kinetic
responses of transcription factors. Transcription factor mRNA levels in
roots of wild type and transgenic pSPL9:rSPL9 in response to NO
3
-
treatment. Fourteen-day-old plants grown in ammonium succinate were
treated with 1 mM KNO
3
versus KCl. Roots were collected at 0 minutes
(before treatment) and 10, 20, 40, and 60 minutes after the treatment.
Sentinel transcripts were measured in roots using RT-QPCR and
normalized to two housekeeping genes (see Materials and methods). The
data represent the mean ± standard error of three biological replicates
(three independent experiments). Differences between the two
genotypes are statistically significant at *P < 0.05, **P < 0.01, and ***P <
0.001 (t-test).
Additional file 6: NO
3
-
presence enhances pSPL9:rSPL9 phenotypes.
Wild type and pSPL9:rSPL9 have been plated on the same background
media as used for kinetic experiments (see Materials and methods) and
complemented with either 0.5 mM (NH
4
)
2
-succinate or 1 mM KNO
3
.
Eight days after germination, different root traits were scored (n = 13 to
24 plants). ANOVA was used to evaluate the genotype effect (Geno: wild
type versus pSPL9:rSPL9); the treatment effect (Treat: nitrate versus
ammonium) and the interaction of these two factors (G × T). P-values are
provided above each plot corresponding to different root parameters.
***P < 0.001; **P < 0.01; *P < 0.05. NO
3
-
presence significantly enhances
transgene effect for lateral root number, total lateral root length, lateral
root density, and lateral root length density. The average length of lateral
roots is not significantly controlled by the pSPL9:rSPL9 transgene.
Additional file 7: QPCR primers used in this study.
Additional file 8: KNO
3
/KCl gene expression ratio of significantly
regulated genes (see also raw data [GEO:GSE20044]).
Krouk et al. Genome Biology 2010, 11:R123
/>Page 17 of 19
Abbreviations
FDR: false discovery rate; LARS: least-angle regression and shrinkage; LASSO:
least absolute shrinkage and selection operator; ODE: ordinary differential
equation; RT-QPCR: real time quantitative PCR; SSM: state space model.
Acknowledgements
The pSPL9:rSPL9 seeds were kindly provided by the Detlef Weigel lab. This
work was supported by: NIH Grant GM032877 to GC and DS; a NSF
Arabidopsis 2010 grant MCB-0929338 to GC and DS. Modeling tools are
developed under NSF DBI-0445666 to GC and DS. GK is supported by a
European-FP7-International Outgoing Fellowship (Marie Curie) (AtSYSTM-
BIOL; PIOF-GA-2008-220157). DS is also supported by IIS-0414763. YL is
supported by a grant NSF ITR-0325463: ITR: New directions in predictive
learning. We thank Dr Sandrine Ruffel for her useful comments on the
manuscript.
Author details
1
Center for Genomics and Systems Biology, Department of Biology, New
York University, 100 Washington Square East, 1009 Main Building, New York,
NY 10003, USA.
2
Biochimie et Physiologie Moléculaire des Plantes, UMR 5004
CNRS/INRA/SupAgro-M/UM2, Institut de Biologie Intégrative des Plantes,
Place Viala, 34060 Montpellier Cedex, France.
3
Courant Institute of
Mathematical Sciences, New York University, New York, NY 10003, USA.
Authors’ contributions
GK, DS, and GC designed the study. GK carried out the experiments. GK
performed transcriptome data analysis. GK and DS developed the
randomization test to infer signal convergence. PM, DS, and YL developed
the machine learning approach and the SSM algorithm. GK, PM, DS, and GC
wrote the paper.
Received: 22 May 2010 Revised: 14 September 2010
Accepted: 23 December 2010 Published: 23 December 2010
References
1. Crawford NM: Nitrate - nutrient and signal for plant-growth. Plant Cell
1995, 7 :859-868.
2. Krouk G, Crawford NM, Coruzzi GM, Tsay YF: Nitrate signaling: adaptation
to fluctuating environments. Curr Opin Plant Biol 2010, 13:266-273.
3. Ruffel S, Krouk G, Coruzzi GM: A systems view of responses to nutritional
cues in Arabidopsis: toward a paradigm shift for predictive network
modeling. Plant Physiol 2010, 152:445-452.
4. Vidal EA, Gutierrez RA: A systems view of nitrogen nutrient and
metabolite responses in Arabidopsis. Curr Opin Plant Biol 2008, 11:521-529.
5. Wang R, Guegler K, LaBrie ST, Crawford NM: Genomic analysis of a
nutrient response in Arabidopsis reveals diverse expression patterns and
novel metabolic and potential regulatory genes induced by nitrate. Plant
Cell 2000, 12:1491-1510.
6. Wang R, Okamoto M, Xing X, Crawford NM: Microarray analysis of the
nitrate response in Arabidopsis roots and shoots reveals over 1,000
rapidly responding genes and new linkages to glucose, trehalose-6-
phosphate, iron, and sulfate metabolism. Plant Physiol 2003, 132:556-567.
7. Wang R, Tischner R, Gutierrez RA, Hoffman M, Xing X, Chen M, Coruzzi G,
Crawford NM: Genomic analysis of the nitrate response using a nitrate
reductase-null mutant of Arabidopsis. Plant Physiol 2004, 136:2512-2522.
8. Scheible WR, Morcuende R, Czechowski T, Fritz C, Osuna D, Palacios-
Rojas N, Schindelasch D, Thimm O, Udvardi MK, Stitt M: Genome-wide
reprogramming of primary and secondary metabolism, protein
synthesis, cellular growth processes, and the regulatory infrastructure of
Arabidopsis in response to nitrogen. Plant Physiol 2004, 136:2483-2499.
9. Krouk G, Tranchina D, Lejay L, Cruikshank AA, Shasha D, Coruzzi GM,
Gutierrez RA: A Systems approach uncovers restrictions for signal
interactions regulating genome-wide responses to nutritional cues in
Arabidopsis. PLoS Comput Biol 2009, 5:e1000326.
10. Gifford ML, Dean A, Gutierrez RA, Coruzzi GM, Birnbaum KD: Cell-specific
nitrogen responses mediate developmental plasticity. Proc Natl Acad Sci
USA 2008, 105:803-808.
11. Gutierrez RA LL, Dean A, Chiaromonte F, Shasha DE, Coruzzi GM:
Qualitative network models and genome-wide expression data define
carbon/nitrogen-responsive molecular machines in Arabidopsis. Genome
Biol 2007, 8:R7.
12. Ruffel S, Freixes S, Balzergue S, Tillard P, Jeudy C, Martin-Magniette ML, van
der Merwe MJ, Kakar K, Gouzy J, Fernie AR, Udvardi M, Salon C, Gojon A,
Lepetit M: Systemic signaling of the plant nitrogen status triggers
specific transcriptome responses depending on the nitrogen source in
Medicago
truncatula. Plant Physiol 2008, 146:2020-2035.
13. Nero D, Krouk G, Tranchina D, Coruzzi GM: A system biology approach
highlights a hormonal enhancer effect on regulation of genes in a
nitrate responsive “biomodule”. BMC Syst Biol 2009, 3:59.
14. Gutierrez RA, Gifford ML, Poultney C, Wang R, Shasha DE, Coruzzi GM,
Crawford NM: Insights into the genomic nitrate response using genetics
and the Sungear Software System. J Exp Bot 2007, 58:2359-2367.
15. Remans T, Nacry P, Pervent M, Filleur S, Diatloff E, Mounier E, Tillard P,
Forde BG, Gojon A: The Arabidopsis NRT1.1 transporter participates in the
signaling pathway triggering root colonization of nitrate-rich patches.
Proc Natl Acad Sci USA 2006, 103:19206-19211.
16. Krouk G, Lacombe B, Bielach A, Perrine-Walker F, Malinska K, Mounier E,
Hoyerova K, Tillard P, Leon S, Ljung K, Zazimalova E, Benkova E, Nacry P,
Gojon A: Nitrate and auxin transport by NRT1.1 defines a mechanism for
nutrient sensing in plants. Dev Cell 2010, 18:927-937.
17. Krouk G, Tillard P, Gojon A: Regulation of the high-affinity NO3- uptake
system by NRT1.1-mediated NO3- demand signaling in Arabidopsis. Plant
Physiol 2006, 142:1075-1086.
18. Muños S, Cazettes C, Fizames C, Gaymard F, Tillard P, Lepetit M, Lejay L,
Gojon A: Transcript profiling in the chl1-5 mutant of Arabidopsis reveals
a role of the nitrate transporter NRT1.1 in the regulation of another
nitrate transporter, NRT2.1. Plant Cell 2004, 16:2433-2447.
19. Wang R, Xing X, Wang Y, Tran A, Crawford NM: A genetic screen for
nitrate regulatory mutants captures the nitrate transporter gene NRT1.1.
Plant Physiol 2009, 151:472-478.
20. Ho CH, Lin SH, Hu HC, Tsay YF: CHL1 functions as a nitrate sensor in
plants. Cell 2009, 138:1184-1194.
21. Hu HC, Wang YY, Tsay YF: AtCIPK8, a CBL-interacting protein kinase,
regulates the low-affinity phase of the primary nitrate response. Plant J
2009, 57:264-278.
22. Castaings L, Camargo A, Pocholle D, Gaudon V, Texier Y, Boutet-Mercey S,
Taconnat L, Renou JP, Daniel-Vedele F, Fernandez E, Meyer C, Krapp A: The
nodule inception-like protein 7 modulates nitrate sensing and
metabolism in Arabidopsis. Plant J 2009, 57:426-435.
23. Rubin G, Tohge T, Matsuda F, Saito K, Scheible WR: Members of the LBD
family of transcription factors repress anthocyanin synthesis and affect
additional nitrogen responses in Arabidopsis.
Plant Cell 2009,
21:3567-3584.
24.
Zhang H, Forde BG: An Arabidopsis MADS box gene that controls
nutrient-induced changes in root architecture. Science 1998, 279:407-409.
25. Mirowski P, LeCun Y: Dynamical factor graphs for time series modeling.
Lecture Notes Artificial Intelligence 2009, 5782:128-142.
26. Bowsher CG, Lacey AE, Hanke GT, Clarkson DT, Saker LR, Stulen I, Emes MJ:
The effect of Glc6P uptake and its subsequent oxidation within pea root
plastids on nitrite reduction and glutamate synthesis. J Exp Bot 2007,
58:1109-1118.
27. Lejay L, Wirth J, Pervent M, Cross JM, Tillard P, Gojon A: Oxidative pentose
phosphate pathway-dependent sugar sensing as a mechanism for
regulation of root ion transporters by photosynthesis. Plant Physiol 2008,
146:2036-2053.
28. Peng M, Bi YM, Zhu T, Rothstein SJ: Genome-wide analysis of Arabidopsis
responsive transcriptome to nitrogen limitation and its regulation by the
ubiquitin ligase gene NLA. Plant Mol Biol 2007, 65:775-797.
29. Nemhauser JL, Hong F, Chory J: Different plant hormones regulate similar
processes through largely nonoverlapping transcriptional responses. Cell
2006, 126:467-475.
30. Rubio V, Bustos R, Irigoyen ML, Cardona-Lopez X, Rojas-Triana M, Paz-Ares J:
Plant hormones and nutrient signaling. Plant Mol Biol 2009, 69:361-373.
31. Jaeger J, Monk N: Reverse engineering of gene regulatory networks. In
Learning and Inference in Computational Systems Biology. Edited by:
Lawrence N, Girolami M, Rattray M, Sanguinetti G. Cambridge MA: MIT
Press; 2010.
32. Bonneau R, Facciotti MT, Reiss DJ, Schmid AK, Pan M, Kaur A, Thorsson V,
Shannon P, Johnson MH, Bare JC, Longabaugh W, Vuthoori M,
Whitehead K, Madar A, Suzuki L, Mori T, Chang DE, Diruggiero J,
Johnson CH, Hood L, Baliga NS: A predictive model for transcriptional
control of physiology in a free living cell. Cell 2007, 131:1354-1365.
Krouk et al. Genome Biology 2010, 11:R123
/>Page 18 of 19
33. Bonneau R, Reiss DJ, Shannon P, Facciotti M, Hood L, Baliga NS, Thorsson V:
The Inferelator: an algorithm for learning parsimonious regulatory
networks from systems-biology data sets de novo. Genome Biol 2006, 7:
R36.
34. Wang Y, Joshi T, Zhang XS, Xu D, Chen L: Inferring gene regulatory
networks from multiple microarray datasets. Bioinformatics 2006,
22:2413-2420.
35. Shimamura T, Imoto S, Yamaguchi R, Fujita A, Nagasaki M, Miyano S:
Recursive regularization for inferring gene networks from time-course
gene expression profiles. BMC Syst Biol 2009, 3:41.
36. Murphy K, Mian S: Modelling Gene Expression Data using Dynamic Bayesian
Networks. Technical report Computer Science Division, University of
California and Life Sciences Division, Lawrence Berkeley National Laboratory;
1999.
37. Beal M, Falciani F, Ghahramani Z, Rangel C, Wild D: A Bayesian approach
to reconstructing genetic regulatory networks with hidden factors.
Bioinformatics 2005, 21:349-356.
38. Angus J, Beal M, Li J, Rangel C, Wild D: Inferring transcriptional networks
using prior biological knowledge and constrained state-space models. In
Learning and Inference in Computational Systems Biology. Edited by:
Lawrence ND, Girolami M, Rattray M, Sanguinetti G. Cambridge: MIT Press;
2010:117-152.
39. Zhang Y, Hatch KA, Bacon J, Wernisch L: An integrated machine learning
approach for predicting DosR-regulated genes in Mycobacterium
tuberculosis. BMC Syst Biol 2010, 4:37.
40. Wahde M, Hertz J: Modeling genetic regulatory dynamic in neural
development. J Comput Biol 2001, 8:429-442.
41. Lozano AC, Abe N, Liu Y, Rosset S: Grouped graphical Granger modeling
for gene expression regulatory networks discovery. Bioinformatics 2009,
25:i110-118.
42. Efron B, Hastie T, Jonnstone I, Tibshirani R: Least angle regression. Ann Stat
2004, 32:407-499.
43. Zhu H, Hastie T: Regularization and variable selection via the elastic net.
J R Stat Soc 2005, 67:301-320.
44. Tibshirani R: Regression shrinkage and selection via the lasso. J R Stat Soc
2006, 58:267-288.
45. Schwarz S, Grande AV, Bujdoso N, Saedler H, Huijser P: The microRNA
regulated SBP-box genes SPL9 and SPL15 control shoot maturation in
Arabidopsis. Plant Mol Biol 2008, 67:183-195.
46. Wang JW, Czech B, Weigel D: miR156-regulated SPL transcription factors
define an endogenous flowering pathway in Arabidopsis thaliana. Cell
2009, 138:738-749.
47. Wu G, Park MY, Conway SR, Wang JW, Weigel D, Poethig RS: The
sequential action of miR156 and miR172 regulates developmental
timing in Arabidopsis. Cell 2009, 138:750-759.
48. Wang JW, Schwab R, Czech B, Mica E, Weigel D: Dual effects of miR156-
targeted SPL genes and CYP78A5/KLUH on plastochron length and
organ size in Arabidopsis thaliana. Plant Cell 2008, 20:1231-1243.
49. Pant BD, Musialak-Lange M, Nuc P, May P, Buhtz A, Kehr J, Walther D,
Scheible WR: Identification of nutrient-responsive Arabidopsis and
rapeseed microRNAs by comprehensive real-time polymerase chain
reaction profiling and small RNA sequencing. Plant Physiol 2009,
150:1541-1555.
50. Hsieh LC, Lin SI, Shih AC, Chen JW, Lin WY, Tseng CY, Li WH, Chiou TJ:
Uncovering small RNA-mediated responses to phosphate-deficiency in
Arabidopsis by deep sequencing. Plant Physiol 2009, 151:2120-2132.
51. R project website. [ />52. MeV software. [ />53. Yeung KY, Haynor DR, Ruzzo WL: Validating clustering for gene
expression data. Bioinformatics 2001, 17:309-318.
54. Source code for SSM. [ />doi:10.1186/gb-2010-11-12-r123
Cite this article as: Krouk et al.: Predictive network modeling of the
high-resolution dynamic plant transcriptome in response to nitrate.
Genome Biology 2010 11:R123.
Submit your next manuscript to BioMed Central
and take full advantage of:
• Convenient online submission
• Thorough peer review
• No space constraints or color figure charges
• Immediate publication on acceptance
• Inclusion in PubMed, CAS, Scopus and Google Scholar
• Research which is freely available for redistribution
Submit your manuscript at
www.biomedcentral.com/submit
Krouk et al. Genome Biology 2010, 11:R123
/>Page 19 of 19