Báo cáo y học: " Strong functional patterns in the evolution of eukaryotic genomes revealed by the reconstruction of ancestral protein domain repertoi" doc
Bạn đang xem bản rút gọn của tài liệu. Xem và tải ngay bản đầy đủ của tài liệu tại đây (603.75 KB, 13 trang )
RESEARCH Open Access
Strong functional patterns in the evolution of
eukaryotic genomes revealed by the
reconstruction of ancestral protein domain
repertoires
Christian M Zmasek, Adam Godzik
*
Abstract
Background: Genome size and complexity, as measured by the number of genes or protein domains, is
remarkably similar in most extant eukaryotes and generally exhibits no correlation with their morphological
complexity. Underlying trends in the evolution of the functional content and capabilities of different eukaryotic
genomes might be hidden by simultaneous gains and losses of genes.
Results: We reconstructed the domain repertoires of putative ancestral species at major divergence points,
including the last eukaryotic common ancestor (LECA). We show that, surprisingly, during eukaryotic evolution
domain losses in general outnumber domain gains. Only at the base of the animal and the vertebrate sub-trees do
domain gains outnumber domain losses. The observed gain/loss balance has a distinct functional bias, most
strikingly seen during animal evolution, where most of the gains represent domains involved in regulation and
most of the losses represent domains with metabolic functions. This trend is so consistent that clustering of
genomes according to their functional profiles results in an organization similar to the tree of life. Furthermore, our
results indicate that metabolic functions lost during animal evolution are likely being replaced by the metab olic
capabilities of symbiotic organisms such as gut microbes.
Conclusions: While protein domain gains and losses are common throughout eukaryote evolution, losses
oftentimes outweigh gains and lead to significant differences in functional profiles. Results presented here provide
additional arguments for a complex last eukaryotic common ancestor, but also show a general trend of losses in
metabolic capabilities and ga in in regulatory complexity during the rise of animals.
Background
Eukaryotic organisms exhibit an enormous diversity on
many different levels [1]. Besides vast v ariance in size,
appearance, ecology, and behavior, they also display
massive vari ation in their morphological and behavioral
complexity, ranging from unicellular protists to basal
animals, such as Trichoplax adhaerens with no internal
organs and only four different cell types [2] to mammals
with multiple internal organs, a complex nervous sys-
tem, and around 210 different cell types [3,4]. Yet, the
number of protein coding gene s present in eukaryotic
genomes remains remarkably constant and does not
appear to correlat e with perc eived morphological and
behavioral complexity. For example, the human g enome
is estimated to be composed of ar ound 20,500 protein
coding genes [5], whereas the simple roundworm
Caenorhabditis elegans possesses about 19,000 protein
coding genes [6], and the morphologically more com-
plex fruit fly Drosophila melanogaster has a genome of
only about 14,000 genes [7]. In order to explain this so
called ‘gene-number paradox’ [8], numerous hypotheses
have been put forward. For instance, dramatic differ-
ences in morphological complexity, given relatively simi-
lar numbers of protein coding genes, have been
explained with an increasing role of non-coding RNA
transcription (for example, [8,9]), alternative splicing
* Correspondence:
Program in Bioinformatics and Systems Biology, Sanford-Burnham Medical
Research Institute, 10901 North Torrey Pines Road, La Jolla, CA 92037, USA
Zmasek and Godzik Genome Biology 2011, 12:R4
/>© 2011 Zmasek and Godzik; licensee BioM ed Central Ltd. This is an open access article distributed under the terms of the Creative
Commons Attr ibution License ( which permits unrestricte d use, distribution, and
reproduction in any medium, provided the original work is properly cited.
[10], transposable elements [11], detailed transcriptional
control enabling a tight temporal and spatial control of
gene expression [12], the complexity of domain organi-
zation of proteins [13,14], and expansion of select gene
families [15,16].
While biologists have long b een enthralled b y the vast
diversity found amongst modern eukaryotes, the under-
lying evolutionary history that led to this vast diversity
is at least equally fascinating and is likely to help our
understanding of extant organisms and their molecular
biology. An intuitive view of eukaryote evolution is that
the last eukaryotic common ancestor (LECA) was ‘sim-
ple’ and that accretion of features over time led to com-
plex, multicellular organisms, such as plants and
animals. Recently, an increasing number of studies are
surfacing that suggest that many aspects of the LECA
might not have been ‘ simple’ and that it probably
already had many features commonly associated with
modern eukaryotes [17]. For example, recent work sug-
gests that the LECA already had an endomembrane sys-
tem with near modern complexity (reviewed in [18]), as
well as a complex cell division m achinery [19]. Numer-
ous studies show that the LECA also had a relatively
large number of genes and that gene loss is a likely a
significant contributor to the composition of modern
genomes [16,20-22].
A succinct way to describe the functional potential of
large groups of genes, such as complete genomes or
metagenomes, is to list and analyze the set of recognized
domains present in proteins encoded by the genes in a
given group. Recently, a term ‘domainome’ was pro-
posed for such sets [23]. Protein domains are minimal
structural and evolutionary units in proteins, retai ning
their structure and usually their function even when
being part of proteins with different domain architec-
tures [24]. Information about recognized protein
domains is collected in public resources such as Pfam
[25] or InterPro [26], which also provide information
about functions of individual domains (if available), both
in the form of short narratives as well as mappings into
formalized functional classifications, such as the gene
ontology (GO) [27].
In this work, we investigate the evolution of the
domain repertoires of eukaryotic genomes. To gain a
more complete picture of this evolution, we recon-
struct the domainomes of ancestral species at impor-
tant branching points of the eukaryotic tree of life,
such as the LECA and the Urbilateria (the last com-
mon ancestor of protostome a nd deuterostome ani-
mals). While parts of putative genomes for relatively
recent ancestral species have been reconstructed suc-
cessfully (such as for the ancestor of placental mam-
mals [28]; reviewed in [29]), due to vastly greater
evolutionary distances and such effects as domain
shuffling, we chose to reconstruct ancestral protein
domain sets (domainomes) as opposed to complete
sets of genes or entire genomes.
Results
Protein domain composition of extant and ancestral
genomes
We analyzed complete sets of predicted proteins for
114 eukaryotic genomes, including 73 from opistho-
konta (38 me tazoa, 1 choanoflagel late, and 34 fungi), 3
from amoebozoa, 17 from archaeplastida, 16 from
chromalveolata, and 5 from excavate, thus covering 5
of the 6 eukaryotic ‘ supergroups’ [30,31] (we were
unable to obtain any complete genomes for the ‘super-
group’ Rhizaria [32]), for the presence of protein
domains, as defined by Pfam [25] (Figure 1; Additional
file 1) The number of distinct protein domains varies
from roughly 2,000 in the free living unicellular ciliate
Paramecium tetraurelia to 3,140 in one of the simplest
multicellular animals, Trichoplax adhaerens,toabout
4,240 in humans (Figure 2c; for detailed counts see
Additional files 2, 3, and 4). These numbers follow the
expected trend of genomes of more complex organisms
containing more domains; however, they include many
apparent contradictions where more morphologically
complex organisms contain fewer domains than less
complex ones. To understand the evolutionary history
of the observed domain distribution in extant species,
we reconstructed the domain content of ancestral gen-
omes, specifically those lying at internal nodes corre-
sponding to major branching points in the evolution of
eukaryotes. Since independent evolution of the same
domain more than once is highly unlikely, we used
Dollo parsimony, which, when applied to domain con-
tent, states that each domain can be gained only once,
and seeks to minimize domain losses, to reconstruct
the Pfam domain repertoire of ancestral eukaryotes
[33-38] (Figure 2).
The evolution of most eukaryotic groups is dominated by
protein domain losses and not by domain gains
While the number of distinct domains found in extant
species shows a weakly growing trend (with outliers)
with t he apparent morphological complexity (Figure 2c;
for detailed counts see Additional file 2), comparing
these numbers to those for the inferred ancestral gen-
omes shows that the evolution of eukaryotes is defined
by a balance between domain losses and gains, with the
latter dominating at almost every branch o f the tree of
life (Figure 2b; Additional files 3 and 4). Unexpectedly,
with a repertoire of about 4,400 distinct domains the
LECA already had a large domain repertoire, that is, lar-
ger than any of the currently existing species. The two
significant exceptions to this trend are the rise and early
Zmasek and Godzik Genome Biology 2011, 12:R4
/>Page 2 of 13
evolution of multicellular animals, roughly 650 to 500
million years ago, and the origin of vertebrates, around
450 million years ago losses (divergence time estimates
are from [39]) - in these two cases domain gains signifi-
cantly outnumber. Interestingly, the early evolution of
the two major groups of bilaterians, the deuterostomes
and protostomes are associated with a particularly high
number in lost domains (about 366 losses and 11 gains
for deuterostomes and 252 losses and 16 gains for
protostomes).
Less extensive domain losses in lophotrochozoans than in
ecdysozoans
Our results show that some lineages went through a
massive loss of domains. This phenomenon has been
noticed previously for ecdysozoans in general, and for
nematodes in particular [21,40-42]. In contrast, the
other major group of protostomes, the lophotrochozo-
ans, went through a less extreme gene loss when com-
pared to l ast common ancest or of deuter ostomes and
protostomes (the Urbilateria). The do mainome of the
lophotrochozoan ancestor, reconstructed from the
domainomes of three f ree living lophotrochozoans, two
annelids (the polychaete worm Capitella teleta and the
leech Helobdella robusta) and one mollusk (the snail
Lottia g igantea)islargerthanthatofecdysozoans,and
the numbers of domains gained and lost relative to the
Urbilateria are smaller (Table 1). This further confirms
earlier speculation that lophotrochozoans are less
derived from the Urbilateria than ecdysozoans [41].
An unexpectedly large domainome in the sea anemone
Nematostella vectensis
Another striking finding is the comparatively large
domain repertoire of the cnidarian Nematostella vecten-
sis (Starlet sea anemone) [43], especially relative to pro-
tostomes. Cnidarians are relatively simple in their
morphology, h aving around 10 c ell types [4], compared
to protostomes, which are estimated to have between 30
and 50 distinct cell types [44]. This morphological sim-
plicity of cnidarians clearly is not reflected in the gen-
ome content of N. vectensis, as its number of domains
(approximately 3,700) is comparable to that of lophotro-
chozoans and surpasses all ecdysozoans analyzed here.
This unexpected ‘ genomic’ complexity (as opposed to
morphological complexity) of N. vectensis (and likely
other cnidarians as well) has also been noted on the
level of regulatory networks (for example, in [45,46]).
This is the best example illustrating a recurrent observa-
tion that the number of distinct protein domains is a
poor predictor for morphological complexity.
Functional consequences of domain gains and losses
As seen for the example of Nematostella and other out-
liers (Figure 2c; for detailed counts see Additional file 2),
numbers of distinct domains do not correlate with com-
plexity amongst eukaryotes. A likel y explanation for th is
paradox may lie in the distribution of functions of
domains, rather than in their numbers. To make infer-
ences about the functional aspect of domain gains and
losses, we defined functional profiles of domainomes by
assigning individual domains with functions from the GO
classification [27]. This allowed us to define a functional
profile for each extant and inferred ancestral domainome,
as well as for each set of gained and lost domains on
every branch of the eukaryote tree of life (for details see
the Materials and methods section). The first finding is
that the functional profiles of sets of domains lost and
gained at most branching points differ drastically: on the
path leading from the LECA to mammals, domains with
regulatory functions exhibit a net gain, while domains
with metabolic functions show a net loss (Table 2). This
effect is strongest for mammals and less pronounced for
other metazoans. In contrast, for all other groups of
eukaryotes, both regulatory domains and metabolic
domains show a net loss, although with the net loss for
regulatory domains being significantly sma ller than that
for metabolic domains. For instance, during flo wering
Excavata (e.g. Metamonada, Kinetoplastida) [5]
Rhizaria [0]
Chromalveolata (e.g. Heterokonta, Alveolata, Aconoidasida) [16
]
Archaeplastida (plants, green and red algae) [17]
Amoebozoa (e.g. lobose amoeboids, slime molds) [3]
Opisthokonta
Cabozoa
Corticata
Unikonta
Bikonta
LECA
Fungi [34]
Choanozoa [1]
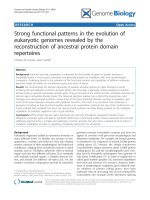
Metazoa (animals) [38]
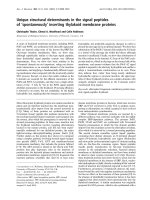
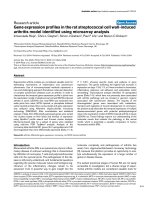
Figure 1 An overview of a current model of eukaryote evolution [30,67]. Numbers in brackets indicate the number of genomes from each
branch analyzed in this work.
Zmasek and Godzik Genome Biology 2011, 12:R4
/>Page 3 of 13
LECA
Unikonta
+79
0
Opisthokonta
+160
-45
Metazoa & Choanoflagellata
+61
-292
Metazoa
+193
-84
Eumetazoa (Bilateria & Cnidaria)
+156
-23
Bilateria
+187
-79
Deuterostomia
+11
-366
Chordata
+43
-20
+9
-83
Vertebrata
+215
-73
Tetrapoda
+19
-40
Amniota
+28
-221
Mammalia
+15
-24
Diapsida
+2
-164
X. tropicalis
+41
-481
Teleostei
0
-318
Urochordata
0
-833
B. floridae
+5
-613
S. purpuratus
+4
-777
Protostomia
+16
-252
Ecdysozoa
+8
-484
Arthropoda
+14
-128
Nematoda
+15
-741
Lophotrochozoa
0
-293
N. vectensis
+36
-941
T. adhaerens
+13
-1374
M. brevicollis
+4
-1711
Fungi
+3
-975
+67
-11
Dikarya
+82
-125
Ascomycota
+49
-119
Basidiomycota
0
-402
Mucoromycotina
+1
-741
E. cuniculi
+5
-2757
Amoebozoa
0
-1572
Dictyostelium
+12
-107
E. histolytica
+5
-1497
Bikonta
+39
0
Corticata
+168
-102
Archaeplastida
+44
-399
Viridiplantae
+60
-41
Embryophyta
+120
-389
Chlorophyta
+4
-624
C. merolae
+10
-2048
Chromalveolate
+14
-542
+3
-131
Alveolata
0
-1062
Heterokonta
+2
-292
E. huxleyii
+12
-1142
Excavata
+1
-14
65
4102
3857
4019
3904
2867
3804
3616
3256
2984
3605
3731
3142
2687
2830
2610
2742
901
2725
1446
3361
2672
2143
1569
2530
2878
1752
4266
4459
4480
4412
4389
4744
4636
4503
4394
4625
4510
4431
(c)
(a)
(b)
4
000
0
4000
0
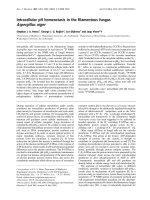
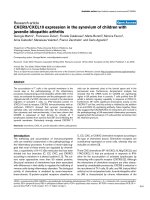
Figure 2 Domain gains and losses during eukaryote evolution. (a) Inferred domainome sizes for ancestral genomes on the path from th e
LECA to mammals are shown on the left. (b) The numbers of gained protein domains per branch (edge), inferred by Dollo parsimony, are
shown in green, whereas inferred losses are shown in red. (c) The numbers of distinct domains per genome in extant species are shown on the
right side; for groups of species represented as triangles, these numbers are averages. Species, or groups of species, that are mostly parasitic are
shown in grey. For more detailed data see Additional files 3 and 4. This figure was made using ‘gathering’ cutoffs provided by Pfam; for a
corresponding figure using a E-value cutoff of 10
-8
, see Additional file 13.
Zmasek and Godzik Genome Biology 2011, 12:R4
/>Page 4 of 13
plant (Magnoliophyta) evolution, regulatory domains
show an average, per branch, net loss of 5.6, and meta-
bolic domains exhibit a net loss of 18.8. For mushrooms
with complex fruiting bodies (homobasidiomycetes) [47],
these values are 9.3 for net losses of regulatory domains,
and 38.5 for net losses of metabolic domains.
Applying GO term enrichment analysis, as commonly
employed for microarray analysis [48], to the functions
of lost and gained domains enabled us to obtain a more
detailed view of the interplay between domain losses
and gains (Tables 3 and 4). Within an overall increase
in domains involved in regulation, our results show that
animal evolution on a genome level is specifically asso-
ciated with enrichment of protein domains involved in
DNA-dependent transcriptional regulation, cell-matrix
adhesion, apoptosis (programmed cell death), signal
transduction (for example, G-protein coupled receptor
protein signaling, mitogen-activated protein kinase
kinase (MAPKK) activity), and various aspects of
immune system functions (in particular cytokine and
major histocompatibility complex-related domains).
While most of the enriched categories can be classified
as ‘ regulatory’ ,some‘ metabolic’ categories are also
enriched. In particular, a number of domains involved
in mitochondrial electron transport appeared at the root
of the bilaterian tree, and domains involved in lipid
catabolic process appeared during the evolution of the
first chordates. On the other hand, domain losses during
animal evolution are predominantly associated with
amino acid biosynthesis and carbohydrate metabolism.
The only exception to this trend is an unexpected loss
of numerous domains with functions in DNA-dependent
transcriptional regulation during the evolution of the
amniote ancestor. Figure 3 shows the effects of these
gains and losses on the composition of the ancestral
genomes during animal e volution (for lists of individual
domains and their corresponding GO terms, see Addi-
tional files 5 an d 6). The most drastic changes occurred
around the rise of the first animals, whereas after the
appearance of the first tetrapods, changes on the func-
tional level of the genome are minimal. Most categories
involved in regulation show an increase over time, with
most of the effect seen during the rise of the first ani-
mals, followed by a more gradual increase. In contrast,
categories involved in metabolism almost show a mirror
image, an accelerated loss during the evolution of the
first animals. The most drastic losses are in c arbohy-
drate and amino acid metabolism. As expected, vitamin
and cofactor biosynthesis also show significant losses.
The only metabolic category that remains u nchanged is
nucleotide metabolism.
Alternative topologies of eukaryotic tree of life
It is important to stress that all the calculations pre-
sented so far crit ically depend upon the exact topology
of the e ukaryote evolutionary tree used for the parsi-
mony based infer ence of ance stral domainomes. Addi-
tional files 7, 8, 9, and 10 show the results for different
models for the eukaryote tree, and are discussed below.
Classifying eukaryotes by the functional profiles of their
genomes reproduces the tree of life
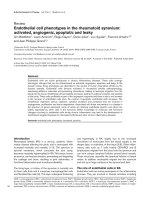
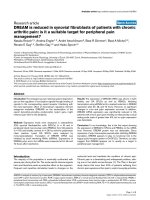
Figure 4 shows a representation of the eukaryotic evolu-
tionary tree in which th e usual time and taxonomic axes
are replaced by axes representing the percentage of
domains involved in signal transduction and the percen-
tage of domains with catalytic activity. Interestingly, this
results in a graph clearly separating most major groups
of eukaryotes. From this graph it is apparent that, on a
functional level, vertebrate genomes (shown in red), as
well as those of certain unicellular, chiefly parasitic,
organisms, especially Kinetoplastida (for example, the
sleeping sickness parasite Trypanosoma brucei)and
Table 1 Protein domain gains and loss comparison between lophotrochozoans and ecdysozoans
Ancestor domains Extant domains
Gains Losses Present Mean Standard deviation Genomes analyzed
Lophotrochozoans 16 545 4,215 3,605 320 3
Annelids 16 721 4,039 3,602 393 2
Ecdysozoans 24 736 4,032 3,202 190 12
Arthropods 38 864 3,918 3,256 172 9
Nematodes 39 1,477 3,306 3,039 143 3
In this table, gains and losses are relative to the last common ancestor of deuterostomes and protostomes, the Urbi lateria. For the calculation of extant domain
statistics, data from parasitic species is omitted (the nematode Brugia malayi and the flatworm Schistosoma mansoni).
Table 2 Functional differences in gained and lost
domains
Biological
regulation
Metabolic
process
Gains Losses Gains Losses
LECA to mammals 12.0 5.2 8.1 21.6
LECA to plants 2.6 8.2 14.7 33.5
LECA to homobasidiomycetes 4.3 13.6 7.3 45.8
Average domain gain/loss counts per tree branch (edge) are shown.
Zmasek and Godzik Genome Biology 2011, 12:R4
/>Page 5 of 13
Table 3 Enriched gained and lost Gene Ontology terms along path from Unikonta to Mammalia
Enriched gained GO terms P-
value
Enriched lost GO terms P-
value
Unikonta Protein import into peroxisome matrix,
docking
9.5E-3
cAMP catabolic process 1.9E-2
Organelle organization* 2.6E-2
Opisthokonta Regulation of primary metabolic process 1.3E-2 Protein-heme linkage 5.2E-3
Asparagine biosynthetic process 1.0E-2
Holozoa (Metazoa and
Choanoflagellata)
Cell-cell signaling 2.2E-3 Xylan catabolic process 1.6E-5
Cell surface receptor linked signal
transduction
9.2E-3 Carbohydrate metabolic process 3.1E-4
Metazoa Regulation of transcription, DNA-
dependent
1.2E-7 Aromatic amino acid family biosynthetic process,
prephenate pathway
1.1E-4
Histidine biosynthetic process 2.3E-3
Cell-matrix adhesion 4.0E-4 Monosaccharide metabolic process* 6.9E-3
Eumetazoa (Bilaterian Apoptosis 3.1E-4 Protein folding 1.7E-3
and Cnidaria) Peptide cross-linking 4.7E-4 Transcription initiation 3.8E-3
Bilateria Mitochondrial electron transport, NADH to
ubiquinone
8.3E-6 Branched chain family amino acid biosynthetic
process
3.3E-4
Histidine biosynthetic process 2.3E-3
Wnt receptor signaling pathway 2.7E-4 Water-soluble vitamin biosynthetic process* 5.0E-3
Deuterostomia Protein transport 8.2E-2 Cellular amino acid biosynthetic process 7.0E-4
Phosphoenolpyruvate-dependent sugar
phosphotransferase system
3.2E-3
Chordata Lipid catabolic process 3.2E-3 Proteolysis 2.1E-2
Activation of MAPKK activity 6.7E-3
Urochordata and Vertebrata Antigen processing and presentation 5.5E-3 Folic acid and derivative metabolic process 2.3E-3
Protein amino acid phosphorylation 1.8E-2 Oligosaccharide biosynthetic process 3.0E-3
Vertebrata Immune response 4.4E-
11
DNA topological change 2.0E-3
G-protein coupled receptor protein
signaling pathway
1.6E-5 Carbohydrate metabolic process 3.1E-3
Tetrapoda Regulation of growth 1.3E-2 Valyl-tRNA aminoacylation 4.3E-3
Synaptic transmission 2.0E-2 Response to water 8.6E-3
Amniota Immune response 1.8E-3 Regulation of transcription, DNA-dependent 9.2E-8
Riboflavin biosynthetic process 1.0E-3
Defense response 2.0E-3 Thiamin biosynthetic process* 1.8E-3
Mammalia Hemopoiesis 2.8E-3
Aromatic amino acid family biosynthetic process 1.1E-2
Reciprocal
meiotic recombination 8.3E-3
The two terms with the lowest P-values are shown (calculated by the Ontologizer 2.0 soft ware [63] with the Topology-Elim algorithm [64]), with the exception of
the four terms marked by an asterisk, due to the relevance of these ter ms for this work. Prototypical regulatory terms are in bold text, prototypical metabolic
terms are in italics (Additional files 5 and 6 list all gained and lost domains together with their associated GO terms and Additional file 14 summarizes the results
of using different parameters in Ontologizer 2.0 software).
Table 4 Enriched gained and lost Gene Ontology terms for select clades
Enriched gained GO terms P-value Enriched lost GO terms P-value
Corticata Cobalamin biosynthetic process 3.2E-7 Small GTPase mediated signal transduction 7.9E-3
Photosynthesis 2.3E-6 Lipid transport 1.1E-2
Archaeplastida Photosynthesis 3.1E-25 Carbohydrate metabolic process 9.1E-4
Glycyl-tRNA aminoacylation 1.8E-2 Xylan catabolic process 4.8E-3
Viridiplantae Photosynthesis 2.7E-3 Tryptophan catabolic process to kynurenine 7.1E-3
Protein import into mitochondrial outer membrane 7.1E-3 Sulfur compound biosynthetic process 1.3E-2
Protostomia Sensory perception of smell 4.3E-3 Protein secretion by the type II secretion system 3.4E-3
Cell adhesion 4.2E-3
The two terms with the lowest P-values are shown (calculated by the Ontologizer 2.0 soft ware [63] with the Topology-Elim algorithm [64]). Prototypical
regulatory terms are in bold text, prototypical metabolic terms are in italics (for detailed results see Additional files 5 and 6).
Zmasek and Godzik Genome Biology 2011, 12:R4
/>Page 6 of 13
LECA
Unikonta
Opisthokonta
Metazoa
Chordata
Vertebrata
Tetrapoda
Mammalia
Hominids
0
20
40
60
80
100
120
140
160
0
200
400
600
800
1000
1200
DNA repair
G-protein coupled recepto
r
protein signaling pathway
Cell surface receptor linked
signal transduction
Immune response
Regulation of apoptosis
Regulation of transcription
Signal transduction
MYA
Number of distinct protein domains Number of distinct protein domains
(a)
LECA
Unikonta
Opisthokonta
Metazoa
Chordata
Vertebrata
Tetrapoda
Mammalia
Hominids
0
20
40
60
80
100
120
140
160
180
0
200
400
600
800
1000
1200
Carbohydrate metabolic
process
Cellular amino acid
metabolic process
Cofactor biosynthetic
process
Lipid metabolic process
Nucleotide metabolic
process
Polysaccharide metabolic
process
Secondary metabolic
process
Vitamin biosynthetic
process
MYA
(b)
Precambrian Paleozoic Mesozoic Cz
Precambrian Paleozoic Mesozoic Cz
Ed
Ed
Number of distinct protein domains
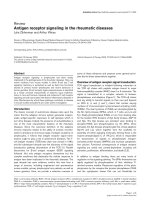
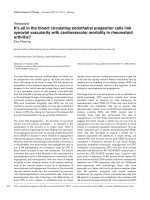
Figure 3 Dynamics of genomes during animal evolution. The functional contents of inferred ancestral genomes from the LECA to hominids
(humans and great apes) are shown. (a) GO categories involved in various aspects of regulation. (b) GO categories involved in various aspects
of metabolism (for detailed results see Additional files 5 and 6). Divergence time estimates are based on the fossil record and thus are minimum
time constrains [39,68,69]. Geological periods are indicated on both panels (’Ed’ stands for Ediacaran period and ‘Cz’ for Cenozoic era).
Zmasek and Godzik Genome Biology 2011, 12:R4
/>Page 7 of 13
Metamonada (for example, the Giardiasis agent Giardia
lamblia)fromtheExcavatagroup[49](showninpur-
ple), and Aconoidasida (for example, the malaria para-
site Plasmodium falciparum) from the Alveolata gro up
(shown in brown) are the most derived relative to the
LECA. On the other hand, this graph differs from the
eukaryotic evolutionary tree in that some groups that
are closely related appear q uite distant, most strikingly
seen in the large separatio n between fungi and animals,
with fungi having the highest percentage in catalytic
activity and animals having among the lowest. It is also
noteworthy how similar all vertebrate genomes are to
each other on this level, despite roughly 400 million
years since the separation between ray-finned fish and
tetrapods [39], especially compared to the big ‘ jumps’
between vertebrates and the deuterstome ancestor and
between the animal ancestor and the choanoflagellata/
animal ancestor.
Gut microbes complement human reduced metabolic
capacity
One of the interesting questions one may ask is how the
modern organisms compensate for the f unctionality of
protein domains that were ‘lost’ compared to their ances-
tors, especially among basic metabolic functions. An intri-
guing possibility is that some of this functionality may be
provided by symbiotic microbes. In a preliminary calcula-
tion we show that a ‘meta-organism’ containing a super-
set of protein domains found in the human genome and
in the genomes of the two common gut commensals,
Bacteroides thetaiotaomicron and Eubacterium rectale,
very closely resembles the L ECA in its profile of me ta-
bolic domains (Additional file 11). Interestingly, none o f
the known symbionts alone is able to provide such com-
pensation, which agrees well with the observation that a
‘minimal functional gut microbiome’ consists of these
two bacteria [50].
Discussion
The results presented here indicate that although novel
domains do appear throughout eukaryote evolution, this
is offset, and usually overshadowed, by domain losses.
Theweaktrendoftheincreaseofthenumberof
domains as a function of morphological complexity
appears to be a consequence of larger losses for some of
the morphologically simpler species. Overall, the num-
ber of distinct domains remains surprisingly constant
and varies between 3,500 and 4,000 for most branches
of the eukaryotic tree of life. It is importan t to remem-
ber that our estimates represents a lower bound for the
domain repertoire for both the ancestral and extant gen-
omes, since our analysis does not take into account
0.0 0.5 1.0 1.5 2.0
38 40 42 44 46
Percenta
g
e of domains involved in si
g
nal transduction
Percentage o
f
domains involved in metabolism
Aconoidasida
Agaricomycotina
Alveolata
Amoebozoa
Annelida
Apicomplexa
Archaeplastida
Arthropoda
Ascidiacea
Ascomycota
Bacillariophyta
Basidiomycota
Bikonta
Bilateria
Eumetazoa (Bilateria & Cnidaria)
Chlorophyceae
Chlorophyta
Chordata
Chromalveolate
Ciliophora
Coccidia
Corticata
Cryptosporidium
Deuterostomia
Diapsida
Dictyostelium
Dikarya
Diptera
Dothideomycetes
Ecdysozoa
Embryophyta
Euarchontoglires
LECA
Eurotiales
Euteleostei
Eutheria
Excavata
Fungi
Heterokonta
Homobasidiomycetes
Insecta
Kinetoplastida
Kinetoplastida & Heterolobosea
Lophotrochozoa
Magnoliophyta
Mammalia
Metamonada
Metazoa
Metazoa & Choanoflagellata
Micromonas
Mucoromycotina
Nematoda
Oomycetes
Opisthokonta
Ostreococcus
Pelagophyceae & Bacillariophyta
Pezizomycotina
Plasmodium
Poales
Prasinophyceae
Primates
Protostomia
Pucciniomycotina
Rodentia
Saccharomycotina
Sordariomycetes
Teleostei
Theileria
Tracheophyta
Unikonta
Urochordata
Urochordata & Vertebrata
Vertebrata
Viridiplantae
Eudicotyledons
Nematostella vectensis
Monosiga brevicollis
Trichoplax adhaerens
Homo sapiens
Vertebrata
Deuterostomia except Vertebrata
Protostomia
Embryophyta (”land plants”)
Fungi
Chlorophyta (green algae)
Excavata
Heterokonta (stramenopiles)
Alveolata
Taxonomy colors:
Amoebozoa
Onygenales
Xenopus tropicali
s
Terapoda
Opisthokonta
Archaeplastida
Chromalveolata
Figure 4 Classifying eukaryotes by the functional profiles of their genomes. A two-dimensional plot of regulatory function versus catalytic
activity percentages for ancestral and extant domainomes.
Zmasek and Godzik Genome Biology 2011, 12:R4
/>Page 8 of 13
extinct domains, domains not present or detected in any
of the analyzed genomes nor as yet unidentified
domains. Since the Pfam database does not yet cover
the complete protein domain universe (especially so for
domains specific to poorly studied organisms), at this
point covering around 60% of most eukaryotic genomes,
we expect the number of domain gains to grow with
more complete versions of Pfam. However, we don’ t
expect this would reverse our findings presented here.
To test this, we compared the an alysis presented here,
which uses the current version of Pfam (24.0) with over
10,000 domain models, with results obtained with pre-
vious versions of Pfam. While the overall number of
domains significantly increases with each release of
Pfam, often by >20% with each release, overall tenden-
cies are independent of the Pfam version used (for
examples, see Additional file 12, which contains select
data from an analysis using Pfam version 22.0).
The minimal domain repertoire for a eukaryotic organism
The domain repertoires of the ciliates Paramecium tetra-
urelia and Tetrahymena thermophila, with about 2,080
and 2,190 distinct domains, respectively, while not the
smallest of the genomes analyzed here, are the smallest of
the free living organisms in this analysis, as all species with
smaller domain sets are primarily parasitic ( such as the
cattle parasite Theileria parva, with of a domain repertoire
size of only about 860). Interestingly, while the domain
repertoire of P. tetraurelia is small, its gene number of
around 40,000 is very high. It has been shown that the
genome of P. tetraurelia is the result of at least three suc-
cessive whole-genome duplications [51], e xplaining the
low number of distinct domains in a large genome, con-
taining, presumably, a high degree of redundancy. Simi-
larly, T. thermophila also has a high gene count, around
27,000, yet this seems to be due to numerous small dupli-
cation events, as opposed to whole genome duplications
[52]. It has also been found that T. thermophila shares
more orthologou s genes with humans tha n are shared
between humans and the yeast Saccharomyces cerevisiae
[52], despite fungi being phylogenetically closer to humans
than ciliates - another finding supporting a genomically
complex LECA and significant and lineage-specific loss of
genes, and thus domains, during eukaryote evolution.
Horizontal gene transfer
Horizontal gene transfer clearly has the potential to result
in misleadingly inflated domain counts of ancestral spe-
cies. Despite being more common in eukaryotes than pre-
viously thought, most known cases of horizontal gene
transfer in eukaryotes involve bacteria as donors [53-55].
To avoid the possible effects of domains transferred from
prokaryotes to eukaryotes, we performed the reconstruc-
tion analysis under exclusion of bacterial and archaeal
genome s. Nevertheless, we cannot exclude the possibility
that, especially for unicellular eukaryotes, a limited num-
ber of domains are present due to horizontal gene transfer.
For this reason we focused most of our subsequent func-
tional analyses on multicellular animals, since we are not
aware of any reports showing gene transfer within animals.
Effects of the model of eukaryote evolution
Clearly, domain content of ancestral genomes and the
overall pattern of domain gains and losses are depen-
dent on the details o f the eukaryotic evolutionary tree
used for the Dollo parsimony based reconstruction.
There is an ongoing contro vers y concerning the details
of the phylogenetic tree of eukaryotes (for example,
[56]). In the results reported so far we have used a
newly emerging paradigm ac cording to which eukar-
yotes can be classified into two larger clades, the uni-
konts and the bikonts [57]. However, in order to assess
the robustness of our results, we also perfor med all ana-
lyses with two alternativ e versions of the eukaryotic tree
of life. The results for the alternative trees are presented
in the additional material. The first one is a tree that
follows the unikonta/bikonta deep split but differs in the
animal sub-tree, where it follows the co elomata hypoth-
esis instead of the more recent ecdysozoan hypothesis
(see the ‘ coelomata ’ tree in Additional files 7 and 9)
[58]. Interestingly, trees with an ec dysozoan clade con-
sistently had a lower cost under Dollo parsimony than
more traditional topologies (with a cost of 73,363 for a
ecdysozoan model versus 74,433 for a coelomata
model), adding further support to the ecdyso zoan
hypothesis. The second alternative tree, referred to in
the following as ‘crown group’, differs more significantly,
by essentially placing all protists outside of the plant/
animal/fungal subtree (see Additional files 8 and 10).
The domain gain and loss numbers based on the ‘coelo-
mata’ tree do not show any significant differences from
the results presented in the main text: the origins of
deuterostomes and protostomes are still associ ated with
large losses and lophotrochozoans appear less derived
then arthropods and nematodes.
As expected, results based on the ‘crown group’ eukar-
yote tree appear to lead to strongly different domain
counts for the LECA (1,825, as opposed to 4,431). How-
ever, this result is based primarily on a clade of Meta-
monda, namely Giardia lamblia and Trichomonas
vaginalis, both human parasites, at the base of the tree.
Clearly these two parasites are highly derived and unli-
kely to exhibit much resemblance to the LECA [59].
Moving from th e LECA towards metazoans, the domain
count for predicted ancestral species rapidly increases,
andasasoonasatreeincludesatleastonefreeliving
species, the amoeba Naegleria gruberi,thedomain
count of the ancestral eukaryote (2,801) approaches the
Zmasek and Godzik Genome Biology 2011, 12:R4
/>Page 9 of 13
mean for extant nematodes (2,980). On the other hand,
while the topology of the eukaryote tree of life used
influences domain counts close to the root, it has no
significant effect on the results concerning the func-
tional dynamics of eukaryote genomes during evolution.
Finally, we would like to point out that the model shown
in Figures 1 and 2 is controversial mainly due to uncer-
tainty regarding the placement of Rhizaria. Since our ana-
lysis does not include any genomes from this group, this
controversy has no bearing on the results presented here.
The second controversy is regarding the placement of
haptophytes (a phylum of algae), which in the model used
here are considered part of Chromalveolata, but which
according to recent results might form a clade with
Archaeplastida [60]. In our analysis, haptophytes are
represented by only one genome, Emiliania huxleyi,the
placement of which on the tree of life has no measurab le
effect on the results presented here (data not shown).
Further studies
Clearly, studies such as the one presented here will be
more accurate and informative once more eukaryote
genomes have been released covering the tree of life
more uniformly, since t here is currently still a bias
towards commercially important species as well as tradi-
tional model organisms. For example, for anima ls, an
incre ased coverage of lophotrochozoans would be desir-
able. Improved sampling over species space is also
expected to go hand in hand with increased coverage of
domain space by Pfam and similar databases.
Conclusions
In this work we show that domain losses during eukar-
yote evolution are numerous and oftentimes outnum-
ber domain gains. This, combined with estimates for
large numbers of domains present in ancestral gen-
omes, is an additional argument for a complex LECA.
The functional profiles of gained and lost domains are
very different; for instance, during an imal evolution
gained domains involved in regulatory functions are
enriched, whereas lost domains are preferentially
involved in metabolic functions, especially carbohy-
drate and amino acid metabolism. This makes it seem
likely that animals over time outsourced a portion of
their metabolic needs. Clustering inferred ancestral
domainomes according to their functional profiles
results in graphs remarkably similar to the eukaryotic
tree of life.
Materials and methods
Protein predictions for 114 completely sequenced eukar-
yotic genomes were obtained from a variety of sources;
for details, as well as information regarding numbers of
protein predictions, see Additional file 1.
The domain repertoire for each genome was deter-
mined by hmmscan (with default options, except for an
E-value cutoff of 2.0 and ‘nobias’ )fromtheHMMER
3.0b2 package [61] using hidden Markov models from
Pfam 24.0 [43]. In a second step, the hmmscan results
were filtered by the domain specific ‘gathering’ (GA)
cutoff scores provided by Pfam, f ollowed by removal of
domains of obvious viral, phage, or transposon origin
(such as Pfam domain ‘Viral_helicase1’, a viral superfam-
ily 1 RNA helicase). In case of overlapping domains,
only the domain with the lowest E-value was retained.
Based on these preprocessing steps, a list of domains
was created for each of the 114 genomes and, together
with each of the three eukaryotic evolutionary trees
described in the text, used for a Dollo parsimony [62]
based inference of ancestral domain repertoires. The
resultsofthissteparelistsofgained,lost,andpresent
domains for each ancestral species.
In order to assess the robust ness of our results relative
to preprocessing steps, we also performed our analyses
with a variety of diff erent parameter combinations, such
as uniform E-value based cutoffs ranging from 10
-4
to
10
-18
, as well as domain specific ‘noise’ (NC) and ‘trusted’
(TC) cutoff values from Pfam, with or without overlap
and/or viral domain removal. W e were unable to find a
combination of these settings that would significantly
change the numbers presented here and invalidate our
conclusions. For example, Additional file 12 shows select
domain counts for a variety of cutoff values. While, as
expected, the absolute counts of domains are dependent
on the cutoff value(s) used, overall tendencies (such as
the LECA having an inferred domainome similar in size
to that of extant mammals, and significant domain losses
at the roots of deuterstome and ecdysozoa subtrees) are
independent of the cutoff values used. Additional file 13
shows detailed gain and loss numbers under a uniform
E-value-based cutoff of 10
-8
.
Pfam domains ( lost, gained, and present) where
mapped to GO terms by using the ‘pfam2go’ mapping
(dated 2009/10/01) provided by the GO consortium [7].
GO term enrichment analysis for gained and lost
domains was performed using the Ontologizer 2.0 soft-
ware [63] with the Topology-Elim algorithm [64], which
integrates the graph structure of t he GO in testing for
group enrichment. Enrichments are calculated relative
to the union of all Pfam domains (with GO annotations)
present in all genomes analyzed in this work. As sum-
marized i n Additional file 14, we tested whether differ-
ent calculation metho ds in the Ontologizer 2.0 software
(such as ‘Topology-Weighted’, ‘Parent-Child-Union’ or
‘Parent-Child-Intersection’ instead of ‘ Topology-Elim’
[65]), as well as different approaches for multiple te sting
correction, would lead to noticeable different conclu-
sions regarding enriched GO categories at various points
Zmasek and Godzik Genome Biology 2011, 12:R4
/>Page 10 of 13
during animal evolution. While the level of detail is
dependent on the calculation method used (for example,
‘ Parent-Child-Union’ and ‘Parent-Child-Int ersection’
methods in gen eral lead to very broad terms, w hereas
the other methods give more specific results), the results
for each setting show predominantly gains in regulatory
functions and losses in metabolic processes during ani-
mal evolution.
The preprocessing steps, the Dollo parsimony
approach, and basic ancestral GO term analyses, were
performed by software of our own design [66].
Additional material
Additional file 1: Table of genomes analyzed.
Additional file 2: Table of Pfam domain counts in extant species.
Summary of conditions used: protein predictions as listed in Additional
file 1, domain models from Pfam 24.0, analyzed with HMMER 3.0b2, Pfam
‘gathering’ cutoffs.
Additional file 3: Domain gains and loss counts during eukaryote
evolution. Inferred domainome sizes are shown in blue, domain gain
counts in green, and domain loss counts in red. Numbers in brackets are
average domainome sizes of all extant descendents of each node.
Summary of conditions used: protein predictions as listed in Additional
file 1, domain models from Pfam 24.0, analyzed with HMMER 3.0b2, Pfam
‘gathering’ cutoffs.
Additional file 4: Domain gains and losses during eukaryote
evolution. phyloXML [70] formatted file, which was used to create
Figure 2 and Additional file 3, viewable with Archaeopteryx software [71].
Summary of conditions used: protein predictions as listed in Additional
file 1, domain models from Pfam 24.0, analyzed with HMMER 3.0b2, Pfam
‘gathering’ cutoffs.
Additional file 5: Domain gains and corresponding GO terms during
eukaryote evolution. Summary of conditions used: protein predictions
as listed in Additional file 1, model of eukaryote evolution as shown in
Figure 2 (and more detailed in Additional files 3 and 4), domain models
from Pfam 24.0, analyzed with HMMER 3.0b2, Pfam ‘gathering’ cutoffs,
‘pfam2go’ mappings dated 2009/10/01. GO namespaces are abbreviated
as follows: B, biological process; C, cellular component; M, molecular
function.
Additional file 6: Domain losses and corresponding GO terms
during eukaryote evolution. Summary of conditions used: protein
predictions as listed in Additional file 1, model of eukaryote evolution as
shown in Figure 2 (and more detailed in Additional files 3 and 4),
domain models from Pfam 24.0, analyzed with HMMER 3.0b2, Pfam
‘gathering’ cutoffs, ‘pfam2go’ mappings dated 2009/10/01. GO
namespaces are abbreviated as follows: B, biological process; C, cellular
component; M, molecular function.
Additional file 7: Domain gain and loss counts during eukaryote
evolution under a coelomata model. Summary of conditions used:
protein predictions as listed in Additional file 1, domain models from
Pfam 24.0, analyzed with HMMER 3.0b2, Pfam ‘gathering’ cutoffs.
Additional file 8: Domain gains and loss counts during eukaryote
evolution under a ‘crown group’ model. Summary of conditions used:
protein predictions as listed in Additional file 1, domain models from
Pfam 24.0, analyzed with HMMER 3.0b2, Pfam ‘gathering’ cutoffs.
Additional file 9: Table of enriched gained and lost GO terms
evolution under a coelomata model. The two terms with the lowest P-
values are shown. Summary of conditions used: protein predictions as
listed in Additional file 1, domain models from Pfam 24.0, analyzed with
HMMER 3.0b2, Pfam ‘gathering’ cutoffs, model of eukaryote evolution as
shown in Additional file 7, ‘pfam2go’ mappings dated 2009/10/01,
Ontologizer 2.0 with Topology-Elim algorithm.
Additional file 10: Table of enriched gained and lost GO terms
under a ‘crown group’ model. The two terms with the lowest P-values
are shown. Summary of conditions used: protein predictions as listed in
Additional file 1, domain models from Pfam 24.0, analyzed with HMMER
3.0b2, Pfam ‘gathering
’ cutoffs,
model of eukaryote evolution as shown
in Additional file 8, ‘pfam2go’ mappings dated 2009/10/01, Ontologizer
2.0 with Topology-Elim algorithm.
Additional file 11: Functional analysis of the human domainome
complemented with intestinal bacteria. Summary of conditions used:
protein predictions as listed in Additional file 1, model of eukaryote
evolution as shown in Figure 2 (and more detailed in Additional files 3
and 4), domain models from Pfam 24.0, analyzed with HMMER 3.0b2,
Pfam ‘gathering’ cutoffs, ‘pfam2go’ mappings dated 2009/10/01.
Additional file 12: Domain counts for a variety of cutoff values.
Additional file 13: Domain gains and losses during eukaryote
evolution for a E-value cutoff of 10
-8
. Summary of conditions used:
protein predictions as listed in Additional file 1, domain models from
Pfam 24.0, analyzed with HMMER 3.0b2.
Additional file 14: Comparison of enriched gained and lost GO
terms along path from Unikonta to Mammalia using different
calculation methods and different approaches for multiple testing
correction. The two terms with the lowest P-values are shown
(calculated by the Ontologizer 2.0 software [63]), with the exception of
terms marked by an asterisk, due to the relevance of these terms for this
work. Prototypical regulatory terms are in red, prototypical metabolic
terms are in blue.
Abbreviations
GO: gene ontology; LECA: last eukaryotic common ancestor.
Acknowledgements
This research was supported by NIH grants R01 GM087218 (FFAS) and P20
GM076221 (Joint Center for Molecular Modeling). We thank Dr Qing Zhang
for useful discussions. The authors acknowledge the sequencing centers
listed in Additional file 1 for their efforts in sequencing, assembling, and
annotating the genomes analyzed in this study. We also thank the
anonymous reviewers for their helpful comments.
Authors’ contributions
CMZ performed the analysis; CMZ and AG contributed to the research
design and discussion on the manuscript; CMZ and AG wrote the
manuscript. Both authors read and approved the final manuscript.
Received: 23 November 2010 Revised: 23 December 2010
Accepted: 17 January 2011 Published: 17 January 2011
References
1. Baldauf S: An overview of the phylogeny and diversity of eukaryotes.
J Systemat Evol 2008, 46:263-273[ />manage/wenzhang/jse08060.pdf].
2. Schierwater B: My favorite animal, Trichoplax adhaerens. BioEssays 2005,
27:1294-1302.
3. Carroll S: Chance and necessity: the evolution of morphological
complexity and diversity. Nature 2001, 409:1102-1109.
4. Valentine J, Collins A, Meyer P: Morphological complexity increase in
metazoans. Paleobiology 1994, 20:131-142[ />2401015].
5. Clamp M, Fry B, Kamal M, Xie X, Cuff J, Lin M, Kellis M, Lindblad-Toh K,
Lander E: Distinguishing protein-coding and noncoding genes in the
human genome. Proc Natl Acad Sci USA 2007, 104:19428-19433.
6. The CeSC: Genome sequence of the nematode C. elegans: a platform for
investigating biology. Science 1998, 282:2012-2018.
7. Adams MD, Celniker SE, Holt RA, Evans CA, Gocayne JD, Amanatides PG,
Scherer SE, Li PW, Hoskins RA, Galle RF, George RA, Lewis SE, Richards S,
Ashburner M, Henderson SN, Sutton GG, Wortman JR, Yandell MD,
Zhang Q, Chen LX, Brandon RC, Rogers YH, Blazej RG, Champe M,
Pfeiffer BD, Wan KH, Doyle C, Baxter EG, Helt G, Nelson CR, et al: The
Zmasek and Godzik Genome Biology 2011, 12:R4
/>Page 11 of 13
genome sequence of Drosophila melanogaster. Science 2000,
287:2185-2195.
8. Carninci P: Non-coding RNA transcription: turning on neighbours. Nat
Cell Biol 2008, 10:1023-1024.
9. Heimberg A, Sempere L, Moy V, Donoghue P, Peterson K: MicroRNAs and
the advent of vertebrate morphological complexity. Proc Natl Acad Sci
USA 2008, 105:2946-2950.
10. Claverie JM: Gene number. What if there are only 30,000 human genes?.
Science 2001, 291:1255-1257.
11. Bowen N, Jordan K: Transposable elements and the evolution of
eukaryotic complexity. Curr Issues Mol Biol 2002, 4:65-76.
12. Levine M, Tjian R: Transcription regulation and animal diversity. Nature
2003, 424:147-151.
13. Koonin E, Wolf Y, Karev G: The structure of the protein universe and
genome evolution. Nature 2002, 420:218-223.
14. Tordai H, Nagy A, Farkas K, Bányai L, Patthy L: Modules, multidomain
proteins and organismic complexity. FEBS J 2005, 272:5064-5078.
15. Vogel C, Chothia C: Protein family expansions and biological complexity.
PLoS Comput Biol 2006, 2:e48.
16. Makarova K, Wolf Y, Mekhedov S, Mirkin B, Koonin E: Ancestral paralogs
and pseudoparalogs and their role in the emergence of the eukaryotic
cell. Nucleic Acids Res 2005, 33:4626-4638.
17. Poole A, Penny D: Evaluating hypotheses for the origin of eukaryotes.
Bioessays 2007, 29:74-84.
18. Field M, Dacks J: First and last ancestors: reconstructing evolution of the
endomembrane system with ESCRTs, vesicle coat proteins, and nuclear
pore complexes. Curr Opin Cell Biol 2009, 21:4-13.
19. Eme L, Moreira D, Talla E, Brochier-Armanet C: A complex cell division
machinery was present in the last common ancestor of eukaryotes. PLoS
ONE 2009, 4:e5021.
20. Danchin E, Gouret P, Pontarotti P: Eleven ancestral gene families lost in
mammals and vertebrates while otherwise universally conserved in
animals. BMC Evol Biol 2006, 6:5.
21. Kortschak , Samuel G, Saint R, Miller D: EST analysis of the cnidarian
Acropora millepora reveals extensive gene loss and rapid sequence
divergence in the model invertebrates.
Curr Biol 2003, 13:2190-2195.
22.
Fritz-Laylin L, Prochnik S, Ginger M, Dacks J, Carpenter M, Field M, Kuo A,
Paredez A, Chapman J, Pham J: The genome of Naegleria gruberi
illuminates early eukaryotic versatility. Cell 2010, 140:631-642.
23. Kuznetsov V, Pickalov V, Kanapin A, Kolchanov N, Hofestaedt R, Milanesi L:
Proteome complexity measures based on counting of domain-to-protein
links for replicative and non-replicative domains. In Bioinformatics of
Genome Regulation and Structure II. Edited by: Kolchanov N, Hofestaedt R,
Milanesi L. Kluwer Academic Publishers; 2006:329-341.
24. Ponting C, Russell R: The natural history of protein domains. Annu Rev
Biophys Biomol Struct 2002, 31:45-71.
25. Finn RD, Mistry J, Tate J, Coggill P, Heger A, Pollington JE, Gavin OL,
Gunasekaran P, Ceric G, Forslund K, Holm L, Sonnhammer EL, Eddy SR,
Bateman A: The Pfam protein families database. Nucleic Acids Res 2010,
38:D211-222.
26. Hunter S, Apweiler R, Attwood TK, Bairoch A, Bateman A, Binns D, Bork P,
Das U, Daugherty L, Duquenne L, Finn RD, Gough J, Haft D, Hulo N,
Kahn D, Kelly E, Laugraud A, Letunic I, Lonsdale D, Lopez R, Madera M,
Maslen J, McAnulla C, McDowall J, Mistry J, Mitchell A, Mulder N, Natale D,
Orengo C, Quinn AF, et al: InterPro: the integrative protein signature
database. Nucleic Acids Res 2009, 37:D211-215.
27. Ashburner M, Ball CA, Blake JA, Botstein D, Butler H, Cherry JM, Davis AP,
Dolinski K, Dwight SS, Eppig JT, Harris MA, Hill DP, Issel-Tarver L, Kasarskis A,
Lewis S, Matese JC, Richardson JE, Ringwald M, Rubin GM, Sherlock G: Gene
ontology: tool for the unification of biology. The Gene Ontology
Consortium. Nat Genet 2000, 25:25-29.
28. Ma J, Zhang L, Suh B, Raney B, Burhans R, Kent J, Blanchette M, Haussler D,
Miller W: Reconstructing contiguous regions of an ancestral genome.
Genome Res 2006, 16:1557-1565.
29. Rascol V, Pontarotti P, Levasseur A: Ancestral animal genomes
reconstruction. Curr Opin Immunol 2007, 19:542-546.
30. Hampl V, Hug L, Leigh J, Dacks J, Lang F, Simpson A, Roger A:
Phylogenomic analyses support the monophyly of Excavata and resolve
relationships among eukaryotic supergroups. Proc Natl Acad Sci USA 2009,
106:3859-3864.
31. Parfrey L, Barbero E, Lasser E, Dunthorn M, Bhattacharya D, Patterson D,
Katz L: Evaluating support for the current classification of eukaryotic
diversity. PLoS Genet 2006, 2:e220.
32. Burki F, Pawlowski J: Monophyly of rhizaria and multigene phylogeny of
unicellular bikonts. Mol Biol Evol 2006, 23:1922-1930.
33. Farris J: Phylogenetic analysis under Dollo’s law. Systemat Zool 1977,
26:77-88.
34. Przytycka T, Davis G, Song N, Durand D: Graph theoretical insights into
evolution of multidomain proteins. J Comput Biol 2006, 13
:351-363.
35.
Basu MK, Carmel L, Rogozin IB, Koonin EV: Evolution of protein domain
promiscuity in eukaryotes. Genome Res 2008, 18:449-461.
36. Deeds EJ, Hennessey H, Shakhnovich EI: Prokaryotic phylogenies inferred
from protein structural domains. Genome Res 2005, 15:393-402.
37. Marshall CR, Raff EC, Raff RA: Dollo’s law and the death and resurrection
of genes. Proc Natl Acad Sci USA 1994, 91:12283-12287.
38. Sakarya O, Kosik KS, Oakley TH: Reconstructing ancestral genome content
based on symmetrical best alignments and Dollo parsimony.
Bioinformatics 2008, 24:606-612.
39. Benton MJ, Donoghue PCJ, Asher RJ: Calibrating and constraining
molecular clocks. In The Timetree of Life. Edited by: Hedges SB, Kumar S.
Oxford: Oxford University Press; 2009:35-86.
40. Krylov D, Wolf Y, Rogozin I, Koonin E: Gene loss, protein sequence
divergence, gene dispensability, expression level, and interactivity are
correlated in eukaryotic evolution. Genome Res 2003, 13:2229-2235.
41. Miller D, Ball E: The gene complement of the ancestral bilaterian - was
Urbilateria a monster?. J Biol 2009, 8:89.
42. Hughes A, Friedman R: Shedding genomic ballast: extensive parallel loss
of ancestral gene families in animals. J Mol Evol 2004, 59:827-833.
43. Darling J, Reitzel A, Burton P, Mazza M, Ryan J, Sullivan J, Finnerty J: Rising
starlet: the starlet sea anemone, Nematostella vectensis. Bioessays 2005,
27:211-221.
44. Haygood R: Proceedings of the SMBE Tri-National Young Investigators’
Workshop 2005. Mutation rate and the cost of complexity. Mol Biol Evol
2006, 23:957-963.
45. Kusserow A, Pang K, Sturm C, Hrouda M, Lentfer J, Schmidt HA, Technau U,
von Haeseler A, Hobmayer B, Martindale MQ, Holstein TW: Unexpected
complexity of the Wnt gene family in a sea anemone. Nature 2005,
433:156-160.
46. Zmasek CM, Zhang Q, Ye Y, Godzik A: Surprising complexity of the
ancestral apoptosis network. Genome Biol 2007, 8:R226.
47. Hibbett D, Binder M: Evolution of complex fruiting-body morphologies in
homobasidiomycetes. Proc Biol Sci 2002, 269:1963-1969.
48. Rivals I, Personnaz L, Taing L, Potier MC: Enrichment or depletion of a GO
category within a class of genes: which test?. Bioinformatics 2007,
23:401-407.
49.
Simpson A: Cytoskeletal organization, phylogenetic affinities and
systematics in the contentious taxon Excavata (Eukaryota). Int J Syst Evol
Microbiol 2003, 53:1759-1777.
50. Mahowald MA, Rey FE, Seedorf H, Turnbaugh PJ, Fulton RS, Wollam A,
Shah N, Wang C, Magrini V, Wilson RK, Cantarel BL, Coutinho PM,
Henrissat B, Crock LW, Russell A, Verberkmoes NC, Hettich RL, Gordon JI:
Characterizing a model human gut microbiota composed of members
of its two dominant bacterial phyla. Proc Natl Acad Sci USA 2009,
106:5859-5864.
51. Aury JM, Jaillon O, Duret L, Noel B, Jubin C, Porcel BM, Ségurens B,
Daubin V, Anthouard V, Aiach N, Arnaiz O, Billaut A, Beisson J, Blanc I,
Bouhouche K, Câmara F, Duharcourt S, Guigo R, Gogendeau D, Katinka M,
Keller AM, Kissmehl R, Klotz C, Koll F, Le Mouël A, Lepère G, Malinsky S,
Nowacki M, Nowak JK, Plattner H, et al: Global trends of whole-genome
duplications revealed by the ciliate Paramecium tetraurelia. Nature 2006,
444:171-178.
52. Eisen JA, Coyne RS, Wu M, Wu D, Thiagarajan M, Wortman JR, Badger JH,
Ren Q, Amedeo P, Jones KM, Tallon LJ, Delcher AL, Salzberg SL, Silva JC,
Haas BJ, Majoros WH, Farzad M, Carlton JM, Smith RK Jr, Garg J,
Pearlman RE, Karrer KM, Sun L, Manning G, Elde NC, Turkewitz AP, Asai DJ,
Wilkes DE, Wang Y, Cai H, et al: Macronuclear genome sequence of the
ciliate Tetrahymena thermophila, a model eukaryote. PLoS Biol 2006, 4:
e286.
53. Richardson , Aaron O, Palmer , Jeffrey D: Horizontal gene transfer in
plants. J Exp Bot 2007, 58:1-9.
Zmasek and Godzik Genome Biology 2011, 12:R4
/>Page 12 of 13
54. Ros V, Hurst G: Lateral gene transfer between prokaryotes and
multicellular eukaryotes: ongoing and significant?. BMC Biol 2009, 7:20.
55. Keeling P, Palmer J: Horizontal gene transfer in eukaryotic evolution. Nat
Rev Genet 2008, 9:605-618.
56. Rogozin IB, Basu MK, Csürös M, Koonin EV: Analysis of rare genomic
changes does not support the unikont-bikont phylogeny and suggests
cyanobacterial symbiosis as the point of primary radiation of eukaryotes.
Genome Biol Evol 2009, 25:99-113.
57. Roger A, Simpson A: Evolution: revisiting the root of the eukaryote tree.
Curr Biol 2009, 19:R165-R167.
58. Telford M: Animal phylogeny: back to the coelomata?. Curr Biol 2004, 14:
R274-R276.
59. Dieterich C, Sommer R: How to become a parasite - lessons from the
genomes of nematodes. Trends Genet 2009, 25:203-209.
60. Burki F, Shalchian-Tabrizi K, Pawlowski J: Phylogenomics reveals a new
‘megagroup’ including most photosynthetic eukaryotes. Biol Lett 2008,
4:366-369.
61. HMMER. [ ].
62. Felsenstein J: Inferring Phylogenies. 2nd edition. Sinauer Associates; 2003.
63. Bauer S, Grossmann S, Vingron M, Robinson P: Ontologizer 2.0 - a
multifunctional tool for GO term enrichment analysis and data
exploration. Bioinformatics 2008, 24:1650-1651.
64. Alexa A, Rahnenführer J, Lengauer T: Improved scoring of functional
groups from gene expression data by decorrelating GO graph structure.
Bioinformatics 2006, 22:1600-1607.
65. Grossmann S, Bauer S, Robinson P, Vingron M: Improved detection of
overrepresentation of Gene-Ontology annotations with parent child
analysis. Bioinformatics 2007, 23:3024-3031.
66. forester. [ />67. Adl SM, Simpson AG, Farmer MA, Andersen RA, Anderson OR, Barta JR,
Bowser SS, Brugerolle G, Fensome RA, Fredericq S, James TY, Karpov S,
Kugrens P, Krug J, Lane CE, Lewis LA, Lodge J, Lynn DH, Mann DG,
McCourt RM, Mendoza L, Moestrup O, Mozley-Standridge SE, Nerad TA,
Shearer CA, Smirnov AV, Spiegel FW, Taylor MF: The new higher level
classification of eukaryotes with emphasis on the taxonomy of protists.
J Eukaryot Microbiol 2005, 52:399-451.
68. Berney C, Pawlowski J: A molecular time-scale for eukaryote evolution
recalibrated with the continuous microfossil record. Proc Biol Sci 2006,
273:1867-1872.
69. Conway Morris S: The Cambrian “explosion": slow-fuse or megatonnage?.
Proc Natl Acad Sci USA
2000, 97:4426-4429.
70. Han MV, Zmasek CM: phyloXML: XML for evolutionary biology and
comparative genomics. BMC Bioinformatics 2009, 10:356.
71. Archaeopteryx. [ />doi:10.1186/gb-2011-12-1-r4
Cite this article as: Zmasek and Godzik: Strong functional patterns in
the evolution of eukaryotic genomes revealed by the reconstruction of
ancestral protein domain repertoires. Genome Biology 2011 12:R4.
Submit your next manuscript to BioMed Central
and take full advantage of:
• Convenient online submission
• Thorough peer review
• No space constraints or color figure charges
• Immediate publication on acceptance
• Inclusion in PubMed, CAS, Scopus and Google Scholar
• Research which is freely available for redistribution
Submit your manuscript at
www.biomedcentral.com/submit
Zmasek and Godzik Genome Biology 2011, 12:R4
/>Page 13 of 13