Báo cáo y học: "A novel informatics concept for high-throughput shotgun lipidomics based on the molecular fragmentation query language" ppt
Bạn đang xem bản rút gọn của tài liệu. Xem và tải ngay bản đầy đủ của tài liệu tại đây (942.48 KB, 25 trang )
METH O D Open Access
A novel informatics concept for high-throughput
shotgun lipidomics based on the molecular
fragmentation query language
Ronny Herzog
1,2†
, Dominik Schwudke
1,3†
, Kai Schuhmann
1,2
, Julio L Sampaio
1
, Stefan R Bornstein
2
,
Michael Schroeder
4
and Andrej Shevchenko
1*
Abstract
Shotgun lipidome profiling relies on direct mass spectrometric analysis of total lipid extracts from cells, tissues or
organisms and is a powerful tool to elucidate the molecular composition of lipidomes. We present a novel
informatics concept of the molecular fragmentation query language implemented withi n the LipidXplorer open
source software kit that supports accurate quantification of individual species of any ionizable lipid class in shotgun
spectra acquired on any mass spectrometry platform.
Background
Lipidomics, an emerging scientific discipline, aims at the
quantitative molecular characterization of the full lipid
complement of cells, tissues or whole organisms
(reviewed in [1-4]). Eukaryotic lipidomes comprise over
a hundred lipid classes, each of which is represented by
a large number of individual yet structurally related
molecules. According to different estimates, a eukaryotic
lipidome might contain from 9,000 to 100,000 individual
molecular lipid species in total [2,5]. Due to the enor-
mous compositional complexity and diversity of physi-
cochemical properties of individual lipid molecules,
lipidomic analyses rely heavily on mass spectrometry. A
shotgun lipidomics methodology implies that total lipid
extracts from cells or tissues are directly infused into a
tandem mass spectrometer and the identification of
individual species relies on their accurately determined
masses and/or MS/MS spectra acquired from corre-
sponding precursor ions [6-8].
The apparent technical simplicity of shotgun lipido-
mics is appealing; indeed, molecular species from many
lipid classes are determined in parallel in a single analy-
sis with no chromatographic separation required. Spe-
cies quantification is simplified because in direct
infusion experiments t he composition of electrosprayed
analytes does not change over time. Adjusting the sol-
vent composition (organic phase content, basic or acidic
pH, buffer concentration ) and ionization conditions
(polarity mode, declustering energy, interface tempera-
ture, etc.) enhances the detection sensitivity by seve ral
orders of magnitude [ 8,9]. In shotgun tandem mass
spectrometry (MS/MS) analysis, all detectable precursors
(or, alternatively, all plausible precursors from a pre-
defined inclusion list) could be fragmented [10]. Given
enough time, the shotgun analysis would ultimately pro-
duce a comprehensive dataset of MS and MS/MS spec-
tra comprising all fragment ions obtained from all
ionizable lipid precursors.
While methods of acquiring shotgun mass spectra
have been established, a major bottleneck exists in the
accurate interpretation of spectra, despite the fact that
several programs (LipidQA [11], LIMSA [12], F AAT
[13], LipID [14], LipidSearch [15], LipidProfiler (now
marketed as LipidView) [16], LipidInspector [10]) - have
been developed for this. Although these programs utilize
different algorithms for identifying lipids, they share a
few c ommon drawbacks. First, relying on a database of
reference MS/MS spectra is usually c ounterproductive
because many lipid precursor ions are isobaric and in
shotgun experiments their collision- induced dissociation
yields mixed populations of fragment ions. Second, lipid
fragmentation pathways strongly depend both on the
* Correspondence:
† Contributed equally
1
Max Planck Institute of Molecular Cell Biology and Genetics,
Pfotenhauerstrasse 108, 01307 Dresden, Germany
Full list of author information is available at the end of the article
Herzog et al. Genome Biology 2011, 12:R8
/>© 2011 Herz og et al.; licensee BioMed Central Ltd. This is an open access article distributed under the terms of the Creative Commons
Attribution License ( which permits unrestricted use, distribution, and reproduction in
any medium, pro vided the original work is properly cited.
type of tandem mass spectrometer used (reviewed in
[17]) and the experiment settings; therefore, compiling a
single generic reference spectra library is often impossi-
ble and always impractical. Third, software is typically
optimized towar ds supp orting a certain inst rumentation
platform, while mass spectrometers deliver different
mass resolution and mass accuracy and therefore differ-
ent spectra interpretation algorithms are required.
Fourth, the prog rams offer little support to lipidomics
screens, which require batch processing of thousands of
MS and MS/MS spectra, including multiple replicated
analyses of the same samples.
Therefore, there is an urgent need to develop algo-
rithms and software supporting consistent c ross-plat-
form interpretation of shotgun lip idomi cs datasets [18].
We reasoned that such software could rely u pon three
simple rationales. First, MS and MS/MS spectra should
not be interpreted individually; instead, the entire pool
of acquired spectra should be organized into a single
databa se-like structure that is pro bed according to user-
defined reproducibility, mass resolution and mass accu-
racy criteria. Second, MS/MS spectra should be exam-
ined de novo in a user-defined way so that adding new
interpretation routines (like, probing for another lipid
class) should not require modifying the dataset or alter-
ing the program engine. Third, it should be possible to
apply multiple parallel int erpretation routines and,
whenever required, bundle them with boolean opera-
tions to enhance the analysis specificity.
Here we report on LipidXplorer, a full featured soft-
ware kit designed in consideration of these assumptions.
It relies upon a flat file database (MasterScan) that orga-
nizes the spectra dataset acquired in the entire lipido-
mics experiment. To identify and quantify lipids, the
MasterScan is then probed via queries written in t he
molecular fragmentation query language (MFQL), which
supports any lipid identification routine in an intuitive,
transparent a nd user-friendly manner independently of
the instrumentation platform.
Results and discussion
Shotgun lipidomic experiments: terms and definitions
Each biological experiment is performed in parallel in sev-
eral independent replicates. To determine the lipidome in
each of these experiments, each biological replicate is split
into several samples that are processed and analyzed inde-
pendently. Total lipid extracts obtained from each sample
are infused into a tandem mass spectrometer a few times
and several technical replicates are acquired, each provid-
ing a full set of MS and MS/MS spectra further t ermed
as an acquisition. Therefore, a typical shotgun experiment
yields several h undreds of MS and MS/MS spectra
(Figure 1), although many spectra might be redundant
because they are acquired in replicated analyses.
During shotgun analyses, spectra are acquired in the
following way: within a certain period of time (for exam-
ple, 30 s) a mass spectrometer repeatedly acquires indi-
vidual spectra in m uch short er intervals (for example, 1
s) that are termed as scans. Subsequent averaging of all
related scans into a single representative spectrum
increases mass accuracy and improves ion statistics.
Acquisition typically proceeds in a data-dependent
mode: first, a survey (MS) spectrum is acquired to deter-
mine m/z and abundances of precursor ions. Then, MS/
MS spectra are acquired from several automatically
selected precursors and then the acquisition cycle (MS
spectrum followed by a few MS/MS spectra) is repeated.
Each acquisition comprises a large number of MS survey
spectra and MS/MS spectra from selected precursors,
while each spectrum is saved as severa l individual scans
(Figure 1).
A typical lipidomics study might encompass 10 to 100
individual samples, from each of which 10 to 100 MS
and 100 to 1,000 MS/MS spectra are acquired. Peaks in
MS and MS/MS spectra share three common attributes:
mass accuracy (expressed in Da or parts-per-million
(ppm)), mass resolution (full peak width at half maxi-
mum (FWHM)) and peak occupancy. The two former
attributes are determined by mass spectrometer type
and equally apply to all peaks detected within the
experiment. Contrarily, peak occupancy depends on
both instrument performa nce and individual features of
analyzed samples. Even multiple repetitive acquisitions
do not fully compensate for under-sampling of low
abundant precursors, especially if detected with poor
signal-to-noise ratio. Since data-dependent acquisition
of MS/MS spectra is biased towards fragmenting more
abundant precursors, low abundant precursors might
not necessarily be fragmented in all acquisitions. There-
fore, the peak occupancy attribute, here defined as a fre-
quency with which a particular peak is enc ountered in
individual acquisitions within the full series of experi-
ments, helps to balance coverage and reproducibility of
lipid peak detection.
Concept and rationale
To support large sca le shotgun lipidomics analyses, the
software design should address three major conceptual
problems:first,thesoftware should utilize spectra
acquired on any tandem mass spectrometer; second, it
should identify and quantify species from any lipid class
that were detected during mass spectrometric analysis;
third, it should handle large datasets composed of highly
redundant MS and MS/MS spectra, with several techni-
cal and biological replicates acquired from each analyzed
sample, as well from multiple blanks and controls.
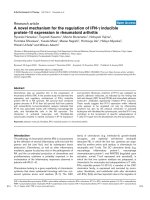
To this end, we propose a novel conceptual design
that relies upon two-step data processing (Figure 2).
Herzog et al. Genome Biology 2011, 12:R8
/>Page 2 of 25
MS
MS/MS
MS
MS/MS
Bi
o
l
og
i
ca
l
rep
li
cates
MS
(survey
spectrum)
MS/MS
MS
MS/MS
MS
MS/MS
Technical replicates
Scans
Sample
Acquisition
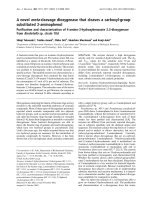
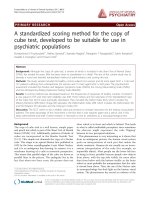
Figure 1 Making a shotgun lipidomics dataset. Experiments ar e repeated in several independent biological replicates for each studied
phenotype. Each biological replicate is split into several samples from which lipids are extracted and extracts are independently analyzed by MS.
Spectra acquired from the total lipid extract survey molecular ions of lipid precursors, which are subsequently fragmented in MS/MS
experiments, yielding MS/MS spectra. Each spectrum is acquired in several scans that are subsequently averaged. A set of MS and MS/MS spectra
is termed as an ‘acquisition’ and several acquisitions are performed continuously making a ‘technical replicate’.
Raw data MasterScan
MFQL
Editor
Results *.csv
MFQL
Queries
*.mzXML Peak lists
Data
conversion
Peak entry
generation
Alignment
Import
module
MFQL
Interpreter
Output
module
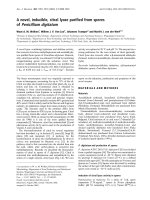
Figure 2 Architecture of LipidXplorer. Boxes represent functional modules and arrows represent data flow between the modules. The import
module converts technical replicates (collections of MS and MS/MS spectra) into a flat file database termed the MasterScan (.sc). Then the
interpretation module probes the MasterScan with interpretation queries written in molecular fragmentation query language (MFQL). Finally, the
output module exports the findings in a user-defined format. All LipidXplorer settings (irrespective of what particular module they apply to) are
controlled via a single graphical user interface.
Herzog et al. Genome Biology 2011, 12:R8
/>Page 3 of 25
First, a full pool of acquired MS and MS/MS spectra is
organized into a single flat-file database termed as M as-
terScan. While building the MasterScan, the software
recognizes related MS and MS/MS spectra and aligns
them considering the peak attributes. Therefore, there is
no need to interpret each spectrum individually,
although important features of individual spectra are
preserved. The second conceptually novel element is the
molecular fragmentation query language, MFQL. We
proposed that lipid identification shou ld not rely on the
comparison of experimental and reference spectra -
whether t he latter were produced in silico or in a sepa-
rate experiment with reference substances. Instead, the
known or assumed lipid fragmentation pathways can be
formalized in a query, which subsequently probes the
MasterScan. Spectra interpretation rules are not fixed
and are not encoded into the software engine: at any
time, users can define new rules or modify the existing
rules and apply any number of interpretation rules in
parallel.
What are the major conceptual advantages of this
design? F irst, a combination of MasterScan and MFQL
enables the interpretation of any MS shotgun dataset
acquired on any instrumentation platform and can tar-
get any detectable species of any lipid class. Second,
aligning multiple related spectra simplifies and speeds
up lipid identification in high-throughput screens,
improves ion statistics and limits the rate of false posi-
tive assignments. To the best of our knowledge, compar-
able flexibility and accuracy have not been achieved by
any available lipidomics software (Table 1).
All programs support direct lipid identification by MS
and some also by MS/MS. Most of the software (except-
ing LipidXplorer) relies upon pre-compiled datab ases of
expected precursor masses or libraries of MS/MS spec-
tra that are either acquired in direct experiments or
computed in silico. These databases are, in principle,
expandable, yet users might not be able to add in new
(or putative) lipid classes at will. The identification algo-
rithms are tuned to expected patterns of fragment ions
and mass resolution ty pical for a certain instrument and
cross-platform interpretation of spectra is therefore
difficult.
The conceptual difference between LipidXplorer and
other lipidomics software (Table 1) is that it is fully
database-independent. Effectively, each spectra dataset is
interpreted de novo, while the interpretation rules for-
malized as M FQL queries may be altered at any time at
the user’s discretion. Also, LipidXplorer identifications
proceed within a pre-processed dataset (MasterScan),
which offers the means to adjust processing settings
according to the peak attributes. Within the same fra-
mework LipidXplorer can accurately interpret spectra
acquired on both high- and low-resolution tandem mass
spectrometers from different vendors.
LipidXplorer was designedtosupportapipelineof
lipidomics experiments rather than to assist i n identify-
ing lipids in the collection of spectra from a single
acquisition. It enables batch processing of all acquisi-
tions made within the series of biological experiments.
Users can group individual acquisitions (technical or
biological replicates, controls, blanks, and so on) and
then compare groups without altering the MasterScan
file. Several features were specifically designed to
improve the confidence and accuracy of lipid identifica-
tion and quantification. LipidXplorer improves the mass
accuracy by adjusting the masses using offsets to refer-
ence peaks. Built-in isotopic correction improves the
Table 1 Common features of shotgun lipidomics software
Feature
a
LipidQA LIMSA FAAT LipID LipidProfiler LipidMaps LipidSearch LipidXplorer
MS Yes Yes Yes Yes Yes Yes Yes
MS + MS/MS Yes Yes Yes Yes
Database of lipid masses Yes Yes Yes Yes Yes Yes
Database of spectra Yes
Database expandability Yes Yes Yes Yes Yes
Isotopic correction Yes Yes Yes Yes
Cross-platform Yes Yes Yes Yes Yes Yes Yes
Spectra alignment Yes Yes
Grouping Yes Yes
Batch mode Yes Yes Yes
Offset correction of masses Yes
a
List of features: MS, lipid identification solely based on matching precursor masses observed in MS spectra; MS + MS/MS, lipid identification based on MS and
MS/MS spectra - required for identifying individual molecular species; Database of lipid masses, lipid identification relies upon a list of expected precursors
masses; Database of spectra, lipid identification relies upon a library of reference spectra; Database expandability, users may expand reference databases at will;
Isotopic correction, overlapping isotopic clusters are detected and the intensities of corresponding monoisotopic peaks are adjusted; Cross-platform, can process
spectra acquired on mass spectrometers from different vendors; Spectra alignment, supports alignment of multiple spectra within the series of experiments;
Grouping, supports grouping of spectra within biological and technical replicates acquired from the same sample; Batch mode, supports processing of multiple
spectra submitted as a batch; Offset correction of masses, supports adjustment of precursors masses using reference peaks in the MS spectrum.
Herzog et al. Genome Biology 2011, 12:R8
/>Page 4 of 25
quantification accuracy by adjusting the abundances of
peaks within partially overlapping isotopic clusters.
LipidXplorer outputs the identified lipid species and
abundances of user-defined reporter ions in each ana-
lyzed sample. We intentionally refrained from program-
ming a module that would recalculate ion abundances
into lipid concentrations because quantification routines
applied in lip idomics are diverse and str ongly project-
dependent: they might rely u pon several normalization
factors (for example, total phosphate content, total pro-
tein content, relative normalization to another lipid
class, to mention only a few) and employ a palette of
internal standards. In high-throughput screens, intensi-
ties of precursor ions are directly output into the mul ti-
variate analysis software, bypassing the calculation of
species abundances (reviewed in [5,19]). At the same
time, calculating the concentrations of individual lipids
isasimpleoperation[20]that seldom fails once the
accurate basis data (identified lipid species and intensi-
ties of reporter peaks) are provided.
The LipidXplorer software is organized in several
functional modules (Figure 2) that are controlled by a
simple intuitive graphical user interface (GUI; Addi-
tional file 1). LipidXpl orer starts importing raw mass
spectra by averaging individual scans in to representative
MS and MS/MS spectra. These spectra are further
aligned by m/z of prec ursor and fragment ions, respec-
tively, and then MS/MS spectra are associated with the
corresponding precursor masses. Spectra-importing rou-
tines are instrument-dependent and consider common
peak attributes: mass resolution and its change over the
full range of m/z; minimum peak intensity thresholds
specified separately for MS and MS/MS spectra; width
of precursor isolation window in MS/MS experiments
and the polarity mode. LipidXplorer also corrects
observed masses by linear approximation of the mass
shift calculated from a few reference masses (if any are
detectable in the spectrum). It also pre-filters spectra by
user-defined peak intensity and occupation thresholds
that are also specified separately for MS and MS/MS
modes.
Scan averaging algorithm
While acquiring mass spectra, m/z and intensities of
peaks might slightly vary within each scan (further,
solely for presentation clarity, we will use the mass of a
precursor ion m instead of its m/z). Therefore, averaging
individual scans into a sing le representative spectrum
improves the ion statistics and, hence, the accuracy of
both measured masses and abundances of corresponding
peaks and is commonly applied in proteomics [21,22].
Here we describe a simple linear time algorithm for
aligning MS and MS/MS spectra of small molecules
(particularly lipids) acquired in large series of shotgun
experiments. It assumes that masses pertinent to the
same peak are Gaussian distributed within individual
scans. The algorithm recognizes related peaks in each
individual scan and averages their masses and intensities
(Additional file 2). First, th e algorithm considers all per-
tinent scans within the acquisition and combines all
reported masses into a single peak list (Figure 3). This
list is then sorted by masses in ascending order and
averaging proceeds in steps, starting from the lowest
detected mass. In every step the algorithm considers
mass m and checks whether other masses fall into a bin
of [m; m+
m
Rm()
] width, where R(m) is the mass resolu-
tion at the mass m. R(m) is assumed to change linearly
within the full mass range; its slope (mass resolution
gradient) and intercept (resolution at the lowest mass of
the full mass range) are inst rument-de pendent features
pre-calculated by the user from some reference spectra.
All m asses within the bin are average weighted by peak
intensities according to Equation 1:
m
Im
I
m
Im
I
avg
i
i
m
i
m
iB
iB
=
∈
∈
∑
∑
()
()
max
max
(1)
where I(m
i
) is the intensity of the peak having mass
m
i
, I
max
is the intensity of the most abundant peak
within the bin B and m
avg
is the intensity weighted aver-
age mass.
The average mass is then stored as a single represen-
tative mass for this bin and the procedure is repeated
for the next mass bin. We assume that the variation of
peak masses is normally distributed within the bin and
therefore the procedure should be repeated several
times (Additional file 3). Computational tests (data not
shown) suggested that three successive iterations should
suffice for complete separation of bins such t hat masses
are collected correctl y into their dedicated bins and that
no two adjacent bins are closer than the value of
m
Rm()
.
One known limitation of this algorithm is that abundant
chemical noise might impact binning accuracy. There-
fore, we always set the threshold for signal-to-noise
ratios of peaks at the value of 3.0, which is a commonly
accepted estimate for calculating the limit of detection
(LOD) of analytical methods.
MasterScan: a database of shotgun mass spectra
The MasterScan is a flat file database that stores all mass
spectra acquired from all analyzed samples, including
technical and biological replicates, blanks and controls.
While building the MasterScan, individual acquisitions
Herzog et al. Genome Biology 2011, 12:R8
/>Page 5 of 25
are processed and stored independently, although users
could subsequently combine them into arbitrary groups.
The accurate alignment of MS and MS/MS spectra is
a key step in interpreting shotgun lipidomics datasets,
yet it is a computationally challenging task. Even succes-
sive mass spectrometric analyses of the same sample are
not fully reproducible and masses of identical precursors
and fragments might vary within cer tain ranges. Abun-
dances of background peaks are affected by spra ying
conditions and therefore could hardly serve as robust
references. At the same time, not all genuin e lipid peaks
can be al igned - some peaks might only appear in a few
samples, while being fully undetectable in others. Also,
the available algorithms for aligning mass spectra are
not time-linear and are hardly applicable for shotgun
datasets that include both MS and MS/MS spectra
[23,24].
The LipidXplorer spectra alignment algorithm (Addi-
tional file 4) is similar to the scan averaging algorithm;
however, peak masses are averaged without weighting
and intensities of all peaks are stored in a list. Each bin
is represented by the average mass of individual peaks
within the bin. This mass is associated with correspond-
ing in tensities in individual spectra, in which the aligned
peaks were observed. Note that in tandem mass spectro-
metric experiments precursor ions are typically isolated
within a mass window exceeding 1 Da. Depending on
the mass resolution in MS spectra and the actual width
of the precursor isolation window, multiple precursor
masses might be associated with the same MS/MS
spectrum.
Representative masses of all bins, their intensities in
individual MS spectra and aligned MS/MS s pectra asso-
ciated with corresponding precursor masses represent
scan 1
scan 2
scan 3
scan 4
(a)
(b)
(c)
(d)
)(mR
m
)(mR
m
Figure 3 Scan averaging algorithm. (a) Related individual scans (here as an example we only show four scans) imported as a complete *.
mzXML file are recognized. (b) Peaks are combined into a single peak list and sorted. (c) The full mass range is divided into bins of
[m; m+
m
Rm()
] size, starting from the lowest reported mass. The bold dots stand for the lowest mass of each bin, while the arrow length
reflects the bin size
m
Rm()
. Within each bin, masses are weight averaged by peak intensities and stored. The procedure (steps (c) and (d)) is
repeated two more times on the binned spectrum (not shown). (d) In this way, a single representative average spectrum (d) is produced from
several individual scans (a).
Herzog et al. Genome Biology 2011, 12:R8
/>Page 6 of 25
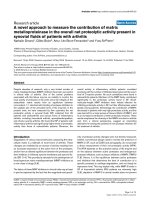
the content of a MasterScan file (Figure 4). Effectively,
the MasterScan is a comprehensive database for collect-
ing all spectra acquired by shotgun analysis of all samples
produced in the full series of biological experiments. The
MasterScan reduces data redundancy, compacts the data-
set size and increases processing speed because there is
no need to probe each individual acquisition successively.
In our experience, it usually reduces the total data
volume by 45 to 85% because only peak intensities
assigned to the re presentative masses of bins, rather than
masses of individual peaks in thousands of original spec-
tra, are stored in the MasterScan.
The Molecular Fragmentation Query Language (MFQL)
MFQL is the first query language developed for the
identification of molecules in complex shotgun spectra
datasets. It f ormalize s the available or assumed knowl-
edge of lipid fragmentation pathways into queries that
are used for probing a MasterScan database. Below we
introduce its design and present an example of compos-
ing a MFQL query for identifying species of phosphati-
dylcholines lipid class in a typical shotgun dataset.
Background and design rationale
MFQL is a specialized query language that is designed
for and only usable with a MasterScan database. MFQL
queries are search masks for probing lipid spectra for
the features stored in the MasterScan, such as precur-
sors and fragment masses and their compositional and
abundance relations. Precursors and fragments could be
defined directly by their masses, by their chemical sum
compositions or by sum composition constraints (sc-
constraints; Figure 5).
A typical MFQL query consists of four sections:
DEFINE: defines sum compositions, sc-constraints,
masses or groups of masses and associates them with
user-defined names.
IDENTIFY: determines where and how the DEFINE
content is applied. It usually encompasses searches for
precursor and/or fragment ions in MS and MS/MS
spectra.
SUCHTHAT: defines optional constraints that are for-
mulated as mathematical expressions and inequalities,
numerical values, peak attributes (Additional file 5), sum
compositions and functions. Several individual con-
straints can be bundled by logical operations and
applied together.
REPORT: establishes the output format.
A single MFQL query identifies all detectable species
of a given lipid class in the dataset, if they share com-
mon fragmentation pathways. The MFQL concept takes
full advantage of the apparent completeness of shotgun
lipidomics datasets that might contain all fragment ions
produced from all plausible precursors. In thi s way
MFQL supports parallel application of any shotgun lipi-
domic approach, s uch as top-down screening [25,26],
multiple precursor and neutral loss scanning [10], multi-
ple reaction monitoring [27,28], among others. The
Backus-Naur-Form (BNF) of MFQL is available in Addi-
tional file 6.
How to compose a MFQL query?
Here we present a MFQL query that formalizes an
example scenario for identifying PC species in a shotgun
dataset a cquired in positive ion mode. In MS/MS
experiments, molecular cations of PC produce the speci-
fic phosphorylcholine head group fragment having the
sum composition of ‘ C5H15O4N1P1’ and m/z
184.07. PC species are identification by recognizing this
fragment ion in MS/MS spectra and by matching the
masses precursor ions in MS to the PC sum compo si-
tion constraints (Figure 6).
First, let us assign a name to the query:
QUERYNAME = Phosphatidylcholine;
Next, we define the variables used for identifying the
species. Our query should identify the singly charged PC
head group fragment and therefore:
DEFINE
headPC = ’C5 H15 O4 N1 P1’ WITH CHG =+1;
In a shotgun experiment not all fragmented peaks will
originate from PCs. For higher search specificity we
next define precursors (prPC) that ar e expected to pro-
duce headPC fragment in MS/MS spectra. We impose
the sc-constraint on precursor masses: in addition
to sum composition requirements, it requests that
MS1: m/z 788.55
Sample 1
Sample 2
Sample 3
Sample n
…
Intensity
184.07 185.07
203745.48
120668.41
335570.03
35746.09
…
181716.38
104364.35
293593.59
27854.38
…
5039.89
2794.06
5684.84
634.43
…
…
MS1: m/z 788.55
Sample 1
Sample 2
Sample 3
Sample n
…
Intensity
184.07 185.07
203745.48
120668.41
335570.03
35746.09
…
181716.38
104364.35
293593.59
27854.38
…
5039.89
2794.06
5684.84
634.43
…
…
MS1: m/z 788.55
Sample 1
Sample 2
Sample 3
…
Intensity
203745.48
120668.41
335570.03
…
181716.38
104364.35
293593.59
…
5039.89
2794.06
5684.84
…
…
MS: m/z 788.55
…
184.07 185.07
…
186.09
203745
120668
335570
35746
…
181716
104364
293593
27854
…
5039
2794
5684
634
…
4265
8362
2374
347
…
Intensity
MS/MS: m/z
Acquisition 1
Acquisition 2
Acquisition 3
Acquisition n
Figure 4 Organization of a MasterScan file. LipidXp lorer imports
and aligns MS and MS/MS spectra into a flat file database
MasterScan. It is shown here as a file cabinet addressed at the top-
level by precursor masses in the MS spectrum, while their intensities
are assigned to individual acquisitions. In this example the lipid
precursor with m/z 788.55 was observed in all acquisitions with an
intensity (in arbitrary units) of 203745 in Acquisition 1; 120668 in the
Acquisition 2; till 35746 in Acquisition n. This precursor m/z 788.55
was fragmented in each acquisition. Masses of fragments were
aligned and substituted by the averaged representative masses,
while the intensities of corresponding peaks in each individual
acquisition were stored. For example, the fragment with m/z 184.07
has an intensity of 181716 in Acquisition 1; 104364 in Acquisition 2;
, till 27854 in Acquisition n.
Herzog et al. Genome Biology 2011, 12:R8
/>Page 7 of 25
precursors a re singly charged and their degree of unsa-
turation (expressed as a doub le bond equival ent) [29] is
within a certain range (here from 1.5 to 7.5):
DEFINE
prPC = ’C[30 48] H[30 200]N[1]O[8 ]P[1]’ WITH
CHG =+1, DBR =(1.5, 7.5);
Next, the IDENTIFY section specifies that ‘ prPC’
precursors should be identified in MS spectra (termed
MS1 in the query) and ‘headPC’ fragments in MS/MS
spectra (termed MS2), both acquired in positive
mode. The logical operation AND requests that
‘headPC’ should only be searched in MS/MS spectra
of ‘ prPC’.
IDENTIFY
prPC IN MS1+ AND
headPC IN MS2+
We further limit the search space by applying optional
project-specific compositio nal constraints formulated in
isobars
+
N
O
O
O
OO
O
-
O
P
O
+
N
O
OO
O
-
O
P
O
O
O
isomers
+
N
O
O
O
OO
O
-
O
P
O
+
N
O
O
-
O
P
O
O
O
head group
0:61 / 1:81 CP1:81 / 0:61 CP
PC 34:1
O
O
or
ester, ether or enyl bond
O
O
All lipids of PC class: ‘C[30 48] H[30 200] N[1] O[7 8] P[1]’
All PC (esters): ‘C[30 48] H[30 200] N[1] O[8] P[1]’
PC 34:1 : ‘C[42] H[82] N[1] O[8] P[1]’
sn-2 fatty acid
sn-1 fatty acid
or fatty alcohol
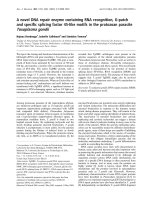
Figure 5 Structural complexity of lipid species and sum composition constraints. Let us consider phosphatidylcholines (PC class lipids) as a
representative example: PC molecules consist of a posphorylcholine head group attached to the glycerol backbone at the sn-3 position, while
fatty acid moieties occupy sn-1 and sn-2 positions (alternatively, a fatty alcohol moiety could be attached at the sn-1 position). Fatty acid
moieties differ by the number of carbon atoms and double bonds, but also by the relative location at the glycerol backbone, so that isomeric
structures having exactly the same fatty acid moieties are possible. Note that isomeric structures are always isobaric, whereas isobaric molecules
are not necessarily isomeric. Most generic constraints (’All lipids of PC class’ or ‘All PC esters’) encompass sum compositions of species with all
naturally occurring fatty acids. However, because of the fatty acid variability, some species of other lipid classes (such as
phosphatidylethanolamines (PE class)) might meet the same constraint. Therefore, for most common glycerophospholipid classes, the
characterization of individual molecular species can not rely solely on their intact masses, irrespective of how accurately they were measured.
MS/MS experiments that produce structure-specific ions contribute more specific constraints, such as the number of carbons and double bonds
in individual moieties, characteristic head group fragment, characteristic loss of a fatty acid moiety, among others. Within a MFQL query, these
constraints can be bundled by boolean operations.
Herzog et al. Genome Biology 2011, 12:R8
/>Page 8 of 25
788.55
3x
100 150 200 250 300 350 400 450 500 550 600 650 700 750 800 850 900 950
m/z, amu
0
100
200
300
400
500
600
700
800
900
1000
1100
1200
1300
1400
Intensit
y
, counts
603.54
599.51
647.51
184.07
184.07
PC
876.80
878.81
904.84
850.79
906.86
742.58
758.57
768.56
848.78
822.76
864.81
890.82
728.57
786.61 836.78
700.54
(a)
(b)
(c)
QUERYNAME = Phosphatidylcholine;
DEFINE prPC = ‘C[20 48] H[30 200] N[1] O[8] P[1]’ WITH DBR = (1.5, 7.5), CHG = 1;
DEFINE headPC = ‘C5 H15 O4 P1 N1’ WITH CHG = 1;
IDENTIFY
prPC IN MS1+ AND
headPC IN MS2+
SUCHTHAT
isEven(prPC.chemsc[C])
REPORT
MASS = prPC.mass;
NAME = “PC [%d:%d]” % “((prPC.chemsc - headPC.chemsc)[C] - 3, prPC.chemsc[db] - 1.5)”;
CHEMSC = prPC.chemsc;
ERROR = “%dppm” % “(prPC.errppm)”;
INTENS = prPC.intensity;
FRAGINTENS = headPC.intensity;;
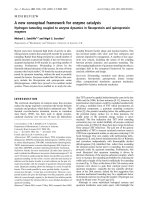
Figure 6 MFQL identification of phosphatidylcholines (PC). The chemical structure of PC is shown in Figure 5. Upon their collisional
fragmentation, molecular cations of PC species produce the specific head group fragment with m/z 184.07 and sum composition ‘C5 H15 O4 P1
N1’. (a) MS spectrum acquired by direct infusion of a total lipid extract into a QSTAR mass spectrometer (inset). All detectable peaks were
subjected to MS/MS. The spectrum acquired from the precursor m/z 788.55 (designated by arrow) is presented at the lower panel. The precursor
ion was isolated within 1 Da mass range and therefore several isobaric lipid precursors were co-isolated for MS/MS and produced abundant
fragment ions unrelated to PC. These ions were disregarded by this MFQL query and did not affect PC identification. (b) MFQL query identifying
PC species, details are provided in the text. (c) Screenshot of the output spreadsheet file; column annotation and content is determined by the
REPORT section of the above MFQL (see also text for details).
Herzog et al. Genome Biology 2011, 12:R8
/>Page 9 of 25
the next SUCHTHAT section. For example, it is generally
assumed that mammals do not produce fatty acids hav-
ing an odd number of carbon atoms. Therefore, we
could optionally limit the search space by only consider-
ing lipids with even-numbered fatty acid moieties.
SUCHTHAT
isEven(prPC.chemsc[C]);
Here the operator isEven requests that candidate PC
precursors should contain an even number of carbon
atoms. Since the head group of PC and the glycerol
backbone contain 5 and 3 carbon atoms, respectively,
this implies that a lipid could not comprise fatty acid
moieties with odd and even numbers of carbon atoms at
the same time.
By executing the DEFINE, IDENTIFY and SUCHTHAT
sections LipidXplorer will recognize spectra pertinent to
PC species. The last section REPORT defines how these
findings will be reported. This includes annotation of
the recognized lipid species, reporting the abundances
of characteristic ions for subsequent quantification and
reporting a dditional information pertinent to the analy-
sis, such as masses, mass differences (errors), and so on.
LipidXplorer outputs the findings as a *.csv file in which
identified species are in rows, while the column content
is user- defined. In this example we define five columns,
including NAME (to report the species name) and four
peak attributes, such as: MASS, species mass; CHEMSC,
chemical sum composition; ERROR, difference to the
calculated mass; INTENS, intensities of the specified
ions reported for each individual acquisition.
REPORT
MASS = prPC.mass;
NAME = “PC [%d:%d]” % “((prPC.chemsc -
headPC.chemsc)[C] - 3, prPC.chemsc[db]
- 1.5)";
CHEMSC = prPC.chemsc;
ERROR = “%dppm” % “(prPC.errppm)";
INTENS = prPC.intensity;
FRAGINTENS = headPC.intensity;;
It is also possible to define mathematical terms or use
certain functions, such as text formatting, on these attri-
butes. The text format implies two strings separated by
‘%’ , where the first string contains placeholders and the
second string their content. This formatting is used in
the NAME string such that the actual annotation conven-
tion remains at the user’ s discretion. In this example
two placeholders ’ %d’ of the lipids class name “ PC
[%d: %d] “ are filled with the number of carbon atoms
and double bonds in the fatty acid moieties. The num-
ber of carbon atoms is calculated by subtracting the
sum composition of ’ headPC’ from the precursor
’p rPC’ and subtracting 3 for carbons in the glycerol
backbone (Figures 5 and 6).
We note that here our assignment of PC species only
relied upon their precursor masses and the identification
of the specific head group fragment in their MS/MS
spectra. Therefore, we could only annotate the species
by the total number of carbon atoms and double bonds
in both fatty acid moieties (like PC 36:1), but we could
not
determine what these individual moieties really
were.
Validation of the LipidXplorer algorithms
LipidXplorer h as been subjected to extensive validation
in two ways. First, we tested scan averaging, spectra
alignment and isotopic correcti on routines in a series of
experiment s with specifically designed datasets . Second,
we benchmarked overall LipidXplorer identification per-
formance against available lipidom ics software using the
Escherichia coli total lipid extract a s a sample and the
curated list of identified species as a reference.
Validation of scan averaging
We compared scan averaging in LipidXplorer with the
related procedure impl emented in Xcalibur software - a
dedicated tool for processing spectra acquired on
Thermo Fisher Scientific mass spectrometers and the de
facto standard in processing of high-resolution spectra.
To this end, we acquired a dataset of MS spectra of 325
lipid extracts on a LTQ Orbitrap mass spectrometer
with a mass resolution of 100,000. Each acquisition con-
sisted of 19 scans, which were independently averaged
by Xcalibur and LipidXplorer. Then, each pair of aver-
aged spectra within the same acquisition was aligned by
peak masses, such that the two masses m
1
and m
2
were
considered identical if |m
2
- m
1
|<
m
Rm
1
1
()
,wheremass
resolution R = 100,000. To test if the algorithm perfor-
mance was affected by chemical noise in the aligned
spectra, we selected peaks with intensities above 1%,
0.5% and 0.1% of the base peak intensity. It is usually
assumed that the typical dynamic range (the ratio of
intensities of the most abundant to the least abundant
signal) in Orbitrap spectra is less than 1,000-fold [30]
and therefore the intensity threshold of 0.1% corre-
sponds to peaks that are at the edge of r eliable detec-
tion. We found that the averaging algorithm performed
well on peaks selected at the lowest threshold: only 7%
of peaks mismatched, while mass differences between
the aligned peaks were, on average, w ithin 0.3 ppm and
their intensities differed by less than 3%. Spearman ra nk
correlation factors (SRCFs) were calculated using the
intensities of aligned peaks and the average SRCFs are
presented in Table 2. We concluded that the simple
Herzog et al. Genome Biology 2011, 12:R8
/>Page 10 of 25
algorithm implemented in LipidXplorer performed
equally well as the related algorithm in Xcalibur (Addi-
tional file 7).
Validation of isotopic correction
The isotopi c correction algori thm adjusts the i ntens ities
of peaks within partially overlap ping isotopic clusters of
neighboring lipid species [7,12,20]. The algorithm com-
putes the expected profiles of isotopic clusters from the
sum compositions of identified lipids and corrects corre-
sponding peak intensities in both MS and MS/MS
modes.
Totestthealgorithm,weinjectedamixtureoffour
phosphatidic acid (PA) standards with the molar ratio
1:9:1:1 into a LTQ Orbitrap Velos mass spectrometer
and acquired MS and MS/MS spectra. The two stan-
dards PA 18:0/18:2 and PA 18:1/18:1 have the same
exact masses; therefore, in MS spectrum the ratio of
precursor ion intensities of 10:1:1 was anticipated. For
species quantification in MS /MS spectra, we summed
the intensities of acyl anions of corresponding fatty acid
moieties expecting the ratio of 1:9:1:1 (Figure 7).
Measured molar ratios agreed with the expected ratios
and ratios calculated from computationally simulated
spectra (data not s hown). We underscore that is otopic
correction is absolutely required to determine the con-
tent of relatively low abundant species. Even at the
moderate dynamic range o f 1:9, t he abundance of PA
18:0/18:1 would have been drastically overestimated in
both MS and MS/MS measurements (Additional file 8).
Validation of the spectra alignment algorithm
The algorithm should recognize related peaks within the
submitted spectra and attribute them to mass bins in a
resolution-dependent manner, while individual peak
abundances should be preserved. An ideal validation test
should encompass a large collection of real-life spectra,
while in each spectrum the correct (rather than mea-
sured) masses of peaks observed even at the lowest sig-
nal- to-noi se ratio should be exactly known. Since this is
unfeasible, we validated the algorithm in two separate
tests. In the first test, peak a bundances were effectively
disregarded, yet the correct masses were exactly known
and the dataset composition was controlled. The second
test relied on a compendium of real-life spectra of total
lipid extracts having typical distribution and variability
of abundances of genui ne lipid peaks, along with a large
number of background peaks and chemical noise. How-
ever, the exact composition of lipid species in each sam-
ple was not known.
We first designed an experiment in which several
spectra were computationally generated from a template
spectrum and aligned in a MasterScan. The a bundances
of peaks were then correlated with the abundances of
peaks in the original template spe ctrum. We designed
the template spectrum such that the distance between
the two adjacent peaks with the masses m
1
and m
2
was
m
Rm
1
1
()
,whereR = 500. Within a mass range of 500 to
945, which covers most lipid precursors, the template
contained 319 peaks that were spaced, on average, b y a
distance of 1.4 Da. From this template we generated 256
spectra in which masses of peaks were randomly
selected from Gaussian distributions having the centroid
m and s =
2m
Rm()
, where R = 100,000 and m is the cor-
responding mass from the template spectrum. Note
that, under selected resolution and spacing, peaks in th e
simulated spectra did not overlap.
Conventionally, LipidXplorer successively repeats
spectra binning three times. However, for this test only,
we configured LipidXplorer such that peaks were binned
one, two and three t imes. After importing the spectra,
we anticipated that all 319 peaks of the template spec-
trum should be present in the MasterScan and that
occupation of individual peaks through all 256 spectra
should mirror Gaussian distribution, if peaks were only
binned once. Therefore, we expected to find 319 peaks
with an average occupation of 0.68, since this is the
number of peaks fall ing into the rage of [m- s, m+s]of
the distribution, which equals a bin size of
m
Rm()
.
Indeed, we found that after one-step binning 319
peaks were correctly aligned and had an average occupa-
tion of 0.65 (Table 3). The average mass difference
between the template and aligned peaks were 0.9 mDa.
As expected, repeating the procedure substantially
improved the binning accuracy (Additional file 9).
However, this test assumed that in the aligned spectra
no unrelated peaks fall into the same mass bin, which is
unrealistic in real-life shotgun spectra. Therefore, we
next tested if the alignment accuracy was affected by the
complexity of the analyzed lipid mixtures and by chemi-
cal noise. To this end, we compare d lipid species identi-
fied by LipidXplorer in individual spectra and in the
same spectra aligned within the MasterScan.
Using 128 MS spec tra of total lipid extracts of differ-
ent human blood plasma samples [25], we compiled a
Table 2 Comparison of scan averaging algorithms in
Xcalibur and LipidXplorer
Intensity threshold 1% 0.5% 0.1%
Number of peaks 158.40 ±
23.57
237.62 ±
37.36
736.22 ±
128.71
Mass difference, ppm 0.06 ± 0.09 0.08 ± 0.09 0.30 ± 0.09
Intensity difference, % 0.61 ± 0.87 0.72 ± 0.86 3.00 ± 1.24
Spearman rank
correlation
0.99 ± 0.02 0.98 ± 0.02 0.94 ± 0.03
Mismatched masses, % 1.45 ±1.44 2.37 ± 1.57 7.06 ± 2.36
All values are average ± standard deviation.
Herzog et al. Genome Biology 2011, 12:R8
/>Page 11 of 25
MasterScan file in which individual spectra were mass-
aligned as described above. In parallel, each of these 128
spectra was submitted to LipidXplorer, lipid species
were identified under the same settings, and then the
spectra were aligned by identified species (not by peak
masses, as in the MasterScan). We note that, in both
tests, the intensities of peaks in individual spectra were
preserved. We then computed Pearson correlation fac-
tors (PCFs) between the intensities of pe aks of the same
lipid species in the same acquisition, either determined
in the raw ‘as submitted’ spectrum (lipids were identified
in individual spectra), or aligned within the MasterScan
file (lipids were identified by probing the MasterScan ).
We anticipated that accurate alignment of multiple
spectra would increase the mass accuracy of each indivi-
dual peak and improve peak identifications. A total of
218 lipid species was recognized by both methods. Of
these, three and six species were not identified in the
MasterScan and in individually processed spectra,
9
10
0
0.5
1
1.5
2
2.5
PA [36:2] PA [36:1] PA [36:0] PA [18:0 /
18:2]
PA [18:1 /
18:1]
PA [18:0 /
18:1]
PA [18:0 /
18:0]
Lipid species
mol ratio
with isotopic correction
without isotopic correctio
n
MS MS/MS
Figure 7 Validation of the isotopic correction algorithm using a PA mixture. Molar ratios of PA standards were determined in four
replicates with and without isotopic correction of abundances of peaks within partially overlapping isotopic clusters. Molar ratios in MS spectra
were determined from the abundances of precursor peaks and in MS/MS spectra as the sum of the abundances of acyl anions of the fatty acids
moieties. Error bars stand for standard deviations from the average molar ratios.
Table 3 Computational validation of the peak alignment
algorithm
Number of binning
cycles
Average peak
occupation
Average mass
difference, ppm
1 0.65 ± 0.05 1.3 ± 0.8
2 0.87 ± 0.08 1.6 ± 0.7
3 0.97 ± 0.04 0.4 ± 0.4
Herzog et al. Genome Biology 2011, 12:R8
/>Page 12 of 25
respectively. We compared the intensities of lipid peaks
identified by both methods by calculating the PCFs of
their intensity vectors (Figure 8) and found that the
PCFs of 15 lip id species out of the total of 218 fell
below 0.8. Case-by-case inspection of these showed that
isotopic clusters of three species in individual spectra
were altered by background or spray instability. The
remaining 12 lipid species were very low abundance and
their peak intensities were below 0.1% of the i ntensities
of base peaks in corresponding spectra. We therefore
concluded that, while building a MasterScan, mass-
alignment of peaks was, in general, co rrect. The full test
dataset is available in Additional file 10.
Benchmarking the lipid identification performance
We benchmarked the LipidXplorer performance in two
ways.First,weprovidedanestimateoftherateoffalse
positive identifications by shotgun analysis of a total
lipid extract. Second, we compared LipidXplorer identi-
fication performance with other programs that support
shotgun lipidomics experiments by interpreting peak
lists produced from MS and MS/MS spectra.
We note that the composition of any complex real-life
lipid extract might not be exactly known and it is there-
fore difficult to judge if any particular identification is a
false positive. To circumvent this problem, we first pro-
duced a dataset of MS and MS/ MS spectra by analyzing
a commercially available total lipid extract of E. coli on
a LTQ Orbitrap XL mass spectrometer using data-
dependent acquisition in negative ion mode. It is known
that, upon collision- induced dissociation, molecular
anions of glycerophospholipids produce abundant acyl
anions of their fatty acid moieties that enable unequivo-
cal identification of individual molecular species [31].
The glycerophospholipidome of wild type E. coli com-
prises bulk quantities of phosphatidylethanolamines (PE
class) and phosphatidylglycerols (PG class) and minor
amounts of PA [32-34] that are identifiable with any
available software. Also E. coli does not produce lipids
with polyunsaturated fat ty acid (PUFA) moieties [33,35].
Therefore, we reasoned that species of other glyceropho-
spholipid classes (such as phosphatidylinositols (PI class)
and phosphatidylserines (PS class)) or any species con-
taining PUFA, if identified by the software, will likely
represent false positives. Cardiolipins, another major
component of the E. coli lipidome, could be detected as
both singly and doubly charged molecular anions, which
might lead to inconsistent interpretations of both MS
andMS/MSspectrabydifferentsoftware.Wetherefore
deliberately omitted the identification of cardiolipins
from our benchmarking protocol.
Lipid composition of the standard E. coli extract was
determined in two ways. First, a list of species was pro-
duced by manual interpretation of spectra acquired on a
LTQ Orbitrap XL machine with high mass resolution of
100,000 and 15,000 (FWHM, m/z 400) in MS and MS/
MS modes, respectively, which allowed us to impose
stringent cons traints for matching of both precursor and
fragment peaks. In this way, we identified 38 lipid species
of the PE, PG and PA classes. Independently, the same
extract was analyzed by the multiple precursor ion scan-
ning (MPIS) method on a quadrupole time-of-flight mass
spectrometer [16]. The interpretation of the MPIS data-
set by LipidProfiler software confirmed 36 species repre-
senting 95% of the species identified manually. The
intersection of species identified by manual interpretation
of high resolution spectra and by MPIS/LipidProfiler was
assumed as a reference list. Within the reference list, 78%
150
34
10
23
10
0
20
40
60
80
100
120
140
160
1 0.99 - 0.9 0.9 - 0.8 0.8 - 0.7 0.7 - 0.6 < 0.6
lipid species
Pearson Correlation Factor clusters
Figure 8 Pearson correlation factors of peak abundances in the MasterScan and individual spectra. In total, the dataset consisted of 128
high resolution MS spectra of total lipid extracts in which 219 peaks of individual lipid species were recognized. The exact number of peaks
assigned to lipid species is provided for each PCF bin. The average PCF calculated for the entire dataset had a value of 0.94
Herzog et al. Genome Biology 2011, 12:R8
/>Page 13 of 25
of lipids were a lso present in the LIPIDMAPS database
(Table 4). We underscore that, while compiling a refer-
ence list, we aimed to provide the most conservative
minimalistic estimate of the lipid composition, that is, we
included only the species that must be identifiable in any
further software tests. This does not imply that PE and
PG species other that in the reference list are necessarily
false positives.
In summary, our software benchmarking procedure
relied upon the following rationale: we e stimated the
rate of false negative identifications by comparing the
software output to the refere nce list and we estimated
the rate o f false positive identifications by forcing the
software to identify species from lipid classes that are
not produced by E . coli. For the latter test, we only con-
sidered the lipid classes whose precursors readily pro-
duce molecular anions and whose masses might overlap
with precursors of genuine E. coli lipids (PE, PG, PA) in
low resolution mass spectra. Although LipidXplorer
could restrict the search space by sc-constraints and,
hence, reduce the expected rate of false positives (data
not shown), for better consistency with other tested pro-
grams it was set to report hits with fatty acid moieties
having up to 22 carbon atoms and up to 6 double
bonds.
A separate dataset was acquired in eight technical
replicates from the same E. coli extract under the low
mass resolution of 800 for both MS and MS/MS modes,
which is common for triple quadrupole or ion tr ap
instruments. This dataset was independently processed
by LipidXplorer, LipidQA and LipidSearch programs
(Table 4). LipidQA and LipidSearch could only process
each technical replicate independently. Therefore, their
output was aligned by the reported lipid species and
species identified in less than four (out of the total of
eight) replicates were di scarded. The same criterion was
applied using an occupation threshold of 50% while test-
ing LipidXplorer.
LipidXplorer produced a total of 53 identifications,
which included 36 (100%) species from the reference list
plus another 17 species (see Additional file 11 for corre-
sponding MFQL queries). A ccording to the above con-
vention, one species was declared a false positive. Both
LipidQA and LipidSearch reported fewer species from
the reference lists and more false positives (Table 4). A
full list of species identified by all software tools is pre-
sented in Additional file 12.
Based on these findings, we concluded that LipidX-
plorer outperformed the currently available software in
interpreting shotgun lipidomics datasets.
Benchmarking LipidXplorer speed
Importing a dataset of 32 samples each consisting of 55
MS and 110 MS/MS scans in * .mzXML format took 59
s on an Intel Core 2 Duo CPU (T9300; 2.50 GHz) com-
puter under Windows Vista. The total size of the *.
mzXML files was 45 MB, whereas the size of the pro-
duced MasterScan file was only 3.35 MB. LipidXplorer
identification of species of six lipid classes (PC, PC-O
(1-alkyl-2-acylglycerophosphocholines), PE, PE-O (1-
alkyl-2-acylglycerophosphoethanolamines), SM (sphingo-
myelins) and TAG (triacylglycerols)) required 59 s.
To test how the processing speed of LipidXplorer is
affected by the spectra dataset size, we imported
mzXML files totaling 168 MB that comprised 248 MS
acquisitions each of approximately 2,400 peaks. Building
the MasterScan file took 13 minutes o n the same desk-
topPCandrequired0.7GBofRAM.Subsequent
screening of the 29.1 MB MasterScan file with 16
MFQL queries re quired only 6.5 s. We note that a Mas-
terScan is only built once from all spectra acquired
in the project. Further interpretation of the dataset,
Table 4 Benchmarking LipidXplorer identification performance using the E. coli lipidome
Lipid class Reference list LipidMaps
a
LipidQA
b
LipidSearch LipidXplorer
True positives
PA
c
0 0 0/1 0/1 0/0
PE 21 18 12/14 14/21 21/27
PG 15 10 8/13 9/17 15/25
Compliance
d
, % 56 64 100
False positives
PS 20 0
PI 00 0
PUFA species
e
72 1
Total 92 1
a
The lipid species database is at [53].
b
The number of identified species is presented as ‘Number of species that belong to the reference list/Total number of
identified species’. The numbers are presented separately for each class.
c
PA is a very minor (<0.01 mol%) component of the E. coli lipidome.
d
Compliance is a
ratio of the total number of identified species that belong to the reference list to the total number of identified species. It is calculated for species of all three
lipid classes together.
e
Putative lipid species with polyunsaturated fatty acids (PUFAs) were searched within PA, PE and PG lipid classes. With respect to PUFAs
here, we assumed fatty acids having more than two double bonds to account even for the rarest instances when a moiety might contain one double bond and
one cyclopropane ring.
Herzog et al. Genome Biology 2011, 12:R8
/>Page 14 of 25
including repetitive screening for other lipid classes or
using alternative signature ions, does not require chan-
ging the MasterScan. Although LipidXplorer does not
explicitly restrict the size of mzXML files, in our ex peri-
ence a dataset of 500 acquisitions each comprising 2,500
peaks might be a practical limit for desktop computers
having up to 4 GB of RAM.
Enabling functionalities of LipidXplorer
Using MasterScan and MFQL within L ipidXplorer soft-
ware has two important analytical implications. First,
LipidXplorer accurately processes MS and MS/MS spec-
tra acquired on different tandem mass spectrometers
whose mass resolution varies from the unit (triple quad-
rupoles, ion traps) to 100,000 (Orbitrap). Second, the
software identifies any individual lipid species or entire
lipid classes that were ionized and fragmented during
the shotgun experiment.
LipidXplorer supports mass resolution-dependent
interpretation of shotgun mass spectra
Mass resolution and mass accuracy of detec ted peaks
are determined by the type of employed tandem mass
spectrometer. LipidXplorer imports spectra in generic
mzXML format and converters from proprietary formats
to mzXML are available for major instrument platforms.
Here we provide evidence that LipidXplorer consistently
and accurately interprets spectra acquired at different
mass resolution and accuracy.
We performed several independent shotgun analyses
of an E. coli total lipid extract on a LTQ Orbitrap XL
mass spectrometer under different target mass resolu-
tion settings (described as experiments I to V in Materi-
als a nd methods; Figure 9) and interpreted the datasets
with LipidXplorer. W ithin the series of successive MS
experiments, mass accuracy of the Orbitrap analyzer
was dependent only on the target resolution R;there-
fore, for matching the masses of lipid species, we
assumedthatthetoleranceatmassm equals
m
Rm()
.
We were interested in the number of false positive
assignments of detected peaks to PE-O species that are
not produced in E. coli, but closely resemble the structure
and often have masses isobaric with abundant PE species.
ThedifferenceinexactmassesofisobaricPEandPE-O
species is 36.4 mDa and their peaks can be dist inguished
in high resol ution spectra [26,27]. Since the same sample
was analyzed each time and the same precursor and frag-
ment masses were expected, the experiment provided a
MS Resolution
MS Accuracy
MS/MS Resolution
MS/MS Accuracy
False assigned PE- O
43
33
10
50
0
5
10
15
20
25
30
35
40
45
50
700 7500 30000 100000 100000
0.3 Da 75 ppm 20 ppm 5 ppm 5 ppm
300 300 300 300 15000
0.3 Da 0.3 Da 0.3 Da 0.3 Da 0.005 Da
Figure 9 LipidXplorer accurately interprets both high and low resolution mass spectra. The number of PE-O species falsely assigned by
LipidXplorer software in shotgun analysis of a total E. coli lipid extract under different target mass resolutions.
Herzog et al. Genome Biology 2011, 12:R8
/>Page 15 of 25
consistent dataset for benchmarking LipidXplorer perfor-
mance in interpreting spectra acquired on low- and high-
resolution instruments.
Diacyl (PE) and alkylacyl (PE-O) lipids were distin-
guished by assigning the correct sum compositions to
peaks observed at a mass resolution of 30,000. The num-
ber of false assignments to PE-O droppedfrom33ata
MS resolution of 7,500 to 10 at a MS resolution of
30,000, which, as expected, distinguished peaks with a
mass offset of approximately 30 mDa. Increasing mass
resolution in MS spectra up to 100,000 further decreased
the number of false positives, yet did not eliminate them
completely. When the mass resolution was also increased
in MS/MS mode up to 15,000 and enabled to match frag-
ment masses with an accuracy of better than 5 mDa, the
number of false positive assignments dropped to zero
(Figure 9). Hence, we demonstrated that LipidXplorer
takes full advantage of the high mass resolution and mass
accuracy of a hybrid tandem mass spectrometer. It has
also become apparent that averaging and alignment of
related peaks in multiple experiments did not compen-
sate for the limited identification specificity of low resolu-
tion machines (Additional file 13).
LipidXplorer supports consistent cross-platform
identification of lipids
By its design and operational principles, LipidXplorer is
not tethered to any particular mass spectrometry plat-
form. The program imports shotgun spectra as instru-
ment-independent peak lists or mzXML files. When
building a MasterScan, LipidXplorer only considers a
few generic features of raw MS and MS/MS spectra,
such as mass resolution and mass accuracy, while
MFQL adapts lipid identification routines to machine-
dependent molecular fragmentation pathways. This
implies that even if raw spectra are acquired on different
machines and using different analytical modes (MS or
MS/MS), their LipidXpl orer interpretati on should result
in quantitatively consistent profiles provided the intensi-
ties of selected precursor and/or fragment peaks ade-
quately represent the abundances of lipid species. To
substantiate this, we validated LipidXplorer cross-plat-
form performance in two steps. First, we demonstrated
that lipid quantification by LipidXplorer corroborates an
established independent analytical method that relies on
a different instrument, operation mode and software;
this ensured that LipidXplorer interpretations were cor-
rect. Second, we employed LipidXplorer for interpreting
shotgun datasets of MS and MS/MS spectra acquired on
different instruments and demonstrated that it produced
quantitatively concordant molecular species profiles.
To this end, we analyzed a total lipid extract of E. coli
on the LTQ Orbitrap Velos by MS and data-dependent
MS/MS. Then, the same extract was analyzed on a
quadrupole time-of-flight mass spectrometer QSTAR
Pulsar i by MS and MS/MS and also by the MPIS
method, which is a unique feature of QSTAR machines
[16,31]. The dataset of MPIS spectra was processed
using LipidProfiler software. For better consistency, the
mass resolution of the Orbitrap was set a t 7,500 such
that it was close to the mass resolution of the QSTAR.
MS and MS/MS spectra were imported into MasterScan
databases as mzXML files and the same MFQL queries
(Additional file 11) were applied to identify and quantify
24 major species (15 from PE an d 9 from PG lipid
classes) that were detected in all analyses with good sig-
nal-to-noise ratios, which was important for consistent
comparison of in dependent experiments. MS quantifica-
tion relied on the intensities of intact molecular anions
of corresponding species, while for MS/MS quantifica-
tion the MFQL queries reported the intensities of acyl
anion fragments of corresponding fatty acid moieties of
each fragmented lipid precursor [10,16].
We observed that the relative abundances of species
quantified in MS and MS/MS spectra acquired on the
Obitrap and QSTAR instruments by LipidXplorer were
highly correlated and also corroborated the profile inde-
pendently obtained by M PIS analysis and LipidProfiler soft-
ware (Figure 10 and Table 5). We then correlated relative
abundances of individual species determined by LipidX-
plorer in MS and MS/MS spectra acquired using different
machines and different modes (for example, Orbitrap MS
versus QSTAR MS/MS or Or bitrap MS/MS versus
QSTAR MS) and compared them to profiles acquired on
the same machine in different modes (Orbitrap MS versus
Orbitrap MS/MS or QSTAR MS versus QSTAR MS/MS)
(Additional file 14). In all indepe ndent comparisons
(Figure 10; Additional file 14) we observed good correlation
of relative quantities of individual lipid species. Impor-
tantly, the slopes of scatter plots were all close to a va lue of
1.0, indicating that LipidXplorer introduced no instru-
ment-dependent or me thod-dependent systematic bias.
We therefore concluded that LipidXplore r processed
spectra acquired using different mass spectrometers and
by different (MS and MS/MS) methods in a consistent
and quantitative manner.
LipidXplorer exploits the diversity of lipid fragmentation
pathways
Lipid identification relies upon specific ‘signature’ ions
detectable in MS and/or MS/MS mode that, not neces-
sarily unequivocally, distinguish the molecular species
from molecules of other lipid classes or of the same
class. The conceptual advance of MFQL is that many of
these ions and/or their combinations can be simulta-
neously recognized in each MS/MS spectrum and
bundled with severa l independent sc-constrain ts. Here
we demonstrate that these assignments are accurate and
Herzog et al. Genome Biology 2011, 12:R8
/>Page 16 of 25
0.0
5.0
10.0
15.0
20.0
25.0
30.0
35.0
PE [30:1]
PE [30:0]
PE [31:1]
PE [32:2]
PE [32:1]
PE [32:0]
PE [33:2]
PE [33:1]
PE [34:2]
PE [34:1]
PE [35:2]
PE [35:1]
PE [36:2]
PE [36:1]
PE [37:2]
PG [30:0]
PG [32:1]
PG [32:0]
PG [33:1]
PG [34:2]
PG [34:1]
PG [35:2]
PG [36:2]
PG [36:1]
MS QSTAR
MS Velos
MPIS / LipidProfiler
0.0
5.0
10.0
15.0
20.0
25.0
30.0
35.0
PE [30:1]
PE [30:0]
PE [31:1]
PE [32:2]
PE [32:1]
PE [32:0]
PE [33:2]
PE [33:1]
PE [34:2]
PE [34:1]
PE [35:2]
PE [35:1]
PE [36:2]
PE [36:1]
PE [37:2]
PG [30:0]
PG [32:1]
PG [32:0]
PG [33:1]
PG [34:2]
PG [34:1]
PG [35:2]
PG [36:2]
PG [36:1]
QStar MS/MS
Velos MS/MS
MPIS / LipidProfile
r
(
a
)
(b)
Relative content, %Relative content, %
Figure 10 LipidXplorer supports the interpretation of spectra acquired using different mass spectrometers. (a) Comparison of the
relative abundances of 24 major PE and PG lipid species identified in a total E. coli extract in MS and data-dependent MS/MS modes on the LTQ
Orbitrap Velos (red bars) and QSTAR Pulsar i (blue bars) mass spectrometers, while spectra were interpreted by LipidXplorer. The same extract
was analyzed by MPIS on the QSTAR Pulsar i and LipidProfiler software (green bars). Species abundances were normalized to the total
abundance of the lipid class; error bars (standard deviation) were calculated on the basis of six experiments. Correlation coefficients and slopes
of scatter plots for each pair-wise comparison are presented in Table 5.
Herzog et al. Genome Biology 2011, 12:R8
/>Page 17 of 25
coherent and could be employed in parallel to recognize
individual species of multiple lipid classes in total lipid
extracts.
A dataset of MS and MS/MS spectra was acquired in
six technical replicates from a commercially available
bovine heart total lipid extract on a LT Q Orbitrap XL
mass spectrometer in negati ve ion mode. Using LipidX-
plorer software, a MasterScan database was compiled
and probed with MFQL queries composed for 19 lipid
classes, and 188 lipids of 15 classes were identified
(Table 6). MFQL queries and the full list of identified
species are provided in Additional files 15 and 16,
respectively.
The interepretation of a shotgun dataset by LipidX-
plorer takes advantage of independent use of several sig-
nature ions for each lipid class. If detected at the high
mass resolution, precursor ions of intact lipids are signa-
ture ions themselves. Some lipid classes, such as TAG,
DAG and CL, have unique compositions of N, O and P
atoms and can be unequivocally identified solely by
their intact masses with no recourse to MS/MS [26].
Otherwis e, spe cies identifica tion should rely on signa-
ture ions in MS/MS spectra, such as acyl anions of fatty
acid moieties, products of neutral losses of fatty acid
moieties, head group fragments, and so on. As an exam-
ple, we demonstrate h ere how using multiple signature
ions helped in identifying molecular species of structu-
rally related PC and PC-O lipids (Figure 5). The analysis
was performed in negative ion mode in which both PC
and PC-O were detected as molecular adducts with acet-
ate anions (Figure 11). Species of both classes have the
phosphorylcholine head group attached to the glycerol
Table 5 Cross-platform correlation of relative abundances of E. coli lipids
a
Statistical Orbitrap versus QSTAR
c
Orbitrap versus MPIS QSTAR
d
QSTAR versus MPIS QSTAR
e
Mode Estimates
b
PE PG PE PG PE PG
MS Correlation coefficient 0.99 0.99 0.97 0.94 0.95 0.94
Slope 0.95 1.14 1.0 0.85 1.03 0.89
MS/MS Correlation coefficient 0.99 0.99 0.97 0.94 0.95 0.94
Slope 0.96 0.96 1.00 0.85 1.03 0.89
a
Relative abundances of PE and PG species are presented in Figure 10.
b
The values of correlation coefficients R
2
and slopes were calculated from corresponding
scatter plots.
c
Species were quantified by LipidXplorer using MS and MS/MS spectra acquired independently on the Orbitrap and QSTAR, respectively. MS/MS
experiments were performed in data-dependent acquisition mode.
d
Species were quantified by LipidXplorer using, respectively, MS and MS/MS spectra acquired
at the Orbitrap machine. Relative abundances of individual species were correlated against corresponding relative abundances independently determined by
MPIS on the QSTAR and LipidProfiler software.
e
Species were quantified by LipidXplorer using, respectively, MS and MS/MS spectra acquired on the QSTAR
machine in data-dependent acquisition mode. Relative abundances of individual species were correlated with those determined by MPIS and LipidProfiler.
Table 6 Multifaceted identification of bovine brain lipid species by LipidXplorer
Lipid class
a
Number of identified species Number of signature ions FA
b
FAO
b
HG
b
NL
b
MS
c
PC 13 4 X X
d
XX
PC-O 17 4 X X X X
LPC 4 3 X X X
Cer 3 2 X X
CL 10 1 X
LCL 2 2 X X
DAG 13 1 X
PE 22 3 X X X
PE-O 35 3 X X X
LPE 4 2 X X
PG 10 3 X X X
PI 13 4 X X X X
PS 10 4 X X X X
SM 7 2 X X
TAG 25 1 X
a
MFQL queries identifying species of these lipid classes are presented in Additional file 15.
b
FA, acyl anions of fatty acid moieties; FAO, product of the neutral
loss of a fatty acid moiety from sn-2 position of the glycerol backbone; HG, fragment of the head group specific for all species of the same lipid class; NL, neutral
loss of a fragment specific for all species of the same class; MS, precursor mass.
c
Two X symbols indicate that precursor species of this class are detected in two
molecular forms (for example, deprotonated ion and acetate adduct), or as doubly and singly charged ions.
d
Two X symbols indicate that two signature ions of
the same type are observed (for example, two acyl anions of both fatty acid moieties). Cer, ceramides; CL, cardiolipins; DAG, diacylglycerols; LCL, triacyl-
lysocardiolipins; LPC, lysophosphatidylcholines; LPE; lyso-phosphatidylethanolamines; PC, phosphatidylcholines; PC-O, 1-alkyl-2-acylglycerophosphocholines; PE,
phosphatidylethanolamines; PE-O, 1-alkyl-2-acylglycerophosphoethanolamines; PG, phosphatidylglycerols; PI, phosphatidylinositols; PS, phosphatidylserines; SM,
sphingomyelins; TAG, triacylglycerols.
Herzog et al. Genome Biology 2011, 12:R8
/>Page 18 of 25
0
0.05
0.1
0.15
0.2
0.25
0.3
0.35
PC-O 32:
2
PC-O 32:1
PC-O 34:
4
PC-O 34:
3
PC-O 34:
2
PC-O 36:
5
PC-O 36:
4
PC-O 36:
3
PC-O 36:
2
PC-O 38:
6
PC-O 38:
5
PC 32:1
PC 32:0
PC 34:2
PC 34:1
PC 36:4
PC 36:3
PC 36:2
PC 36:1
PC 36:0
PC 38:4
MS
NL 74
FA / FAO
(c)
O
–
O
P
O
–
O
N
+
O
O
O
O
O
O
H
NL 74
FA 281.3
FA 283.2
250 300 350 400 450 500 550 600 650 700 750 800 850
m/z
0
20
40
60
80
100
Relative Abundance
772.4
281.3
764.4
283.2
MS:
846.6224
(a)
O
–
O
O
O
O
H
O
P
O
N
+
O
–
O
250 300 350 400 450 500 550 600 650 700 750 800
m/z
0
20
40
60
80
100
Relative abundance
726.4
279.2
464.4
MS:
800.5808
FA 279.2
NL 74FAO 464.4
(b)
NL 74
NL 74
Relative abundance
Figure 11 Identification of PC and PC-O species by MFQL queries relying on complementary signature ions. (a) MS/MS spectrum of the
precursor ion of the acetate adduct of PC 36:1 (m/z 846.6224), in which four signature ions are recognized: molecular ion (MS); fragment of
neutral loss of acetate and methyl group (Δm/z = 74.0 (NL)); acyl anions of the two fatty acid moieties (FA 281.3 and FA 283.2; both boxed in
the chemical structure at the top). (b) MS/MS spectrum of the acetate adduct of PC-O 34:3 (m/z 800.5808). Signature ions are the same as in (a),
except m/z 464.4 representing the fragment produced by neutral loss of the sn-2 fatty acid moiety. (c) Quantitative profiles of PC and PC-O
species reported from abundances of different signature ions. MS, precursor ions in MS spectra; NL 74, neutral loss Δm/z 74 in MS/MS spectra;
FA/FAO, acyl anions of fatty acid moieties and (for PC-O) neutral loss of sn-2 fatty acid moiety. The relative abundance of species was normalized
to the total abundance of species within each (PC or PC-O) class.
Herzog et al. Genome Biology 2011, 12:R8
/>Page 19 of 25
backbone at the sn-3 position and the fatty acid moiety
at the sn-2 position (Figure 5). However, at the sn-1
position ester (PC) species have another fatty acid moi-
ety, whereas e ther (PC-O) species have a fatty alcohol
moiety. To identify PC species, four signature ions could
be considered (Table 6, Figure 11): intact precursor ion;
fragment ion produced by neutral loss of 74 Da that is
specific for the head group fragment; and two acyl
anions of fatty acid moieties (Figure 11a). PC-O species
can be identified (and distinguished from PC species)
also by four signature ions (Table 6). Compared to PC,
accurate masses of the intact precursor ion and of the
fragment of 74 Da neutral loss should meet different sc-
constraints. The third signature ion is the fragment of
neutrallossofthefattyacidmoietyandthefourthis
the acyl anion of the fatty acid moiety itself (Figure 11b).
At the same time, masses of the fatty acid and fatty alco-
hol moieties should complement the intact precursor
mass. The high mass resolution of the Orbitrap mass
analyzer allowed us to distinguish peaks of intact isobaric
PC and PC-O, as well as of SM (also prese nt in the total
extract) and first isotopic peaks of PC. In MS/MS spectra
we could clearly distinguish peaks of neutral loss pro-
ducts from co-selected PC, PC-O and SM precursors.
We note that signature ions could be recognized by
MFQL queries even if fragments originating from acci-
dentally co-fragmented precursors are also present.
Users also have full flexibility to choose the signature
ions and sc-constraints for species identification and
alter MFQL queries accordingly, while the species pro-
files produced by alternative interepretations remain
quantitatively consistent (Figure 11c).
Probing the MasterScan with correspondent MFQL
queries effectively e mulated several lipid class-specific
and lipid species-specific precursor ion and neutral loss
scans [10,16,36,37] (Figure 11). Signature ions might be
associated with any structural feature of a lipid molecule
and the power of the MFQL concept is that any of
these can be recognized and used for the identification
and quantification of individual species. Therefore, we
argue that a combination of MFQL-assisted interpreta-
tion and the organization of shotgu n lipidomics datasets
in a MasterScan d atabase enables cross-platform, accu-
rate and comprehensive lipidomics analysis of complex
biological samples.
Conclusions
This study addresses the architecture, algorithms, valida-
tion and advanced features of LipidXplorer softwa re,
which supports the broadest scope of current shotgun
lipidomics experiments, f rom targeted quantification of
selected lipid species or classes to high-throughout lipi-
domics screens. LipidXplorer and its early prototype,
LipidX, have been extensively tested in real-life
applications and have already contributed interesting bio-
logical results [25,38-42]. Two key features distinguish
LipidXplorer from other lipidomics software. First, the
entire dataset comprising hundreds of MS and MS/MS
spectra, including multiple technical and bio logical repli-
cates, is organized into a single flat file database - the
MasterScan. Second, for the first time, lipids are identi-
fied using user-defined queries formulated in the molecu-
lar fragmentation query language (MFQL). We
demonstrate that MasterScan and MFQL make a power-
ful alliance enabling exhaustive interpretation of large
shotgun datasets.
Shotgun lipidomics experiments could run on any tan-
dem mass spectrometer with mi nimal sample prepara-
tion. We argue that, with flexible cross-platform
software like LipidXplorer, a broad cell biology commu-
nity can adopt lipidomics approaches for their specific
needs, presumably at the same magnitude as proteomics
methods are currently used. We note that LipidXplorer
is just one possible implementation of a generic infor-
matics concept that relies on MFQL-type interpretation
of spectra. One much anticipated development is to
extend the coverage of lipidomes of important model
and medically relevant organisms by developing and
validating queries covering all major lipid classes. An
accessible public library of organism-specific queries
should become an important resource for a broad lipi-
domics community. Better algorithms supporting all
aspects of data processing could enhance the software
potential in lipidomics screens. Importantly, LipidX-
plore r is an open-source software and its modular orga-
nization offers opportunity for further developments
within a network of collaborating laboratories.
By eliminating major technical obstac les in ident ifying
and quantifying any detectable lipid, Lipid Xplorer devel-
opment revealed a few conceptual problems common to
the entire lipidom ics field. Firs t, statistical es timates of
species identification confidence should now be intro-
duced also in lipidomics and each lipid composition
report should be supported with a false discovery rate
or similar statistical measure. It has become apparent
(also from Table 4 and Figure 9) that false positive iden-
tifications commonly occur even when analyzing a rela-
tively simple dataset. The next challenge would be to
develop a statistical model that estimates identification
confidence in a dataset- and instrument-specific way.
Another informatics challenge is unifying shotgun and
liquid chromatography (LC)-MS or LC-MS/MS driven
lipidomics on a common software platform. At the
moment these approaches seem to be developing almost
in parallel, although there have been efforts to enhance
the performance of shotgun analysis by pre-fractionation
of lipids by LC-MS [43]. We argue that, because of its
flexible architecture and spectra interpretation routines,
Herzog et al. Genome Biology 2011, 12:R8
/>Page 20 of 25
LipidXplorer has the potential to develop into an inte-
grated platform supporting a palette of lipidomics appli-
cations in a consistent, statistically rigorous manner.
Materials and met hods
Annotation of lipid species
Lipid classes are: PE, phosphatidylethanolamines; LPE;
lyso-phosphatidylethanolamines; PE-O, 1-alkyl-2-acylgly-
cerophosphoethanolamines; PS, phosphatidyls erines; PC,
phosphatidylcholines; P C-O, 1-alkyl-2-acylglycerophospho-
cholines; LPC, lysophosphatidylcholines; SM, sphingomye-
lins; PA, phosphatidic acids; PG, phosphatidylglycerols; PI,
phosphatidylinositols; DAG, diacylglycerols; TAG, triacyl-
glycerols; CL, cardiolipins; LCL, tri acyl-lysocardiolipins;
Cer, ceramides; Chol, cholesterol; CholEst, cholesterol
esters.
Individual molecular species are annotated as follows:
<lipid class > <no. of carbon atoms in the first fatty acid
or fatty alcohol moiety >:<no. of double bonds in the
first fatty acid or fatty alcohol moiety >/<no. of carbon
atoms in the second fatty acid moiety >:<no. of double
bonds in the second fatty acid moiety >. For example,
PC 18:0/18:1 stands for a phosphatidylcholine compris-
ing the moieties stearic (18:0) and oleic (18:1) fatty
acids. If the exact composition of fatty acid or fatty alco-
hol moieties is not known, the species are annotated as:
<lipid class > <no. of carbon atoms in both moieties >:
<no. of double bonds in both moieties >. In this way,
PC 36:1 stands for a PC species having 36 carbon atoms
and one double bond in both fatty acid moieties.
Mass spectrometry experiments
Mass spectrometry experiments w ere performed on a
LTQ Orbitrap XL hybrid mass spectrometer (Thermo
Fisher Scientific, Bremen, Germany) and, where speci-
fied, on a modified QSTAR Pulsar i quadrupole time-of-
flight mass spectrometer (MDS Sciex, Concord, Ontario,
Canada), both equipped with a robotic nanoflow ion
source TriVersa (Advion BioSciences, Ithaca, NY, USA).
If not specified otherwise, data-dependent acquisition
was performed as described in [10]. A data-dependent
acquisition cycle consisted of one MS spectrum followed
by MS/MS spectra acquired from ten most abundant
precursor ions, whose masses were subsequently
excluded from further MS/MS experiments. MS/MS
spectra were acquired on a LTQ Orbitrap using pulsed
Qcollision-induced dissociation (PQD) under the nor-
malized collision energy of 21%. Fragment ions were
detected at the linear ion trap (IT) or Orbitrap analyzers,
as indicated separately for each experiment. The linear
ion trap was operated at the low (unit) mass resolution R,
while mass resolution of the Orbitrap was set for each
experiment separately using t he target resolution para-
meter specified as FWHM of the peak at m/z 400. Where
specified, LTQ Orbitrap MS/MS spectra were acquired
by the method of higher energy collision-induced disso-
ciation (HCD). Precursor ions were isolated by the linear
iontrapattheunitresolution,fragmentedintheHCD
cell under the normalized collision energy of 45% and
fragm ent ions detected by the Obitrap analyzer at a mass
resolution of 7,500. MPIS scans were acquired on a quad-
rupole time-of-flight mass spectromet er QSTAR Pulsar i
(AB Sciex, Toronto, Ontario, Canada) and interpreted by
LipidProfiler software as described in [16]. Data-depen-
dent MS/MS experiments on a QSTAR Pulsar i were
performed as described in [10].
Implementation of LipidXplorer software
LipidXplorer was programmed in Python 2.6. It imports
spectra in *.mzXML [44] or peak lists in the *.dta/*.csv
format. Free converters to *.mzXML are available at
[45]. LipidXplorer automatically convert s *.raw or *.wiff
files into *.mzXML using, respectively, ReAdW or
mzWiff programs.
LipidXplorer organizes mass spectra in a database-like
format termed MasterScan (*.sc). The MasterScan is
saved using Python’s PICKLE function [46] for Python
object serialization.
The MFQL interpreter is written using PLY (Python
Lex-Yacc) [47], a lexer/pa rser generator based on Lex
and Yacc. A collection of MFQL scripts is included in
the distributed version of LipidXplorer and supports
quantitati ve profiling of 19 major lipid classes. The ro u-
tine for calculating sum compositions is an exhaustive
search algorithm written in C and imported into Python.
The algorithm for calculating isotopic distributions
was developed by Dr Magnus Palmblad (University of
Reading, UK) and converted to Python by Dr Brian H
Clowers using the NUMPY module [48].
LipidXplorer is available under general public license
(GPL) at [49]. Full documentation on LipidXplorer,
including the installation guidelines, a lipid identification
tutorial and a library of MFQL scripts are provided at
[50]. A sample dataset of shotgun mass spectra is also
available for testing local installations of the software.
LipidXplorer benchmarking: the dataset
E. coli total lipid extract was purchased from Avanti Polar
Lipids (Alabaster, AL, USA) and analyzed on the LTQ
Orbitrap XL instrument in negative ion mode. A solution
of the t otal lipid concentration of 2.5 μg/ml in 7.5 mM
ammonium acetate in choloroform/methanol/2-propanol
(1/2/4, v/v/v) was infused into the mass spectrometer by
TriVersa robotic ion source using a chip with the dia-
meter of spraying nozzles of 4.1 μm. To produce the
spectra dataset, the extract was analyzed in several inde-
pendent experiments: experiment I, eight acquisitions
under the unit mass resolution (R) settings using ion trap
Herzog et al. Genome Biology 2011, 12:R8
/>Page 21 of 25
(IT) to acquire both MS and MS/MS spectra; experiment
II, six acquisi tions with R = 7,500 for MS spectra (Orbi-
trap) and unit resolution for MS/MS spectra (IT); exp eri-
ment III, four acquisitions with R = 30,000 for MS
spectra (Orbitrap) and unit resolution for MS/MS spectra
(IT); experiment IV, four acquisitions with R = 100,000
for MS spectra (Orbitrap) and unit resolution for MS/MS
spectra (IT); experiment V, seven acquisitions with R =
100,000 for MS spectra (Orbitrap) and R = 15,000 for
MS/MS spectra (Orbitrap).
In the experiments I to IV, each acquisition produ ced
approximately 33 M S and 330 MS/MS spectra; in the
experiment V, 10 MS and 100 MS/MS spectra were
acquired. To reduce undersampling, in the experiment
V, acquisition of MS/MS spectra was navigated by the
inclusion li st compiled from 40 masses of plausible PE,
PG and PA precursors A list of molecular lipid species
was produced by manual interpretation of spectra
acquired in the experiment V with requested mass toler-
ance of better than 3 ppm for precursors and 5 ppm for
specific fragment ions. Only lipid species identified in at
least four out of seven replicated analyses were included.
Spectra acquired in each of the experiments I to IV
were further processed by LipidXplorer to produce cor-
responding MasterScan files. We used the dataset from
the experiment I for comparative benchmarking o f
LipidXplorer against LipidQA and LipidSearch pro-
grams. Since LipidQA and LipidSearch do not ali gn the
spectra from replicated analyses, each acquisition was
processed independently and then a non-redundant list
of all identified lipid species was compiled.
LipidXplorer benchmarking: the procedure
Eight acquisitions containing complete sets of MS and
MS/MS spectra were independently submitted as *.raw
files. The output was aligned by reported lipid species.
Individual lipid species were considered as positively
identified if they were recognized in four or more repli-
cated analyses. In all tests the programs were prompted
to identify species of PE, PI, PS, PG and PA classes.
Mass tolerance was set at 0.3 Da in MS and MS/MS
modes; fatty acid moieties were assumed to comprise 12
to 22 carbon atoms and 0 to 6 double bonds.
Settings specific for each tested program were as
follows.
LipidXplorer: ‘MS threshold’ was set to 100 and ‘MS/
MS threshold’ to 5 counts per peak area; ‘Resolution gra-
dient’ was set to 1; other common spectra import settings
were as in Additional file 13 (setting: ‘FAS_LTQ’).
LipidQA (spectra were imported as *.raw files): ‘MS
error’ and the ‘ MS/MS error’ were both set to 0.3 Da;
‘Finnigan Filter’ ,on;‘ Quantification’, off; ‘Mode selec-
tion’ ,Neg.Mode;‘ If MS2 spectra were centroided’ ,
checked. Only species with a score above 0.5 were
accepted. The current version of LipidQA is available
at [51].
Lipid S earch version 2.0 beta: ‘SearchType’ was set to
‘MS2,MS3’ ; ‘ExpType’ to ‘Infusion’; ‘Precursor tol’ to ‘0.3
Da’; ‘Product peak tol’ to 0.3 Da; ‘Intensity threshol d’ to
0.01; ‘Threshold type’ to Relative; ‘ M-score Threshold’
to 10.0. The current version of LipidSearch is available
at [52].
Li
pidProfiler v.1.0.97: the software was used for creating
a reference list of lipids in the E. coli extract and utilized
a separate dataset acquired on a QSTAR Pulsar i mass
spectrometer by the MPIS method. Intensity threshold
was set to 0.2%; all lipid species reported as ‘confirmed
results’ in at least four independent acquisitions.
Validation of isotopic correction algorithm
We analyzed in two independent replicat es a mixture of
PA standards consisting of PA18:0/18:2, PA18:1/18:1,
PA18:0/18:1 and PA18:0/18:0 (all from Avanti Polar
Lipids) with the molar ratio of 1:9:1:1 on a LTQ Orbi-
trap Velos. Spectra were acquired under data-dependent
acquisition control in negative mode using the li near
ion trap analyzer under a target resolution of 800 for
both MS and MS/MS. Precursors were fragmented
using collision-induced dissociation. To process the
dataset, mass tolerance was set to 300 ppm for MS and
500 ppm for MS/MS, spectra; occup ation threshold was
set to 0.5.
Validation of the peak alignment algorithm
We used a dataset of 128 MS spectra of human blood
plasma extracts acquired onaLTQOrbitrapXLmass
spectrometer. Spectra were imported into a MasterScan
file assuming a mass resolution of 127,500 (FWHM, at m/
z 400), a mass accuracy of 4 ppm, a nd an occupation
threshold of 0.5. Post-acquisition adjustment of peak
masses was achieved using two reference masses of lipid
standards spiked into the samples prior to extraction [25].
Lipids of 11 major classes (PC, PC-O,PE,PE-O,, LPC,
LPE, SM, DAG, TAG, Chol and CholEst were identified
by their accurate masses with no recourse to MS/MS.
Validation of cross-platform quantification by
LipidXplorer
Total lipid extract of E. coli was analyzed by multiple pre-
cursor ion scanning [16] and by data-dep endent acquisi-
tion [10] on a QSTAR Pulsar i mass spectrometer. The
same extract was analyzed by data-dependent HCD at the
LTQ Orbitrap Velos mass spectrometer. Each analysis was
performed in four replicates. Datasets of shotgun MS and
MS/MS spectra were imported into MasterScan files built
separately for each mass spectrometer and lipid species
identified by MFQL queries (see Additional file 14 for the
import settings and Additional file 11 for the queries).
Herzog et al. Genome Biology 2011, 12:R8
/>Page 22 of 25
Lipid species were quantified in MS mode by using the
intensities of their molecular ions. For MS/MS quantifica-
tion, MFQL queries recognized and reported the sum of
abundances of acyl anion fragments for each individual
precursor. Relative quantities of individual lipids were cal-
culated by normalizing to the total abun dance of all spe-
cies of the same lipid class. Parameters of linear
correlation of lipid species profiles obtained by different
methods (correlation coefficient R
2
and slope) were com-
puted by Microsoft Excel (see Additional file 14).
Analysis of bovine heart total lipid extract
Total lipid extract of bovine heart (Avanti Polar Lipids)
was analyzed in six technical replicates on a LTQ-Orbi-
trap XL mass spectrometer using a target resolution of
100,000 for MS spectra (Orbitrap) and unit resolution
for MS/MS (IT) in negative ion mode. Six replicates
wereacquired,eachconsistingof31MSand310MS/
MS spectra.
Publicly accessible depository of spectra
Mass spectra used for benchmarking and validating of
LipidXplorer are available in original formats (*.raw for
LTQ Orbitrap and *.wiff for QSTAR Pulsar i)atthe
LipidXplorer wiki page [50].
Additional material
Additional file 1: Screenshots of the graphical user interface (GUI)
of LipidXplorer. Screenshots of four operational panels and explanations
of their organization and available functionalities.
Additional file 2: Scan averaging algorithm. A detailed mathematical
description of the algorithm.
Additional file 3: Binning of peaks during scan averaging. A figure
showing a work scheme and explaining why the accuracy of average
mass calculation improves with each binning cycle.
Additional file 4: Spectra alignment algorithm. A detailed
mathematical description of the algorithm.
Additional file 5: Common peak attributes considered by
LipidXplorer.
Additional file 6: Backus-Naur-Form (BNF) of the molecular
fragmentation query language (MFQL).
Additional file 7: Comparison of 325 spectra independently
averaged by Xcalibur and LipidXplorer. A spreadsheet providing
alignment details for each pair of spectra at different intensity thresholds.
Additional file 8: Validation of the isotopic correction algorithm.A
spreadsheet providing the abundances of peaks within partially
overlapping isotopic clusters of PA lipids calculated with and without
isotopic correction.
Additional file 9: Validation of the spectra alignment algorithm
using a computationally generated spectra dataset. A spreadsheet
providing details of alignments of spectra processed using different
numbers of binning cycles.
Additional file 10: Validation of the spectra alignment algorithm
using MS spectra acquired from 128 total lipid extracts.A
spreadsheet providing a list of identified lipids and details of spectra
alignment and correlation of peak intensities.
Additional file 11: MFQL scripts used for LipidXplorer
benchmarking.
Additional file 12: Benchmarking the LipidXplorer identification
performance. A spreadsheet providing lists of lipid species identified in
a total E. coli extract by different software and their alignment with
species from the reference list.
Additional file 13: Lipid species identified by LipidXplorer in spectra
acquired at different mass resolution from a total E. coli extract.A
spreadsheet providing a list of species and intensities of their precursor
and characteristic fragment ions in each individual spectrum.
Additional file 14: Validation of LipidXplorer cross-platfor m lipid
identification by correlating relative abundances of E. coli lipid
species determined in independent MS and MS/MS experiments on
QSTAR Pulsar i and LTQ Orbitrap Velos mass spectrometers.A
spreadsheet providing LipidXplorer spectra processing settings, bar
diagrams of relative abundances of individual species and statistical
estimates of their correlation.
Additional file 15: MFQL scripts used for the lipid identification in a
bovine heart total extract.
Additional file 16: Lipid species identified by LipidXplorer in a total
extract of bovine heart. A spreadsheet providing a full list of lipid
species and intensities of their precursor and characteristic fragment ions
detected in independent MS and MS/MS experiments.
Abbreviations
CL: cardiolipin; Chol: cholesterol; CholEst: cholesterol ester; DAG:
diacylglycerol; FWHM: full width at half maximum; HCD: higher energy
collision-induced dissociation; IT: ion trap; LC: liquid chromatography; MFQL:
molecular fragmentation query language; MPIS: multiple precursorion
scanning; MS: mass spectrometry; MS/MS: tandem mass spectrometry; PA:
phosphatidic acid; PC: phosphatidylcholine; PE: phosphatidylethanolamine;
PCF: Pearson correlation factor; PG: phosphatidylglycerol; PUFA:
polyunsaturated fatty acid; sc: sum composition; SM: sphingomyelin; TAG:
triacylglycerol.
Acknowledgements
We are grateful to our colleagues in MPI CBG, Technical University of
Dresden and University of Heidelberg for valuable discussions and beta-
testing of LipidXplorer software; to Mrs Kathy Eisenhofer and Dr Christer
S Ejsing (University of Southern Denmark, Odense) for critical reading of
the manusc ript. We are indebted to Dr Ejsing for the Figure 5 concept
and Dr Palmblad for helpful discussions on the algorithm for calculating
the isotopic distribution. Work in the AS laboratory was supported by
TRR 83 grant from Deutsche Forschungsgemeinschaft (DFG) and Virtual
Liver (Code/0315757) grant from Bundesministerium f. Bildung u.
Forschung (BMBF). DS is supported by Wellcome Trust/DBT India Alliance
and is a recipient of NCBS-M erck&Co International Investigator Award.
Work in the SRB laboratory was supported by the Paul Langerhans
Institute Dresden.
Author details
1
Max Planck Institute of Molecular Cell Biology and Genetics,
Pfotenhauerstrasse 108, 01307 Dresden, Germany.
2
Department of Internal
Medicine III, Carl Gustav Carus Clinics of Dresden University of Technology,
Fetscherstrasse 74, 01307 Dresden, Germany.
3
National Centre for Biological
Sciences, Tata Institute of Fundamental Research, GKVK, Bellary Road,
Bangalore 560065, India.
4
Biotechnology Centre, Dresden University of
Technology, Tatzberg 47-51, 01307 Dresden, Germany.
Authors’ contributions
RH, DS and AS conceived the LipidXplorer concept, the study and wrote the
manuscript. RH, DS and MS developed algorithms. RH wrote the software
and validated it by computational experiments. DS, KS and JLS performed
lipidomics experiments. SRB contributed samples for lipidomic analyses. All
authors have read and approved the manuscript.
Herzog et al. Genome Biology 2011, 12:R8
/>Page 23 of 25
Received: 26 July 2010 Revised: 4 January 2011
Accepted: 19 January 2011 Published: 19 January 2011
References
1. Wenk MR: The emerging field of lipidomics. Nat Rev Drug Discov 2005,
4:594-610.
2. van Meer G: Cellular lipidomics. EMBO J 2005, 24:3159-3165.
3. Dennis EA: Lipidomics joins the omics evolution. Proc Natl Acad Sci USA
2009, 106:2089-2090.
4. Oresic M, Hanninen VA, Vidal-Puig A: Lipidomics: a new window to
biomedical frontiers. Trends Biotechnol 2008, 26:647-652.
5. Yetukuri L, Ekroos K, Vidal-Puig A, Oresic M: Informatics and computational
strategies for the study of lipids. Mol Biosyst 2008, 4:121-127.
6. Han X, Gross RW: Global analyses of cellular lipidomes directly from
crude extracts of biological samples by ESI mass spectrometry: a bridge
to lipidomics. J Lipid Res 2003, 44:1071-1079.
7. Han X, Gross RW: Shotgun lipidomics: electrospray ionization mass
spectrometric analysis and quantitation of cellular lipidomes directly
from crude extracts of biological samples. Mass Spectrom Rev 2005,
24:367-412.
8. Ejsing CS, Sampaio JL, Surendranath V, Duchoslav E, Ekroos K, Klemm RW,
Simons K, Shevchenko A: Global analysis of the yeast lipidome by
quantitative shotgun mass spectrometry. Proc Natl Acad Sci USA 2009,
106:2136-2141.
9. Han X, Yang K, Yang J, Fikes KN, Cheng H, Gross RW: Factors influencing
the electrospray intrasource separation and selective ionization of
glycerophospholipids. J Am Soc Mass Spectrom 2006, 17:264-274.
10. Schwudke D, Oegema J, Burton L, Entchev E, Hannich JT, Ejsing CS,
Kurzchalia T, Shevchenko A: Lipid profiling by multiple precursor and
neutral loss scanning driven by the data-dependent acquisition. Anal
Chem 2006, 78:585-595.
11. Song H, Hsu FF, Ladenson J, Turk J: Algorithm for processing raw mass
spectrometric data to identify and quantitate complex lipid molecular
species in mixtures by data-dependent scanning and fragment ion
database searching. J Am Soc Mass Spectrom 2007, 18:1848-1858.
12. Haimi P, Uphoff A, Hermansson M, Somerharju P: Software tools for
analysis of mass spectrometric lipidome data. Anal Chem 2006,
78:8324-8331.
13. Leavell MD, Leary JA: Fatty acid analysis tool (FAAT): An FT-ICR MS lipid
analysis algorithm. Anal Chem 2006, 78:5497-5503.
14. Hubner G, Crone C, Lindner B: lipID - a software tool for automated
assignment of lipids in mass spectra. J Mass Spectrom 2009, 44:1676-1683.
15. Houjou T, Yamatani K, Imagawa M, Shimizu T, Taguchi R:
Ashotguntandem
ma
ss spectrometric analysis of phospholipids with normal-phase and/or
reverse-phase liquid chromatography/electrospray ionization mass
spectrometry. Rapid Commun Mass Spectrom 2005, 19:654-666.
16. Ejsing CS, Duchoslav E, Sampaio J, Simons K, Bonner R, Thiele C, Ekroos K,
Shevchenko A: Automated identification and quantification of
glycerophospholipid molecular species by multiple precursor ion
scanning. Anal Chem 2006, 78:6202-6214.
17. Glish GL, Burinsky DJ: Hybrid mass spectrometers for tandem mass
spectrometry. J Am Soc Mass Spectrom 2008, 19:161-172.
18. Shevchenko A, Simons K: Lipidomics: coming to grips with lipid diversity.
Nat Rev Mol Cell Biol 2010, 11:593-598.
19. Forrester JS, Milne SB, Ivanova PT, Brown HA: Computational lipidomics: a
multiplexed analysis of dynamic changes in membrane lipid
composition during signal transduction. Mol Pharmacol 2004, 65:813-821.
20. Liebisch G, Lieser B, Rathenberg J, Drobnik W, Schmitz G: High-throughput
quantification of phosphatidylcholine and sphingomyelin by
electrospray ionization tandem mass spectrometry coupled with isotope
correction algorithm. Biochim Biophys Acta 2004, 1686:108-117.
21. Liu J, Bell AW, Bergeron JJ, Yanofsky CM, Carrillo B, Beaudrie CE, Kearney RE:
Methods for peptide identification by spectral comparison. Proteome Sci
2007, 5:3.
22. Frank AM, Bandeira N, Shen Z, Tanner S, Briggs SP, Smith RD, Pevzner PA:
Clustering millions of tandem mass spectra. J Proteome Res 2008,
7:113-122.
23. Kaltenbach HM, Wilke A, Bocker S: SAMPI: protein identification with mass
spectra alignments. BMC Bioinformatics 2007, 8:102.
24. Jeffries N: Algorithms for alignment of mass spectrometry proteomic
data. Bioinformatics 2005, 21:3066-3073.
25. Graessler J, Schwudke D, Schwarz PE, Herzog R, Shevchenko A,
Bornstein SR: Top-down lipidomics reveals ether lipid deficiency in blood
plasma of hypertensive patients. PLoS One 2009, 4:e6261.
26. Schwudke D, Hannich JT, Surendranath V, Grimard V, Moehring T, Burton L,
Kurzchalia T, Shevchenko A: Top-down lipidomic screens by multivariate
analysis of high-resolution survey mass spectra. Anal Chem 2007,
79:4083-4093.
27. Schwudke D, Liebisch G, Herzog R, Schmitz G, Shevchenko A: Shotgun
lipidomics by tandem mass spectrometry under data-dependent
acquisition control. Methods Enzymol 2007, 433:175-191.
28. Liebisch G, Binder M, Schifferer R, Langmann T, Schulz B, Schmitz G: High
throughput quantification of cholesterol and cholesteryl ester by
electrospray ionization tandem mass spectrometry (ESI-MS/MS). Biochim
Biophys Acta 2006, 1761:121-128.
29. Sparkman OD:
Mass Spectrometry Desk Reference. 2
edition. Global View
Publishing; 2006.
30. Makarov A, Denisov E, Lange O, Horning S: Dynamic range of mass
accuracy in LTQ Orbitrap hybrid mass spectrometer. J Am Soc Mass
Spectrom 2006, 17:977-982.
31. Ekroos K, Chernushevich IV, Simons K, Shevchenko A: Quantitative profiling
of phospholipids by multiple precursor ion scanning on a hybrid
quadrupole time-of-flight mass spectrometer. Anal Chem 2002,
74:941-949.
32. Oursel D, Loutelier-Bourhis C, Orange N, Chevalier S, Norris V, Lange CM:
Lipid composition of membranes of Escherichia coli by liquid
chromatography/tandem mass spectrometry using negative electrospray
ionization. Rapid Commun Mass Spectrom 2007, 21:1721-1728.
33. Geiger O, Gonzalez-Silva N, Lopez-Lara IM, Sohlenkamp C: Amino acid-
containing membrane lipids in bacteria. Prog Lipid Res 2010, 49:46-60.
34. Kikuchi S, Shibuya I, Matsumoto K: Viability of an Escherichia coli pgsA null
mutant lacking detectable phosphatidylglycerol and cardiolipin.
J Bacteriol 2000, 182:371-376.
35. Oursel D, Loutelier-Bourhis C, Orange N, Chevalier S, Norris V, Lange CM:
Identification and relative quantification of fatty acids in Escherichia coli
membranes by gas chromatography/mass spectrometry. Rapid Commun
Mass Spectrom 2007, 21:3229-3233.
36. Ekroos K, Ejsing CS, Bahr U, Karas M, Simons K, Shevchenko A: Charting
molecular composition of phosphatidylcholines by fatty acid scanning
and ion trap MS3 fragmentation. J Lipid Res 2003, 44:2181-2192.
37. Han X, Gross RW: Quantitative analysis and molecular species
fingerprinting of triacylglyceride molecular species directly from lipid
extracts of biological samples by electrospray ionization tandem mass
spectrometry. Anal Biochem 2001, 295:88-100.
38. Reich A, Schwudke D, Meurer M, Lehmann B, Shevchenko A: Lipidome of
narrow-band ultraviolet B irradiated keratinocytes shows apoptotic
hallmarks. Exp Dermatol 2010, 19:e103-110.
39. Raa H, Grimmer S, Schwudke D, Bergan J, Walchli S, Skotland T,
Shevchenko A, Sandvig K: Glycosphingolipid requirements for endosome-
to-Golgi transport of Shiga toxin. Traffic 2009, 10:868-882.
40. Saito K, Dubreuil V, Arai Y, Wilsch-Bräuninger M, Schwudke D, Saher G,
Miyata T, Breier G, Thiele C, Shevchenko A, Nave KA, Huttner WB: Ablation
of cholesterol biosynthesis in neural stem cells increases their VEGF
expression and angiogenesis but causes neuron apoptosis. Proc Natl
Acad Sci USA 2009, 106:8350-8355.
41. Carvalho M, Schwudke D, Sampaio JL, Palm W, Riezman I, Dey G, Gupta GD,
Mayor S, Riezman H, Shevchenko A, Kurzchalia TV, Eaton S: Survival
strategies of a sterol auxotroph. Development 2010, 137:3675-3685.
42. Penkov S, Mende F, Zagoriy V, Erkut C, Martin R, Pässler U, Schuhmann K,
Schwudke D, Gruner M, Mäntler J, Reichert-Müller T, Shevchenko A,
Knölker HJ, Kurzchalia TV: Maradolipids:
diacyltrehalose glycolipids
specific to dauer larva in Caenorhabditis elegans. Angew Chem Int Ed Engl
2010, 49:9430-9435.
43. Sommer U, Herscovitz H, Welty FK, Costello CE: LC-MS-based method for
the qualitative and quantitative analysis of complex lipid mixtures.
J Lipid Res 2006, 47:804-814.
44. Pedrioli PG, Eng JK, Hubley R, Vogelzang M, Deutsch EW, Raught B, Pratt B,
Nilsson E, Angeletti RH, Apweiler R, Cheung K, Costello CE, Hermjakob H,
Huang S, Julian RK, Kapp E, McComb ME, Oliver SG, Omenn G, Paton NW,
Simpson R, Smith R, Taylor CF, Zhu W, Aebersold R: A common open
representation of mass spectrometry data and its application to
proteomics research. Nat Biotechnol 2004, 22:1459-1466.
Herzog et al. Genome Biology 2011, 12:R8
/>Page 24 of 25
45. Trans-Proteomic Pipeline. [ />title=Software:TPP].
46. Python documentation. [ />47. Python Lex-Yacc. [ />48. NumPy. [].
49. SourceForge. [ />50. LipidXplorer Wiki site. [ />Main_Page].
51. NIH/NCRR Mass Spectrometry Resource at Washington University in St
Louis. [ />htm].
52. Lipid Search. [ />53. Lipid Maps. [ />doi:10.1186/gb-2011-12-1-r8
Cite this article as: Herzog et al.: A novel informatics concept for high-
throughput shotgun lipidomics based on the molecular fragmentation
query language. Genome Biology 2011 12:R8.
Submit your next manuscript to BioMed Central
and take full advantage of:
• Convenient online submission
• Thorough peer review
• No space constraints or color figure charges
• Immediate publication on acceptance
• Inclusion in PubMed, CAS, Scopus and Google Scholar
• Research which is freely available for redistribution
Submit your manuscript at
www.biomedcentral.com/submit
Herzog et al. Genome Biology 2011, 12:R8
/>Page 25 of 25