Báo cáo y học: " MM-ChIP enables integrative analysis of cross-platform and between-laboratory ChIP-chip or ChIP-seq data" doc
Bạn đang xem bản rút gọn của tài liệu. Xem và tải ngay bản đầy đủ của tài liệu tại đây (643.18 KB, 10 trang )
MET H O D Open Access
MM-ChIP enables integrative analysis of
cross-platform and between-laboratory ChIP-chip
or ChIP-seq data
Yiwen Chen
1
, Clifford A Meyer
1
, Tao Liu
1
, Wei Li
2,3
, Jun S Liu
4
, Xiaole Shirley Liu
1*
Abstract
The ChIP-chip and ChIP-seq techniques enable genome-wide mapping of in vivo protein-DNA interactions and
chromatin states. The cross-platform and between-laboratory variation poses a challenge to the comparison and
integration of results from different ChIP experiments. We describe a novel method, MM-ChIP, which integrates
information from cross-platform and between-laboratory ChIP-chip or ChIP-seq datasets. It improves both the
sensitivity and the specificity of detecting ChIP-enriched regions, and is a useful meta-analysis tool for driving
discoveries from multiple data sources.
Background
Chromatin immunoprecipitation (ChIP) followed by
array hybridization (ChIP-chip) and ChIP followed by
massively parallel sequencing (ChIP-seq) are two power-
ful techniques for profiling in vivo DNA-protein interac-
tions [1,2] a nd histone marks on a genome-wide scale
[3,4]. The genome-scale data generated by these two
technologies provide information essential to our under-
standing of the transcriptional regulation underlying
various cellular processes.
ChIP-chip/seq experiments are often performed on
different technic al platforms in different la bs. Even
ChIP-chip/seq data for the same protein under similar
biological conditions ca n show significant variation
between laboratories and acros s platforms due to differ-
ences in ChIP experimental protocols and p latform
designs [5]. Such variation can lead to platform- or lab-
specific false p ositives/negatives, making it difficult to
compare and integrate results from different ChIP
experiments, despite the development of computational
methods for analyzing ChIP data from individual
sources separately [6-14].
To address this challenge, we have developed a new
computational method and its companion s oftware,
named MM-ChIP (Model-based Meta-analysis of ChIP
data), which enables the integrative analysis of ChIP-
chip/seq data across platforms and between laboratories.
Results
Integrative analysis of ChIP-chip data
Currently, the most popular platforms for performing
ChIP-chip e xperiments are high-density oligonucleotide
tiling microarrays from Affymetrix,NimbleGen,and
Agilent. These platforms differ greatly in probe lengths,
tiling resolutions, and sample-labeling protocols, w hich
results in platform-specific systematic bias (for example,
probe-specific behav ior and dye bias) and differences in
noise features, detection sensitivity and d ynamic range
[5]. These differenc es make it difficult to ef fectively
combine different datasets for detecting regions of
enrichment.
To effectively take into account inter-platform differ-
ences and allow for the normalization of data from
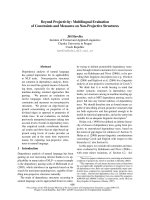
different sources, we designed a two-step process
(Figure 1a). In the first step, raw probe-level data pooled
from replicates are fitted to a platform-specific baseline
probe model for each data source to remove the effect
of probe sequence and genome copy number on probe
intensity, a correction that has been shown to be impor-
tant for increasing the signal-to-noise ratio [13,14]. A
sliding window-based statistical score that summarizes
the corrected probe intensity value within the window is
* Correspondence:
1
Department of Biostatistics and Computational Biology, Dana-Farber Cancer
Institute and Harvard School of Public Health, 44 Binney Street, Boston, MA
02115, USA
Full list of author information is available at the end of the article
Chen et al. Genome Biology 2011, 12:R11
/>© 2011 Chen et al.; licensee BioMed Central Ltd. This is an open access article distributed under the terms of the Creative Commons
Attribution License (http://creativecommons.o rg/licenses/by/2.0), which permits unrestricted use, distribution, and reproduction in
any medium, provided the original work is properly cited.
then used to quantify ChIP signal enrichment at differ-
ent genomic loci (Materials and methods).
In the second step, the window-based scores are con-
verted to a Z-score for each individual data source. The
Z-scores corresponding to the same genomic loci across
different data sources are summed to give a composite
score and divided by the square root of the number of
datasets, a calculation known as Stouffer’s method [15].
Under the null hypothesis of no enrichment, this com-
posite score is distr ibuted as a standard normal distribu-
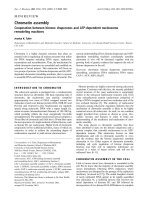
tion. The use of the Z-score for normalization and the
choice of Stouffer’ s method were motivated by the
observation that the distribution of window-based scores
is approximately normal, with a heavy right tail irrespec-
tive of technical platform (Figure 2).
To assess the performance of MM-ChIP on ChIP-chip
data, we used three ChIP-chip datasets that were gener-
ated by three labs from the same ENCODE (ENCyclope-
dia Of DNA Elements) spike-in sample using different
array platforms [5,16]. The spike-in samples contained
100 cloned genomic DNA sequences (average length
497 bp) mixed with human genomic DNA, and the
genomic DNA without the spike-in served as the con-
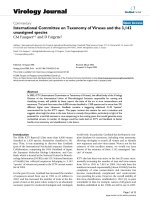
trol. We first evaluated the performance of MM-ChIP
on integrating replicate data from the same dataset (that
is, from the same lab and platform). Because we knew
which genomic regions were actually enriched in the
spike-in sample, we were able to plot recei ver operating
characteristic (ROC) c urves for the evaluation. We
found that by integrating information from multiple
replicates, MM-ChIP improved both the sensitivity and
specificity of detecting known enriched regions com-
pared with using individual replicates. Its performance
matched that of pooling the raw data from replicates for
enriched region detection (Figure 3a). With this confir-
matory result, we extended our evaluation to the inte-
grative analysis of cross-platform and between-
laboratory datasets. We found that, similar to the results
of integrating replicates from a single data source, inte-
grating data from three platforms and labs using MM-
ChIP improved both the sensitivity and specificity of
detecting ChIP-enric hed regions over using in dividual
datasets (Figure 3b).
We further compared MM-ChIP with two alternative
methods, majority voting and region intersection, on the
same spike-in dataset. In the majority voting method, a
region is considered to have significant enrichment in
the integrative analysis if it is enriched in more than
half of the individually analyzed dat asets. In the region
intersection method, which is commonly used to
Study 1
…
Study 1
…
ChIP-chip probe-level data
ChIP-seq aligned-tag data
Perform model-based probe
standardization and calculate
MAT/MA2C score of individual study
Estimate study-specific shift-size of
ChIP-seq tags with MACS model
and shift the tags of individual study
Pool shifted tags from different
studies and identify ChIP-peaks
using a dynamic Poisson model
Normalize score across different
studies and identify ChIP-peaks
using Stouffer's method
(
a
)
(b)
2N 2M
Figure 1 The workflow of MM-ChIP. Workflow illustrated for (a) ChIP-chip (b) and ChIP-seq data. MA2C, Model-based Analysis of 2-Color
Arrays; MACS, Model-based Analysis of ChIP-Seq data; MAT, Model-based Analysis of Tiling-array.
Chen et al. Genome Biology 2011, 12:R11
/>Page 2 of 10
combine results from different ChIP experiments, a
region is considered to have significant enrichment if it
is enriched in all individually analyzed datasets. We
found that MM-ChIP outperforms both methods (Figure
3b). Notably, the majority voting method performed
similarly to the best individual analysis and better than
the region intersection method (Figure 3b), indicating
that the common practice of region intersection is not
an optimal solution for integrative analysis.
After testing the performance of MM-ChIP on the
spike-in datasets, we assessed its performance using two
ChIP-chip datasets for the human estrogen receptor
(ER). These two datasets were generated under the same
biological conditions, but on two d ifferent array plat-
forms: the Affymetrix Human Tiling 1.0R Array [17]
and the Affymetrix Human Tiling 2.0R Array [ 18].
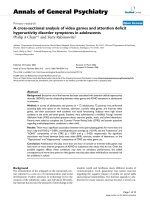
Because we did not know the e nriched regions in these
datasets a priori, we used enrichment of the ER bi nding
motif to evaluate the quality of the inferred enriched
regions. By mapping the occurrence of the ER binding
motif within a 500-bp window surrounding the identi-
fied ChIP-chip peak summit, we found that the peaks
identified by integrative analysis using MM-ChIP show
consistently higher motif enrichment and thus improved
peak-calling quality compared with those identified
using individual datasets (Figure 4) with either MM-
ChIP or the w ell-established tool TileMap. We chose
TileMap for comparison because it has been shown to
be among the best peak-calling tools for ChIP-chip data
[19].
Integrative analysis of ChIP-seq data
ChIP-seq [20-23] has become an important alternative
technique to ChIP-chip with the emergence of next-
generation sequencing platforms, such as the Illumina
Genome Analyzer, Helicos HeliScope, and Applied Bio-
systems SOLiD. The Illumina Genome Analyzer is cur-
rently the most dominant platform, on which the vast
majority of publicly available ChIP-seq datasets were
generated. When sufficient sequencing depth is
achieved, ChIP-seq has many advantages over ChIP-
chip, including a much higher resolution, larger dynamic
range, more complete genome coverage and presumably
better signal-to-noise ratio.
Because ChIP-seq data have their own unique charac-
teristics, we designed a different strategy for integrative
Figure 2 Normal Q-Q plots of MAT/MA2C score distribution of three ChIP-chip datasets . ChIP-chip datasets generated on (a) Affymet rix,
(b) NimbleGen and (c) Agilent platforms are shown. MA2C, Model-based Analysis of 2-Color Arrays; MAT, Model-based Analysis of Tiling-array.
Chen et al. Genome Biology 2011, 12:R11
/>Page 3 of 10
peak detection compared with that for ChIP-chip (Fig-
ure 1b). ChIP-seq tags represent the ends of fragments
in a ChIP-DNA library. The tag density around a true
binding site generally shows a bimodal enrichment pat-
tern, with Watson strand tags enriched upstream of
binding and Crick strand tags enriched downstream
[9,12]. To take into account this pattern and inter-stu dy
differences in ChIP-DNA library fragment size (Figure 5),
MM-ChIP first models the characteristic fragment size
of the sequenced ChIP-DNA library for each individual
data source. The ChIP-seq tags are then shifted t oward
the 3’ direction by a distance of half of the estimated
fragment size to better represent the precise protein-
DNA interaction sites.
Next, the model-shifted tags from different data
sources are pooled for the ChIP and control samples
independently. A sliding window is then used to score
the significance of signal enrichment in the ChIP sam-
ples by comparing tags within the same window
between the ChIP and control samples based on a
dyna mic Poisson model [12]. The use of this model was
shown to reduce false positive detection because it can
0.0 0.1 0.2 0.3 0.4
0.0 0.2 0.4 0.6 0.8 1.0
Rep1−6
MM−ChIP
Merging raw data
0.00 0.02 0.04
0.0 0.2 0.4 0.6 0.8 1.0
Affymetrix
Nimblegen
Agilent
Intersection
Majority−voting
MM−ChIP
0.01 0.03 0.0
5
S
ensitivity
F
a
l
se
Po
s
itiv
e
R
a
t
e
(b)(a)
Figure 3 An evaluation of the performance of MM-ChIP on ChIP-chip data is shown. (a) ROC curves of the analyses performed using
either individual replicates or all replicates from a single ChIP-chip dataset generated using an Affymetrix array are plotted. (b) ROC curves of
analyses from individual datasets and all three datasets are plotted. The integrative analyses on all three datasets were performed using MM-ChIP
(red), majority voting (pink) or the region intersection method (yellow).
Chen et al. Genome Biology 2011, 12:R11
/>Page 4 of 10
effectively capture local tag enrichmen t in the genome
due to factors that are unrelated to the protein-DNA
interaction of interest, such as local chromatin structure,
copy number variation, and sequencing bias [12].
Because MM-ChIP only utilizes the 5’ end posit ional
information of each pooled tag for integrative analysis, it
allows for the analysis of datasets that consist of tags
with different read lengths, as long as the tags h ave
been mapped to the same reference genome.
To assess the performance of MM-ChIP on ChIP-seq
data, we used two recently released CCCTC-binding fac-
tor (CTCF) datasets from the ENCODE project [16].
Unlike with the spike-in ChIP-chip data, we did not
know the true in vivo CTCF binding sites apriori.
Therefore, we used enrichm ent of the canonical binding
motif of CTCF to evaluate the perfor mance of MM-
ChIP for ChIP-seq peak detection. By mapping the
occurrence of the CTCF binding motif within 50 bp of
the identified ChIP-seq peak summit , we found that the
peaks identified by integrative analysis using MM-ChIP
showed consistently higher motif enr ichment than those
identified by using individual datasets, and MM-
ChIP outperformed the region intersection method
(Figure 6a). We also compared the performance of MM-
ChIP with a workflow in which the first step of tag-shift
was excluded, but the same procedures were perform ed
in the second step. We found that exclusion of the tag-
shift step i n MM-ChIP significantly decreased its
0.40 0.45 0.50 0.55 0.60
Number of bindin
g
sites
Fraction o
f
sites containing moti
f
1000 1500 2000 2500 3000 3500 4000 450
0
TileMap−Tiling 1.0R
MM−ChIP−Tiling 1.0R
MM−ChIP−Tiling 2.0R
MM−ChIP−combine
TileMap−Tiling 2.0R
Figure 4 An evaluation of the performance of MM-ChIP on two ER ChIP-chip datasets. The fraction of ER binding sites that contain an ER
motif is plotted as a function of the number of top-ranked binding sites for different cases using either MM-ChIP or TileMap.
Chen et al. Genome Biology 2011, 12:R11
/>Page 5 of 10
performance (Figure S1 in Additional file 1), which
underscores the importance of modeling the fragment
size of sequenced ChIP-DNA libraries.
In the two CTCF datasets described above, the fragment
lengths did not differ considerably. However, in practice,
different experimental protocols could yield distinct
library sizes of 100 to 400 bp. We further compared the
performance of MM-ChIP with an alternative method
for the integrative analysis of datasets with varied inter-
library size difference s. The alternative method first
merges the reads from different studies and then per-
forms model building a nd peak detection using the
MACS algorithm [12]. We ch ose this method for com-
parison because it is commonly used in practice. We
found that the performance of MM-ChIP remains
unchanged with varied inter-library size differences
(Δd), whereas the performance of the alternative method
deteriorates when Δd increases (Figure 6b). These
results indicate that it is important to model the library
size for individual studies separately before tag merging.
Discussion
With the rapid increase in publicl y available ChIP data-
sets, the development of computational methods for the
integrative analysis of different ChIP datasets has
become an emerging challenge. Two methods that are
related to the current study have been developed
recently. JAMIE (joint analysis of multiple ChIP-chip
experiments) [24] is based on a hierarchical mixture
model to capture correlations between datasets and
allows for the joint analysis of multiple ChIP-chip
datasets that are related to the same transcription factor.
However, its current i mplementation only allows for the
analysis of the datasets generated on the same array
platform and does not s upport the integrative analysis
of ChIP-seq datasets. In addition, JAMIE relies on a
number of model assumptions about data and peak
shapes that do not necessarily hold true for many ChIP-
chip datasets. In contrast, MM-ChIP makes few assump-
tions about the statistical characteristics of ChIP-chip
data and thus could be more robust.
Another method, hierarchical hidden Markov model
(HHMM), is based on a hierarchical hidden Markov
model and was developed specifically for the joint a na-
lysis of one ChIP-chip and one ChIP-seq dataset, using
a Bayesian inference procedure [25]. However, HHMM
does not effectively support the joint analysis of ChIP-
chip datasets from different array platforms or ChIP-
seq datasets with large inter-library heterogeneity.
Moreover, its model c omplexity increases dramatically
with the number o f the datasets, whereas MM-ChIP is
a deterministic approach with a computa tional com-
plexity/time that scales linearly with the number of
datasets. More imp ortantly, the HHMM method uses
the raw hybridization signal or tag count at each geno-
mic location without effectively taking into account
platform-specific biases, such as probe behavior and
inter-study ChIP-DNA library heterogeneity, which
could introduce significant systematic errors in the
integrative analysis.
The current implementation of MM-ChIP weighs data
from different sources equally in the integrative analysis.
−600 −400 −200 0 200 400 600
0.0 0.1 0.2 0.3 0.4
forward tags
reverse tags
shifted tags
d=167
(a)
−600 −400 −200 0 200 400 60
0
0.0 0.2 0.4 0.6
forward tags
reverse tags
shifted tags
d=100
(b)
Di
s
t
a
n
ce
t
o
th
e
mi
dd
l
e
P
ercentage
Figure 5 MACS model of shift size for two CTCF ChIP-seq dat asets. Datasets were generated at (a) the Broad Institute and (b) the
University of Texas at Austin through the ENCODE project.
Chen et al. Genome Biology 2011, 12:R11
/>Page 6 of 10
Given the heterogeneity in quality of different datasets, a
more appropriate approach would be to weigh different
data sources differently, according to some statistical
measureofdataquality.Stouffer’ smethodprovidesa
natural framework for treating data sources differently
by using t he weighted mean of the Z-scores. For exam-
ple, if two datasets have comparable data qualities for
individual replicates but different numbers of replicates,
the weight can be proportional to the number of repli-
cates in each dataset. However, how to generally incor-
porate information about the quality of individual data
sources into an integrative analysis, especially for count
data from ChIP-seq experiments, remains an important
question.
An implicit assumption for using Stouffer’s method in
integrative analysis is that the Z-scores are independent
0.66 0.68 0.70 0.72 0.74 0.7
6
2500 7500 12500
0.45 0.50 0.55 0.60 0.65 0.70 0.75
5000 10000 1500
0
Broad
UT−Austin
MM−ChIP
Intersection
MM−ChIP
M-MACS
(Δd=100)
M-MACS
(Δd=200)
Fraction of sites containing motif
Number of bindin
g
sites
(a) (b)
Figure 6 An evaluation of the performance of MM-ChIP on ChIP-seq data. (a) The fraction of CTCF binding sites containing a canonical
CTCF binding motif is plotted as a function of the number of top-ranked binding sites for both the individual and combined datasets. The
results of integrative analysis using the region intersection method are also shown. Binding sites were ranked in ascending order by P-value.
Broad, Broad Institute; UT-Austin, University of Texas at Austin. (b) A comparison between MM-ChIP and the Merge MACS method on one real
dataset and two synthetic datasets. The fraction of CTCF binding sites containing a canonical CTCF binding motif is plotted as a function of the
number of top-ranked binding sites for different datasets when the inter-library size difference (Δd) is 0, 100 or 200. MACS, Model-based Analysis
of ChIP-Seq data.
Chen et al. Genome Biology 2011, 12:R11
/>Page 7 of 10
among different datasets at non-enriched regions. This
assumption does not necessarily hold because when
datasets are generated from the same array platform and
the probe effect is not completely removed by the
Model-based Analysis of Tiling-array (MAT)/Model-
based Analysis of 2-Color Arrays (MA2C) algorithm,
any residual probe effect could cause an artificially
enriched signal in the same genomic location across dif-
ferent datasets [26]. The aggregation of this signal could
then lead to a false positive in the integrative analysis.
When input control sample data are available, we expect
that the residual probe effect has only a minor impact
on the results of the analysis because it has a similar
effect in non-enriched regions of the ChIP and input
control samples, and its effects are cancelled out in the
MAT/MA2C score. However, when there is no input
sample, the residual probe effect could negatively affect
the integrative analysis; thus, it is important to appropri-
ately model and remove residual probe effects, as illu-
strated in a previous study [26].
Because of the lack of public ChIP-seq datasets for the
same protein of interest under similar biological condi-
tions from technical platforms other than Ilumina, our
performance assessment of MM-ChIP was limited to
Illumina datasets. Therefore, some caution needs to be
takenwhenthemethodisappliedtocross-platform
datasets that are not generated on the Illumina platform.
For ChIP-seq datasets across diff erent sequencing plat-
forms, different statistical models may be needed to
account for inter-platform variations besides variation in
inter-library size. Noneth eless, MM-ChIP is generally
applicable to most publicly available ChIP-seq datasets
because most of these datasets were generated on the
Illumina platform.
MM-ChIP currently does not provide functionality for
integratin g data between array and sequencing platforms,
but this will be an important direction to explore in the
future . In addition to ChIP-chip/seq data, there are other
types of genome-wide data, including microarray expres-
sion/RNA-seq data, which provide rich information for
elucidating transcriptional regulatory networks. Most
available integrative analysis methods, including MM-
ChIP, are designed for a single data type. A challenge in
the future will be developi ng met hods for the integration
of different data types from diverse sources.
Conclusions
We have shown that integra ting dataset s from multiple
sources using MM-ChIP improves both the sensitivity and
the specificity of detecting ChIP-enriched regions. With
the ever-increasing deposition of ChIP-chip/seq data into
the public domain, MM-ChIP promises to become a
powerful tool for biologists to make new discover ies that
could not be achieved using a single data source (for
example, finding weak but functional transcription factor
binding sites and associated cis-regulatory modules from
multiple sources of ChIP-chip/seq data).
Materials and methods
Dataset
Three ENCODE spike-in ChIP-chip datasets were used
to assess the performance of MM-ChIP. The datasets
were generated by Kevin Struhl’s lab, Peggy Farnham’s
lab and Scott McCuine using Affymetrix, NimbleGen
and Agilent tiling array platforms, respectively [5,16]
[GEO:GSE10114]. To control for the effect of unba-
lanced replicate number in different studies, we chose
similar numbers of replicates from each dataset (three
replicates from the Affymetrix data, three replicates
from the NimbleGen data and two replicates from the
Agilent data) for integrative a nalysis and performance
comparison. The two ER datasets from MCF7 cell lines
were generated by two different groups using the Affy-
metrix Human Tiling 2.0R Array and the Affymetrix
Human Tiling 1.0R Array [27,28]. For the dataset gener-
ated with the Tiling 2.0R array, two replicates each of
ChIP and input data were used in our analysis. For the
dataset generated with the Tiling 1.0R array, three repli-
cates each of ChIP and input data were used in the ana-
lysis. The two CTCF ChIP-seq datasets from GM12878
cell lines were generated at the Broad Institute and at
the University of Texas at Austin through the ENCODE
project [16]. All ChIP-seq data from ENCODE and
modENCODE (model organism ENCyclopedia Of DNA
Elements) [29] projects were generated on the Illumina
platform. To control for the effect of tag c ount differ-
ence, the same number of mapped tags (10,352,572)
with unique genomic locations was selected from the
ChIP and input samples from the two datasets.
Integrative analysis of ChIP-chip data
Probe behavior model estimate and probe standardization
for individual tiling array platforms
For the one-color Affymetrix platform, the MAT algo-
rithm[13]wasfirstusedtofittherawprobeintensity
to a baseline model to estimate the effect of probe
sequence and genome copy number on intensity. The
probe intensity value was then standardized to a t-value
based on the fitted baseline model. Lastly, MAT com-
puted a statistical score (MAT score) for individual slid-
ing windows surrounding each tiled probe, and the
difference in this score between the ChIP and input
sample was used to quantify the relative ChIP signal
enrichment [13]. If there was no input sample, the
MAT score from the ChIP sample was used. For two-
color platforms, including NimbleGen and Agilent, the
MA2C algorithm [14] was f irst used to standardize the
individual probe intensity value to a t-value by taking
Chen et al. Genome Biology 2011, 12:R11
/>Page 8 of 10
into account the effect of probe GC content on raw
intensity (that is, modeling the GC-specific background
hybridization intensities). Similar to MAT, MA2C then
computed a statistical score (MA2C score) for a sliding
window surrounding each tiled probe, and this score was
used to quantify the relative ChIP signal enrichment [14].
Score normalization and integrative peak detection across
different tiling arrays
To account for the difference in tiling resolution of dif-
ferent arrays, a linear interpolation was first performed to
fill in the MAT/MA2C score (or MAT score difference
between ChIP and input control sample) in matched
genomic regions for all arrays. The interpolation was per-
formed between two tiled probes only if they were spa-
tially close to each other within a pre-defined distance
based on the tiling resolution of the platform. For the
spike-in datasets, the resolution was standardized to 7
bp, and the maximum distance between two tiled probes
within which the interpolations were performed was 10
bp, 50 bp and 100 bp for Affymetrix, NimbleGen and
Agilent, respectively. For the ER datasets, the resolution
was standardized to be 35 bp, and the maximum distance
between which the interpolations were performed was 50
bp. Because both the MAT and MA2C scores are
approxim ately normally distribute d, Z-scores were calcu-
lated based on the null distribution of MAT/MA2C
scores to normalize the scores from different platforms.
The estimation of the null distribution of MAT/MA2C
scores was described in [13,14]. The sum of Z-score
divided by the square root of the number of datasets, a
calculation known as Stouf fer’s method [15], was used to
quantify the ChIP signal enrichment. Under the null
hypothesis of no enrichment, this score was distributed
as a standard normal distrib utio n, and a P-value was cal-
culated accordingly [15]. The empirical false discovery
rate (eFDR) of a peak list from ChIP-chip data is evalu-
ated by MM-ChIP in a similar way to the MAT and
MA2C algorithms: for a given Z-score cutoff value Z
0
(Z
0
> 0) that corresponds to the user-specified P-value, MM-
ChIP finds all peaks with Z-scores greater than Z
0
and all
peaks with Z-scores less th an -Z
0
. Then, the FDR is esti-
mated as Number of negative Z-score peaks/Number of
positive Z-score peaks. This FDR calculation is a slightly
conservative estimate of the positive FDR proposed by
Storey [30] (see Supplementary text in Additional file 1
for the detailed proof).
Integrative analysis of ChIP-seq data
Model building and tag shifting for individual ChIP-seq
datasets
The Model-based Analysis of ChIP-Seq data (MACS)
algorithm [12] was first used to model the characteristic
fragme nt size d of the ChIP-DNA library from each data
source (Figure 4). MACS was then used to shift each
ChIP- seq tag toward the 3’ direction by a d istance of half
of the estimated fragment size (d/2) to better represent
the precise protein-DNA interaction sites for that dataset.
Integrative peak detection using model-shifted tags from
different ChIP-seq datasets
The model-shifted tags from ea ch dataset wer e pooled
together, and a sliding window-based approach similar to
the one used in the MACS method [12] was used to detect
candidate ChIP-enriched regions (peaks). The significance
of a candidate peak was assessed based on a Poisson
model with a dynam ic lambda across the genome, which
captures local biases in tag distribution [12]. The eFDR of
a peak list from ChIP-seq data is evaluated by MM-ChIP
in a similar way to the MACS algorithm. For each P-value
cut-off, MM-ChIP uses the same parameters to find the
number of peaks in a ChIP sample compared with i nput
control sample and vice versa. The eFDR is defined as
Number of input control peaks/Number of ChIP peaks.
Motif enrichment analysis
The CTCF position-specific weight matrix was mapped
onto the human genome using CisGenome [19] with a
third-order Markov background model.
Performance evaluation of integrative analysis of ChIP-
seq with varied inter-library size differences
The performance of MM-ChIP and an alternative
method that first merges the reads from different studies
and then performs model building and peak detection
using the MACS algorithm were evaluated on synthetic
CTCF ChIP-seq datasets with varied inter-library size
differences (Δd). To generate a series of synthetic data-
sets with varied Δd values, the University of Texas at
Austin ChIP-seq tags (library size d = 100) were first
equally divided into two groups by random tag selection.
One group of tags was used as common library data
(d = 100) for all datasets. The tags in the remaining
group were shifted toward the 5’ direction by various
distances to constitute the variant library data. An inte-
grat ive analysis was performed on each pair of common
library and variant library data (Δd = 0, 100, 200) to
evaluate the performance of both algorithms.
Software availability
The companion software for MM-ChIP was written in
Python and can be downloaded from the following link
[31].
Additional material
Additional file 1: Supplementary Figure S1 and supporting text.
Additional file 1 contains Supplementary Figure S1 and supporting text
that describes false discovery rate calculation for integrative analysis
based on Stouffer’s method.
Chen et al. Genome Biology 2011, 12:R11
/>Page 9 of 10
Abbreviations
bp: base pair; ChIP: chromatin immunoprecipitation; CTCF: CCCTC-binding
factor; eFDR: empirical false discovery rate; ENCODE: ENCyclopedia Of DNA
Elements; ER: estrogen receptor; FDR: false discovery rate; HHMM:
hierarchical hidden Markov model; JAMIE: joint analysis of multiple ChIP-chip
experiments; MA2C: Model-based Analysis of 2-Color Arrays; MACS: Model-
based Analysis of ChIP-Seq data; MAT: Model-based Analysis of Tiling-array;
MM-ChIP: Model-based Meta-analysis of ChIP data; ROC: receiver operating
characteristic.
Acknowledgements
We would like to thank the three anonymous reviewers for their insightful
comments, which greatly helped improve this manuscript. This work was
partially funded by NIH grants HG004069 and DK62434.
Author details
1
Department of Biostatistics and Computational Biology, Dana-Farber Cancer
Institute and Harvard School of Public Health, 44 Binney Street, Boston, MA
02115, USA.
2
Division of Biostatistics, Dan L Duncan Cancer Center,
Department of Molecular and Cellular Biology, Baylor College of Medicine,
One Baylor Plaza, Houston, TX 77030, USA.
3
Department of Bioinformatics,
School of Life Science and Technology, Tongji University, Shanghai, 200092,
PR China.
4
Department of Statistics, Harvard University, 1 Oxford Street,
Cambridge, MA 02138, USA.
Authors’ contributions
YC and XSL conceived the project and wrote the manuscript. YC designed
and implemented the algorithms and wrote the software package. All
authors participated in the discussions and contributed to the analysis of the
intermediate results throughout the project.
Received: 19 October 2010 Revised: 16 December 2010
Accepted: 1 February 2011 Published: 1 Februar y 2011
References
1. Kim TH, Ren B: Genome-wide analysis of protein-DNA interactions. Annu
Rev Genomics Hum Genet 2006, 7:81-102.
2. Farnham PJ: Insights from genomic profiling of transcription factors. Nat
Rev Genet 2009, 10:605-616.
3. Schones DE, Zhao K: Genome-wide approaches to studying chromatin
modifications. Nat Rev Genet 2008, 9:179-191.
4. Mendenhall EM, Bernstein BE: Chromatin state maps: new technologies,
new insights. Curr Opin Genet Dev 2008, 18:109-115.
5. Johnson DS, Li W, Gordon DB, Bhattacharjee A, Curry B, Ghosh J, Brizuela L,
Carroll JS, Brown M, Flicek P, Koch CM, Dunham I, Bieda M, Xu X,
Farnham PJ, Kapranov P, Nix DA, Gingeras TR, Zhang X, Holster H, Jiang N,
Green RD, Song JS, McCuine SA, Anton E, Nguyen L, Trinklein ND, Ye Z,
Ching K, Hawkins D, et al: Systematic evaluation of variability in ChIP-chip
experiments using predefined DNA targets. Genome Res 2008, 18:393-403.
6. Zhang ZD, Rozowsky J, Lam HY, Du J, Snyder M, Gerstein M: Tilescope:
online analysis pipeline for high-density tiling microarray data. Genome
Biol 2007, 8:R81.
7. Bieda M, Xu X, Singer MA, Green R, Farnham PJ: Unbiased location
analysis of E2F1-binding sites suggests a widespread role for E2F1 in
the human genome. Genome Res 2006, 16:595-605.
8. Ji H, Wong WH: TileMap: create chromosomal map of tiling array
hybridizations. Bioinformatics 2005, 21:3629-3636.
9. Kharchenko PV, Tolstorukov MY, Park PJ: Design and analysis of ChIP-seq
experiments for DNA-binding proteins. Nat Biotechnol 2008, 26:1351-1359.
10. Rozowsky J, Euskirchen G, Auerbach RK, Zhang ZD, Gibson T, Bjornson R,
Carriero N, Snyder M, Gerstein MB: PeakSeq enables systematic scoring of
ChIP-seq experiments relative to controls. Nat Biotechnol 2009, 27:66-75.
11. Valouev A, Johnson DS, Sundquist A, Medina C, Anton E, Batzoglou S,
Myers RM, Sidow A: Genome-wide analysis of transcription factor binding
sites based on ChIP-Seq data. Nat Methods 2008, 5:829-834.
12. Zhang Y, Liu T, Meyer CA, Eeckhoute J, Johnson DS, Bernstein BE,
Nussbaum C, Myers RM, Brown M, Li W, Liu XS: Model-based analysis of
ChIP-Seq (MACS). Genome Biol 2008, 9:R137.
13. Johnson WE, Li W, Meyer CA, Gottardo R, Carroll JS, Brown M, Liu XS:
Model-based analysis of tiling-arrays for ChIP-chip. Proc Natl Acad Sci USA
2006, 103:12457-12462.
14. Song JS, Johnson WE, Zhu X, Zhang X, Li W, Manrai AK, Liu JS, Chen R,
Liu XS:
Model-based analysis of two-color arrays (MA2C). Genome Biol
2007, 8:R178.
15. Stouffer SA SE, DeVinney LC, Star SA, Williams RM Jr: The American Soldier:
Adjustments During Army Life Princeton NJ: Princeton University; 1949.
16. Birney E, Stamatoyannopoulos JA, Dutta A, Guigo R, Gingeras TR,
Margulies EH, Weng Z, Snyder M, Dermitzakis ET, Thurman RE, Kuehn MS,
Taylor CM, Neph S, Koch CM, Asthana S, Malhotra A, Adzhubei I,
Greenbaum JA, Andrews RM, Flicek P, Boyle PJ, Cao H, Carter NP,
Clelland GK, Davis S, Day N, Dhami P, Dillon SC, Dorschner MO, Fiegler H,
et al: Identification and analysis of functional elements in 1% of the
human genome by the ENCODE pilot project. Nature 2007, 447:799-816.
17. Carroll JS, Meyer CA, Song J, Li W, Geistlinger TR, Eeckhoute J, Brodsky AS,
Keeton EK, Fertuck KC, Hall GF, Wang Q, Bekiranov S, Sementchenko V,
Fox EA, Silver PA, Gingeras TR, Liu XS, Brown M: Genome-wide analysis of
estrogen receptor binding sites. Nat Genet 2006, 38:1289-1297.
18. Hurtado A, Holmes KA, Geistlinger TR, Hutcheson IR, Nicholson RI, Brown M,
Jiang J, Howat WJ, Ali S, Carroll JS: Regulation of ERBB2 by oestrogen
receptor-PAX2 determines response to tamoxifen. Nature 2008,
456:663-666.
19. Ji H, Jiang H, Ma W, Johnson DS, Myers RM, Wong WH: An integrated
software system for analyzing ChIP-chip and ChIP-seq data. Nat
Biotechnol 2008, 26:1293-1300.
20. Barski A, Cuddapah S, Cui K, Roh TY, Schones DE, Wang Z, Wei G,
Chepelev I, Zhao K: High-resolution profiling of histone methylations in
the human genome. Cell 2007, 129:823-837.
21. Johnson DS, Mortazavi A, Myers RM, Wold B: Genome-wide mapping of in
vivo protein-DNA interactions. Science 2007, 316:1497-1502.
22. Mikkelsen TS, Ku M, Jaffe DB, Issac B, Lieberman E, Giannoukos G, Alvarez P,
Brockman W, Kim TK, Koche RP, Lee W, Mendenhall E, O’Donovan A,
Presser A, Russ C, Xie X, Meissner A, Wernig M, Jaenisch R, Nusbaum C,
Lander ES, Bernstein BE: Genome-wide maps of chromatin state in
pluripotent and lineage-committed cells. Nature 2007, 448:553-560.
23. Robertson G, Hirst M, Bainbridge M, Bilenky M, Zhao Y, Zeng T,
Euskirchen G, Bernier B, Varhol R, Delaney A, Thiessen N, Griffith OL, He A,
Marra M, Snyder M, Jones S: Genome-wide profiles of STAT1 DNA
association using chromatin immunoprecipitation and massively parallel
sequencing. Nat Methods 2007, 4:651-657.
24. Wu H, Ji H: JAMIE: joint analysis of multiple ChIP-chip experiments.
Bioinformatics 2010, 26:1864-1870.
25. Choi H, Nesvizhskii AI, Ghosh D, Qin ZS: Hierarchical hidden Markov
model with application to joint analysis of ChIP-chip and ChIP-seq data.
Bioinformatics 2009, 25:1715-1721.
26. Judy JT, Ji H: TileProbe: modeling tiling array probe effects using publicly
available data. Bioinformatics 2009, 25:2369-2375.
27. ER dataset generated using the Affymetrix Human Tiling 2.0R Array.
[ />28. ER dataset generated using the Affymetrix Human Tiling 1.0R Array.
[ />29. Celniker SE, Dillon LA, Gerstein MB, Gunsalus KC, Henikoff S, Karpen GH,
Kellis M, Lai EC, Lieb JD, MacAlpine DM, Micklem G, Piano F, Snyder M,
Stein L, White KP, Waterston RH: Unlocking the secrets of the genome.
Nature 2009, 459:927-930.
30. Storey JD: The positive false discovery rate: a Bayesian interpretation and
the q-value. Ann Stat 2003, 31:2013-2035.
31. MM-ChIP. [ />doi:10.1186/gb-2011-12-2-r11
Cite this article as: Chen et al.: MM-ChIP enables integrative analysis of
cross-platform and between-laboratory ChIP-chip or ChIP-seq data.
Genome Biology 2011 12:R11.
Chen et al. Genome Biology 2011, 12:R11
/>Page 10 of 10