SOIL ENGINEERING: TESTING, DESIGN, AND REMEDIATION phần 7 doc
Bạn đang xem bản rút gọn của tài liệu. Xem và tải ngay bản đầy đủ của tài liệu tại đây (3.22 MB, 27 trang )
©2000 CRC Press LLC
in the stiffness EL of the pier section decreases the lateral deflection of long piers,
but does not affect the lateral deflections of short piers.
For long piers, the lateral deflection y at the ground surface can be calculated
directly from
For short piers, the lateral defection y at the ground surface for a free-headed
condition can be calculated from
For e = 0,
TABLE 11.8
Value of Stiffness Factor (µL) for Piers of Various Embedment Lengths
and Diameters Drilled in Cohesionless Soils of Various Relative Densities
Pier
Diameter
(in.)
State Very Loose Loose Medium Dense Very Dense
n
h
(tons/ft
3
)7 21 56 74 92
n
h
(lbs./in.
3
) 8.10 24.30 64.81 85.65 106.48
Pier Length (in.)
18 120 1.73 2.16 (2.52) (2.70) (2.82)
24 120 1.33 1.60 1.98 (2.11) (2.22)
30 120 1.10 1.37 1.68 1.77 1.86
36 120 0.96 1.19 1.44 1.52 1.60
42 120 0.85 1.05 1.27 1.35 1.41
18 240 (3.46) 4.32* 5.04* 5.40* 5.64*
24 240 (2.66) (3.20) (3.96) 4.22* 4.44*
30 240 (2.20) (2.74) (3.36) (3.54) (3.72)
36 240 1.92 (2.38) (2.88) (3.04) (3.22)
42 240 1.60 (2.10) (2.54) (2.70) (2.82)
18 360 5.19* 6.48* 7.56* 8.10* 8.46*
24 360 (3.99) 4.95* 5.94* 6.33* 6.66*
30 360 (3.30) 4.11* 5.04* 5.31* 5.58*
36 360 (2.88) (3.57) 4.32* 4.56* 4.80*
42 360 (2.55) (3.15) (3.81) 4.05* 4.23*
1.73 indicates short pier (µL less than 2.0)
5.19* indicates long pier (µL larger than 4.0)
(3.46) indicates µL between 2.0 and 4.0
ypnhEL=
[]
240
35 25
.
y=
p
e
L
Ln
h
18 1 1 33
2
+
Ê
Ë
ˆ
¯
.
,
y
p
Ln
h
=
18
2
©2000 CRC Press LLC
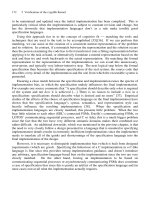
The above equations can be plotted as shown in Figure 11.11. Table 11.9 is
prepared on the basis of Figure 11.11, considering the cases of both long and short
piers.
FIGURE 11.11 Lateral deflection related to stiffness factor for piers drilled in cohesionless
soils.
©2000 CRC Press LLC
11.7 PRESSUREMETER TEST
The value of horizontal subgrade reaction k
h
can also be determined experimentally
by using the Menard pressuremeter. The pressuremeter probe is inserted in the test
TABLE 11.9
Maximum Working Load (tons) for Free-Headed Piers of Various Diameters
and Lengths Drilled in Cohesionless Soils of Various Relative Densities with
Lateral Deflection of 0.5 in.
Pier
Diameter
(in.)
State Very Loose Loose Medium Dense Very Dense
n
h
(tons/ft
3
)7 2156 74 92
Relative Density (%) 20 30 50 70 80
Pier
Length (in.)
18 120 1.62 4.86 12.96
(17.43)
17.12
(17.30)
21.29
(20.10)
24 120 1.62 4.86 12.96 17.12 21.29
(32.14)
30 120 1.62 4.86 12.96 17.12 21.29
36 120 1.62 4.86 12.96 17.12 21.29
42 120 1.62 4.86 12.96 17.12 21.29
18 240 6.48
(4.26)
(8.28) (14.86) (17.30) (20.10)
24 240 6.48
(6.81)
19.44
(13.24)
51.84
(23.75)
(27.65) (32.12)
30 240 6.48
(9.81)
19.44
(19.12)
51.84
(34.29)
68.48
(39.92)
85.16
(46.38)
36 240 6.48 19.44
(25.50)
51.84
(45.72)
68.48
(53.23)
85.16
(61.84)
42 240 6.48 19.44
(32.72)
51.84
(58.67)
68.48
(68.01)
85.16
(79.36)
18 360 14.59
(4.26)
(8.28) (14.86) (17.30) (20.10)
24 360 14.59
(6.81)
(13.24) (23.75) (27.65) (32.12)
30 360 14.59
(9.84)
(19.12) (34.29) (39.92) (46.38)
36 360 14.59
(13.11)
43.78
(25.50)
(45.72) (53.23) (61.84)
42 360 14.59
(16.82)
43.78
(32.72)
116.76
(58.67)
(68.01) (79.36)
1.62 indicates lateral pressure on the basis of short pier
(4.26) indicates lateral pressure on the basis of long pier
©2000 CRC Press LLC
hole at the desired depth. The radial expansion of the hole is expressed as a function
of increasing radial pressures applied to its wall, similar to a common load test.
Thus, the deformation modulus E
s
can be determined at any depth. The following
formula is used in the determination of the coefficient of horizontal subgrade reaction:
In which
k = Coefficient of horizontal subgrade reaction (kg/cm
3
)
µ= Poisson’s ratio (0.3 for most soils)
R
o
= Radius of pressuremeter probe
D = Pier diameter (cm)
C
1
= Structural coefficient of soil (0.33 for sand, 0.66 for claystone)
C
2
= Shape factor in shear deformation zone (2.65 where L/D less than 20)
C
3
= Shape factor in consolidation zone (1.50 where L/D less than 20)
E
s
= Deformation modules (kg/cm
2
)
As an example, an actual pressuremeter test was made in a medium dense sand
and gravel at a depth 16 ft below the surface. E
s
value obtained from the test was
115 kg/cm
2
. For a 42-in. diameter pier, the k
h
value is:
By substitution, the horizontal subgrade reaction is
This value is reasonable in comparison with Terzaghi’s value listed in Table 11.3.
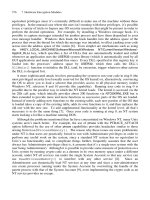
11.8 APPLICATIONS
This chapter summarizes past research about lateral load on piers. The content is
quoted directly from Broms’ papers without alteration. It is intended that a rational
procedure in designing piers for lateral load be established (Figure 11.12). The
conventional building code lateral load values assigned to the piers or piles are
11
3
2
45 2
2
1
3
1
kh Es
Ro
R
R
C
C
Es
C
D
o
C
=
+m
È
Î
Í
ù
û
ú
+
.
110333115 30 53 30 2 65 0 33
033 45 115 1 5 53
0 192 0 0507
0 2427
412 128
33
K
Kkgcmton ft
h
h
=+
()
¥
()
[]
()
()
¥
[]
()
+¥
()
[]
¥¥
=+
=
==
. . .
.
.
n ton ft
h
=¥
()
=128 3 5 15 29 9
3
©2000 CRC Press LLC
undoubtedly low and the soil classification ambiguous. The following is a summary
of the above design procedure.
1. Determine the predominant soil conditions surrounding the piers. It would
be sufficient to indicate that the soil consists of, for instance, 15 ft of
granular soils and 5 ft of claystone bedrock. Refinement such as the
existence of clay lenses and cobbles will not be necessary.
2. In the case of granular soils, select the loose state as design criteria. Direct
shear tests and density tests should be conducted, and the average value
selected for the design purpose.
3. It is important to establish the ground water level, so that the appropriate
constant of subgrade reaction value can be selected.
4. In the case of cohesive soil, the unconfined compressive strength tests
should be conducted on many samples and the average value used for
design. More important is the fact that the penetration resistance value
should not be overlooked.
5. In the case of claystone bedrock, the unconfined compressive strength is
usually only a fraction of its actual strength; consequently, more attention
should be directed to the penetration resistance values.
6. The most direct and accurate method of determining the soil strength is by
use of the Menard pressuremeter. Pressuremeter tests can be conducted at
relatively low cost, and the results are more reliable than laboratory testing
on samples in which a great deal of disturbance is to be expected.
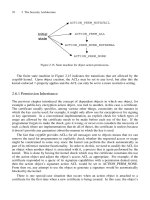
7. For the design of structures such as sign posts and transmission towers,
where large deflection can be tolerated, lateral soil resistance given in
Tables 11.1 and 11.2 should be used.
FIGURE 11.12 Microwave tower on piers subjected to lateral load.
©2000 CRC Press LLC
8. For high-rise structures subject to wind load and seismic load, or high
retaining walls subject to earth pressure, lateral deflection can be critical.
In such cases, a determination of long or short piers’ conditions should
be made. For low-rise buildings, a restrained condition can generally be
assumed. If a free-headed condition is selected, the tolerable deflection
of 0.5 in. can be assumed. Tables 11.6 and 11.9 can be used as guides.
REFERENCES
B.R. Broms, Lateral Resistance of Piles in Cohesionless Soils, Journal of the Soil Mechanics
and Foundation Division, ASCE, Vol. 90, No. SM3, proc. paper 3909, 1964.
B.R. Broms, Lateral Resistance of Piles in Cohesive Soils, Journal of the Soil Mechanics and
Foundation Division, ASCE, Vol. 90, No. SM2, Proc. Paper 3825, 1965.
B.R. Broms, Design of Laterally Loaded Piles, Journal of the Soil Mechanics and Foundation
Division, ASCE, Vol. 91, No. SM3, Proc. paper 4342, 1965.
E. Czerniak, Resistance to Overturning of Single, Short Pile, Journal of the Structural
Division, ASCE, Vol. 83, No. ST2, proc. paper 1188, 1957.
P. Kocsis, Lateral Loads on Piles, Bureau of Engineering, Chicago, IL, 1968.
H. Matlock and L.C. Reese, Generalized solutions for Laterallly Loaded Piles, Journal of the
Soil Mechanics and Foundation Division, ASCE, Vol. 86, No. SHS, proc. paper 2626,
1960.
K. Terzaghi, Evaluation of Coefficient of Subgrade Reaction. Geotechnique, London, Vol. V.,
No. 4, 1955.
R. Woodward, W. Gardner, and D. Greer, Drilled Pier Foundations, McGraw-Hill, New York,
1972.
0-8493-????-?/97/$0.00+$.50
© 1997 by CRC Press LLC
12
©2000 CRC Press LLC
Driven Pile Foundations
CONTENTS
12.1 Allowable Load on Piles in Cohesionless Soils
12.1.1 Penetration Test Method
12.1.2 Plasticity Method
12.1.3 Example
12.2 Allowable Load on Piles in Cohesive Soils
12.2.1 Total Stress Method
12.2.2 Effective Stress Method
12.2.3 Example
12.3 Pile Formulas
12.3.1 Engineering News Record Formula
12.3.2 Danish Formula
12.3.3 Evaluation of Pile Formula
12.4 Pile Groups
12.4.1 Efficiency of Pile Groups
12.4.2 Settlement of Pile Groups
12.5 Negative Skin Friction
12.5.1 Example
12.6 Pile Load Tests
12.6.1 Slow Maintained Load (SML) Method
12.6.2 Constant Rate of Penetration (CRP) Method
References
With exception of footings, probably the oldest foundation system is the driven pile
foundation. Wooden piles were driven by stone hammers, hauled up by use of
pulleys, and dropped from a platform by gravitational force. Many historical struc-
tures were founded on piles driven through soft soils into firm bearing strata.
The function of a pile foundation is essentially the same as a pier foundation,
as discussed in previous chapters. The major differences between the uses of a pile
and a pier foundation are:
1. The diameter of an individual pile as well as its load-carrying capacity is
limited.
2. Large diameter piers are used to support high column loads, while a pile
group is used for the same purpose.
3. Pile driving technique and pier installation procedures are different. Both
require special equipment and specialized contractors.
©2000 CRC Press LLC
4. The analysis on the lateral pressure against the piers, as described in
Chapter 11, is also applicable in the case of piles. However, a single pile
is seldom used.
5. Defects of a driven pile cannot be easily detected, while a pier shaft can
be inspected by entering the hole.
6. Piers are widely used in expansive soil areas to prevent heaving. The use
of piles for such a purpose is still under study.
The selection of the use of a pile or pier foundation system depends on the type
of structure, the regional subsoil conditions, the water table level, the available
equipment, and many other factors.
The types of pile commonly used are as follows:
Timber piles
— For centuries, timber piles have been used to support structures
founded on soft ground. The entire city of Venice was founded with timber piles
over the muddy deposit on the River Po. An individual pile is limited in diameter
as well as length. The length is generally limited to around 60 ft. Timber piles can
be damaged by excessive driving and by decay. Today, commercial piles are usually
treated by chemicals that prevent decay and increase their life.
Concrete piles
— Precast concrete piles may be made in various shapes and
diameters. Reinforced precast concrete piles are sometimes prestressed to ease
driving and handling. The length of concrete piles is limited to the capability of
handling equipment. To increase the length limitation, consideration has been given
to the possibility of splicing the piles. Cast-in-place piles are similar to piers, but
not as flexible in capacity. Concrete piles are generally not susceptible to deterioration.
A great deal of publicity has been launched by various companies to increase
the market use of concrete piles. Raymond piles are widely used in Asian countries
where adequate timbers are scarce.
Steel piles
— Steel piles are usually either pipe-shaped or H-sections. Pipe-
shaped steel piles may be filled with concrete after being driven. H-shaped steel
piles can be driven to a great depth through stiff soil layers and will not easily be
deflected when encountering cobbles. Steel piles are subjected to corrosion. In strong
acid soils such as fill or organic matter, and in sea water, corrosion is more serious.
Composite piles
— Composite piles are a combination of a steel or timber lower
section with a cast-in-place concrete upper section. The uncased Franki concrete
pile is formed by ramming a charge of dry concrete in the bottom of a steel casing
so that the concrete grips the walls of the pipe and forms a plug. A hammer falling
inside the casing forces the plug into the soil, dragging the casing downward by
friction. At the bearing level, the casing is anchored to the driving rig, and the
concrete plug is driven out its bottom to form a bulb over 3 ft in diameter. The casing
is then raised while successive chargers of concrete are rammed in place to form a
rough shaft above the pedestal. Franki piles are widely used in Hong Kong, where
the subsoil consists of alternate layers of soft soil and hard rocks. Most high-rise
structures in Hong Kong are founded with Franki piles.
©2000 CRC Press LLC
12.1 ALLOWABLE LOAD ON PILES
IN COHESIONLESS SOILS
Piles in cohesionless soils derive their load-carrying capacity from both point resis-
tance and friction on the shaft. The relative contributions of point resistance and
shaft resistance to the total load-carrying capacity of the pile depend on the density
and shear strength of the soil and on the characteristics of the piles. An empirical
method in determining the load-carrying capacity of the pile is based on the results
of the standard penetration test. A more exact method is based on the theory of
plasticity.
12.1.1 P
ENETRATION
T
EST
M
ETHOD
A simple and direct method in the determination of bearing capacity of piles driven
in cohesionless soils is by the utilization of the results of the standard penetration
resistance. Since such values are obtained in all field investigations, no additional
tests will be required.
where
Q
f
= ultimate pile load, tons
N
= Standard penetration resistance at pile tip, blows per ft
A
p
= cross-sectional area of pile tip, in ft
2
N
a
= average penetration resistance along the pile shaft, blows per ft
A
s
= surface area of the pile shaft, ft
2
Since this is an empirical method, a factor of safety of at least three is used.
Therefore, the allowable load Q
a
is determined as follows
Q
a
£
Q
f
/3
For non-displacement piles such as H-piles, a factor of safety of four is recommended.
For cone penetration resistance value, the ultimate bearing resistance value is
suggested as follows:
where
q
p
is the average cone penetration resistance with a limiting value of 15 MN/m
2
.
12.1.2 P
LASTICITY
M
ETHOD
Large-scale experiments and measurements on full-scale piles have shown that the
skin friction per unit of area does not increase with depth below a critical depth
(
Hc
), which for all practical purposes is equal to:
QNA
N A
f
p
as
=+4
50
QqA
app
=
©2000 CRC Press LLC
H
c
= 20
D
where
D
is the diameter or width of the pile.
For piles with a length in granular soil less than the critical depth (H
c
), the
ultimate point resistance is given by:
q
p
=
g
L N
q
where q
p
= ultimate point resistance, lb/ft
2
g
= effective unit weight of the soil, lb/ft
3
L= length of pile embedment, ft
N
q
= a bearing capacity coefficient
For piles with lengths in excess of the critical depth, the ultimate point of
resistance is constant and equal to:
q
p
=
g
H
c
N
q
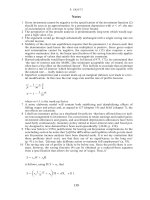
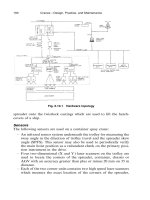
Values of Berezontzev’s factor N
q
as plotted conveniently by Tomlinson are shown
in Figure 12.1.
The ultimate skin friction acting on the pile of length L is related to the ultimate
point of resistance by the equation
where
a
= a coefficient related to the shearing resistance as shown in Table 12.1.
It is recommended that a factor of safety of three be applied to q
p
and f
f
. Hence,
the allowable load (
Q
a
) on a pile in cohesionless soil is computed as follows:
For
L
<
H
c
where
q
p
and
f
f
are computed at depth
L
and
A
p
= cross-sectional area of pile tip ft
2
A
¢
s
= unit surface area of the pile shaft, ft
2
/ft
For length of pile exceeding the critical length of 20 ft
a
p
p
f
Q
q
A
f
AsL=+
¢
È
Î
Í
Í
ù
û
ú
ú
1
32
f
q
f
p
=
a
a
Q
p
q
p
A
f
f
As
c
H
f
f
As L Hc=+
¢
+
¢
-
()
È
Î
Í
Í
ù
û
ú
ú
1
32
©2000 CRC Press LLC
where
q
p
and
f
f
are computed at depth
H
c
= 20 D
12.1.3 E
XAMPLE
A 12-in square section of concrete pile is driven to an embedded depth of 15 ft in
a cohesionless soil, which has the following properties:
FIGURE 12.1
Berezontzeyv’s bearing capacity factor (after Tomlinson).
TABLE 12.1
Friction Angle and Shearing Resistance
(
a
as a function of shearing resistance
f
)
f
25° 30° 35° 40°
soil density loose compact dense V dense
a
35 50 75 110
(after Vesic)
©2000 CRC Press LLC
g
= unit weight of soil = 110 lb/ft
3
L
= length of pile embedment = 15 ft
f
= angle of internal friction = 30°
N
q
= bearing capacity coefficient = 30
D
= width of the pile = 1 ft
a
= shearing resistance coefficient = 50
A
p
= cross-sectional area of pile tip = 0.25 ft
2
A
¢
s
¢
= surface area of pile shaft = 15 ft
2
q
p
= 110
¥
15
¥
30 = 49,500
f
= 49,500/50 = 990
Q
a
= 1/3 [49,500
¥
0.25 + 990/2
¥
15
¥
15] = 41,250 lbs
= 20.6 tons
Upon checking the above value with the empirical penetration resistance method,
we have:
20.6 = 4 N
¥
0.25 + N
¥
15/50 = 1.03 N
N = 20 blows/ft
The average penetration resistance will be on the order of 20 blows/ft, that is
considered reasonable.
For long piles with
L
= 30 ft, and using the same data given above, the allowable
bearing value is:
Q
s
= 1/3 [49,500
¥
0.25 + 990/2
¥
15
¥
30 + 990
¥
15 (30 – 20)]
= 127,875 lbs = 63.9 tons
Upon checking with the empirical method, this corresponds to a penetration
resistance of about 43 blows/ft. This value is high; it is doubtful that by increasing
the pile embedment to 30 ft, the penetration resistance can be doubled. The deviation
between the empirical method and the plasticity method becomes more pronounced
as the length of embedment into the soil increases.
12.2 ALLOWABLE LOAD ON PILES
IN COHESIVE SOIL
In contrast to a friction pile in sand, the point resistance of a pile embedded in soft
clay is usually insignificant. It seldom exceeds 10% of the total capacity. Piles driven
in cohesive soils generally derive their load-carrying capacity from friction or shaft
adhesion. However, in very stiff clays large magnitudes of point resistance do develop
and contribute to the total bearing capacity of the pile.
The shear strength or side resistance per unit of contact area depends largely on
the properties of the clay and except for very long piles does not depend on the
depth of penetration.
Various methods have been used to compute the distribution of the load imposed
on the pile; no reliable results have been obtained. This is because homogeneous
©2000 CRC Press LLC
soils seldom exist in nature, and the stress deformation properties of the soil cannot
be readily determined.
The bearing capacity of piles embedded in clay can be evaluated by using the
total stress method or the effective stress method.
12.2.1 T
OTAL
S
TRESS
M
ETHOD
The state of stress around the pile is very complicated. It changes during and
immediately after the driving. In spite of the influence of disturbance and other
factors, the ultimate shear strength mobilized between the pile and the embedded
clay is approximately equal to the undrained shear strength from the unconfined
compressive strength test. It is assumed that most of the passive pressure developed
at the tip of the pile will tend to dissipate with time and, therefore, the point resistance
can be neglected. Hence, the ultimate bearing capacity of a pile embedded in soft
clay can be estimated from this formula:
Q =
a
z2
c
a
c
d
L
where Q = Ultimate load capacity, lb
a
z
= Reduction factor
c
a
= Adhesion factor
= q
u
/2
q
u
= Unconfined compressive strength, tons/ft
2
c
d
= pile perimeter, ft
L= length of pile embedment, ft
The relationship between the reduction factor and the unconfined compressive
strength of steel piles is shown in Figure 12.2.
Tomlinson determined the adhesion of piles embedded in soft clay, as shown in
Table 12.2.
Using a factor of safety of three, the allowable pile capacity is computed as:
The shaft friction of piles driven in clay with an undrained shear strength in
excess of approximately 2000 psf varies significantly, depending on the properties
of the clay, time effects, driving methods, and pile types. In addition, piles in very
stiff clay can exhibit substantial point resistance. Therefore, for piles in clay with
an undrained shear strength in excess of 2000 psf, it is suggested that the ultimate
bearing capacity be determined by pile load tests.
12.2.2 E
FFECTIVE
S
TRESS
M
ETHOD
Meyerhof and others in 1979 proposed that the skin friction per unit of area on a
pile in clay should be expressed in terms of effective stress. The portion of a load
carried by point resistance and skin friction can be calculated as follows:
Q
Q
a
f
=
3
©2000 CRC Press LLC
FIGURE 12.2
Reduction factor vs. unconfined compressive strength of friction piles in
clays (after Peck).
TABLE 12.2
Adhesion of Piles in Saturated Clay
Material Cohesion (psf) Adhesion (psf)
Concrete 0–700 0–700
750–1500 700–900
Timber 1500–2000 900–1300
Steel 0–750 0–600
750–1500 600–750
≥
1500 75
©2000 CRC Press LLC
where
Q
p
= ultimate point load, lbs
N
c
= bearing capacity factor (as a function of pile diameter, given as follows)
C
u
= minimum undrained shear strength at the pile tip, lb/ft
2
where Q
f
= ultimate friction load, lb
A
s
= surface area of the pile shaft, ft
2
p
o
= effective overburden pressure at the considered depth, lb/ft
2
b = skin friction factor
On the assumption that the clay next to the pile is completely remolded, and
thus that the cohesion intercept is zero and the effective angle is f, then
b = K
s
tan f
where K
s
= coefficient of earth pressure on the pile shaft
f = effective angle of friction
Both K
s
and f are difficult to measure. However, available data indicates that
for clay with undrained shear strength less than 2000 psf b varies from only 0.25 to
0.40 for piles less than 50 ft in length. Therefore, for design purposes, a typical
value of 0.3 may be used. For lengths of piles in excess of 50 ft, the value of b
should be altered according to this table, as indicated by Meyerhof:
Point diameter
(inches) N
c
<18 9
18–36 7
>36 6
Depth (ft) b
0–50 0.30
50–100 0.25
100–150 0.20
>150 0.15
(after Meyerhof)
QNCA
pcup
=
QAsp
f
o
=b
©2000 CRC Press LLC
If the value of K
o
(the coefficient of the earth pressure at rest) is not known for
piles driven into stiff clays, the corresponding skin friction factor can only be
estimated with a wide range. Some tests show that b varies from 0.5 to 2.5 for stiff
clays.
The results of various investigations on this subject have shown some improve-
ment in the prediction of allowable capacity for piles driven into stiff clays, yet they
have not reached the stage of practical application. The effective stress method is
included in this chapter only for information to the consultants.
12.2.3 EXAMPLE
A 12-in. diameter concrete pile is driven in a normally consolidated clay to an
embedded depth of 35 ft. The clay has the following properties:
g = unit weight of soil = 110 lb/ft
3
q
u
= unconfined compressive strength = 1400 psf
c
a
= unit adhesion, with q
u
= 0.7 ton/ft
2
= 0.9 ¥ 700 = 630 psf
f = angle of internal friction = 0
c= unit cohesion = 1400/2 = 700 psf
A= surface area of pile = pc
d
L = 3.14 ¥ 35 = 110 ft
2
c
d
= pile perimeter, ft
To find the allowable bearing capacity with a factor of safety of two,
Q
f
= c
a
c
d
L
= 630 ¥ 110
= 69,300 lbs. = 34.65 tons
Q
a
= 34.6/2 = 17.325 tons
12.3 PILE FORMULAS
The bearing capacity of a point-bearing pile may be approximately equal to the
resistance of the soil against rapid penetration of the pile under the impact of the
pile-driving hammer. Hence, many attempts have been made to develop “pile-driving
formulas” by equating the energy delivered by the hammer to the work done by the
pile as it penetrates a certain distance against a certain resistance, with allowance
made for energy losses.
12.3.1 ENGINEERING NEWS RECORD FORMULA
As early as 1888, Wellington developed the Engineering News Formula as follows:
Q
dy
= 2 W H/(S+C)
©2000 CRC Press LLC
where Q
dy
= allowable pile capacity, lb
W= weight of hammer, lb
H= height of fall of hammer, ft
S= amount of pile penetration per blow, in./blow
C= 1.0 for drop hammer
C= 0.1 for steam hammer
The Engineering News Record Formula has a built-in factor of safety of six.
Pile load tests have shown that the real factor of safety of the formula averages two
instead of apparent six and that the safety factor can be as low as 2/3 and as high as 20.
Because of its simplicity, the formula has been widely used, but the results of
load tests on driven piles have shown this formula is not really reliable for computing
the load-carrying capacity. For consultants, the formula can at least be used as a
rough guide. For small projects, where a load test is not justified and where over-
design is permissible, such a formula can still be conveniently applied.
12.3.2 DANISH FORMULA
Another pile-driving formula widely used in Europe is known as the Danish Formula.
It is given by:
where Q = ultimate capacity of the pile
e
h
= efficiency of pile hammer
E
h
= manufacturers’ hammer energy rating
S= average penetration of the pile from the last few driving blows
S
o
= elastic compression of the pile
The Danish Formula is based on the assumption that the energy losses consist
only of the elastic deformation of the pile and are moreover, not influenced by the
penetration of the point of the pile. Statistical studies suggest that the formula should
be used with a factor of safety of three.
12.3.3 EVALUATION OF PILE FORMULA
Numerous attempts have been made to take account of the energy losses in the pile
formulas. Some of these attempts have resulted in very complicated expressions and
procedures.
Pile-driving formulas are based on the assumptions that the bearing capacity of
a driven pile is a direct function of the energy delivered to it during the last blows
of the driving process, and that the energy transmission from the hammer to the pile
and soil is instantaneous on impact.
These two assumptions have been proven wrong by many investigators. It has
been clearly demonstrated that the bearing capacity of a pile is related, not so much
QeE S
hh
o
=+
()
212
©2000 CRC Press LLC
to the total energy per blow of the driving system, but more importantly to the
distribution of this energy with time at and after impact. From the many investiga-
tions of pile driving by means of the wave propagation theory, it has been made
clear that the time effects as related to the propagation of impact forces on the pile
have a governing influence on the behavior of piles during driving.
All pile-driving formulas involve the data of hammer blows. Hammer blow
values are furnished by inspectors with sometimes little experience. As stated in
Chapter 3, subsoil conditions vary a great deal even in very short distances. The
blow count figure used in design can be off by as much as 100%.
The lack of reliability of pile-driving formulas was recognized a long time ago;
for example, in 1942 Peck stated:
It can be demonstrated by a purely statistical approach that the chances of guessing
the bearing capacity of a pile are better than that of computing it by pile-driving
formula…to determine the ultimate bearing capacity of a pile, the following procedure
then would be justified: take 100 poker chips and label them with numbers so as to
form a geometrically normal array having a mean value of 91 tons and a standard
deviation of 1.55. Mix the poker chips and select one. The value written on the chip
will be the bearing capacity of the pile. The value from the chip will be nearer to the
true capacity more frequently than the value obtained by use of any of the pile
formulas.
The lack of confidence that engineers have in such design formulas is demon-
strated by the fact that the safety factors applied to determine the allowable loads
are always very large; a value of F.S. = 6 is typical. This is a theoretical F.S. and
not usually verified by full-scale load tests. Load test results have shown that the
actual F.S. vary from less than 1 to values as high as 20.
Customary ranges of working load on driving piles are listed in Table 12.3. The
values can be used for preliminary estimate in design.
TABLE 12.3
Ranges of Working Load on Driven Piles
Type
Load
(kips)
Concrete, precast, or restressed
10 in. diameter 4.0–13.0
15 in. diameter 15.0–45.0
Steel pipe, concrete filled
1.0 ¥ 0.2 in. pipe 0.7–1.2
1.6 ¥ 0.4 in. pipe 22.5–26.9
Raymond Step-taper 0.9–15.6
Steel H-Section
HP 10 ¥ 42 in. 11.0–18.0
HP 14 ¥ 117 in. 33.5–45.0
©2000 CRC Press LLC
12.4 PILE GROUPS
In actual construction, the use of a single pile seldom or never exists. All structures
are supported by pile groups. This is probably the major difference between the use
of a pile and a pier. Theoretical analysis of the behavior of a single pile cannot be
applied to a pile group.
Both theory and practice have shown that pile groups may fail as units by
breaking in the ground before the load per pile becomes equal to a design safe load.
Piles are usually placed in groups with center-to-center spacing typically between
two and five shaft diameters. The pile heads are poured into a slab. The slab or the
pile cap has the effect of constraining the group to act as a monolithic unit.
The minimum allowable pile spacing is often specified by local building codes.
A building code may state that “The minimum center-to-center spacing of piles not
driven to rock shall be not less than twice the average diameter of a round pile, nor
less than 2 ft 6 in. For piles driven to rock, the minimum center-to-center spacing
of piles shall be not less than twice the average diameter of a round pile, nor less
than 1.75 times the diagonal dimension of a rectangular or rolled structural steel
pile, nor less than two ft.”
12.4.1 EFFICIENCY OF PILE GROUPS
The efficiency of a pile group is the capacity of a group of piles divided by the sum
of the individual capacities of the piles making up the group. In the case where a group
of piles is comprised of end-bearing piles resting on bedrock or on dense sand and
gravel, an efficiency of 1.0 may be assumed. An efficiency of 1.0 can also be assumed
where a group of piles is comprised of friction piles driven in cohesionless soils. In
the case where a group of piles is composed of friction piles driven into cohesive soils,
an efficiency of less than 1.0 is to be expected. A pile efficiency may be assumed to
vary linearly from the value of 0.7, with a pile spacing of three times the diameter.
If the piles and the confined mass of soil are driven as a unit like a pier, the
ultimate bearing capacity of the group can be given as follows:
Q
s
= q
d
BL + S s
u
where q
d
= ultimate bearing, per unit of area
S = surface area of embeded portion of the pile group
= D(2B + 2 L)
B = breadth of pile cap
L = width of pile cap
s
u
= average undrained shearing resistance of the soil between surface and
bottom of the piles.
12.4.2 SETTLEMENT OF PILE GROUPS
The settlement of a pile group is larger than the settlement of a single pile and may
be as much as five or ten times larger, depending on the size of the pile group. A
©2000 CRC Press LLC
pressure distribution analysis indicates that the larger the group, the deeper the
stresses penetrate the strata, and thus, from the elasticity considerations, the larger
the settlement. An individual pile has a small effective width; therefore, the stress
influence from the pile load extends only to a shallow depth. With a pile group, the
effective width increased dramatically; consequently, the stress influence is distrib-
uted to a much greater depth. As a result, a larger mass of soil is loaded, which in
turn results in the consolidation of more material. The net result is a greater amount
of settlement.
One way of estimating the settlement of a pile group is to consider an equivalent
raft located at a depth of 2/3 D, where D is the embedded depth of the pile as shown
in Figure 12.3.
The area of the equivalent raft is determined by assuming that the load spreads
from the underside of the pile cap in the ratio of 1:2. The settlement due to the
uniformly loaded equivalent raft is then calculated by conventional means with
parameters obtained either from laboratory consolidation tests or from field pene-
tration tests.
Because of the great numbers and diversity of the factors involved, it is very
doubtful that the settlement of a pile group construction can be estimated within a
practical range. At the present state of knowledge, it is preferable to consider every
case individually and evaluate the probable settlement on the basis of the physical
properties of the soil on which the load is transmitted by the piles.
12.5 NEGATIVE SKIN FRICTION
Negative skin friction is a force developed by friction between the pile and the
surrounding soil. It is in a downward direction because of the movement of the soil
mass; hence, the term downdrag.
Downdrag occurs when piles are driven through a layer of fill material that
slowly consolidates due to its own weight; a downdrag is imposed on the pile shaft,
resulting in pile settlement. A similar movement can take place when the pile is
driven through a compressible material that is subject to overburden pressure, or
when there is a sudden change of water level. This movement as a result of the
friction force tends to carry the piles farther into the ground. The result could be
excessive pile settlement.
FIGURE 12.3 Settlement of pile group (after Whitlow).
©2000 CRC Press LLC
Because the soil alongside the pile is much more compressible than the pile
itself, the downdrag forces on the upper part of the pile forces the lower part to slip
downward with respect to the adjacent soils. Consequently, there is a neutral depth
above which negative skin friction occurs and below which the skin friction acts
upward. This is theoretically shown in Figure 12.4.
As consolidation proceeds, the magnitude of negative friction increases, since
the effective overburden pressure increases as the excess pore pressure dissipates.
An estimate of the magnitude of downdrag can be obtained from an empirical
analysis known as the b-method. The b-method utilizes the expression
f
s
= b s
where f
s
= unit negative skin friction, ksf
s = vertical effective stress
b = negative skin friction parameter
= 0.20 to 0.25 for clays
= 0.25 to 0.35 for silts
= 0.35 to 0.50 for sands
The total downdrag force, F
s
, is contributed by each soil layer computed from
the expression
FIGURE 12.4 Negative skin friction (after Whitlow).
©2000 CRC Press LLC
F
s
= f
s
ph
where p = pile perimeter, ft
h= layer thickness, ft
This is an empirical method which is applicable when significant movement
between soil and pile takes place. When surface settlements are less than 1 to 2 in.,
the estimated downdrag load is conservative. In addition, the method also overesti-
mates the downdrag load on a pile in a group; therefore, in general, the method
provides an upper bound on the expected downdrag loads.
Failure to recognize the potential for negative skin friction has been responsible
for many examples of excessive settlement. As stated by Peck in 1996, “Indeed,
recognizing the conditions under which it may develop is more important than the
ability to estimate with precision the additional downward load or the amount of
settlement.”
12.5.1 EXAMPLE
A steel building was originally supported by spread footings. Shallow wetting of
the coarse granular soils supporting the footing resulted in over 3 in. of settlement.
One corner of the building was underpinned by two 12 ¥ 54 WF piles driven to a
depth of 98 ft. Two years after the underpinning, deep wetting of the subsoil took
place. One of the piles below the pile cap settled 8 in. and the adjacent ground
subsided more than 12 in. A pull-out test performed on the failed pile indicated the
skin friction force was at least 182 tons.
The building corner was again underpinned with three BP 12 ¥ 74 piles driven
to a depth of 145 ft. The upper 50 ft of each new pile was sleeved with an outer
casing. The total design load for the column at this corner was about 240 kips.
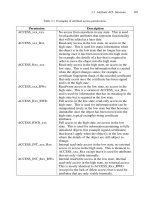
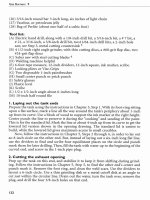
The subsoil consisted of 35 ft granular soils, 58 ft of clayey soils, and 10 ft of
silty gravel from a depth of 140 to 151 ft, as shown in the typical log in Figure 12.5.
Free water was at depth of 101 ft. Figure 12.5 also indicates the change of moisture
content of the subsoil in the past 3 years.
The upper dense granular soils compressed a small amount upon wetting and
the lower fine granular soil had a collapse potential. If general wetting occurred,
such as from poor surface drainage, settlement would generally be small, but con-
tinue for a long time. In contrast, the result of a point wetting source settlement,
such as a water line break, will be large and sudden.
Driving criteria for the underpinning was to an ultimate bearing capacity of
60 tons, a factor of safety of two, and 100 tons allowed for negative skin friction.
Negative skin friction value was based on an adhesion value of 1.0 ksf for the
granular soil, 0.4 ksf for the clay, and a wetting depth of 70 ft.
About 1 year after the underpinning of the northwest corner was completed,
excessive pile settlement again took place. Investigation by opening of test pits
revealed that the underpinned pile had moved down at least 12 in. The soil adjacent
to the pile was very wet. The source of wetting was from the overflow of water from
the plant.
©2000 CRC Press LLC
It was concluded that the wetting caused compression of the fine-grained layer
that, in turn, caused the weight of all the soil and adjacent concrete pavement above
to be carried by the piles. This increased load exceeded the bearing capacity of the
one pile.
The pile failure and subsequent load test showed that negative skin friction is a
significant force and can be easily underestimated. With the second underpinning
complete, the performance of the building has been satisfactory.
12.6 PILE LOAD TESTS
The most reliable method of determining pile capacity is a load test. Pile load tests
are made to determine the ultimate failure of a single pile or sometimes a group of
FIGURE 12.5 Log of test hole and moisture comparison at failure pile.
©2000 CRC Press LLC
piles. Load tests are made to determine if the pile is capable of supporting a load
without excessive or continuous settlement.
The bearing capacity of all piles except those driven to rock does not reach the
ultimate value until a period of adjustment. For piles in permeable soil, this period
is 2 or 3 days. For piles driven in silt or clay, the adjustment period can be more
than a month.
Normally, pile designs are initially based on estimated loads and subsoil. Pile
load tests are performed during the design stage to check the design capacity. Should
load test results indicate possible bearing capacity overestimation or excessive set-
tlement, the pile design must be revised accordingly. Needless to say, load tests are
costly and time consuming. Such tests are justified only for major projects or in
problem soil areas.
The pile may be loaded by means of a hydraulic jack or by adding weight to a
platform built on top of the pile, as shown in Figure 12.6. Sand, pig iron, concrete
blocks, or water can be used for weight on the platform.
Two test procedures are used in conducting the load test: the Slow Maintained
Load Test Method, and the Constant Rate of Penetration Test Method.
12.6.1 SLOW MAINTAINED LOAD METHOD (SML)
The SML test is presently the most widely used procedure for determining the load-
carrying capacity of a single pile. In the test, the load is applied in increments. Under
each increment, the settlement of the head of the pile is observed as a function of
time until the rate of settlement becomes very small. A new increment is then added.
The results of typical SML load tests are shown in Figure 12.7, where the total load
is plotted as a function of the settlement of the pile head. This procedure is recom-
mended when estimates of settlements are required for working loads. The results
are less reliable when ultimate loads are being determined.
Curve a represents a pile that plunged suddenly when the load reached a definite
value termed “the ultimate pile load” or “pile capacity.” Curves b and c show no
well-defined breaks. The determination of the ultimate pile load is a matter of
interpretation by the geotechnical engineer.
12.6.2 CONSTANT RATE OF PENETRATION METHOD (CRP)
The cost of a load test on piles depends greatly on the duration required to complete
the test. This is especially important when the job is delayed while the results are
pending. The duration of a load test can be shortened substantially by using the
constant rate of penetration method.
In this method, the pile is forced into the ground using the hydraulic jack at a
constant rate of 0.75 mm/min in clay soil and 1.5 mm/min in sands and gravels.
The load is measured either by using a calibrated jack or by a load cell or proving
ring. The load is increased until maintaining the specific rate of penetration requires
no further increase in load. The corresponding total load is considered the ultimate
bearing capacity.
FIGURE 12.6 Pile loading test (a) kentledge only; (b) jacking against kentledge; (c) jack against tension piles (after Whitlow).
©2000 CRC Press LLC