Báo cáo y học: " Full genome re-sequencing reveals a novel circadian clock mutation in Arabidopsis" doc
Bạn đang xem bản rút gọn của tài liệu. Xem và tải ngay bản đầy đủ của tài liệu tại đây (723.18 KB, 12 trang )
METH O D Open Access
Full genome re-sequencing reveals a novel
circadian clock mutation in Arabidopsis
Kevin Ashelford
1†
, Maria E Eriksson
2†
, Christopher M Allen
3
, Rosalinda D’Amore
1
, Mikael Johansson
2
, Peter Gould
1
,
Suzanne Kay
1
, Andrew J Millar
4
, Neil Hall
1*
and Anthony Hall
1*
Abstract
Map based cloning in Arabidopsis thaliana can be a difficult and time-consuming process, specifically if the
phenotype is subtle and scoring labour intensive. Here, we have re-sequenced the 120-Mb genome of a novel
Arabidopsis clock mutant early bird (ebi-1) in Wassilewskija (Ws-2). We demonstrate the utility of sequencing a
backcrossed line in limiting the number of SNPs considered. We identify a SNP in the gene AtNFXL-2 as the likely
cause of the ebi-1 phenotype.
Background
Arabidopsis has a sequenced reference genome of
120 Mb from the Columbia (Col-0) accessio n [1]. It has
been used extensively as a model organism to under-
stand plant development, physiology, and metabolism
(reviewed in [2]). Much of our understanding of these
processes has come through the isolation and molecular
characterization of chemically induced mutations in
gene s involved in these processes. Until recently, identi-
fying the mutated gene required the tedious process of
map-based cloning.
Map-based cloning in Arabidopsis involves out-
crossing the mutant plant with a divergent Arabidopsis
accession, usually Col-0 or Landsberg erecta (Ler). In the
F
2
generat ion, the mutant phenotype is scored and mole-
cular markers are then used to rough ma p the gene.
Finally, plants with intra-chromosomal recombination
events are used to narrow down the genetic interval [3].
The processes can be complicated by natural variation in
the phenotype being mapped between the two parental
lines used to produce a mapping population [4]. Also,
recombination frequency has been shown to vary across
the genome [5,6] with low recombination frequencies
hindering fine mapping. Finally, the whole mapping pro-
cesses can be difficult if the mutant phenotype is subtle
and if assaying the phenotype is labor intensive.
The circadian clock is an endogenous 24-h timer
found in most eukaryotes and photosynthetic bacteria.
In plants, the clock plays a key role driving rhythms in
physiology, biochemistry and metabolism [7]. In Arabi-
dopsis, our current model of the clock is a series of
inter-locking feedback loops [8]. Identification of many
of the clock and clock-associated components has
come through genetic screens, using the CHLORO-
PHYLL A/B-BINDING PROTEIN2 (CAB2)promoter
fused to the LUCIFERASE (LUC)reportergeneto
assay clock function [9]. Through this approach
mutants with long, short or arrhythmic circadian phe-
notypes have been identified and cloned using map-
based approaches [10-12]. However, the phenotypic
scoring of clock mutants is time consuming and nat-
ural variation in the clock phenotypes between Arabi-
dopsis accessions can further slow down the mapping
process.
An al ternative to map-based c loning would be to
directly sequence the whole genome of a mutant to
uncover the mutation, potentially a SNP, that is responsi-
ble for the phenotype. Re-sequencing arrays do exist for
Arabidopsis, although their high error rate of approxi-
mately 50% makes them unreliable for identifying single
SNPs [13]. Direct re-sequencing has already been suc-
cessfully used to ident ify point mutations in the 15.4-Mb
genome of the yeast Pichia stipitis [14] and in Caenor-
habditis elegans [15]. Whole genome re-sequencing
approaches like that of Sarin et al. [15] are of limited use
if, like in Arabidopsis, the ethyl methanesulfonate (EMS)
mutation load is high. Therefore, a method of reducing
* Correspondence: ;
† Contributed equally
1
School of Biological Sciences, University of Liverpool, Crown Street,
Liverpool L69 7ZB, UK
Full list of author information is available at the end of the article
Ashelford et al. Genome Biology 2011, 12:R28
/>© 2011 Ashelford et al.; licensee BioMed Central Ltd. Th is is an open access article distributed under the te rms of the Creative
Commons Attribution License ( .0), which permi ts unrestricted use, distribution, and
reproduction in any medium, provided the original work is properly cited.
the number of point mutations must be considered. On e
such method [16,17] has combined bulk segregation ana-
lysis with genome re-sequencing, thus generating both
sequence and allelic frequency data. While this approach
is again usef ul and extr emely powe rful, it relie s on the
ability to accurately score mutants in an F
2
mapping
cross and has all the limitations we have discussed with
regards to map-based cloning.
Here, we re-sequence the 120-Mb genome of a novel
Arabidopsis clock mutant early bird (ebi-1)andthecor-
responding wild type, Wassilewskija (Ws-2), using
Applied Biosystems SOLiD, sequencing by li gation tech-
nology.Wereducethenumberofpointmutationsby
sequencing a backcrossed line. We further narrow down
the SNPs by investigating gene expression data for
mutated genes. Finally, we use the new SNP data to
exclude a known clock gene and identify a SNP in the
gene AtNFXL-2 as the likely cause of the ebi-1
phenotype.
Results
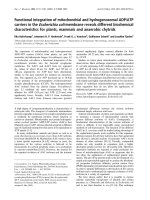
The isolation of the circadian clock mutant early bird-1
The ebi-1 mutant was identified in a screen for mutants
with altered temporal expression of CAB2 from an
EMS-mutagenized population. The M
2
population was
generated from the Ws-2 accession of Arabidopsis car-
rying the CAB2:LUC+ reporter construct (transgenic
line 6A, Nottingham Arabidopsis Stock Centre (NASC)
ID N9352). The screen involved growing plants in 12-h
light/12-h dark cycles before screening LUC activity
over 36 h in constant darkness [18]. The ebi-1 mutant
was isolated as a plant with a 1.5- to 2-h early peak
phase of CAB2 expression in constant dark (Figure 1a).
To clarify whether the early phase was the result of
altered circadian clock function in the ebi-1 mutant, we
analyzed CAB2 expression under constant red light.
Under these conditions CAB2 expression in the ebi-1
mutant oscillated with short period (wild type ( WT),
23.3 h, standard error (SE) 0.06, n = 53; ebi-1,22.4h,
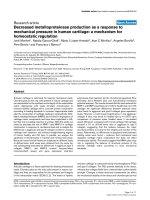
Figure 1 ebi-1 causes the circadian clock to oscillate with a short period. (a,b) Transgenic seedlings carrying the LUC reporter gene fused
to the CAB2 promoter were entrained under 12-h light/12-h dark cycles for 7 days, after which luminescence was monitored in either constant
darkness (a) or constant red light (measured in counts/second, CPS) (b): WT, open squares; ebi-1, closed squares. The plots are representative of
multiple experiments and are an average of between 24 and 79 individual seedlings; error bars are standard error of the mean. The inset in (b) is
a mathematical analysis of the experiment represented in (b): period estimates for individual seedlings plotted against their relative amplitude
errors (R.A.E.). (c) Representative leaf movement plots for WT (open squares) and ebi-1 (closed squares).
Ashelford et al. Genome Biology 2011, 12:R28
/>Page 2 of 12
SE 0.05, n = 79; Figure 1b), consistent with the early
phase of CAB2 expression in the dark. To further
investigate the phenotype, we assayed circadian
rhythms of leaf movement under constant white light
(Figure 1c). Similarly, the leaves in the ebi-1 mutant
oscillated with a shorter period than the WT (WT,
24.6 h, SE 0.11, n = 12; ebi-1, 23.5 h, SE 0.05, n = 11).
Although the phenotype is subtle, it is comparable to
the 1-h period difference observed for the cc a1-11 and
lhy-21 mutants [19]. Our data are supportive of the
ebi-1 mutant perturbing multiple clock outputs.
Furthermore, the ebi-1 mutation appears to affect
equally the clock output in darkness (as manifested by
an early phase) and light, suggesting it has a light-inde-
pendent effect, and its primary defect may therefore
not be in the light signaling pathway. Collectively,
these results suggest that ebi-1 plays a role in the cen-
tral circadian system of Arabidopsis.
To positional clone ebi-1, we too k a standard
approach, out crossing ebi-1 with Col-0, then re-
isolating ebi-1 mutants in the F
2
mapping population.
This process w as very difficult for two reasons: firstly,
because of the subtle phenotype of the mutant and the
stochastic variation in clock timing from one individual
to another, the mutan t and WT clock phenotypes over-
lapped (Figure 1b, inset); secondly, there is more plasti-
city in clock function in Col-0 compared to the mutated
background Ws-2 (Additi onal file 1). Therefo re, in
parallel to the mapping, we sequenced the genomes of
Ws-2 and ebi-1 in an attempt to identify candidate
polymorphisms.
Sequencing the genomes of WS-2 and ebi-1
The ebi-1 mutant was backcrossed four times with the
original parent lin e (Ws-2 CAB2:LUC+ 6A, used to gen-
erate the EMS population) to remove EMS-induced
SNPs not associated with t he phenotype. Whole geno-
mic DNA was isolated from the original parent Ws-2
CAB2:LUC+ 6A and the backcrossed ebi-1 mutant.
In total, 8 Gbp (ebi-1) and 8.5 Gbp (Ws-2, N9352) of
raw color-space sequence data were generated for this
study using the ABI SOLiD (version 2) sequencing
machine. The number of uniquely mapping tags avail-
able for SNP calling after mapping to the Col-0 refer-
ence genome is summarized in Additional file 2 and
varied between 26.7 and 39.5% of the total depending
on genome and schema used. Also depending on the
schema used, an average of 12.9% of the genome failed
to have any tags mapping to it, which likely resulted
from a combination of coverage, insertions, deletions
and hyper-v ariable regi ons between Ws-2 and Col-0. In
this project we focused exclusively on SNPs because
insertion and deletion are not associated with EMS
mutagenesis.
SNP counts before and after filtering are summarized
in Additional file 3. Filtering criteria were determined
empirically; working o n the assumption that all loci for
both mutant and WT should be homozygous, any SNP
repo rted as heterozygous was considered, apriori,tobe
low confidence (an assumption confirmed by the fact
that the majority occurred within obvious repeat-rich
regions of the reference genome). The assumption was
based on the fact that we knew that the SNP responsible
for the phenotype would be homozygous. On this basis,
selection criteria were identified that minimize the
numbers of heterozygous SNPs, whilst maximizing the
number of homozygous, and thus potentially high-
confidence, SNPs. Output from the corona_lite SNP-
discovery pipeline (Life Technologies, Foster city, CA,
USA) provided several parameters for assessing the
quality of SNP calls. We found that two parameters in
particular, coverage and SNP score, when applied simul-
taneously to both genomes, were most effective at elimi-
nating false positive SNPs.
By ignoring loci below a threshold coverage d epth on
either of the genomes being compared, we could elimi-
nate many low-confidence SNPs. It was important to
consider loci with sufficiently high coverage for two rea-
sons: to adequately distinguish real SNPs from the ubi-
quitous low background of false positives generated
through systematic error; and to ensure loci on both
genomes were sufficiently covered to allow for SNP call-
ing (a SNP shared by ebi-1 and Ws-2 could be mistaken
for a SNP unique to one or oth er of these genomes if
coverage in one or the other was too low).
Secondly, we found that the SOLiD SNP score pro-
vided a robust means of filtering out low-confidence
SNPs. The higher the score the greater the confidence
in the SNP, the score being weighted to t ake into
account the location of the SNP within the read. Thus,
SNP calls relying on more error-prone bases towards
the distal end of reads were scored lower than those
supported by base calls at the proximal end. The
method is schematically illustrated in Figure 2.
To this end, based on an analysis of the data, only
those SNPs reported where coverage exceeded 5× in
both ebi-1 and Ws-2 and with a SOLiD score of 0.7 or
greater were considered. We found that these cutoff
values applied equally to all five of the matching sche-
mas used.
Nevertheless, even after application of this filtering
regime, examination of the remaining SNPs revealed
that an unacceptably high number of low-confidence
SNP calls were being reported regardless of matching
schema employed (Additional file 3); interestingly, these
were not the same low-confid ence SNPs for each of the
different schemas. Investigation revealed that the reason
for this was that the different schema varied in their
Ashelford et al. Genome Biology 2011, 12:R28
/>Page 3 of 12
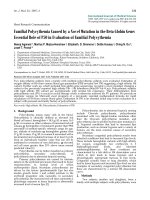
1. For each genome (Ebi-1, Ws-2):
1.1. Prepare genome DNA sample.
1.2. Generation of 35 bp color-space tags.
1.3. For each schema (25_2, 25_3, 35_2, 35_3, 35_4):
1.3.1. Map color-space tags to Col-0 reference
(Corona_lite match pipeline).
1.3.2. Call putative SNPs (Corona_lite snp detection
pipeline).
List of unfiltered SNPs, between genome and Col-0, for
specific schema.
2. For each chromosome (chr1, chr2, chr3, chr4, chr5, chrM, chrC);
2.1. For each schema (chr1, chr2, chr3, chr4, chr5, chrM, chrC):
2.1.1. Cross-reference Ebi-1 SNPs with that of Ws,
identifying SNPs relative to Col-0 that are:
(a) shared by both Ebi-1 and Ws-2,
(b) present in Ebi-1 only.
2.1.2. Filter out SNP loci that, in either Ebi-1 or Ws-2:
- are heterozygous,
- have coverage greater than or equal to 5,
- have SNP score less than 0.7.
2.2. Identify SNPs reported by all 5 schemas for current
chromosome.
List of higher-confidence SNPs relative to Col-0 that are:
(a) shared by both Ebi-1 and Ws-2,
(b) present in Ebi-1 only,
for current schema and current chromosome.
List of high-confidence SNPs relative to Col-0 that are:
(a) shared by Ebi-1 and Ws-2 (Table 1),
(b) present in Ebi-1 only (Table 2),
for current chromosome.
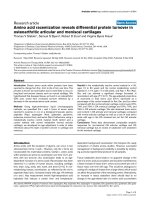
Figure 2 Schematic representation of the analysis pathway used in this study. In this two step process, (1) a list of putative SNPs, relative
to Col-0, were generated for each genome (ebi-1 and Ws-2) for each of the five possible matching schemas (25_2, 25_3, 35_2, 35_3, and 35_4)
used by the Corona_lite software pipeline. Then (2), considering each chromosome (chr1, chr2, chr3, chr4, chr5, mitochondrial chromosome
(chrM), and chloroplast (chrC)) in turn, the results of each schema were analyzed and filtered, and finally merged to form a collection of high-
confidence SNPS used in the subsequent analysis (summarized in Tables 1 and 2).
Ashelford et al. Genome Biology 2011, 12:R28
/>Page 4 of 12
sensitivity to the various filtering strategies used. Thus,
applying our filtering regime to schemas allowing the
fewest mismatches (for example, 35_2) resulted in SNPs
predominately being discarded due to too low coverage.
Conversely, the same regime applied to higher mismatch
schemas (for example, 35_4) led to more SNPs being
eliminated due to a poor score.
The reason for this observation is clear: allowing for
fewer mismatches resulted in fewer reads successfully
mapping to the reference, leading to lower coverage
ove rall, hence mor e loci being discarded because cover-
age was too low for one or other of the genomes. Con-
versely, accommodating more mismatches led to a
higher depth of coverage, but also an increased number
of SNPs called from the more error-prone proximal end
and thus with poorer SNP scores.
We took advantage of this difference in filtering sensi-
tivity to increase our filtering stringency: thus, cross-
referencing results from al l schemas, we identified SNPs
that had high enough coverage in both genomes to be
identified by low-mismatch schema, whilst at the same
time having sufficiently high SNP scores to enable iden-
tification by the higher mismatch schema. The resulting
SNPs are summarized in Tables 1 and 2. As a very con-
servative approach, we decided to cross-reference t he
results of all five of the schemas used (25_2, 25_3, 35_3,
35_4, 35_5). Whilst undoubtedly a highly conservative
approach, with schema 25_2 in particular providing very
strict matching criteria, we found that excluding the 25-
mer schemas did not greatly increase the number of
true SNPs whilst allowing more low-confidence SNPs.
The limitation of this conservative strategy was that
11.5% of the genome had reads but failed to meet the
filtering criteria and was therefore no t interrogated for
SNPs.
The accuracy of the SNP calling was validated using
454 sequencing. A single run of a 454-FLX sequencer
(Roche) was carried out using Titanium™ chemistry on
a whole genome shotgun library of the Ws-2 strain.
This generated roughly 3× coverage of the genome (data
not shown). SNPs were called using the Newbler read
mapping software against the chromosome 5 sequence
and the results compared to the SOLiD SNP calls. The
software only called SNPs where there were data in the
forward and reverse directions and where there w ere at
least three reads. We only compared SNPs where the
Table 1 Enumeration of SNPs detected between Arabidopsis accessions Ws-2 and Col-0, according to chromosome
Intragenic SNPs
Coding sequence Non-coding sequence Total SNPs
Chromosome Synonymous Non-
synonymous
Stop
created
Stop
deleted
Unclassifiable Pseudogene Intronic Intergenic
SNPs
Apparent
a
Actual
b
Chr1 8,559 6,608 54 19 4 25 10,144 14,292 39,705 37,381
Chr2 4,091 3,394 33 10 0 10 5,125 11,661 24,324 23,134
Chr3 6,141 4,945 36 6 7 11 7,341 13,607 32,094 30,496
Chr4 4,055 3,219 17 9 37 8 4,468 7,787 19,600 18,498
Chr5 7,810 5,924 35 15 6 18 9,062 14,309 37,179 35,278
Total (%) 30,656 (20.04) 24,090 (15.76) 175 (0.11) 59 (0.04) 54 (0.03) 72 (0.05) 36,140
(23.64)
61,656
(40.32)
152,902
(100.0)
144,787
Protein coding gene locations were extracted from the latest TAIR 8 genome release, with information extracted from TIGR xml formatte d files cross-referenced
with FASTA formatted sequence files. SNPs within coding sequence (CDS) regions were classified as either synonymous (silent) or non-synonymous (amino acid
changing) mutations, or as causing the creation or deletion of stop codons. In 11 instances, across the entire genome, inconsistency in the documented CDS
locations prevented unambiguous classification of SNPs falling within these CDS regions; such SNPs are recorded under the category ‘unclassifiable’. Similarly,
SNPs falling within transcriptional units marked as pseudogenes could not be classified. All other SNPs falling within documented transcriptional units, but
outside of specified CDS regions, are marked as intronic. All SNPs located out of the documented transcriptional units are classified as intergenic.
a
Apparent
number of SNPs based on the fact that splice variation means some SNPs will be scored twice.
b
Actual number of SNPs.
Table 2 Enumeration of SNPs detected between Arabidopsis ebi-1 and Ws-2 according to chromosome
Intragenic
CDS Non-CDS Total SNPs
Synonymous Non-synonymous Stop created Intronic Intergenic Apparent Actual
Chr1 6 9 1 7 7 30 27
Chr2 0 0 0 0 0 0 0
Chr3 0 1 0 1 2 4 4
Chr4 0 2 0 1 0 3 2
Chr5 15 38 0 17 14 84 76
Total 21 50 1 26 23 121 109
CDS, coding sequence.
Ashelford et al. Genome Biology 2011, 12:R28
/>Page 5 of 12
454 phred score was ≥40 and the SNP was not adjacent
to a homo-polymer. The 454 data called 15,751 SNPs at
this threshold on chromosome 5; this low number
reflects the reduced coverage using 454 and the scoring
threshold used. Of these, 15,597 were also called using
SOLiD, indicating that our SNP calls were correctly
identifying at least 99% of the SNPs present between the
two varieties.
To further validate our scoring and ability to accu-
rately predict SNPs, we tested 17 SNPs between ebi-1
and Ws-2 on chromosome 5 and 4 SNPs on chromo-
some 1 using cleaved amplified polymorphic (CAPS)
and derived cleaved amplified polymorphic (dCAPS)
markers [20]. All 21 SNPs were validated. In addition,
we considered five borderline SNPs, which had been fil-
tered out because of low coverage either because they
were below threshold scoring or they were not identified
in all schemas. Of these borderline SNPs, four failed to
be confirmed and one was heterozygous (Additional file
4). Both the 454 and the validation using CAPS/dCAPS
markers together supported the accuracy of our SNP
detection and our scoring and threshold setting.
Variation between Ws-2 and Col-0
Using our SOLiD data we identified 144,797 SNPs
shared by Ws-2 and ebi-1 between Col-0. We also
obs erved far fewer mutations leading to protein trunca-
tion (expected 5% under neutral selection, observed
0.4%) or amino acid substitutions (expected 65% under
neutral selection, observed 44%) than predicted by
chance, supporting natural selection against these types
of mutations (Table 1). As the aim of this re-sequencing
project was to identify EMS-induced SNPs between Ws-
2 and ebi-1, we made no attempt to identify deletions or
to de novo assemble sequences that failed to align with
the reference. The number of SNPs we identified was
far lower than that reported between Burren, Eire (Bur-
0) and Col-0 (549,064) and between Tsu, Japan (Tsu-1)
and Col-0 (483,352) [21]. This is likely due to the rela-
tively close geographical proximity of Col-0 (Germany)
and Ws-2 (Ukraine) on the same land mass.
Ethyl methanesulfonate-induced SNPs in ebi-1
To identify the EMS-induced SNPs in ebi-1,wecom-
pared the sequence generated for both lines. While 144,
797 SNPs between Col-0 and Ws-2 were shared
between Ws-2 and ebi-1, 109 were unique to ebi-1
(Table 2). Based on an 8.5-Mb region of chromosome 5,
we would estimate a mutation rate of approximatel y 1
mutation per 112 kb. This is still likely to be an under-
estimate as we have not considered repetitive DNA
within this region. The figure closely matches previous
estimates from a large-scale TILLING project using a
comparable EMS dose and calculated as being 1
mutation per 170 kb [22]. We found that approximately
29.3% of mutations in genes were synonymous and
70.7% non-synonymous/nonsense, which reflects the
rate expected under neutral selection. This is consistent
with the fact that l ittle selection had been placed on the
plants other than their ability to set viable seed.
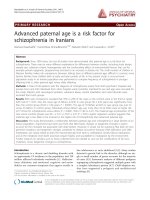
The EMS-induced SNPs were not spread evenly over
the genome but were grouped on the nor th arm of chro-
mosome 5 (76) and to a lesser extent on chromosome
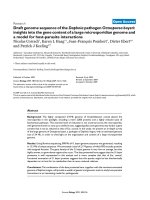
1(27)(Figure3).Thegroupings,ratherthanarandom
distribution, were the result of backcrossing ebi-1 with
the original parent. Rough mapping had placed the muta-
tion on the north arm of c hromoso me 5 and the group-
ing of EMS mutations on chromosome 5 was the result
of mutations ‘hitchhiking’ with the ebi-1 mutation during
the backcrossing processes. All mutations were consis-
tent with those expected from EMS G/C to A/T transi-
tions [22]. However, what we had expected was that
mutation types would be random, that is, equal numbers
of G to A and C to T, and this was not the case. In the
clustered group of EMS mutations on chromosome 5,
Figure 3 Location of ebi-1 SNPs relative to Ws-2. SNPs occurring
in either ebi-1 only (blue circles) or Ws only (red squares), relative to
Col-0, are plotted at their respective chromosome locations. The
overall depth of coverage of unique tags is plotted in grey.
Coverage depths of all data are determined from 35_4 schema
results.
Ashelford et al. Genome Biology 2011, 12:R28
/>Page 6 of 12
96% of the mutations were C to T transitions (Additional
file 5), whereas 100% of the mutations on chromosome 1
were G to A transitions (Additional file 6). This is prob-
ably because the plant had arisen from germ-line cells
that inherited only a single alkylated strand of DNA for
each chromosome: a daughter cell of an original mutated
cell line. Thus, mutations will have occurred in only one
direction. In plants, previous studies have looked at bias
in populations of EMS mutant plants rather than in sin-
gle plants. This is also an excellent indication of the accu-
racy with which we are identifying SNPs a nd that the
thresholds we have set a re unlikely to have identi fied
false positive SNPs.
A functional genomic approach to identifying the ebi-1
mutation
Rough mapping had already confirmed that ebi-1 was
located in the north arm of chromosome 5. Furthermore,
using the EMS mutations on chromosome 1, backcrossed
lines were identified that failed to have the EMS mutated
region on chromosome 1. These lines still displayed an
ebi-1 phenotype (Additional file 7); therefore, we focused
on the chromosome 5 SNPs, where 32 of the 76 SNPs
were non-synonymous. Based on the assumption that
most clock components are themselves rhythmically
expressed, we investigated the circadian expression pat-
tern of the 32 non-synonymous SNP-containing genes
using Diurnal [23,24]. We considered two transcriptomic
experiments where seedlings had been entrained in 12-h
light/12-h dark cycles and their gene expression then
assayed in constant light [25,26] and a third where seed-
lings had been entrained in constant light with tempera-
ture cycles with their gene expression assayed upon
transfer to constant dark [27]. We screened the temporal
expression pattern of 32 SNP-containing genes, s coring
an expression profile as rhythmic if it had a correlation
(>0.85) with an expression pattern model consistent with
circadian regulation (Additional file 8). Only one SNP-
containing gene was robustly rhythmic in all our tested
conditions, PSEUDO RESPONSE REGULATOR 7 (PRR7,
At5g02810; 0.95 correlation with a circadian time (ct) 7-h
spike and 0.93 correlation with a ct 6-h spike in the con-
stant light data sets, and a 0.87 correlation with a ct 6-h
spike in the constant dark data set. A second gene,
AtNFXL-2 (At5g05660), a zinc finger transcription factor,
was not rhythmic in constant light but had a 0.91 corre-
lation with a sine wave in constant dark and was there-
fore a strong potential candidate. Two other genes,
At5g19850, a predicted hydrolase, and At5g12470, an
organelle protein of unknown function, had good correla-
tion with a cosine wave but o nly in one set of the
constant light data. All other genes failed to show rhyth-
mic patterns of expression.
Theobviousstrongcandidatewasthenon-synon-
ymous SNP in PRR7. Sanger sequencing and a dCAPS
marker were used to validate the SNP. The gene PRR7
has already been shown to p lay a key role in the circa-
dian clock, with the T-DNA insertion mutant prr7-3
causing a lengthening of the circadian period [28], oppo-
site to the affect of ebi-1. The point mutation in PRR7
in ebi-1 caused an R to be s ubstitut ed with an H. How-
ever, the amino acid did not lie in a functional domain
and was not conserve d across species; in f act, in Bras-
sica napus, the endogenous PRR7 has an H at this posi-
tion (Additional file 9).
The other strong candidate SNP, based on the circa-
dian regulation and molecular function, was in AtNFXL-
2. The mutatio n caused a C to T transition, which was
confirmed by Sanger sequencing and a dCAPS marker.
The AtNFXL-2 protein shares homology with the mam-
malian zinc finger transcription factor NF-X1 [29]. Ara-
bidopsis has two NF-X1-like genes, AtNFXL-1
(At1g10170) and AtNFXL-2 (At5g05660) [30]. No pre-
vious study has suggested a role for the AtNFXL genes
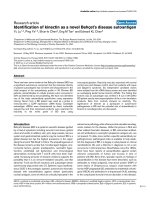
in the circadian clock. The SNP resulted in an amino
acid substitution (V to I) inthegeneAt5g05660.The
valine is relatively conserved across species and is either
valine or methionine and lies within a zinc finger motif
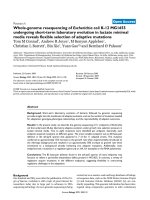
Figure 4 Alignment of the con served regions of NFXL proteins across plant taxa. The amino acids were aligned using the ClustalW
program using the following sequences: [gi: 168037431], Physcomitrella patens; [gi: 218187558], Oryza sativa; [gi: 224028969], Zea mays; [gi:
242052039], Sorghum bicolor; [gi: 56694214], Solanum lycopersicum; [gi: 145357676], Arabidopsis thalina; [gi: 297810665], Arabidopsis lyrata; [gi:
157351181], Vitis vinifera; [gi:224112501], Populus trichocarpa. Identical and similar amino acid residues are highlighted with blue and light blue,
respectively. The location of the V to I SNP within a zinc finger motif is highlighted in red.
Ashelford et al. Genome Biology 2011, 12:R28
/>Page 7 of 12
(Figure 4). However, in the Arabidopsis homolog,
AtNFXL-1, the residue is a leucine.
Validating the SNP in AtNFXL-2 as the SNP responsible for
the ebi-1 phenotype
From our functional genomics analysis two clear candi-
date SNPs remained. Based on the location of the SNP
in a conserved domain, AtNFXL-2 wa s a strong candi-
date. We used SNP markers for AtNFXL-2 and PRR7,
identified by our re-sequencing of ebi-1, to screen a
backcrossed ebi-1 F
2
population to identify recombinant
individuals. To exclude the mutation in PRR7, we identi-
fied two lines (ebi-1-clean-1 and ebi-1-clean-2) that con-
tained the AtNFXL-2 SNP but were WT for the PRR7
gene. We then identified a further two lines (prr7-
clean-1 and prr7-clean-2)thatwereWTforAtNFXL-2
but retained the PRR7 SNP. We analyzed CAB2 expres-
sion under constant red light in all the lines. Both ebi-1-
clean-1 and ebi-1-clean-2 had phenotypes identical to
the original ebi-1 mutant while prr7-clean-1 and prr7-
clean-2 had almost WT phenotypes, thus demonstrating
that the mutation in PRR7 does not contribute signifi-
cantly to t he ebi-1 phenotype (Figure 5a). Furthermore,
by combining new mapping data with SNP information,
we were able to further narrow down the candidate
SNPs to the AtNFXL-2 SNP, which lies between mole-
cular markers nga158 and CIW18, thus excluding PRR7.
Finally, a T-DNA insertion line was ordered,
SALK_128255.54.50.n, which contains a T-DNA inserted
in the promoter region of the EBI gene (ebi-2). The
insertion does not stop EBI expression but it signifi-
cantly reduces the expression level (Figure 5d). A homo-
zygous T-DNA line was transformed with the CAB2:
LUC+ reporter gene and the circadian phenotype of
transformed lines analyzed. Like ebi-1, ebi-2 had a short
period in constant light (WT, (Col-0) 26.74 h, SE 0.17,
n = 27; T-DNA line, 25.67 h, SE 0.44, n = 28; Figure
5b) and peaked early in constant dark (Figure 5c).
Discussion
For many mutants, using traditional, map-based posi-
tional cloning is an extremely difficult approach for the
Figure 5 A T-DNA allele of ebi-2 that results in a reduction in EBI expression and crossing out the PRR7 SNP result in similar clock
phenotypes to ebi-1, supporting that the circadian phenotype of ebi-1 is due to a SNP in At5g05660. Transgenic seedlings carrying the
LUC reporter gene fused to the CAB2 promoter were entrained under 12-h light/12-h dark cycles for 7 days, after which luminescence was
monitored in either constant darkness or constant red light. (a) Analysis of CAB2 activity under constant red light at 22°C in: ebi-1-clean-1, the
ebi-1 mutant with a WT PRR7 gene (closed triangles); the ebi-1 mutant (closed squares); prr7-clean-1, the prr7 mutant with WT ebi-1 (open
triangles) and WT Ws-2 (open squares). (b) Analysis of CAB2 activity under constant red light at 22°C in ebi-2 (closed squares) and WT Col-0
(open squares). (c) Analysis of CAB2 activity under constant darkness at 22°C in ebi-2 (closed squares) and WT Col-0 (open squares). (d) EBI
expression is reduced in the ebi-2 mutant. RNA expression levels of EBI relative to b-tubulin were measured at either 1 h or 13 h under 12-h
light/12-h dark cycles in both WT (white columns) and ebi-2 (gray columns).
Ashelford et al. Genome Biology 2011, 12:R28
/>Page 8 of 12
identification of the genetic basis of some phenotypes.
Here, we demonstrated the utility of massively parallel
sequencing using an ABI SOLiD sequencer to spot
EMS-induced mutations in a non-reference strain of
Arabidopsis. Using a functional genomic approach,
based on the assumption that a clock component gene
is likely to be rhythmically expressed, we were able to
further narrow down the number of candidate SNPs.
Finally,byusingtheSNPinformationwewereableto
exclude the previously identified clock gene PRR7 by
gen erat ing clean backcrossed lines, identifying a SNP in
the gene AtNFXL-2 as the likely cause of the ebi-1 phe-
notype. This was further validated by the characteriza-
tion of a second allele of ebi, ebi-2. Our approach
demonstrates the feasibility of next generation sequen-
cing as a tool for positionally cloning genes in a large
genome.
The gene responsible for the ebi-1 phenotype, AtNFXL-
2, is a zinc finger transcript ion factor, a homolog of the
human NF-X1 protein. In humans, NF-X1 binds to t he
X-box found in class II MHC genes [29]. Arabidopsis has
two NF-X1 homologs, AtNFXL-1 and AtNFXL-2,which
are thought to act antagonistically to regulate genes
involved in salt, osmotic and drought stress, with
AtNFXL-1 activating and AtNFXL-2 repressing stress-
inducing genes [30]. AtNFXL -1 has also been suggested
to be a negative regulator of defense-related genes [31]
and temperature stress [32]. Thus, the clock phenotype
of the AtNFXL-2 mutant provides an intriguing link
between the clock and biotic and abiotic stress responses.
This link has already been alluded to in a recent review
[33] and in the identification of a possible role for the
clock protein GI in cold stress tolerance [34].
Critical to the success of this project was to sequence
the original parent from which the EMS mutant was
derived. When Col-0 was recently re-sequenced using a
lab strain, 1,172 SNPs were identified between the lab
strain Col-0 and the ori ginal reference genome of Col-0.
It is clear, therefore, that sequencin g the original parent
rather than relying on a previously sequenced reference
is the correct approach. Secondly, the fact that we used
a backcrossed line reduced the number of EMS muta-
tions we had to consider from approximately 1 ,200 to
109. The large number of ‘piggy-backing’ SNPs also
provides a stark example of just how many non-
synonymous/nonsense mutations (51) are still present in
what is regarded by the community as a ‘clean’ line.
An alternative approach to the direct sequencing
method described here has been reported [16,17]. The
technique relies on accurately scoring mutant indivi-
duals in an F
2
mapping cross betwee n divergent Arabi-
dopsis accessions and then combining the se individuals
and sequencing the bulked DNA using next generation
sequencing. The output of the sequence data provides
information about the mapping position and a number
of candidate SNPs. While this approach is extremely
valuable, where the phenotype is subtle and there is a
large amount of phenotype variation between individuals
(resulting in a high number of false positives) it is unli-
kely to be useful. For the ebi-1 mutant, mapping was
only possible by re-scoring potential mutants isolated in
F
2
again in the F
3
.
Our data clearly indicate strand bias in the mutagen-
esis process, resulting in long series of C to T or G to A
transitions, rather than random mutation of either
strand as expected based on previous population-level
investigations [22]. It has been shown that transcrip-
tional activity affects repair efficiency [35], although this
is unlikely to explain the bias, as over the long stretches
of genome, both strands of the DNA are transcription-
ally active. One simple explanation is that the mutagen-
esis event o ccurs and each strand of DNA is repl icated
and segregates to separate daughter cells. This would be
sufficient to confer strand b ias and thus the long
stretches of identical transitions.
This combined approach of next generation sequen-
cing and functional genomics can be used to identify
genes previously intractable to conventional mapping
approaches . The methodology is not restricted to Arabi-
dopsis or to EMS-induced SNPs, but could be used to
positionally clone genes in any organism with a
sequenced genome. As accuracy and throughput
increases, the technique should be possible in larger
more complex genomes.
Materials and methods
Plant material
Experiments were carried out with ebi-1 that had been
backcrossed four times to the parental transgenic line
6A carrying the CAB2:LUC+ reporter construct (NASC
ID N9352).
The T-DNA line SALK_128255.54.50.n was obtained
from NASC and plants homozygous for the T-DNA
were confirmed by PCR using primers 5’-ttgccgcagta a-
caaaggtac -3’ ,5’-agtttatccggaagcaaatgg-3’ (WT band in
Col-0, no band in homozygous SALK line). The left bor-
der sequence was amplified with 5’ -agtttatcc ggaag-
caaatgg-3’ and LBb primer. CAB2:LUC+ was introduced
using Agrobacterium-mediated transformation and dip-
ping protocol [36].
Screen for circadian clock mutants
The mutagenesis and screening have b een described in
[18]. Briefly, Arabidopsis Ws-2 transgenic seeds carrying
the CAB2:LUC+ transgene (described above) were muta-
genized by soaking in 100 mM EMS for 3 h. The
Ashelford et al. Genome Biology 2011, 12:R28
/>Page 9 of 12
resulting M
1
population was sown and self-fertilized,
and the M
2
population was screened for seedlings with
altered timing of CAB2:LUC+ expression in constant
darkness.
Analysis of circadian rhythms
Seedlings were then sown on Murashige and Skoog
medium containing 3% sucrose and 1.5% agar. They
were entrained in a growth chamber in light/dark cycles
at 22°C for 7 days before transfer to constant light a nd
temperature. Two methods where used to measure
CAB2:LUC+ activity. For the initial screen and prelimin-
ary characterization of the mutant in constant dark an
automated luminometer was used (Topcount, Perkinel-
mer, Cambridge, UK)as described [37]. The second
method for the characterization of the mutant in con-
stant light and subsequent characterization of back-
crossed lines and T-DNA mutants was a low-light video
imaging system as described in [37]. The method for
measuring rhythms in leaf movement used older
12-day-old se edlings and a metho d identical to that
described in [38].
Sequencing WS-2 and ebi-1
DNA was isolated using a plant DNeasy kit (Qiagen,
Crawley, West Sussex, UK) Two read tag libraries were
prepared, one for ebi-1 and one for Ws. Emulsion PCR
using the standard SOLiD protocol was performed on
each library. The libraries were deposited onto separate
slides and sequenced in a single run using the SOLiD
analyzer version 2 (Life Technologies).
For the 454 genome sequencing, 5 μgofWs-2DNA
was fragmented by nebulization. Fragmented DNA was
analyzed using a Bioanalyzer (Agilent Technologies,
Wokingham, Berkshire, UK)to ensure that the majority
of the fragments were between 350 and 1,000 bp. The
purified fragmented DNA was processed according to
the 454 FLX Titanium Library construction kit and pro-
tocol (Roche Applied Science, Burgess Hill, East Sussex,
UK). Library fragments were added t o emulsion PCR
beads at a ratio of 1:1 to emPCR at the optimal of 1.5
DNA molecules per bead and amplified according to the
manufacturer’s instructions (Roche Applied Science) and
a full pico-titre plate was sequenced.
The resulting 35-character color-space tags from both
sequencing runs we re then mapped to the 119.7 Mbp
Col-0 reference sequence [39] using the matching pipe-
line of the off-machine SOLiD data analysis package Cor-
ona Lite [40] employing a range of matching schemas,
based on the full-length 35-character color-space tags as
well as schemas based on tags trimmed to 25 charact ers
to remove the most error-prone positions. Putative SNPs
relative to Col-0 were then called for each genome using
Corona Lite’s SNP detection pipeline.
The resulting SNP list for ebi-1 was t hen cross-refer-
encedwiththatofWs-2toidentifySNPssharedby
both genomes, as well as SNPs occurring only in ebi-1
or only in Ws-2. At this stage low-confidence SNPs
were filtered out by excluding all SNP loci where cover-
age was 5 or less, SOLiD SNP scores were less than 0.7,
or the SNP was heterozygous, in either genome. To
ensure only high-confidence SNPs were considered, a
further screening round was undertaken in which only
those reported by all matching schemas e mployed were
considered for subsequent analysis.
Using current (TAIR 8) annotations [39] as a guide,
high-confidenceSNPswereclassified and enumerated.
ThesequencedataforWs-2arearchivedatTAIRand
available as a track on the Arabidopsis genome hosted
at TAIR [SpeciesVariant:393] [41].
SNP validation
To validate the SNPs between ebi-1 and Ws-2, we used
a simple PCR-based approach of CAPS and dCAPS ana-
lysis. PCR primers for CAPS/dCAPS analysis were
designed using dCAPS finder 2.0 [42]. A standard PCR
protocol was used to amplify products from ebi-1 and
Ws-2, and t he PCR products were dig ested and run on
a 4% agarose gel and scored. The primers, restriction
sites and product sizes are summarized in Additional
file 4. The SNPs in PRR7 and EBI were furth er validated
by standard sequencing methods.
Quantification of RNA using real-time PCR
Seedlings were grown under 1 2-h light/12-h dark cycles
for 6 days. Seedlings were harvested directly into liquid
nitrogen at 1 h after d awn and 1 h after dusk using a
green safety light. The RNA was subsequently extracted
using an RNeasy Plant Mini Kit (Qiagen, Hilden,
Germany). cDNA was synthesized from 1 μgoftotal
RNA using the iScript™ cDNA synthesis kit (Bio-Rad
Laboratories, Inc., Hercules, CA, USA). Real-time PCR
was performed with a MyIQ™, ICycler or CFX96 Real-
Time PCR Detection System (Bio-Rad Laboratories,
Hempstead,Hertfordshire,UK),usingiQSYBR
®
Green
Supermix (Bio-Rad Laboratories). The efficiency of
amplification was assessed relative to b-TUBULIN
(bTUB) expression. The measurements were repeated at
least t wo times wi th independe nt biological material.
Expression levels were calculated relative to the reference
gene using a comparative threshold cycle method [43].
The results show the mean of four biological replications,
each with three technical repeats, and expressed relative
to the mean of the w ild-type series after standardization
to bTUB. Primers for bTUB have been published pre-
viously [44]. The EBI-specific primers were as follows:
EBI-F, 5’-TGC GAG AAT ATG CTT AAT TGC-3’; EBI-
R, 5’-CCA CAA CAT CAC AAG ACA AG-3’.
Ashelford et al. Genome Biology 2011, 12:R28
/>Page 10 of 12
Mapping ebi-1
An F
2
mapping population was made between ebi-1 and
Col-0. A set of approximately 20 individuals from this
population, which had their ebi-1 phenotype confirmed
in the F
3
, had recombination events in c hromosome 5
and placed the ebi-1 mutation on the north arm of
chromosome 5. This mapping population was increased
and with two individuals we were further able to limit
the mapping interval to between CIW18 and nga158.
Additional material
Additional file 1: Figure S1 - plant to plant variation in clock
function is greater in Col-0 than in Ws-2. Seedlings were entrained
under 12-h light/12-h dark cycles for 12 days, after which they were
transferred to constant light where rhythms of leaf movement were
assayed. Ws-2, filled squares; Col-0, empty squares. Period estimates for
individual seedlings are plotted against their relative amplitude errors (R.
A.E.).
Additional file 2: Table S1 - sequence tag counts available at
various stages of the analysis, as reported by the different
matching schema employed.
Additional file 3: Table S2 - SNP counts before and after filtering as
reported by the various matching schema.
a
Unfiltered SNPs were all
those reported by the Corona lite SNP detection pipeline.
b
Filtering
involved retaining only those SNP loci where tag coverage exceeded 5×
in both ebi-1 and Ws-2, the SOLiD score was 0.7 or greater, and SNPs
were homozygous. (c) ’Schema screened’ SNPs were those filtered SNPs
reported by all five schema.
Additional file 4: Table S3 - dCAPS and CAPS marker design and
use to validate SNP discovery. SNP marker denotes the chromosome
position of the SNP based on the TAIR 8 Arabidopsis genome build. In
the primer sequence the underlined base is the mismatched base in the
primer sequence. ^Borderline SNP;
a
SNP in the clock gene PRR7;
b
SNP in
At5g05660, EBI.
Additional file 5: Table S4 - EMS-induced SNPs on chromosome 5.
Additional file 6: Table S5 - EMS-induced SNPs on chromosome 1.
Additional file 7: Figure S2 - the presence or absence of EMS-
induced mutations on chromosome 1 do not affect the phenotype
of ebi-1. Transgenic seedlings carrying the LUC reporter gene fused to
the CAB2 promoter were entrained under 12-h light/12-h dark cycles for
7 days, after which luminescence was monitored in constant red light.
WT, open squares; ebi-1, closed squares; ebi-1 with no EMS-induced SNP
on chromosome 1, red triangles.
Additional file 8: Table S6 - analysis of temporal expression
patterns of non-synonymous SNPs on chromosome 5 using Diurnal
to fit temporal expression data to expression pattern models
consistent with circadian regulation.
Additional file 9: Figure S3 - identification of a SNP in PRR7. Top: A
schematic representation of the PRR7 protein in Arabidopsis ecotype
Columbia is shown in green. Gray boxes represent the two conserved
region Receiver (REC) domain and CCT motif. The amino acids were
aligned using the ClustalW program. Bottom: identical and similar amino
acid residues are highlighted with black and gray backgrounds,
respectively. The SNP leads to a change from arginine (R) to histidine (H)
at position 329. The frame shows the residue in the Pseudo Response
Regulator protein from Arabidopsis ecotype Columbia (BAB13742, PRR7),
Hordeum vulgare subsp. vulgare (AAY17586, PRR), Arabidopsis thaliana
(AAY62604, PRR3), Triticum aestivum (ABL09464, PRR), Oryza sativa Indica
(BAD38858, PRR 37), Oryza sativa Indica (BAD38859, PRR73), Lemna
paucicostata (BAE72697, PRR37), Lemna gibba (BAE72700, PRR37),
obtained from NCBI database, and Gossypium raimondii (TC272), Brassica
napus (TC71410), Brassica napus (TC78134), Gossypium raimondii
(TC82653), and Citrus clementina (TC8380) obtained from TGI databases.
Abbreviations
CAB2: Chlorophyll a/b-binding protein 2; CAPS: cleaved amplified
polymorphic sequence; dCAPS: derived cleaved amplified polymorphic
sequence; EBI: early bird mutant; EMS: ethyl methanesulfonate; LUC:
luciferase; NASC: Nottingham Arabidopsis Stock Centre; SE: standard error;
SNP: single nucleotide polymorphism; WT: wild type.
Acknowledgements
We would like to acknowledge funding from an EU Marie Curie Individual
Fellowship QLK5-CT-2000-52165, The Swedish Research Council, The Swedish
Foundation for Strategic Research, The Swedish Research Council for
Environment, Agricultural Sciences and Spatial Planning (MEE) and a Marie
Curie Early Stage Training project MEST-CT-2005-020526. MEE is a VINNMER
Marie Curie International Qualification Fellow funded by The Swedish
Governmental Agency for Innovation Systems (VINNOVA) and the European
Union. We would also like to acknowledge start-up funding from the
University of Liverpool (to NH) and the BBSRC research development
fellowship (BB/H022333/1) awarded to AH. This work was also supported by
SABR award F005237 from BBSRC and EPSRC, for the ROBuST (AH). NH is
also supported by a Wolfson Merit Award from the Royal Society of Great
Britain. We are grateful to Alistair Darby for his scientific contribution while
car sharing.
Author details
1
School of Biological Sciences, University of Liverpool, Crown Street,
Liverpool L69 7ZB, UK.
2
Department of Plant Physiology, Umea Plant Science
Centre, Umea University, SE-901 87 Umea, Sweden.
3
Applied Biosystems, 120
Birchwood Boulevard, Warrington WA3 7QH, UK.
4
Institute of Molecular Plant
Sciences, School of Biological Sciences, University of Edinburgh, Mayfield
Road, Edinburgh EH9 3JH, UK.
Authors’ contributions
The screening and characterization of the ebi mutant was conceived by AH,
MME and AJM and the SNP identification strategy by NH and AH, with AH
responsible for overall co-ordination. SK and CA performed the SOLiD
sequencing and LD performed the 454 sequencing. The characterization of
ebi and alleles was performed by MJ, PG and MEE. The SNP validation was
performed by LD. The bioinformatics was performed by KA with assistance
from AH and NH, with all sequencing and sequence analysis overseen by
NH. The paper was written by AH with assistance from NH and MEE. MEE
was responsible for distribution of plant materials integral to the findings
presented in this article and should be contacted directly. All authors read
and approved the final manuscript.
Received: 30 December 2010 Revised: 16 February 2011
Accepted: 23 March 2011 Published: 23 March 2011
References
1. Arabidopsis Genome Initiative: Analysis of the genome sequence of the
flowering plant Arabidopsis thaliana. Nature 2000, 408:796-815.
2. Somerville C, Meyerowitz E: The Arabidopsis Book Rockville, MD: American
Society of Plant Biologists; 2008.
3. Lukowitz W, Gillmor CS, Scheible WR: Positional cloning in Arabidopsis.
Why it feels good to have a genome initiative working for you. Plant
Physiol 2000, 123:795-805.
4. Alonso-Blanco C, Koornneef M: Naturally occurring variation in Arabidopsis:
an underexploited resource for plant genetics. Trends Plant Sci 2000, 5:22-29.
5. Lynn A, Koehler KE, Judis L, Chan ER, Cherry JP, Schwartz S, Seftel A,
Hunt PA, Hassold TJ: Covariation of synaptonemal complex length and
mammalian meiotic exchange rates. Science 2002, 296:2222-2225.
6. Drouaud J, Camilleri C, Bourguignon PY, Canaguier A, Berard A, Vezon D,
Giancola S, Brunel D, Colot V, Prum B, Quesneville H, Mezard C: Variation in
crossing-over rates across chromosome 4 of Arabidopsis thaliana reveals
the presence of meiotic recombination “hot spots”. Genome Res 2006,
16:106-114.
7. Harmer SL, Hogenesch JB, Straume M, Chang HS, Han B, Zhu T, Wang X,
Kreps JA, Kay SA: Orchestrated transcription of key pathways in
Arabidopsis by the circadian clock. Science 2000, 290:2110-2113.
Ashelford et al. Genome Biology 2011, 12:R28
/>Page 11 of 12
8. Locke JC, Kozma-Bognar L, Gould PD, Feher B, Kevei E, Nagy F, Turner MS,
Hall A, Millar AJ: Experimental validation of a predicted feedback loop in
the multi-oscillator clock of Arabidopsis thaliana. Mol Syst Biol 2006, 2:59.
9. Millar AJ, Short SR, Chua NH, Kay SA: A novel circadian phenotype based
on firefly luciferase expression in transgenic plants. Plant Cell 1992,
4:1075-1087.
10. Millar AJ, Carré IA, Strayer CA, Chua NH, Kay SA: Circadian clock mutants in
Arabidopsis identified by luciferase imaging. Science 1995, 267:1161-1163.
11. Somers DE, Schultz TF, Milnamow M, Kay SA: ZEITLUPE encodes a novel
clock-associated PAS protein from Arabidopsis. Cell 2000, 101:319-329.
12. Hall A, Bastow RM, Davis SJ, Hanano S, McWatters HG, Hibberd V, Doyle MR,
Sung S, Halliday KJ, Amasino RM, Millar AJ: The TIME FOR COFFEE gene
maintains the amplitude and timing of Arabidopsis circadian clocks.
Plant Cell 2003, 15:2719-2729.
13. Clark RM, Schweikert G, Toomajian C, Ossowski S, Zeller G, Shinn P,
Warthmann N, Hu TT, Fu G, Hinds DA, Chen H, Frazer KA, Huson DH,
Scholkopf B, Nordborg M, Ratsch G, Ecker JR, Weigel D: Common
sequence polymorphisms shaping genetic diversity in Arabidopsis
thaliana. Science 2007, 317:338-342.
14. Smith DR, Quinlan AR, Peckham HE, Makowsky K, Tao W, Woolf B, Shen L,
Donahue WF, Tusneem N, Stromberg MP, Stewart DA, Zhang L, Ranade SS,
Warner JB, Lee CC, Coleman BE, Zhang Z, McLaughlin SF, Malek JA,
Sorenson JM, Blanchard AP, Chapman J, Hillman D, Chen F, Rokhsar DS,
McKernan KJ, Jeffries TW, Marth GT, Richardson PM: Rapid whole-genome
mutational profiling using next-generation sequencing technologies.
Genome Res 2008, 18:1638-1642.
15. Sarin S, Prabhu S, O’Meara MM, Pe’er I, Hobert O: Caenorhabditis elegans
mutant allele identification by whole-genome sequencing. Nat Methods
2008, 5:865-867.
16. Schneeberger K, Ossowski S, Lanz C, Juul T, Petersen AH, Nielsen KL,
Jorgensen JE, Weigel D, Andersen SU: SHOREmap: simultaneous mapping
and mutation identification by deep sequencing. Nat Methods 2009,
6:550-551.
17. Cuperus JT, Montgomery TA, Fahlgren N, Burke RT, Townsend T,
Sullivan CM, Carrington JC: Identification of MIR390a precursor
processing-defective mutants in Arabidopsis by direct genome
sequencing. Proc Natl Acad Sci USA 2010, 107:466-471.
18. Kevei E, Gyula P, Hall A, Kozma-Bognar L, Kim WY, Eriksson ME, Toth R,
Hanano S, Feher B, Southern MM, Bastow RM, Viczian A, Hibberd V,
Davis SJ, Somers DE, Nagy F, Millar AJ: Forward genetic analysis of the
circadian clock separates the multiple functions of ZEITLUPE. Plant
Physiol 2006, 140
:933-945.
19. Gould PD, Locke JC, Larue C, Southern MM, Davis SJ, Hanano S, Moyle R,
Milich R, Putterill J, Millar AJ, Hall A: The molecular basis of temperature
compensation in the Arabidopsis circadian clock. Plant Cell 2006,
18:1177-1187.
20. Neff MM, Neff JD, Chory J, Pepper AE: dCAPS, a simple technique for the
genetic analysis of single nucleotide polymorphisms: experimental
applications in Arabidopsis thaliana genetics. Plant J 1998, 14:387-392.
21. Ossowski S, Schneeberger K, Clark RM, Lanz C, Warthmann N, Weigel D:
Sequencing of natural strains of Arabidopsis thaliana with short reads.
Genome Res 2008, 18:2024-2033.
22. Greene EA, Codomo CA, Taylor NE, Henikoff JG, Till BJ, Reynolds SH,
Enns LC, Burtner C, Johnson JE, Odden AR, Comai L, Henikoff S: Spectrum
of chemically induced mutations from a large-scale reverse-genetic
screen in Arabidopsis. Genetics 2003, 164:731-740.
23. Diurnal search tool. [ />24. Mockler TC, Michael TP, Priest HD, Shen R, Sullivan CM, Givan SA,
McEntee C, Kay SA, Chory J: The DIURNAL project: DIURNAL and circadian
expression profiling, model-based pattern matching, and promoter
analysis. Cold Spring Harb Symp Quant Biol 2007, 72:353-363.
25. Covington MF, Maloof JN, Straume M, Kay SA, Harmer SL: Global
transcriptome analysis reveals circadian regulation of key pathways in
plant growth and development. Genome Biol 2008, 9:R130.
26. Edwards KD, Anderson PE, Hall A, Salathia NS, Locke JC, Lynn JR,
Straume M, Smith JQ, Millar AJ: FLOWERING LOCUS C mediates natural
variation in the high-temperature response of the Arabidopsis circadian
clock. Plant Cell 2006, 18:639-650.
27. Michael TP, Mockler TC, Breton G, McEntee C, Byer A, Trout JD, Hazen SP,
Shen R, Priest HD, Sullivan CM, Givan SA, Yanovsky M, Hong F, Kay SA,
Chory J: Network discovery pipeline elucidates conserved time-of-day-
specific cis-regulatory modules. PLoS Genet 2008, 4:e14.
28. Farre EM, Harmer SL, Harmon FG, Yanovsky MJ, Kay SA: Overlapping and
distinct roles of PRR7 and PRR9 in the Arabidopsis circadian clock. Curr
Biol 2005, 15:47-54.
29. Song Z, Krishna S, Thanos D, Strominger JL, Ono SJ: A novel cysteine-rich
sequence-specific DNA-binding protein interacts with the conserved X-
box motif of the human major histocompatibility complex class II genes
via a repeated Cys-His domain and functions as a transcriptional
repressor. J Exp Med 1994, 180:1763-1774.
30. Lisso J, Altmann T, Mussig C: The AtNFXL1 gene encodes a NF-X1 type
zinc finger protein required for growth under salt stress. FEBS Lett 2006,
580:4851-4856.
31. Asano T, Yasuda M, Nakashita H, Kimura M, Yamaguchi K, Nishiuchi T: The
AtNFXL1 gene functions as a signaling component of the type A
trichothecene-dependent response. Plant Signal Behav 2008, 3:991-992.
32. Larkindale J, Vierling E: Core genome responses involved in acclimation
to high temperature. Plant Physiol 2008, 146:748-761.
33. Roden LC, Ingle RA: Lights, rhythms, infection: the role of light and the
circadian clock in determining the outcome of plant-pathogen
interactions. Plant Cell 2009, 21:2546-2552.
34. Cao S, Ye M, Jiang S: Involvement of GIGANTEA gene in the regulation of
the cold stress response in Arabidopsis. Plant Cell Rep 2005, 24:683-690.
35. Madhani HD, Bohr VA, Hanawalt PC: Differential DNA repair in
transcriptionally active and inactive proto-oncogenes: c-abl and c-mos.
Cell 1986, 45:417-423.
36. Bechtold N, Ellis J, Pelletier G: In planta Agrobacterium-mediated gene
transfer by infiltration of adult Arabidopsis thaliana plants. CR Acad Sci
1993, 316:1194-1199.
37. Southern MM, Brown PE, Hall A: Luciferases as reporter genes. Methods
Mol Biol 2006, 323:293-305.
38. Edwards KD, Millar AJ: Analysis of circadian leaf movement rhythms in
Arabidopsis thaliana. Methods Mol Biol 2007, 362:103-113.
39. TAIR build 8. [ />40. SOLiD™ System Analysis Pipeline Tool (Corona Lite). [http://
solidsoftwaretools.com/gf/project/corona/].
41. TAIR Arabidopsis Gbrowser. [ />gbrowse/arabidopsis/].
42. Neff MM, Turk E, Kalishman M: Web-based primer design for single
nucleotide polymorphism analysis. Trends Genet 2002, 18:613-615.
43. Livak KJ, Schmittgen TD: Analysis of relative gene expression data using
real-time quantitative PCR and the 2(T)(-Delta Delta C) method. Methods
2001, 25:402-408.
44. Czechowski T, Bari RP, Stitt M, Scheible WR, Udvardi MK: Real-time RT-PCR
profiling of over 1400 Arabidopsis transcription factors: unprecedented
sensitivity reveals novel root- and shoot-specific genes. Plant J 2004,
38
:366-379.
doi:10.1186/gb-2011-12-3-r28
Cite this article as: Ashelford et al.: Full genome re-sequencing reveals a
novel circadian clock mutation in Arabidopsis. Genome Biology 2011 12:
R28.
Submit your next manuscript to BioMed Central
and take full advantage of:
• Convenient online submission
• Thorough peer review
• No space constraints or color figure charges
• Immediate publication on acceptance
• Inclusion in PubMed, CAS, Scopus and Google Scholar
• Research which is freely available for redistribution
Submit your manuscript at
www.biomedcentral.com/submit
Ashelford et al. Genome Biology 2011, 12:R28
/>Page 12 of 12