Báo cáo y học: " High recombination rates and hotspots in a Plasmodium falciparum genetic cross" docx
Bạn đang xem bản rút gọn của tài liệu. Xem và tải ngay bản đầy đủ của tài liệu tại đây (2.43 MB, 15 trang )
High recombination rates and hotspots in a
Plasmodium falciparum genetic cross
Jiang et al.
Jiang et al. Genome Biology 2011, 12:R33
(4 April 2011)
RESEARCH Open Access
High recombination rates and hotspots in a
Plasmodium falciparum genetic cross
Hongying Jiang
1
,NaLi
2
, Vivek Gopalan
3
, Martine M Zilversmit
4
, Sudhir Varma
3
, Vijayaraj Nagarajan
3
, Jian Li
1,5
,
Jianbing Mu
1
, Karen Hayton
1
, Bruce Henschen
1
, Ming Yi
6
, Robert Stephens
6
, Gilean McVean
7
, Philip Awadalla
8
,
Thomas E Wellems
1
and Xin-zhuan Su
1*
Abstract
Background: The human malaria parasite Plasmodium falciparum survives pressures from the host immune system
and antimalarial drugs by modifying its genome. Gen etic recombination and nucleotide substitution are the two
major mechanisms that the parasite employs to generate genome diversity. A better understanding of these
mechanisms may provide important information for studying parasite evolution, immune evasion and drug
resistance.
Results: Here, we used a high-density tiling array to estimate the genetic recombination rate among 32 progeny
of a P. falciparum genetic cross (7G8 × GB4). We detected 638 recombination events and constructed a high-
resolution genetic map. Comparing genetic and physical maps, we obtained an overall recombination rate of 9.6
kb per centimorgan and identified 54 candidate recombination hotspots. Similar to centromeres in other
organisms, the sequences of P. falciparum centromeres are found in chromosome regions largely devoid of
recombination activity. Motifs enriched in hotspots were also identified, including a 12-bp G/C-rich motif with 3-bp
periodicity that may interact with a protein containing 11 predicted zinc finger arrays.
Conclusions: These results show that the P. falciparum genome has a high recombination rate, although it also
follows the overall rule of meiosis in eukaryotes with an average of approximately one crossover per chromosome
per meiosis. GC -rich repetitive motifs identified in the hotspot sequences may play a role in the high
recombination rate observed. The lack of recombination activity in centromeric regions is consistent with the
observations of reduced recombination near the centromeres of other organisms.
Background
The human malaria parasite Plasmodium falciparum
kills approximately one million people each year, mostly
children in Africa [1]. The goal of developing an effec-
tive vaccine to control infection or disease has yet t o be
met. Parasite resistance to multiple antimalarial drugs
has also spread rapidly in recent years. Genome plasti-
city and genetic variation are significant challenges to
vaccine development and contribute to the w orldwide
problem of drug resistance.
The P. falciparum malaria parasite has a unique and
complex life cycle involving multiple DNA replications
both in the mosquito and in human hosts. Except for a
brief diploid phase after mating events in the mosquito
midgut, the parasite stages in both hosts are haploid.
Human infection commences with the injection of spor-
ozoite stages by the bite of an infectious mosquito; asex-
ual sporozoites then travel to the liver where they
produce tens of thousands of merozoites after multiple
rounds of DNA replica tion. The mature merozoites are
released from the hepatocytes and invade red blood
cells. Within red blood cel ls, individual merozoites will
replicate their DNA 4 to 5 times within 48 hours and
release 16 to 32 daughter merozoites back into the
blood stream to infect other red blood cells. This ery-
throcytic cycle is responsible for the clinical manifesta-
tions of malar ia and can continue unti l the in fection is
eliminated by the host immune response or cleared by
antimalarial drug treatment. While the erythrocytic
* Correspondence:
1
Laboratory of Malaria and Vector Research, National Institute of Allergy and
Infectious Diseases, National Institutes of Health, 9000 Rockville Pike,
Bethesda, MD 20892, USA
Full list of author information is available at the end of the article
Jiang et al. Genome Biology 2011, 12:R33
/>© 2011 Jiang et al.; licensee BioMed Central Ltd. This is an open access article distributed under the terms of the Creative Commons
Attribution License ( which permits unrestricted use, distribution, and reproduction in
any medium, provided the original work is properly cited.
cycle produces millions of haploid asexual parasites, a
small proportion of the parasites differentiates into male
and female sexual stages - termed gametocytes - that
circulate in the bloodstream. When the gametocytes are
taken up by a feeding mosquito during a blood meal,
they develop into male and female gametes, mate, and
form a diploid zygote that develops into an ookinete;
genetic recombination and meiosis occur at this time
[2]. The motile ookinete subsequently develops into an
oocyst containing thousands of sporozoites after rounds
of mitotic divisions. Completion of the life cycle there-
fore offers many opportunities for genetic recombination
and mutation events during numerous rounds of DNA
replication.
Genetic recombination can generate novel beneficial
alleles, or combinations of alleles, that can spread
through the population driven by positive selection
[3,4]. In P. falciparum, recombination rates (RRs) vary
not only among parasite populations but also along
parasite chromosomes, which exhibit regions of elevated
or reduced recombination [5,6]. Many factors can influ-
ence estimates of RR (or more precisely outcrossing
rate), including the intensity of transmission by mosqui-
toes, diversity o f local parasite populations, the number
of genetic markers used in the analysis, and chromoso-
mal locations of specific DNA sequences [7]. Some of
these factors may he lp explain the different estimates of
recombination rates obtained from two genetic crosses
[8,9].
To better understand themechanismofgenetic
recombination that underlies P. falciparum evolution
and its response to host immunity and drug pressure,
we have used a high-density tiling microarray to inves ti-
gate the genotypes of progeny obtained from a P. falci-
parum cross (7G8 × GB4) [9]. Here we show that the
P. falciparum parasite has a relatively high RR and iden-
tify putative recombination hotspots with conserved
motifs that may mediate frequent recombination in the
parasite. The high RR may provide the genetic basis for
the parasite to rapidly adapt to a hostile environment
and to evade host immunity and drug action.
Results
Single feature polymorphism detection and genotype
verification
Applying the single-feature polymorphism (SFP) calling
parameters described previously [10], we identified 5,672
putative SFPs that differed between the GB4 and 3D7
parasites, 11,892 putative SFPs that differed between
7G8 and 3D7, and 9,030 putative SFPs (approximately
0.5% of total unique probes) that were the same
between GB4 and 7G8 but differed from 3D7. After
accounting for the redundancy of probes within 25 bp
that detect the same polymorphisms, and excluding
single probe calls as well as ambiguous calls from subte-
lomeric repetitive sequences and multigene famili es, we
obtained 4,335 multiprobe SFPs (mSFPs) distinguishing
the 7G8 from GB4 parasites. Potential errors in geno-
type calls were corrected using the procedures described
in Materials and methods, leading to 3,184 high-quality
mSFPs (Table 1). Interestingly, there were approximately
twiceasmanyuniqueprobesdistinguishingthe3D7
parasite from 7G8 than from GB 4, suggesting a larger
genetic distance between 7G8 and 3D7 than between
GB4 and 3D7 (Table 1). In addition to mSFPs, we also
detected copy number variations between the GB4 and
7G8 parasites. We detected and mapped 295 differential
segments that were at least 500 bp long (0.5 to 21.015
kb) to 340 genes/regions, although the majority ( >90%)
of the signals for the copy number variations were from
regions containing highly polymorphic antigen gene
families (Additional file 1).
Although we applied strict standards in calling mSFPs,
there were still regions with double crossovers within
relatively small segments that were likely due to geno-
type calling errors or possible gene conversions (Addi-
tional file 2); some of the errors became apparent only
after multiple consecutive mSFPs were examined simul-
taneously. To ensure correct genotype calls, we imple-
mented computational correction protocols (see
Materials and methods) and compared the inherited
mSFP genotypes with 8,097 genotypes from 254 micro-
satellite (MS) markers (32 progeny × 254 MS markers =
8,128 minus 31 missing da ta points) [9]. Results id enti-
fied only 31 mismatches, defined as one or two adjacent
MS markers flanked by mSFP genotypes of different
alleles, between the MS and mSFP genotypes (Addi-
tional file 3). These mismatches were from 19 MSs and
were mostly single MS genotypes flanked by multiple
mSFP genotyp es of different alleles , suggesting potential
errors from MS typing or spontaneous changes in the
MS repeats. The high percentage of genotype match
between MS and SFP genotypes (8,066/8,097 or 99.6%)
provided good confidence on the data s upporting the
final SFP genotype calls. Although the MSs provided
relatively good coverage across the genome, there were
large segments on chromosomes 1, 2, 3, 7, 8, 9, 10, and
11 that did not have MS coverag e (Additional files 2
and 3). Our mSFPs therefore greatly improve the cover-
age of genetic markers across the 14 chromosomes.
To further verify the genotype calls and clarify the
mismatches, we re-typed the 19 MSs that produced 31
mismatches betw een MSs and mSFPs. The typi ng
results corrected 26 MS genotyping error s (Additional
file 3), bringing the correct genotype match rate to
99.9%. We also randomly selected 14 regions of approxi-
mately 100 kb or less with two to four mSFPs that pre-
dicted putative double crossovers in 21 progeny and
Jiang et al. Genome Biology 2011, 12:R33
/>Page 2 of 14
single crossovers in five progeny. We designed 35 PCR
primer pairs to detect MS polym orphisms informative
for these single and double crossover segments (Addi-
tional file 3). Of the 34 primer pairs, 27 were poly-
morphic between the parents. For the five single
crossover events, the crossovers were all verified to be
correct after typing the progeny; however, only one of
theputativedoublecrossoversinthe21progenycould
be verified, suggesting that the majority of the putative
double crossovers predicted by two to four mSFP mar-
kers and not removed by o ur filtering processes were
false. The two markers flanking the only correctly iden-
tified double crossover DNA segment spanned 81 kb
with six SFP markers inside the crossover segment. For
the remaining 20 double crossovers, 18 had flanking
markers spanning less than 60 kb, except two that had
flanking markers spanning 85 and 108 kb, respectively
(Additional file 3). A search of the entire genome identi-
fied 176 putative double crossover segments within
≤60 kb (Additional files 3 and 4). Based on this informa-
tion, we corrected the genotypes of the 176 putative
double crossover segments flagged by flanking markers
spanning ≤60 kb and containing fewer than five mSFPs
in the segment.
Crossover counts and bias inheritance
From the filtered inherited genotypes of the progeny
(after correction for spurious double crossovers), w e
identified 638 crossovers (Table 2). Plots of genotype
inheritance patterns for each of the 14 chromosomes
showed relatively even (1:1) genotype inheritance from
each parent, except for a few chromosomal regions that
favored genotypes from one parent (Figure 1). As pre-
viously noted, one example of inheritance bias was the
dominant inheritance of the 7G8 haplotype among the
progenyatoneendofchromosome7[9](Figure1).
Other regions that had a bias toward the 7G8 genotypes
were found in parts of chromosomes 6 , 8, and 13; and
regions that favored GB4 genotypes could be found on
chromosomes3,5,7,and11.Inheritancebiaswasalso
found in subtelomeric regions on chromosomes 2, 3, 4,
5, 6, 8, 9, and 11. Except for the bias at the ends of
chromosome 3, 6, and 7, t he bias inheritances did not
significantly deviate from the 1:1 ratio (Bonferroni cor-
rected P < 0.01; Figure 1). Plots of crossover events
across the physical chromosomes re vealed regions with
clusters of recombination events, many of which located
at subtelomeric regions, suggesting potential recombina-
tion hotspots (Figure 1). Interestingly, the putative cen-
tromeres [11] were mostly located in chromosome
regions without cro ssovers or recombination coldspots
(Figure 1; Additional file 3), consistent with the observa-
tions for the centromeres of plants, yeast and other
organisms [12-14]. Significant bias inheritance was pre-
viously found in the Dd2 × HB3 cross [8]; and the cen-
tromeres are mostly located in regions with little or no
recombination activity in this cross too (Additional files
5 and 6). Similar to the previous observation of a strong
positive correlation between crossover counts and physi-
cal chromosome length among the progeny of the Dd2
×HB3cross[8],therewasalsoapositivecorrelation
between crossover counts and physical chromosome
Table 1 Microarray probes and genotype calls from GB4 and 7G8 comparing with those of 3D7
Chr. Total 0_0 1_1 0_1 1_0 Diff SFP Diff mSFP % Diff 7G8/GB4 Corrected mSFP Number of MS
1 30,929 30,430 116 118 265 383 101 1.2 2.2 79 12
2 53,535 52,460 388 155 532 687 191 1.3 3.4 150 14
3 67,398 66,136 433 320 509 829 234 1.2 1.6 179 16
4 61,039 59,470 544 395 630 1,025 280 1.7 1.6 217 19
5 90,671 89,336 431 328 576 904 244 1.0 1.8 194 17
6 85,948 84,711 420 259 558 817 227 1.0 2.2 169 17
7 84,732 83,082 442 424 784 1,208 329 1.4 1.8 249 13
8 86,613 85,119 543 289 662 951 255 1.1 2.3 215 11
9 99,923 98,407 460 298 758 1,056 289 1.1 2.5 227 19
10 189,885 187,180 811 491 1,403 1,894 386 1.0 2.9 274 17
11 224,234 221,693 948 600 993 1,593 385 0.7 1.7 195 20
12 208,959 206,503 993 464 999 1,463 342 0.7 2.2 228 25
13 343,063 338,735 1,487 918 1,923 2,841 547 0.8 2.1 384 21
14 231,652 228,725 1,014 613 1,300 1,913 525 0.8 2.1 424 33
Total 1,858,581 1,831,987 9,030 5,672 11,892 17,564 4,335 1.1 2.2 3,184 254
Chr., chromosome; Total, total numbers of probes on each chromosome; 0_0, numbers of probes calling the same alleles as those of 3D7; 1_1, numbers of
probes calling alleles different from 3D7 in both GB4 and 7G8; 0_1, numbers of probes calling GB4 unique alleles; 1_0, numbers of probes calling 7G8 unique
alleles; Diff SFP, numbers of differential probes from both1_0 and 0_1; Diff mSFP, multiple-probe SFPs collapsed within 25 bp and excluded calls from
subtelomeric regions and those in multigene families; % Diff, percentage of Diff SFP probes divided by the total number of probes; 7G8/GB4, the ratio of unique
7G8 probes over those of GB4; Corrected mSFP, numbers of mSFPs after removing false calls (see Materials and methods for details); Number of MS, number of
microsatellites used in this study.
Jiang et al. Genome Biology 2011, 12:R33
/>Page 3 of 14
length in the progeny of the 7G8 × GB4 cross (correla-
tion coefficient r = 0.85 after removing subtelomeric
regions; Additional file 7). However, the crossover
counts per mega base in a meiosis appear to be lower in
the larger chromosomes (Additional file 8).
Construction of a high-resolution linkage map
We next constructed high-resolution genetic linkage
maps of the 14 chromosomes with 3,184 mSFPs and 254
MSs using the H aldane map function and compared the
linkage maps with physical positions of the markers on
the chromosomes. Genetic distances between the mar-
kers and map units were calculated, and the physical
positions of the markers on the chromosomes were iden-
tified (Figure 2; Additional file 3). Because only 21.8 Mb
of the 23 Mb P. falciparum genome was covered by our
mSFPs, a total genetic distance of approximately 2,514.0
cM produced an average map unit of approximately 9.6
kb/cM (or 0.10 cM/kb), which is approximately 1.5 to 3.5
times smaller than the previous estimates [8,9 ]. We also
estimated the genetic distances using the Kosambi map
function and compar ed the results with those from the
Haldane map function. The resulting maps (2,490 cM
Kosambi; 2,514 cM Haldane) were nearly identical, sug-
gesting little or no recombination interference at gen-
ome-wide scale. Plots of coefficient coincidence (Z) [15]
suggested weak crossover interference in some chromo-
somes. However, the power to detect meiotic crossover
interference was limited due to the small number of
meiosis/progeny (Additional file 9).
Notably,chromosomes2,3,4,8,and9showedrela-
tively high average RR, whereas the three largest
chromosomes (12 to 14) showed lower recombination
rates (Table 2 and Figure 2); however, the high RR in
the five chromosomes included activity of potential
recombination hotspots at chromosome ends (Figure 2).
Removing the hotspots at the ends of t hese chromo-
somes greatly reduced th e estimates of genetic distances
for the chromosomes and increased the map unit to
12.8 kb/cM (Table 2; Additional file 10), which is
slightly less than the previous estimate of 15 kb/cM
from the Dd2 × HB3 cross [8].
Detection of recombination hotspots
We applied an overlapping sliding window of 5 kb to
scan through the markers on each chromosome for
potential hotspots among the 32 progeny and used Hal-
dane map function to estimate RR and confidence inter-
vals. We compared each sliding window’sRRwiththe
averaged RR estimates across all 14 chromosomes (0.13
cM/kb). A region was considered a recombination hot-
spot if there were two or more recombination events
across the 32 progeny and the estimated RRs were more
than five-fold higher than the average genome-wide RR.
These analyses identified 54 segments c ontaining puta-
tive recombination hotspots in sequences of 298 bp to
100.4 kb l ong, including 11 hotspots from subtelomere
sequences (Figure 3; Additional file 11). All hotspots
contained low-complexity regions with tandem repeats
(except for one) according to the classification at Plas-
moDB [16] and most of them (except for two) were
within protein coding regions (Additional file 11). Some
of the hotspot sequences contained genes encoding sur-
face antigens, protein kinases, and AP2 transcription
Table 2 Estimates of genetic distance and recombination frequency for each chromosome
Chr. Length (kb) Marker span (kb) Number of markers Number of crossovers Gene distance (cM) kb/cM
1 643.3 486.5 91 14/11* 45.4/35.8* 10.7/11.8*
2 947.1 876.3 164 29/14 134.6/46.6 6.5/17.3
3 1,060.1 1,056.7 195 67/37 371.0/121.3 2.8/7.2
4 1,204.1 1101 236 43/28 200.1/91.8 5.5/11.3
5 1,343.6 1,268.1 211 38/29 129.7/94.8 9.8/12.9
6 1,418.2 1215 186 35/35 126.6/126.6 9.6/9.6
7 1,501.7 1,301.7 262 39/38 132.7/129.5 9.8/10.1
8 1,419.6 1,411.3 226 58/25 234.8/82.6 6.0/15.3
9 1,541.7 1,467.7 246 56/40 269.5/131.9 5.5/10.5
10 1,687.7 1,526.1 291 54/46 171.1/160.5 8.4/9.6
11 2,038.3 2,000.8 215 48/37 174.1/122.3 11.5/15.2
12 2,271.5 2,093.8 253 34/34 111.2/111.2 18.8/18.8
13 2,895.6 2,757.5 405 65/65 213.6/213.6 12.9/12.9
14 3,291.9 3,201.9 457 58/57 189.6/186.3 16.9/16.8
Total 23,264.3 21,764.4 3,438 638/496 2,514.0/1,654.7 9.6/12.8
Chr., chromosome; Leng th (kb), chromosome length in kilobases; Marker span (kb), the distance between the first and last markers for each chromosome;
Number of markers, total numbers of markers, including microsatellites; Number of crossovers, number of crossovers including subtelomeric regions (values
marked with an asterisk are excluding subtelomeric regions); Gene distance (cM), genetic distance in centimorgans; kb/cM, kilobase per centimorgan obtained
from the ratio between gene tic distance and marker span.
Jiang et al. Genome Biology 2011, 12:R33
/>Page 4 of 14
factor (Additional file 11). Indeed, genes with Gene
Ontology terms of antigenic variation, defense response,
and cell-to-cell interactions were significantly enriched
(P < 0.01) in the hotspot sequences (Additional file 12).
Approximately 20% of the hotspots were located at
chromosome ends or subtelomeric regions defined pre-
viously [17] (Figure 3), consistent with those inferred
from SNP studies on field isolates [5].
For comparison, we also mapped the 720 MS markers
(excluding those that could not be mapped due to the
absence of primer sequences in the current 3D7 genome
sequence or had positions conflicting with the physical
genome positions) typed on 35 progeny of the Dd2 ×
HB3 cross to the completed 3D7 chromosomes [8] and
applied the same criteria to estimate RR and to detect
recombination hotspots (Additional file 6). We obtained
an estimate of RR of 12.1 kb/cM if we arranged all the
MSs according to their positions on physical chromo-
somes and identified 17 hotspots (Figure 3; Additional
file 11). All of the hotspots but one are nonsubtelomeric
because MS markers generally do not cover subtelo-
meric regions. Only one hotspot region on chromosome
11 (1,707,326 to 1,743,250 bp) from the Dd2 × HB3
cross overlapped with those from the 7G8 × GB4 cross
(1,707,250 to 1,717,037 bp).
DNA sequences coding for protein low-complexity
regions (pLCRs) have also been associated with elevated
recombination [18,19]. These high-GC content minisa-
tellite pLCRs are found throughout the P. falciparum
genome [19]. We examined the nonsubtelomeric
chr 1 chr 2
chr 3
chr 4
chr 5 chr 6
chr 7
chr 8
0 2 4 6 8 10 12 14 16
0.0 0.2 0.4 0.6 0.8 1.0
0 0.5 0.5 0 0.5 1 0.5 1 0.5 1 0 0.5 1 0 0.5 1 1.5 0.5 1
chr 9 chr 10 chr 11 chr 12 chr 13 chr 14
0 2 4 6 8 10121416
0.0 0.2 0.4 0.6 0.8 1.0
01010120.51.50120123
Crossover counts
Crossover counts
Frequency of 7G8 allele
Frequency of 7G8 allele
Probe position on chromosome (Mb)
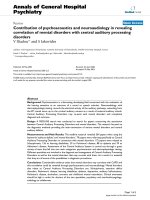
Figure 1 Recombination events and 7G8 allele frequen cy along each of the 14 P. falciparum chromosomes. Each panel represents one
chromosome as marked (chr). Recombination events (black vertical lines) are the number of changes in inheritance pattern (parental allelic type)
between two adjacent markers among 32 progeny, and 7G8 allele frequency is the proportion of 7G8 alleles among the 7G8 × GB4 progeny
(red curves). The arrowheads under each panel indicate the positions of putative centromeres for the 14 chromosomes according to [11]. The
dashed horizontal lines delimit the significant inheritance bias from 1:1 segregation.
Jiang et al. Genome Biology 2011, 12:R33
/>Page 5 of 14
hotspots for recombinogenic pLCRs. We found 427
regions; however, only one hotspot contained one of
these high-GC pLCR regions (found on chromosome 9,
in gene PFI0685w, annotated as a putative pseudouridy-
late synthase).
Motifs enriched in recombination hotspots
Repetitive DNA sequences such as minisatellites have
been associated with recombination hotspots and gen-
ome instability in humans [7]. To search for motifs
associat ed with P. falciparum recombination, we ana-
lyzed DNA sequences within the hotspot sequences
using the MEME motif discovery toolkit [ 20]. We
searched for enriched motifs in nonsubtelomeirc and
subtelomeric hotspot sequences smaller than 15 kb from
the two cro sses and identified three GC-rich motifs that
were enriched in the hotspot sequences (Figure 4;
Additional file 13), including one 21-bp motif (TA[TA]
GTTAGT[CG]AAG[TG]TAAGACC) (Figure 4a) from
subtelomeric hotspots that is similar to the Rep20
sequence implicated in recombination activity of chro-
mosome subtelomeric regions [21-23]. Another enriched
motif from subtelomeric hotspots was a 12-bp GC-rich
sequence containing GCA[TC][CA][TG]AG[GT]TGC
(Figure 4b). A 12-bp G-rich (or C-rich on reverse
strand) motif ([TG]GA[TA]GAAG[AG][TG]GA) was
also identified from the nonsubtelomeric hotspot
sequences (Figure 4c). The Rep20 related motif was pre-
sentinthemajority(64%)ofthesubtelomerichotspots
(almost none in nonsubtelomeric hotspots) and was sig-
nificantly enriched (P = 0.014) compared to matched
coldspot sequences (Additional file 13). The 12-bp sub-
telomeric motif is present in approximately 80% of hot-
spots and trends to higher frequency in hotspots relative
0 500 1000 1500 2000 2500 3000
0 100 200 300 400 500
1234567891011121314
Physical distance (kb)
Genetic distance (cM)
Chromosome
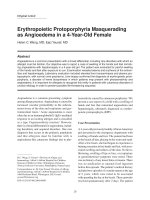
Figure 2 Physical and genetic maps of the 14 P. falciparum chromosomes in the 7G8 × GB4 cross. The vertical red scale lines on the left
indicate genetic distance in centimorgans, and the blue vertical lines on the right are the physical distance in kilobases. Thin grey lines connect
the genetic position of each marker (3,184 mSFP and 254 microsatellite markers) with their mapped physical positions on the chromosome.
Please see Additional file 3 for detailed information. Note the elevated recombination activities at chromosome ends, particularly those at ends
of chromosomes 2, 3, 4, 8, and 9, which increase the estimate of genome-wide recombination rate. Maps after removing subtelomeric markers
are shown in Additional file 10. The arrowheads on the right side of the blue vertical lines indicate the positions of putative centromeres for the
14 chromosomes according to [11].
Jiang et al. Genome Biology 2011, 12:R33
/>Page 6 of 14
to coldspots (P = 0.055) and to the genome average (P =
0.077) (Additional file 13). The 12-bp G/C-rich nonsub-
telomeric motif cont ained a 3-bp repeat that might be
the binding site of DNA binding proteins and was pre-
sent in approximately 30% of nonsubtelomeric hotspots,
a frequency significantly higher than those in matched
coldspot sequences (P = 0.002) and in the genome aver-
age (P = 6.0E-6).
Since only 3 2 independent recombinant progeny w ere
available for this study, a single crossover may represent a
region with elevated recombination activity. We therefore
searched all the crossover sites defined by marker intervals
less than 5 kb, including 10 sequences from subtelomeric
regions and 103 sequences from nonsubtelomeric regions.
A 12-bp G-rich motif was detected in three of the ten sub-
telomeric sequences (Figure 4d); and a 12-bp motif with 3-
bp G periodicity detected in the nonsubtelomeric regions
was essentially the same as the one observed in the non-
subt elomeric hotspots (Figure 4e ). Both motifs were pre-
sent at significantly higher frequency (P < 0.05) than that
of the genome average, although the 12-bp nonsubtelo-
meric motif did not have significantly higher frequency
than those in coldspot controls.
Sequences with AT repeats or A/T tracks were found
in almost all the hotspot sequences (data not shown). A
search of DNA sequences in the hotspots using the oops
(one-occurrence-per-sequence) function in the MEME
program for motifs that occur once in each hotspot
sequence identified polyA, polyT, and (TA)
n
repeats
(data not shown); however, the frequencies of these AT
repeats or A/T tracks in the hotspot sequences were not
significantly different from those in the genome or
matched coldspot sequences (Additional file 13).
Discussion
We used a high-density tiling array and the parents and
progeny from a genetic cross to investigate genetic RR
and recombination hotspots in the P. falciparum malaria
parasite. Our results show that P. falciparum has a
higher RR than previously reported [8,9]. In a recent
study, the RR of the 7G8 × GB4 cross was estimated to
be approximately 36 kb/cM using genotypes from a lim-
ited set of 285 MS markers [9]; in another study, the RR
of the Dd2 × HB3 cross (35 progeny) was estimated to
be 17 kb/cM (14.8 kb/cM if using the correcte d 23 Mb
genome size) [8]. A similar estimate (13.7 kb/cM) was
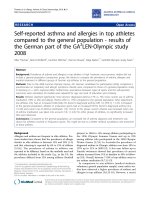
Figure 3 Plot of recombination rate of the 7G8 × GB4 cross
showing recombination hotspots along each of the 14 P.
falciparum chromosomes. A region was considered a
recombination hotspot (asterisks) if there were two or more
recombination events across the 32 progeny and the estimated
recombination rates were higher than the chromosome-wide
average rate by five-fold or more. The 14 chromosomes are as
marked and separated with the vertical dashed lines. The black
asterisks are hotspots from the 7G8 × GB4 cross, and the red
asterisks indicate hotspot positions from the Dd2 × HB3 cross. The
arrowheads under each panel indicate the positions of putative
centromeres for the 14 chromosomes according to [11].
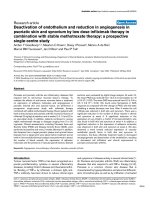
Figure 4 Motifs enriched in recombination hotspot sequences.
Motifs were identified from hotspot sequences using anr (any
number of repetitions) in MEME. (a) A 21-bp motif from
subtelomeric hotspot sequences of the 7G8 × GB4 cross that is
similar to that of the Rep20 repeat reported previously [21-23]. (b) A
GC-rich 12-bp repeat from subtelomeric hotspot sequences of the
7G8 × GB4 cross. (c) A 12-bp G/C-rich motif from the non-
subtelomeric combined hotspot sequences of both crosses. (d,e)
Two 12-bp G/C-rich motifs from subtelomeric and nonsubtelomeric
sequences with at least one crossover within 5-kb interval,
respectively, from the 7G8 × GB4 cross.
Jiang et al. Genome Biology 2011, 12:R33
/>Page 7 of 14
obtained from 28 independent progeny of a rodent
malaria parasite (Plasmodium c. chabaudi)crossthat
were typed with 614 amplified fragment-length poly-
morphisms [24]. Our higher RR estimate is largely due
to the inclusion of the highly recombinogenic subtelo-
meric sequences. If we remove the crossover counts
from the subtelo meric regions, the estimated RR in the
7G8 × GB4 cross is 12.8 kb/cM (Table 2). This estimate
is essentially the same as the one est imated from the
Dd2 × HB3 cross (12.1 kb/cM) using the same methods
employed in this study. The estimated RR of P. falci-
parum is comparable to that of Cryptosporidium par-
vum (10 to 56 kb/cM) [25], but is much higher than the
estimated RR of Toxopla sma gondii (104 kb/cM) [26],
rat (1.8 Mb/cM), mouse (1.9 Mb/cM), or human (0.8
Mb/cM) [27].
Aft er data proces sing and experimental verification of
genotypes, our SFP genotypes matched well (99.95%)
with those from 254 MSs. Comparison of our SFP geno-
types with 8,097 MS genotypes showed that the number
of mismatched genotypes between the two data sets was
small (four mismatches or 0.05%). In theory, these four
mismatches in ge notypes between MS and mSFPs could
be due to genotype calling errors from either the tiling
array or MS typing. The mismatches could also be true
differences in genotype as the mSFPs and MSs were
located at slightly different positions on the chromo-
somes. We recognize that our strict genotype calling
processes may have excluded some gene conversio n and
ectopic recombination events, which are common
between the paralogous loci of gene families [28]. High
RR and recombination hotspots on chromosome 3 have
also been observed in field populations, and no detect-
able linkage disequilibrium was detected between mar-
kers less than 1 kb apart in some African populations
[5,29,30].
Variou s DNA sequences have been found to influence
genetic recombination or to be associated with hotspots,
including GC-r ich DNA [31,32], repetitive minisatell ites
or MSs [33-36], and transcription factor binding sites
[34]. In particular, a 13-mer C -rich degenerate motif
(CCNCCNTNNCCNC) with a 3-bp periodicity sugges-
tive of an interaction with zinc-finger DNA-binding pro-
teins has been found to mediate recombination in
human [32]. Additionally, imprinted chromoso me
regions generally have higher than average recombina-
tion rates [37], and the relative activity of hotspots is
also regulated by various factors that can directly or
indirectly interact with these sequences [38]. In human
and mouse, a protein (PRDM9) with a Krüppel asso-
ciated box (KRAB), a hist one methyl transfer ase domain
(SET) and multiple zinc fingers was found to bi nd the
C-rich 13-bp motif in hotspots and target the histone
methylation activity to specific sites in t he genome
[39-41]. The hotspot sequences we identified are also
relativ ely GC-rich, cover coding regions, and carry repe-
titive sequences (Additional file 11). We searched for
motifs that might be associated with recombination hot-
spots in P. falciparum. Several relati vely GC-rich motifs
were identified, including a 21-bp motif that is similar
to the Rep20 repeat that has been implicated in genetic
recombination. The R ep20 family is among a number of
gene families in subtelomeric regions that may have a
role in antigenic variation [21-23,28]. A s expected, the
21-bp motif was mostly from repetitive regions of subte-
lomeric hotspots. Although the 13-bp GC-rich motif
identified in the human genome by Myers et al. [7] was
not found in our hotspots, we detected a 12-bp motif
that is relatively G-rich from the P. falciparum genome
(C-rich from th e opposite strand). Significantly, the 12-
bp nonsubtelomeric G/C-rich motif and the Rep20
motif share a common feature with a 3- to 4-bp G peri-
odicity that suggests a potential for interactio n with
zinc-finger DNA-binding proteins, similar to those of
the 13-bp motif seen in the human genome [39-41]. A
keyword search of the P. falciparum genome database
[16] using ‘zinc finger’ found more than 200 zinc finger
proteins in the P. falciparum genome, and a Blast search
of the database using human PRDM9 identified a pro-
tein (PFL0465c) with 11 predicted zinc fingers (Addi-
tional file 14). PFL0465c has some conserved amino
acids at the putative regions homologous to the K RAB
and SET domains of PRDM9, but whether these regions
have the expected activities remains unkn own because
the levels of homology are low. Interestingly, Genome-
Net motif search [42] also identified a pu tative eukaryo-
tic DNA topoisomerase I DNA binding domain in
PFL0465c (Additional file 14). Prediction of DNA bind-
ing of the protein using an online tool [43, 44] showed
significant P-values (P = 0.01 to 0.04, using polynomial
kernels and 40% A, 40% T, 10% G and 10% C) for bind-
ing to the motifs in Figure 4, although the SVM (sup-
port vector machine) scores were all negative. Because
the low predicted specificity o f some zinc fingers and
multiple combinatio ns may contrib ute to DNA recogni-
tion [39], whether the zinc fingers in PFL0465c can bind
the DNA motifs we identified requires further in vestiga-
tion. Since the non-coding regions of the P. falciparum
genome are very AT-rich, it is not surprising to see that
all the hotspot sequences, which are usually GC-rich,
are found in the GC-rich coding regions.
Similarly, AT-rich repeats were found in almost all the
hotspot sequences. Monomeric A/T tracks have been
associated with break points on chromosome 5 of P. fal-
ciparum [45], and many MSs, particularly poly-purine/
poly-pyrimidin e, have been associated with r ecombin a-
tion hotspots in the Saccharomyces cerevisiae genome
[35]. However, t he frequencies of the AT-rich repeats in
Jiang et al. Genome Biology 2011, 12:R33
/>Page 8 of 14
our hotspots were not sign ificantly higher than the gen-
ome average; the presence of these AT-rich motifs in
hotspots could be simply due to the abundance of the
AT-rich repeats in the parasite genome. The functional
roles of these motifs in genetic variation requir e further
investigation.
It is interesting that the three l argest chromosomes
have low RRs. Higher RRs for smaller chromosomes -
termed chromosome size-dependent control of meiotic
reciprocal recombination - has been reported in
humans, Saccharomyces cerevisiae,andotherorganisms
[27,46]. This chromosome size-dependent recombina-
tion was thought to be important for ensuring homolo-
gous chromosome crossover during meiosis and to be
caused by different amounts of crossover interference
between the chromosomes [47]; however, a recent study
suggested that differences in RR in budding yeast were a
function of their DNA sequence, and not due to the size
of the chromosome [48]. Although our smaller number
of progeny has low power to detect crossover interfer-
ence, evidence of interference, particularly in the large
chromosomes, was detected. The observation of rela-
tively high RR in some smaller chromosomes also
appeared to be largely due to recombination hotspots at
the chromosome ends. Higher RR in smaller c hromo-
somes was also observed in parasites collected from new
Cambodian patients [6] and in the human genome [49].
Centromeres are characterized by high AT content
and with little or no genetic recombination [12,13]. Eto-
poside-mediated topoisomerase-II cleavage was recently
employed to identify centromere locations in P. falci-
parum [11]. Comparison of these locations with maps of
the chromosome crossover sites shows that all of the
centromeres are located in regions with little or no
recombination activity (Figure 1; Additional file 3). The
results are consistent with the observations of reduced
recombination at centromere regions in other organ-
isms, supporting the i dentity and locati ons of the P. fal-
ciparum centromeres. Some crossovers were found at
the centromeres in the Dd2 × HB3 cross (Additional file
6), which can be partly explained by the lower density
of genetic markers in this cross.
Biased inheritance patterns were observed on some
chromosomes, in particular, chromosomes 7, 8, 11, and
13 (Figure 1). Most of the progeny inherited the 7G8
allele at one end of chromosome 7. This observation
suggests that inheritance of the 7G8 alleles in this
region may provide a compet itive advantage during pro-
pagation in either the mosquito, chimpanzee (the pri-
mate host used to passage the recombinant progeny
through the liver cycle), or in tissue culture. Biased
inheritance has also been observed in the Dd2 × HB3
cross [8], but the reasons for the inheritance b ias are
still unknown.
We did not find evidence that pLCR-mediated recom-
bination is a driver of hotspot structure in the genetic
cross. These pLCR recombinogenic regions typically are
high-GC content minisatellit e repeats found in protein-
coding regions. Although these regions are rec ombino-
genic when they occur in proteins [19], they are not sig-
nificantly enriched in the hotspots found in our genetic
cross, suggesting that recombination mediated by these
regions is not a major driver in the mechanism of
recombination.
Conclusions
We have constructed a high-resolution linkage map for
a P. falciparum crosswith3,184mSFPsand254MSs,
providing a density of one genetic marker every approxi-
mately 6.3 kb or every 0.7 cM, greatly improving the
power to fine-map loci in genetic mapping studies. This
study also represents the first investigation of recombi-
nat ion hotspots using progeny from genetic crosses and
the identification of motifs potentially associated wi th
high recombination rate in malaria parasites. Interest-
ingly, the 12-bp motif identified in our study has a 3-bp
periodicity also found in the motif mediating recombi-
nation in the human genome. Lack of recombination
activity at the putative centromere sites is consistent
with the characteristics of centromeres in other organ-
isms. The high-resolution genetic map, the estimates of
RR, and the conserved motifs detected in the hotspot
sequences will greatly facilitate investigation of mechan-
isms of genetic recombination and the role of genetic
recombination in parasite diversity and survival.
Materials and methods
Parasites and parasite culture
Thirty-two P. falciparum independent recombinant pro-
geny from the 7G8 × GB4 cross and the two parental
lines have been previously described [9]. Parasites were
maintained in RPMI 1640 medium containing 5% human
O
+
erythrocytes (5% hematocrit), 0.5% Albumax (GIBCO,
Life Technologies, Grand Island, NY, USA), 24 mM
sodium bicarbonate, and 10 μg/ml gentamicin at 37°C
under an atmosphere of 5% CO
2
,5%O
2
, and 90% N
2
.
Microarray Genechip
®
, DNA hybridization, and data
normalization
The PFSANGER Genechip
®
was purchased from Affy-
metrix,Inc.(SantaClara,CA,USA),andarrayhybridi-
zation was performed at the microarray facility of the
National Cancer Institute (Frederick, MD, USA). The
probes on the array w ere designed based on P. falci-
parum genome (3D7) sequence v2.1.1 covering genomic
regions where unique probes with a reasonably broad
thermal range could be designed. Because of recent
updates of genome databases, all probe sequences were
Jiang et al. Genome Biology 2011, 12:R33
/>Page 9 of 14
reassigned to new coordinates along each chromosome
according to the 3 D7 genome sequence in PlasmoDB
v6.0. DNA extraction, labeling, micro array hybridization,
data collection, and normalization have been described
[10]. Hybridized chips were washed and stained follow-
ing the EukGE-WS2v5 protocol from Affymetrix and
scanned at 570 nm emission wavelength using Affyme-
trix scanner 3000. The scanned image CEL files were
processed using the R/Bioconductor package and the
robust multichip analysis method [50]. The programs
retrieved individual probe hybridization signal, sub-
tracted the background noise, quantile-normalized sig-
nals across all chips, and log
2
transformed the data into
a final data matrix. The raw and normalized data
obtained for this publication have been deposited in
NCBI’s Gene Expression Omnibus and are accessible
through GEO Series accession number [GEO:GSE25656]
[51].
Single feature polymorphism and parental genotype
assignment
SFP calls were recorded and validated using an in-house
perl script as described and validated previously [10].
An SFP was defined as reduction in signal intensity
three-fold or greater than that from the reference 3D7
genome regardless of the nu mbers or typ es of subst itu-
tions covered by a probe. A probe was assigned to be an
SFP (’1’ ) if the signal reduction was at least three-fold
(conservative to reduce false positive) that of 3D7 and
no SFP (’0’) was called if the signal fold change was less
than 3.0. For each progeny, there were generally four
different possible genotypes: both 7G8 and GB4 are the
same as 3D7, designated as ‘0_0’; both 7G8 and GB4 are
the same but different from 3D7 (’1_1’); 7G8 is different
from 3D7 and GB4 is not (’1_0’ ); and GB4 is different
from 3D7, and 7G8 is not (’0_1’). From these SFP calls,
we selected probes that have differential SFP calls
between the two parents (that is, one parent was ‘1’ and
the other one was ‘ 0’), then signals from the probes of
each progeny were individually assigned based on com-
parisons to the signals from the t wo parents. Because
single-probe calls were shown to be error prone [10], an
SFP was called only if at least two continuous probes
indicated a pol ymo rphism. To avoid calls from overlap-
ping redundant probes, we collapsed all probes over-
lapped within 25 bp into one SFP (mSFP) [10].
Assignment of parental genotype calls
A quick scan of the genotype inheritance revealed many
double crossovers within small DNA segments that were
likely genotype calling errors in the progeny, particularly
when the same double crossovers occurred in multiple
progeny (vertical lines in Additional file 2). A ssuming a
recombination rate of 1% (1 cM) per 10 kb
(approximately the average spacing of the mSFP mar-
kers) and no genetic interference, the probability of hav-
ing two crossovers in two consecutive marker interv als
is about 1%. However, almo st 50% of the crossovers are
adjacent to each other in the uncorrected genotypes,
which suggested that most of these double-crossovers
areerrorsbecauseitisunlikelythatmultipleprogeny
have the same crossov ers within a sm all segment of the
chromosome. For instance, the probability for one pro-
geny to have two crossovers with six markers (approxi-
mately 50 kb) is about 5%. For another progeny to have
crossovers at the exact two intervals is 0.01 × 0.01 =
0.01%. Therefore, the probability of two progeny having
the same two crossovers at the same two intervals
within 6 markers is 0.05 × 0.01 × 0.01 = 5 × 10
-6
.To
reduce excessive variability due to potential genotype
calling errors, we applied the following steps to filter
out the double crossovers within short distances (poten-
tial genotype calling errors). We first combined our
mSFP calls with the genotypes from 254 MS markers
ordered by physical positions [9] and imputed 31 miss-
ing MS genotypes using the nearest mSFP markers. We
then searched for single mSFP markers of one parental
genotype that were flanked by two markers of the other
parental genotype, that is, 1-0-1 or 0-1-0, and removed
themiddlemarkersinthelikelihoodthattheywere
erroneous. We used an iterative process to identify dou-
ble crossovers with single mSFP markers across the
chromosomes, starting with those having the largest
numbers of progeny with the same switching pattern
and corrected the single mSFP genotypes. Genotypes
from MS markers were not corrected. We also corrected
double crossovers with two alternative genotypes in
between (0-1-1-0) if there were two or more progeny
that had the same double crossovers. Although double
crossovers with two a lternative genotypes may occur by
chance, the likelihood of more than one progeny having
the same pattern is very low (<5.0E-6). Again, if the MS
markers also indicated a double crossover, no correc-
tions were made.
After the computational cleanups, we designed 35
pairs of PCR primers to experimentally validate 14 dou-
ble crossovers in 21 progeny a nd 5 single crossover
events (Additional file 3). Based on the results from the
experimental data, we manually c orrected false double
crossovers by two criteria: potentially erroneous double
crossover calls reported from DNA segments smaller
than 60 kb containing central markers with different
genotypes from flanking markers; and the DNA segment
has fewer than five mSFPs with genotypes different from
those flanking the segment. We also re-typed the 31
MSs that had mismatches with our mSFP genotypes.
PCR products were separated in a QIAexcel machine,
and MS genotypes (sizes in base pairs) were scored. The
Jiang et al. Genome Biology 2011, 12:R33
/>Page 10 of 14
final genotype calls and the in heritance of each marker
were displayed in Excel spread sheets (Additional file 3).
Estimating RR and construction of a high-resolution
genetic map
We used the Haldane map function to estimate genetic
distance and calculated RR over a 5-kb window:
r =
1
2
1 − e
−2λd
(1)
where, 0 ≤ r ≤ 0.5, is the recombination fraction (the
fraction of recombinant offspring showing a crossover
between two adjacent markers), d is the physical distance
(in kilobases), and l is the genetic dist ance (Morgan) per
unit distance (kb). For more than one marker interval, if
we assume l is constant, the likelihood function is:
L =
k
i
=1
r
x
i
i
(1 − r
i
)
n−x
i
(2)
where x
i
is the number of recombinants with regard
to marker interval i and n is the total number of pro-
geny; k is the total number of marker intervals; and r
i
is
the recombination frac tion at marker interval i.Substi-
tute in Equation 1, we have:
L =
k
i
=1
1 − e
−2λd
i
x
i
1+e
−2λd
i
n−x
i
(3)
The maximum likelihood estimator of l can be
numerically derived by maximizing the log-likelihood
function using the Newton-Raphson algorithm:
l =logL =
k
i
=1
x
i
log
1 − e
−2λd
i
+(n − x
i
)log
1+e
−2λd
i
(4)
where d
i
, is the physical distance at marker interval i.
To estimate the map distance using Kosambi map
function, Equation 1 was replaced with:
r =
1
2
tanh(2λd
)
(5)
where tanh is the hyperbolic tangent function and:
tanh(x)=
e
2
x
− 1
e
2x
+1
(6)
Coefficient of coincidence (Z) as a function of inter-
crossover distance in megabases was estimated using the
methods described [15].
Identification of recombination hotspots
We used overlapping 5-kb sliding windows to scan
through the markers on each chromosome for recombi-
nation hotspots. For each scanning window, we selected
all the markers if there were two or more markers
within the window. For example, if the distance between
marker 1 and 4 was less than 5 kb but the distance
between 1 and 5 was over 5 kb, we would include mar-
kers 1 to 4 (that is, three marker intervals) in the first
estimate of RR. In cases where the next nearest marker
was more than 5 kb away, we used the consecutive mar-
kerpair.Foreachsuchmarkerpairorawindow,we
used the methods outlined above t o estimate the RR
and confidence intervals. A set of markers was labeled
as a candidate recombination hotspot if there were two
or more recombination events among 32 progeny and
the estima ted RR wa s at least five times higher than the
genome-wide average. Because the windows are overlap-
ping, the selected marker intervals might also be over-
lapping. In this case, we only selected the marker
interval that had the highest lower 95% confidence limit,
which generally implied the most recombination events
in the shortest marker interval. The same criteria were
used to select recombination hotspots from 35 indepen-
dent progeny of the Dd2 × HB3 cross.
Search of conserved motifs in breakpoints and
recombination hotspots
We used MEME Suite, a motif discover y toolkit [20], to
search for common motifs in recombination hotspot
sequences. Methods of anr (any number of repetitions)
and oops (one occurrence per sequence) w ere used to
discover motifs that we re enriched in hotspot sequences
using various motif widths, including 50 bp (default)
and variable w idths from 7 bp to 100 bp. Non-AT cor e
motifs discovered were counted using FIMO (find indi-
vidual motif occurrences) using a corresponding score
matrix with a P-value cutoff of 5.0E-6 and overlapping
counts removed, and AT-repeats and A/T stretches
were counted using in-house scripts to match 100% of
the character. We counted and compared the frequen-
cies of the motifs in hotspots and the whole genome as
well as matched coldspot sequences. Coldspot sequences
were randomly selected sequences outside the hotspots
to match each hotspot wit h the same length, similar GC
contents (±2%), and chromosomal region (variable
region or not). A Poisson test and generalized est imat-
ing equations were used to determine whether any dif-
ferences in motif frequency were significant. The
hotspot sequences and mapped genes were also analyzed
for enrichment in Gene Ontology terms according to
methods described previously [10]. We also searched all
the crossover sites (breakpoints) with marker intervals
smaller than 5 kb using the same methods.
Low-complexity region-mediated recombination
Low-complexity regions were located in the 43 nonsub-
telomeric hotspot s and identified using methods
Jiang et al. Genome Biology 2011, 12:R33
/>Page 11 of 14
described by DePristo et al. [18]. A total of 427 regions
were then extracted and examined for AT content and
sequence regularity (minisatelli te, MS, or heterogeneous
repeat) as described [19].
Additional material
Additional file 1: Copy number variations (segmentation means)
between 7G8 and GB4 relative to 3D7.
Additional file 2: Inheritance patterns of markers on the P.
falciparum 14 chromosomes among the 32 progeny of the 7G8 ×
GB4 cross. For a particular chromosomal position, the progeny
(horizontal bars) inherited DNA either from 7G8 (red) or GB4 (blue).
Genotypes before (upper panels) and after (lower panels) applying filters
to remove probe calling noise and double crossover events (see
Materials and methods). Each horizontal line represents a single progeny,
and each vertical line represents a different mSFP marker. The vertical
cyan/orange lines represent microsatellite positions (cyan, GB4
genotypes; orange, 7G8 genotypes), and black vertical lines indicate
centromere positions.
Additional file 3: Genotypes, marker distances, centromere
positions, and inheritance of mSFPs and 254 MSs among 32
independent recombinant progeny from the 7G8 × GB4 cross [9].
Additional file 4: Number and size distribution of double crossovers
from the 14 chromosomes after computational filtering. Crossover
sizes are the distance in kilobases between flanking markers with
different genotypes.
Additional file 5: Recombination events and Dd2 allele frequency
along each of the 14 P. falciparum chromosomes. Each panel
represents one chromosome as marked (chr). Recombination events
(black vertical lines) were the number of changes in inheritance pattern
(parental allelic type) between two adjacent markers among 35 progeny,
and Dd2 allele frequency is the proportion of Dd2 allele among the Dd2
× HB3 progeny (red curves). The arrowheads under each panel indicate
the putative positions of centromeres for the 14 chromosomes according
to [11]. The original data were published previously [8]. The dashed
horizontal lines delimit the significant inheritance bias from 1:1
segregation.
Additional file 6: Genotypes, marker distances, centromere
positions, and inheritance of microsatellite markers among 35
progeny from the Dd2 × HB3 cross.
Additional file 7: Positive correlation between the number of
recombination events and chromosome sizes. The numbers within
circles mark the positions of the chromosomes.
Additional file 8: Plots of crossover counts per meiosis per
megabase sequence from the 14 P. falciparum chromosomes. (a)
Total crossover counts from each chromosome were divided by 32
progeny (meiosis) and its chromosome size (marker span) in megabases
and plotted. (b) Crossover counts from the right arms (right side of the
centromere) of each chromosome were divided by 32 progeny (meiosis)
and the size of the chromosome arm in megabases. (c) The same as (b)
but using the chromosome left arms.
Additional file 9: Plots of coefficient coincidence against crossover
distance in megabases for each of the 14 chromosomes. The grey
areas represent 95% confidence intervals.
Additional file 10: Physical and genetic maps of the 14 P.
falciparum chromosomes after removing recombination hotspots at
chromosome ends. The vertical scale lines (red) on the left indicate
genetic distance in centimorgans, and the one on the right (blue) is the
physical distance in kilobases. Thin grey lines connect the genetic
position of each marker with its mapped physical position on the
chromosome. The arrowheads on the right side of the blue vertical lines
indicate the putative positions of centromeres for the 14 chromosomes
according to [11].
Additional file 11: Length, recombination rate, chromosome
location, and AT content of DNA sequences in the recombination
hotspots of the 7G8 × GB4 and Dd2 × HB3 genetic crosses.
Additional file 12: Significantly enriched Gene Ontology terms
(genes) in the recombination hotspots.
Additional file 13: Putative motifs enriched in hotspots and their
occurrence frequencies (counts/kb).
Additional file 14: Aligned amino acid sequences of the putative P.
falciparum zinc finger protein (PFL0465c) and those of human and
mouse PRDM9 proteins. Human PRDM9 was used to blast the P.
falciparum genome database [16], and PFL0465c was the protein with
the highest score (192) and the lowest P-value (3.0E-15). The color coded
domains are: yellow, P. falciparum zinc fingers; green, human PRDM9 zinc
fingers; grey, KRAB box; cyan, SET domain; purple, putative eukaryotic
DNA topoisomerase I DNA binding domain. The domains/motifs were
identified using GenomeNet Motif Search [42].
Abbreviations
bp: base pair; KRAB: Krüppel associated box; MS: microsatellite; mSFP:
multiprobe SFP; pLCR: protein low-complexity region; RR: recombination
rate; SFP: single feature polymorphism.
Acknowledgements
This work was supported by the Division of Intramural Research, National
Institute of Allergy and Infectious Diseases, National Institutes of Health. We
thank Jun Yang and Brandie Fullmer at the Laboratory of
Immunopathogenesis and Bioinformatics, SAIC-Frederick, Inc. for microarray
hybridizations, Dr Anton Persikov for advice and discussion on zinc finger
proteins and their binding characteristics, and NIAID intramural editor
Brenda Rae Marshall for assistance.
Author details
1
Laboratory of Malaria and Vector Research, National Institute of Allergy and
Infectious Diseases, National Institutes of Health, 9000 Rockville Pike,
Bethesda, MD 20892, USA.
2
MedImmune, 1 MedImmune Way, Gaithersburg,
MD 20878, USA.
3
Bioinformatics and Computational Biosciences Branch,
Office of Cyber Infrastructure and Computational Biology, National Institute
of Allergy and Infectious Diseases, National Institutes of Health, 9000
Rockville Pike, Bethesda, MD 20892, USA.
4
Charles-Bruneau Cancerology
Centre, University of Montreal, Faculty of Medicine, Ste. Justine Research
Centre, 3175 Chemin de Côte-Ste-Catherine, Montreal, Québec H3T 1C5,
Canada.
5
State Key Laboratory of Stress Cell Biology, School of Life Science,
Xiamen University, 422 Siming South Road, Xiamen, Fujian 361005, PR China.
6
Advanced Technology Program, SAIC-Frederick, Inc., NCI-Frederick, 430
Miller Drive, Frederick, MD 21702, USA.
7
Department of Statistics, University
of Oxford, 1 South Parks Road, Oxford OX1 3TG, UK.
8
Department of
Pediatrics, University of Montreal, Faculty of Medicine, Ste. Justine Research
Centre, 3175 Chemin de Côte-Ste-Catherine, Montreal, Québec H3T 1C5,
Canada.
Authors’ contributions
HJ, microarray experiments, data analysis, and writing; NL, VG, SV, VN, MY,
and RS, data analysis; MZ, data analysis and writing; JM and JL, MS typing;
KH and TEW, genetic cross and writing; BH, DNA extraction; GM and PA,
data analysis; X-zS, conceived and designed the experiments, analysis, and
writing.
Competing interests
The authors declare that they have no competing interests.
Received: 16 November 2010 Revised: 22 January 2011
Accepted: 4 April 2011 Published: 4 April 2011
References
1. WHO: World Malaria Report 2008.[ />malaria2008.pdf].
Jiang et al. Genome Biology 2011, 12:R33
/>Page 12 of 14
2. Sinden RE, Hartley RH: Identification of the meiotic division of malarial
parasites. J Protozool 1985, 32:742-744.
3. Wootton JC, Feng X, Ferdig MT, Cooper RA, Mu J, Baruch DI, Magill AJ,
Su XZ: Genetic diversity and chloroquine selective sweeps in
Plasmodium falciparum. Nature 2002, 418:320-323.
4. Roper C, Pearce R, Nair S, Sharp B, Nosten F, Anderson T: Intercontinental
spread of pyrimethamine-resistant malaria. Science 2004, 305:1124.
5. Mu J, Awadalla P, Duan J, McGee KM, Joy DA, McVean GA, Su Xz:
Recombination hotspots and population structure in Plasmodium
falciparum. PLoS Biol 2005, 3:e335.
6. Mu J, Myers RA, Jiang H, Liu S, Ricklefs S, Waisberg M, Chotivanich K,
Wilairatana P, Krudsood S, White NJ, Udomsangpetch R, Cui L, Ho M, Ou F,
Li H, Song J, Li G, Wang X, Seila S, Sokunthea S, Socheat D, Sturdevant DE,
Porcella SF, Fairhurst RM, Wellems TE, Awadalla P, Su XZ: Plasmodium
falciparum genome-wide scans for positive selection, recombination hot
spots and resistance to antimalarial drugs. Nat Genet 2010, 42:268-271.
7. Myers S, Freeman C, Auton A, Donnelly P, McVean G: A common sequence
motif associated with recombination hot spots and genome instability
in humans. Nat Genet 2008, 40:1124-1129.
8. Su Xz, Ferdig MT, Huang Y, Huynh CQ, Liu A, You J, Wootton JC,
Wellems TE: A genetic map and recombination parameters of the
human malaria parasite Plasmodium falciparum. Science 1999,
286:1351-1353.
9. Hayton K, Gaur D, Liu A, Takahashi J, Henschen B, Singh S, Lambert L,
Furuya T, Bouttenot R, Doll M, Nawaz F, Mu J, Jiang L, Miller LH,
Wellems TE: Erythrocyte binding protein PfRH5 polymorphisms
determine species-specific pathways of Plasmodium falciparum invasion.
Cell Host Microbe 2008, 4:40-51.
10. Jiang H, Yi M, Mu J, Zhang L, Ivens A, Klimczak LJ, Huyen Y, Stephens RM,
Su Xz: Detection of genome wide polymorphisms in the AT rich
Plasmodium falciparum genome using a high density microarray. BMC
Genomics 2008, 9:398.
11. Kelly JM, McRobert L, Baker DA: Evidence on the chromosomal location of
centromeric DNA in Plasmodium falciparum from etoposide-mediated
topoisomerase-II cleavage. Proc Natl Acad Sci USA 2006, 103:6706-6711.
12. Mezard C: Meiotic recombination hotspots in plants. Biochem Soc Trans
2006, 34:531-534.
13. Choo KH: Why is the centromere so cold? Genome Res 1998, 8:81-82.
14. Mancera E, Bourgon R, Brozzi A, Huber W, Steinmetz LM: High-resolution
mapping of meiotic crossovers and non-crossovers in yeast. Nature 2008,
454:479-485.
15. Billings T, Sargent EE, Szatkiewicz JP, Leahy N, Kwak IY, Bektassova N,
Walker M, Hassold T, Graber JH, Broman KW, Petkov PM: Patterns of
recombination activity on mouse chromosome 11 revealed by high
resolution mapping.
PLoS One 2010, 5:e15340.
16. PlasmoDB. [].
17.
Gardner MJ, Hall N, Fung E, White O, Berriman M, Hyman RW, Carlton JM,
Pain A, Nelson KE, Bowman S, Paulsen IT, James K, Eisen JA, Rutherford K,
Salzberg SL, Craig A, Kyes S, Chan MS, Nene V, Shallom SJ, Suh B,
Peterson J, Angiuoli S, Pertea M, Allen J, Selengut J, Haft D, Mather MW,
Vaidya AB, Martin DM, et al: Genome sequence of the human malaria
parasite Plasmodium falciparum. Nature 2002, 419:498-511.
18. DePristo MA, Zilversmit MM, Hartl DL: On the abundance, amino acid
composition, and evolutionary dynamics of low-complexity regions in
proteins. Gene 2006, 378:19-30.
19. Zilversmit MM, Volkman SK, DePristo MA, Wirth DF, Awadalla P, Hartl DL:
Low-complexity regions in Plasmodium falciparum: missing links in the
evolution of an extreme genome. Mol Biol Evol 2010, 27:2198-2209.
20. Bailey TL, Elkan C: Fitting a mixture model by expectation maximization
to discover motifs in biopolymers. Proc Int Conf Intell Syst Mol Biol 1994,
2:28-36.
21. Aslund L, Franzen L, Westin G, Persson T, Wigzell H, Pettersson U: Highly
reiterated non-coding sequence in the genome of Plasmodium
falciparum is composed of 21 base-pair tandem repeats. J Mol Biol 1985,
185:509-516.
22. Oquendo P, Goman M, Mackay M, Langsley G, Walliker D, Scaife J:
Characterisation of a repetitive DNA sequence from the malaria parasite,
Plasmodium falciparum. Mol Biochem Parasitol 1986, 18:89-101.
23. Corcoran LM, Thompson JK, Walliker D, Kemp DJ: Homologous
recombination within subtelomeric repeat sequences generates
chromosome size polymorphisms in P. falciparum. Cell 1988, 53:807-813.
24. Martinelli A, Hunt P, Fawcett R, Cravo PV, Walliker D, Carter R: An AFLP-
based genetic linkage map of Plasmodium chabaudi chabaudi. Malar J
2005, 4:11.
25. Tanriverdi S, Blain JC, Deng B, Ferdig MT, Widmer G: Genetic crosses in the
apicomplexan parasite Cryptosporidium parvum define recombination
parameters. Mol Microbiol 2007, 63:1432-1439.
26. Khan A, Taylor S, Su C, Mackey AJ, Boyle J, Cole R, Glover D, Tang K,
Paulsen IT, Berriman M, Boothroyd JC, Pfefferkorn ER, Dubey JP, Ajioka JW,
Roos DS, Wootton JC, Sibley LD: Composite genome map and
recombination parameters derived from three archetypal lineages of
Toxoplasma gondii. Nucleic Acids Res 2005, 33:2980-2992.
27. Jensen-Seaman MI, Furey TS, Payseur BA, Lu Y, Roskin KM, Chen CF,
Thomas MA, Haussler D, Jacob HJ: Comparative recombination rates in
the rat, mouse, and human genomes. Genome Res 2004, 14:528-538.
28. Freitas-Junior LH, Bottius E, Pirrit LA, Deitsch KW, Scheidig C, Guinet F,
Nehrbass U, Wellems TE, Scherf A: Frequent ectopic recombination of
virulence factor genes in telomeric chromosome clusters of P.
falciparum. Nature 2000, 407:1018-1022.
29. Conway DJ, Roper C, Oduola AM, Arnot DE, Kremsner PG, Grobusch MP,
Curtis
CF, Greenwood BM: High recombination rate in natural
populations of Plasmodium falciparum. Proc Natl Acad Sci USA 1999,
96:4506-4511.
30. Volkman SK, Sabeti PC, DeCaprio D, Neafsey DE, Schaffner SF, Milner DA Jr,
Daily JP, Sarr O, Ndiaye D, Ndir O, Mboup S, Duraisingh MT, Lukens A,
Derr A, Stange-Thomann N, Waggoner S, Onofrio R, Ziaugra L, Mauceli E,
Gnerre S, Jaffe DB, Zainoun J, Wiegand RC, Birren BW, Hartl DL, Galagan JE,
Lander ES, Wirth DF: A genome-wide map of diversity in Plasmodium
falciparum. Nat Genet 2007, 39:113-119.
31. Gerton JL, DeRisi J, Shroff R, Lichten M, Brown PO, Petes TD: Global
mapping of meiotic recombination hotspots and coldspots in the yeast
Saccharomyces cerevisiae. Proc Natl Acad Sci USA 2000, 97:11383-11390.
32. McVean G: What drives recombination hotspots to repeat DNA in
humans? Philos Trans R Soc Lond B Biol Sci 2010, 365:1213-1218.
33. Jeffreys AJ, Kauppi L, Neumann R: Intensely punctate meiotic
recombination in the class II region of the major histocompatibility
complex. Nat Genet 2001, 29:217-222.
34. Jeffreys AJ, Murray J, Neumann R: High-resolution mapping of crossovers
in human sperm defines a minisatellite-associated recombination
hotspot. Mol Cell 1998, 2:267-273.
35. Bagshaw AT, Pitt JP, Gemmell NJ: Association of poly-purine/poly-
pyrimidine sequences with meiotic recombination hot spots. BMC
Genomics 2006, 7:179.
36. Myers S, Bottolo L, Freeman C, McVean G, Donnelly P: A fine-scale map of
recombination rates and hotspots across the human genome. Science
2005, 310:321-324.
37. Lercher MJ, Hurst LD: Imprinted chromosomal regions of the human
genome have unusually high recombination rates. Genetics 2003,
165:1629-1632.
38. Paigen K, Petkov P: Mammalian recombination hot spots: properties,
control and evolution. Nat Rev Genet 2010, 11:221-233.
39. Baudat F, Buard J, Grey C, Fledel-Alon A, Ober C, Przeworski M, Coop G, de
Massy B: PRDM9 is a major determinant of meiotic recombination
hotspots in humans and mice. Science 2010, 327:836-840.
40. Myers S, Bowden R, Tumian A, Bontrop RE, Freeman C, MacFie TS,
McVean G, Donnelly P: Drive against hotspot motifs in primates
implicates the PRDM9 gene in meiotic recombination. Science 2010,
327:876-879.
41. Parvanov ED, Petkov PM, Paigen K: Prdm9 controls activation of
mammalian recombination hotspots. Science 2010, 327:835.
42.
GenomeNet motif search. [ />43.
Persikov AV, Osada R, Singh M: Predicting DNA recognition by Cys2His2
zinc finger proteins. Bioinformatics 2009, 25:22-29.
44. C2H2 Zinc Finger Proteins. [ />45. Nair S, Nash D, Sudimack D, Jaidee A, Barends M, Uhlemann AC, Krishna S,
Nosten F, Anderson TJ: Recurrent gene amplification and soft selective
sweeps during evolution of multidrug resistance in malaria parasites.
Mol Biol Evol 2007, 24:562-573.
46. Kaback DB, Guacci V, Barber D, Mahon JW: Chromosome size-dependent
control of meiotic recombination. Science 1992, 256:228-232.
47. Kaback DB, Barber D, Mahon J, Lamb J, You J: Chromosome size-
dependent control of meiotic reciprocal recombination in
Jiang et al. Genome Biology 2011, 12:R33
/>Page 13 of 14
Saccharomyces cerevisiae: the role of crossover interference. Genetics
1999, 152:1475-1486.
48. Turney D, de Los Santos T, Hollingsworth NM: Does chromosome size
affect map distance and genetic interference in budding yeast? Genetics
2004, 168:2421-2424.
49. Kong A, Gudbjartsson DF, Sainz J, Jonsdottir GM, Gudjonsson SA,
Richardsson B, Sigurdardottir S, Barnard J, Hallbeck B, Masson G, Shlien A,
Palsson ST, Frigge ML, Thorgeirsson TE, Gulcher JR, Stefansson K: A high-
resolution recombination map of the human genome. Nat Genet 2002,
31:241-247.
50. Irizarry RA, Hobbs B, Collin F, Beazer-Barclay YD, Antonellis KJ, Scherf U,
Speed TP: Exploration, normalization, and summaries of high density
oligonucleotide array probe level data. Biostatistics 2003, 4:249-264.
51. GEO database. [ />acc=GSE25656].
doi:10.1186/gb-2011-12-4-r33
Cite this article as: Jiang et al.: High recombination rates and hotspots
in a Plasmodium falciparum genetic cross. Genome Biology 2011 12:R33.
Submit your next manuscript to BioMed Central
and take full advantage of:
• Convenient online submission
• Thorough peer review
• No space constraints or color figure charges
• Immediate publication on acceptance
• Inclusion in PubMed, CAS, Scopus and Google Scholar
• Research which is freely available for redistribution
Submit your manuscript at
www.biomedcentral.com/submit
Jiang et al. Genome Biology 2011, 12:R33
/>Page 14 of 14