Báo cáo y học: "Genome-wide survey of post-meiotic segregation during yeast recombinati" doc
Bạn đang xem bản rút gọn của tài liệu. Xem và tải ngay bản đầy đủ của tài liệu tại đây (473.58 KB, 9 trang )
RESEARC H Open Access
Genome-wide survey of post-meiotic segregation
during yeast recombination
Eugenio Mancera
1†
, Richard Bourgon
2,3†
, Wolfgang Huber
1
and Lars M Steinmetz
1*
Abstract
Background: When mismatches in heteroduplex DNA formed during meiotic recombination are left unrepaired,
post-meiotic segregation of the two mismatched alleles occurs during the ensuing round of mitosis. This gives rise
to somatic mosaicism in multicellular organisms and leads to unexpected allelic combinations among progeny.
Despite its implications for inheritance, post-meiotic segregation has been studied at only a few loci.
Results: By genotyping tens of thousands of genetic markers in yeast segregants and their clonal progeny, we
analyzed post-meiotic segregation at a genome-wide scale. We show that post-meiotic segregation occurs in close
to 10% of recombination events. Although the overall number of markers affected in a single meiosis is small, the
rate of post-meiotic segregation is more than five orders of magnitude larger than the base substitution mutation
rate. Post-meiotic segregation took place with equal relative frequency in crossovers and non-crossovers, and
usually at the edges of gene conversion tracts. Furthermore, post-meiotic segr egation tended to occur in markers
that are isolated from other heterozygosities and preferentially at polymorphism types that are relatively
uncommon in the yeast species.
Conclusions: Overall, our survey reveals the genome-wide characteristics of post-meiotic segregation. The results
show that post-meiotic segregation is widespread in meiotic recombination and could be a significant determinant
of allelic inheritance and allele frequencies at the population level.
Background
In sexually reproducing organisms, homologous chro-
mosomes exchange genetic information through meiotic
recombination. This process, which occurs in most
eukaryotes, is an important determinant of allelic varia-
tion [1,2]. Recombination is triggered by the formation
of programmed double-strand breaks (DSBs), which are
typical ly repaired using the homologous chromosome as
a template. Meiotic DSB re pair often produces regions
of gene conversion, which may or may not be accompa-
nied by a reciprocal exchange of homologous chromoso-
mal arms, th ereby producing crossovers (COs) and non-
crossovers (NCOs), respectively [3]. The pairing of a sin-
gle strand from one ho molog with the complementary
strand from the other produces heteroduplex D NA with
mismatches at heterozygous positions. Repair of these
mismatc hes results in either gene conversion or restora-
tion of the original genotype. If the mismatches are not
repaired, both alleles will persist in the meiotic product
and will segregate during the first mitotic division
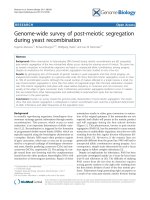
(Figure 1). This phenomenon, known as post-meiotic
segregation (PMS) [4], has the potential to cause somatic
mosaicism in multicellular organisms, since the two cells
resulting from the first zygotic division will possess dif-
ferent alleles [5]. Moreover, if the somatic lines are
genetically different from the germ line, PMS wi ll lead to
unexpected allelic combinations among progeny. As a
consequence, simple traits determined by such a locus
may appear to follow complex inheritance [5].
Despite its implications for inheritance, PMS has be en
previously investigated mainl y on a locus-by-locus basis
([4, 6-9] and references in [4]). The difficul ty of studying
PMS comes from the fact that its detection requires
scoring genetic markers in the eight cells resulting from
the first mitotic division of each of the four meiotic pro-
ducts. F ilamentous fungi generating eight ascospores as
a result of an extra post-meiotic mitotic division during
* Correspondence:
† Contributed equally
1
European Molecular Biology Laboratory, Meyerhofstrasse 1, 69117
Heidelberg, Germany
Full list of author information is available at the end of the article
Mancera et al. Genome Biology 2011, 12:R36
/>© 2011 Mancera et al. licensee BioMed Central Ltd. This is an open access article distributed under the terms of the Creat ive Commons
Attribution License ( which permits unrestricted use, distribution, and reproduction in
any medium, provided the original work is properly cited.
sporulationhavethereforeoftenbeenusedtostudy
PMSatisolatedloci[10-12].Fissionandbuddingyeast
have also been models for PMS because the occurrence
of PMS in ma rkers conferring a phenotype causes colo-
nies grown from a single spore to be sectored [13,14].
Previous genome-wide studies of meiotic recombination,
all performed in budding yeast, have surveyed colonies
of cells arising from each meiotic product [15-17]. In
such colonies PMS results in allelic mixtures that are
challenging to genotype. One study employing next gen-
eration sequencing only confirmed one PMS case out of
five putative events in a single analyzed tetrad [17].
Thus, little information exists about the genome-wide
frequency and characteristics of PMS in any organism.
Here, we achieved genome-wide characterization of
PMS in Saccharomyces cerevisiae by simultaneously
assessing over 52,000 heterozygosities in mother and
daughter cell pairs of all the products of several meioses
(Figure 1). PMS events were observed in close to 10% of
recombination events, occ urring with equal relative fre-
quency in COs and NCOs, and mostly at the ends of
gene conversion tracts. Moreover, markers where PMS
occurred tend to be more isolated than other markers
and are mainly SNPs of specific types. Our approach
allowed genome-wide detection of this elusive genetic
phenomenon and shows that PMS could be an impor-
tant determinant of allele frequencies at the population
level.
Results and discussion
To survey PMS genome-wide we first dissected tetrads
obtained from a c ross between two diverged yeast
strains - a labor atory strain, S288c, and a clinical isolate,
YJM789 [18,19]. These strains were selected due to their
substantial genetic diversity. In wild populations, includ-
ing those of S. cerevisiae [20,21], most individuals are
heterozygous and the S288c/YJM789 cross may there-
fore resemble conditions in the wild closer than homo-
zygous strains. Although the l arge number of
polymorphisms between the strains allows high-resolu-
tion genotyping, heterozygosities could also affect meio-
tic recombination [22]. Nevertheless, in the S288c/
YJM789 cross, the genomic distribution of recombina-
tion events has been shown not to be markedly per-
turbed [15,16]. It has also been observed that certain
allelic combinations of the mismatch repair (MMR)
Meiosis
Diploid cross Haploid spores
YJM789 Chr.
recombinant Chr.
S288c Chr.
Mitosis
PM
S
in a pair of
mother-daughter cells
ttagactagTagaagtatc
||||||||| |||||||||
aatctgatcGtcttcatag
5’
5’3’
3’
Unresolved mismatches in
heteroduplex DNA
ttagactagTagaagtatc
|||||||||||||||||||
aatctgatcAtcttcatag
5’
5’3’
3’
ttagactagCagaagtatc
|||||||||||||||||||
aatctgatcGtcttcatag
5’
5’3’
3’
G
enome-wid
e
genotyping
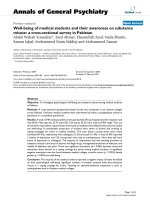
Figure 1 Genome-wide post-meiotic segregation ma pping. Schematic description of the approach to map post-meiotic segregation ( PMS)
genome-wide. The four pairs of mother-daughter cells resulting from the first mitosis of each spore were genotyped using a tiling microarray.
Mancera et al. Genome Biology 2011, 12:R36
/>Page 2 of 9
genes are incompatible, leading to elevated mitotic
mutation rates in segregants of intra-species yeast
hybrids. Strains with an S288c allele of MLH1 in combi-
nation with the SK1 (another S. cerevisiae strain) allele
of PMS1 show an approximately 100-fold higher muta-
tion rate in the lys2-A14 mutator assay [23]. This obser-
vation is consistent with the central role that MLH1 and
PMS1 play in MMR. YJM789 car ries the ancestral form
of both genes and is therefore compatible with S288c
and SK1. Thus, we do not e xpect the progeny of the
S288c/YJM789 cross to show e levated mutation rates
[23,24].
We allowed each of the d issected spores to germinate
and divide mitotically, and then separated the two
resulting cells under a dissection microscope (Mat erials
and methods). The four pairs of mother and daughter
cells arising from each tetrad were genotyped using til-
ing micr oarrays and a supervised modality of the ssGe-
notyping algorithm [25], trained on a large set of
published data [16]. A total of four tetrads were ana-
lyzed. Markers where PMS occurred (PMS markers)
were identified by comparing the genotypes from
mother and daughter cells in each pair (Figure 1). For
each identified PMS event in the two tetrads with the
most events, conventional Sanger sequencing was per-
formed as validation, and no false positiv es were
discovered.
Among the four tetrads, we found a total of 52 mar-
kers where PMS occurred (18, 6, 17, and 11 per tetrad;
Additional file 1). This constitutes 1.2% of the overall
number of markers involved in recombination events
(Additional files 2 and 3). There were four instances in
which PMS occurred in more than one marker in the
same recombination event (for example, Figure 2a).
PMS events were present in more than 9% of the overall
recombination events: 46 of the total 499 COs and
NCOs had at least one m arker exhibiting PMS (Addi-
tional file 3). Furthermore, COs containing no converted
markers presumably cor respond to recombination
events in which heteroduplex DNA contained no poly-
morphic positions, and which therefore could not pro-
duce gene conversion or PMS. In fact, the inter-marker
spacing at the flanks of these COs was considerably lar-
ger than a typical inter-marker interval (median inter-
marker spacing of 2. 1 kb versus 78 bp) . If such COs are
set aside, the portion of recombination events with at
least one PMS marker in creased to 10.6%. The high
number of re combinat ion events where PMS occurred
across the genome indicates that PMS is a widespread
phenomenon in recombination and a significant contri-
butor to allelic diversity during meiosis.
Although the MMR machinery that resolves mismatches
during the formation of COs or NCOs is thought to be
the same [4], it has been observed that a fraction of
COs presents higher PMS frequencies [26]. Whether
PMS occurs more frequently in COs overall or in NCOs
has not been tested. Out of the 46 PMS events, 28
occurred in COs and 18 in NCOs. Notably, this ratio
did not significantly differ from the overall genomic CO
to NCO ratio observed (336 COs:163 NCOs; Additional
file 3; Fisher exact test, P = 0.33). Thus, our data do not
suggest that the efficiency of the MMR machinery
depends on w hether the heteroduplex is resolved
towards a CO or a NCO.
Interestingly, we observed that markers where PMS
occurred tended to be at the ends of gen e conversion
tracts (Figure S1 in Additional file 4). Only six PMS
events were not at the end of a tract. To test whether
this observation statistically deviates from a scenario in
which PMS occurs uniformly along conversion tracts,
we focused on the 26 tracts containing at least one PMS
marker and consisting of three or more markers. (Tracts
smaller than three markers have only terminal markers.)
Among these 26 events, there were 20 (76.9%) with a
terminal PMS marker, and together they contained 32
PMS markers, of which 22 were terminal. If we assign
32 PMS events uniformly at random to this set of
events, the probability of seeing such a high fraction of
events with a terminal PMS mark er is <0.001 (Figure S2
in Ad ditional file 4; Materials a nd methods). This pro-
vides strong evidence that PMS occurred predominantly
at terminal markers.
It has been previously shown that neighboring poly-
morphisms influence the PMS frequency of a given mar-
ker [27,28]. To investigate the effect of surrounding
het erozygosities, we first considered the polymorphisms
around PMS markers independently of whether they
also showed PMS. We found that 100-bp windows cen-
tered on the PMS markers were twice as likely to not
contain any other polymorphism as windows centered
on markers not showing PMS (Figure 3, compare top
and bottom panels; Fisher exact test, P =2.5×10
-10
). A
range of other window sizes (50 to 300 bp) gave qualita-
tively similar results. Since the ends of gene conversion
tracts tend to have lower marker density (Figure 3, com-
pare middle and bottom panels), the preferential posi-
tion of PMS markers at the end of tracts might have
been the cause of the observed relative isolation of PMS
markers. This turned out not to be the case: the median
distance to the nearest polymorphism for PMS marker s
was 49 bp larger than for all end-of-interval markers
(Figure 3; Wilcoxon test, P = 0.002). Thus, PMS mar-
kers appear to be better separated from neighboring
polymorphisms than wo uld be expected by chance, even
given their positioning at the end of conversion tracts.
This suggests that the MMR machinery may be more
responsive to heteroduplex regions with a higher density
of mismatches.
Mancera et al. Genome Biology 2011, 12:R36
/>Page 3 of 9
The MMR machinery r epairs mismatches by excising
a segment of one of the two single strands, often as
large as 900 bp [27]. Therefore, adjacent mismatches, if
present within the excised fragment, can be co-repaired.
If MMR repair takes place over large tracts of heterodu-
plex DNA - that is, i f repair does not take place one
mismatch at a time - then it is also conceivable that
tracts of heteroduplex DNA that contain multiple mis-
matches may be left unrepaired. In our data, consecutive
PMS markers in the s ame conversion tract may provide
evidence of this. Altogether, one recombination event
involved two PMS markers, and two involved three
(Figure 2a; Figure S3 in Additional file 4). Remarkably,
markers where PMS occurred in the same conversion
tract were always adjacent to each other, with no other
polymorphisms in between (Figure 2a; Figure S3 in
Additional file 4). Among these, the shortest distance
between neighboring PMS markers was 43 bp, and the
longest wa s 488 bp. All of these events were at the end
of a conversion tract. Having established that a high
fraction of the observed PMS events occurred in the
final marker of a recombination tract, we next asked if
the observed end-of-tract multi-marker PMS events
were likely to be mechanistically linked or w ere rather
due to chance co-localizations of independent PMS
events. Using, as before, the 26 tracts with three or
more markers that were observed to contain a PMS
marker, we ran a second simulation. This simulation
included end-of-event bias: simulated PMS markers
were assigned to internal and terminal positions in pro-
portions similar to those observed in the actual data
(see Materials and methods). In this second simulation,
the probability of seeing three or more recombination
events with end-of-tract multi-marker PMS events is
very unlikely (P < 0.001). This suggests that the occur-
rence of PMS in a giv en marker increases the frequency
of PMS in the surrounding markers, at least for terminal
PMS events. This finding is c onsistent with previous
observations made at the budding yeast HIS4 locus [27].
In our whole dataset, we observed only one instance
in which two different spores had PMS in the same
marker. Both of these PMS events were located in the
twosporesinvolvedinasingleCO,resultingin4:4
aberrant segregation (Figure 2b). Such a pattern of sym-
metric heteroduplex tracts is expected to be the result
of branch migration of a Holliday junction during DSB
repair. Aberrant 4:4 segregation resulting from sym-
metric heteroduplex DNA was one of the original pre-
dictions of the Holli day model of recombination.
However, since abe rrant 4:4 segregat ion is rarely
observed in S. cerevisiae, Holliday junctions are cur-
rently thought to be resolved before branch migration
[6]. The rare cases of observed aberrant 4:4 segregation
have been alternatively explained as the result of two
(a) (b)
kb
72 74 76
D
C
B
A
PMS
Rec.
kb
252 256 260 264
D
C
B
A
PMS
Rec.
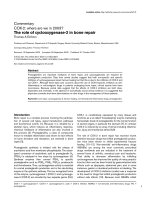
Figure 2 Examples of post-meiotic segregation. (a,b) Close-ups of a NCO in chromosome VI (a) and a CO in chromosome XVI (b) containing
markers where PMS occurred. Red/blue vertical segments represent markers with the S288c/YJM789 genotype along the chromosomes of the
two mother and daughter cells resulting from the first mitosis of each spore (A, B, C and D). The horizontal black line indicates the inferred NCO,
and the diagonal, the CO. Green vertical segments immediately on top of the coordinate axis denote markers where PMS occurred and orange
segments denote markers with non-Mendelian segregation.
Mancera et al. Genome Biology 2011, 12:R36
/>Page 4 of 9
independent recombination events involving all four
chromatids [6]. Although the event observed here has a
complex topology (Figure 2b), the fact that only two
chromatids show recombinant markers suggests that it
resulted from symm etric heteroduplex tracts durin g the
repair of a single DSB.
Having explored the context in which PMS markers
are located in terms of other polymorphisms, we next
considered the types of polymorphisms where PMS
occurred. Insertions or deletions (indels) accounted for
9.4% of the polymorphisms in gene conversion regions,
a similar proportion to that of indels present between
the whole genomes of S288c and YJM789 (approxi-
mately 9.0%) [29]. Of the markers where PMS occurred,
98.1%, or all but one (a 29-bp indel), were SNPs. If one
treats the 52 PMS markers a s independent Bernoulli
draws from the pool of markers involved in a recombi-
nation event, then the chance of drawing 0 or 1 inde ls
is 0.03. However, given the preferential occurrence of
PMS at the ends of conve rsion tracts, if only such posi-
tions are considered, the fraction of indels drops to
6.4%, and the probability of observing 0 or 1 i ndels in
52 events rises to 0.15. Previous work has shown that
the MMR machinery has similar bind ing affinities to 1-
bp indel mismatches as to the strongest bound SNP
mismatch [30]. Other indel mismatches have been
observed to be bound with lower affinity than 1-bp
indels [30]. Furthermore, null mutations in the main
MMR proteins have been observed to exert a similar
effect in the repair frequency of SNP and small indel
mismatches [4]. From our genome-wide PMS data we
cannot conclude - with statistical significance - whether
indel mismatches are better repaired than SNP
mismatches.
To gain further insight into the sequence characteris-
tics of PMS events and their evolutionar y hallmarks, we
focused on SNPs and analyzed the type of bases that are
involved in PMS. Any given SN P can give ri se to two
possible mismatches, depending on which base is
resected during recombination. As shown in Figure 4a,
at markers where PMS occurred, we observed SNPs that
could generate all possible mismatches (Additional file
1). However, the relative frequencies of SNP types at
PMS markers differed strongly from those of all SNPs
found in recombination events (Figure 4a; Fisher exact
test, P =4×10
-9
). SNPs that generate C/C or G/G and
A/A or T/T mismatches are, respectively, 5.0 and 1.8
times more frequent in PMS events than in overall
recombination events. On the other hand, SNPs giving
rise to A/G or C/T mismatches are approximately as
frequent as in recombination events, and SNPs produ-
cing A/C or G/T mismatches are only half as frequent.
These deviations in the relative frequencies do not seem
to be caused by the preferential occurrence of PMS at
the end of conversion trac ts, since the different SNP
classes are uniformly d istr ibuted along tracts (Figur e S4
in Additional file 4). We thus find clear differences in
the genome-wide PMS rates between all four SNP
classes.
The enrichment of SNPs generating C/C o r G/G mis-
matches is a likely reflection of the known relative inef-
ficiency of C/C repair [ 31,32]. At the ARG4 and HIS4
loci, C/C repair has been reported to be between three-
and five-fold less efficient than the repair of other mis-
matches [7,8]. Similar efficiencyreductionshavebeen
found in other fungi (Schizosaccharomyces pombe)[33],
in animals [34] and in prokaryotes [35]. It has even
been proposed that C/C mismatches are repaired by a
different molecular machinery than other mismatches
[36]. It is also known that the be st-repaired mismatch is
G/T. Binding studies in vitro have revealed that the
MSH2-MSH6 complex, a central player of MMR, has
the highest affinity to G/T mismatches [30,34]. The
0.0
0.2
0.4
0.6
02468
0.0
0.2
0.4
0.6
0.0
0.2
0.4
0.6
02468
02468
PMS markers
End-of-tract markers
Recombination markers
DensityDensityDensity
Polymorphisms per window
Figure 3 Post-meiotic segregation markers are relatively
isolated from other polymorphisms. Histograms showing the
marker density in 100-bp windows centered on PMS markers (upper
panel), centered on markers located at the end of conversion tracts
(middle panel), and centered on overall markers in recombination
intervals (lower panel). A range of window sizes produced
qualitatively similar results. The median distance to the nearest
polymorphism for markers at the end of conversion tracts was 58
bp larger than for all markers in recombination events (Wilcoxon
test, P < 0.0001) and the median distance to the nearest
polymorphism for PMS markers was 49 bp larger than for all end-of-
interval markers (Wilcoxon test, P = 0.002).
Mancera et al. Genome Biology 2011, 12:R36
/>Page 5 of 9
efficiency with which other mismatches are repaired is
less clear, especially in vivo. A/A and T/T mismatches,
for example, have been reported to be repaired less effi-
ciently in mitotic assays [31], but also as efficiently a s
other mismatches during meiosis [7,9]. Here we find
clear differences in the genome-w ide PMS rate between
all four SNP classes (Figure 4a), suggesting that each
mismatch c lass is repaired with a different efficiency in
vivo.
Interestingly, the repair efficiency of mismatches
observed here was inversely related to the overall fre-
quencies of the associated SNP classes in S. cerevisiae
(Figure4b).ThiswasnotonlytrueforSNPsbetween
S288c and YJM789, bu t also for SNPs among several
recently sequenced yeast strains [37]. The distribution of
SNP classes in the population reflects, at least in part,
the frequency with which the MMR machinery enc oun-
ters the mismatches caused by such SNPs. The fact that
the mismatches associated with the most common SNP
classes are also the most efficiently repaired may there-
fore be a consequence of selective pressure favoring
removal of mutation-asso ciated mismatches. MMR pro-
tein variants that are better at repairing common mis-
matches would be selected for. There is support for this
hypothesis in Escherichia coli, where the frequency of
different DNA polymerase III errors in vitro is positively
related to the repair efficiency of mismatches in phage
genomes [38]. The same category of SNPs that is most
numerous in the budding yeast genomes is also the only
one to form purine/pyrimidine mismat ches. Therefore,
it may i ndeed be the case that the MMR machinery has
evolved to more readily recognize such mismatches.
Conclusions
Toourknowledge,thisworkisthefirstgenome-wide
survey of PMS in any organism: traditional studies on
PMS have focused on a small number of genetic mar-
kers in many meiosis; we, on the other hand, have
examined tens of thousands of h eterozygosities along
the genome in a smaller number of meioses. Our work
takes previous genome-wide recombination studies
[15-17] one step further by analy zing not only the pro-
ducts of meiosis, but also the products of the first mito-
tic division of each spore. We show that, in terms of
genome-wide recombination events, PMS is widespread
and preferentially affects SNP types that are relatively
rare within the species, as well as SNPs that are isolated
and at the ends of conversion tracts. Although PMS
occurred in only a small fraction of markers, the num-
ber of bases affected per meiosis is considerably larger
than t hose altered by base substitution mutat ions. Tak-
ing into account only the 48,933 genotyped markers
consisting of single SNPs in the S288c/YJM789 cross,
we observed 51 SNPs affected by PMS in 16 spore s.
Thus, the PMS rate is 6.5 × 10
-5
per SNP base per
meiosis, while the mutation rate has been estimated
around 3 × 10
-10
per base per cell division [39,40].
Therefore, PMS may be a significant determinant of
(
b
)(
a
)
PMSRec. SNPs
Relative frequency
C/C or G/G
A/A or T/T
A/C or G/T
A/G or C/T
●
●
●
●
0.00.20.40.60.81.0
●
●
●
●
SNP type frequency
PMS relative rate
0% 20% 40% 60% 80%
12345
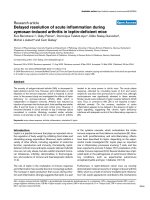
Figure 4 Post-meiotic segregation occurs preferentially at specific polymorphism types. (a) Relative frequenci es of the possible
mismatches given the SNPs found in PMS events and in recombination events (Rec. SNPs). (b) Inverse relationship between the frequency of
the different SNP types in the S. cerevisiae species and the efficiency with which the mismatches generated by the SNPs are repaired (PMS
relative rate = PMS frequency/Recombination SNP frequency). In the figure the frequencies of SNPs between S288c and YJM789 are shown. The
result is qualitatively the same when calculating SNP frequencies with other strains [37].
Mancera et al. Genome Biology 2011, 12:R36
/>Page 6 of 9
allelic inheritance and allele frequencies at the popula-
tion level. Finally, our approach for m easuring PMS can
be extended to other environmental conditions and to
strains w ith genetic perturbations for the genome-wide
study of meiotic recombination and mismatch repair.
Materials and met hods
Strains, media and cell dissection
The heterozygous diploid parental strain (MATa/MATa
ho/ho::hisG +/lys2 +/lys5 gal2/gal2)wastheresultof
mating strains S96, which is isogenic to S288c [19], and
YJM789 [18]. Sporulation of the parental strain was
induced by transferring an overnight YEPD culture to
SPS liquid medium [41], le tting i t reach an OD
600
of 1.4
and then transferring it to double the volume of 1%
potassium acetate. All cultures were grown by vigorous
shaking at 30°C. After 2 days of incubation in potassium
acetate, tetrads were dissected in YEPD plates and the
resulting spores were allowed to germ inate at 30°C.
Spores were constantly monitored to spot the first mito-
tic cell division. At the two-cell stage, the mother or
daughter cell was further separated under the dissection
microscope. Finally, all cells were grown t o colonies at
30°C for 2 days [29,42-44].
DNA extraction and hybridization
Each of the eight mother and daughter cells f rom four
tetrads were independently cultured overnight at 30°C
in 100 ml of YEPD liquid medium. The four tetrads
selected here had not been previously genotyped in [16].
DNA was extracted from each culture using a QIA GEN
(Hilden, Germany) Genomic Tip following the manufac-
turer’ sprotocol.DNA(10μg) was fragmented using
DNase I and 3’ biotin-labeled using an Affymetrix
(Santa Clara, California, USA) kit. Hybridization was
finally performed as described previously [16]. The Affy-
metrix tilling microarray used is a custom microarray
that interrogate s the genomic sequen ces of both strai ns,
S288c and YJM789, at 4-bp resolution [16].
Genotyping and recombination event annotation
In [16,25], a semi-supervised genotyping approach was
advantageous due to the la rge number of segregant
arrays (n > 200). Here, the total number of PMS arrays
was smaller (n = 32), so we chose to assign genotypes in
a supervised fashion, using a likelihood ratio based on
the multivariate log-intensity distributions learned from
the arrays in [16,25] . To ensure compatib ility, we first
used VSN [45] to normalize probe intensities from the
PMS arrays to a reference distribution computed from
the arrays in [16,25].
Probe sets identified as likely to produce excess geno-
typing error in [16,25], and consequently omitted there,
were dropped for the PMS arrays as well. Individual
genotype calls for the PMS arrays were further filtered
as in [16,25]: log-intensity vectors that were either too
close to the decision boundary (log-likelihood ratio
scores below 36.7 in absolute value) or were outliers
relative to their assigned genotype distribution (Mahala-
nobis distance to the appropriate genotype centroid
greater than 5) were not assigned a genotype. For
further details concerning the genotyping method and
filtering, please see references [16,25].
After splitting the eight mother and daughter cells
arising from a single meiosis into two pseudo-tetrads,
recombination event annotation was done using a com-
bination of automatic and manual annotation steps as
previously described [16]. For computation, observed
complex COs and NCOs with discontinuous gene con-
version tracts were not distinguished from other COs or
NCOs. Markers with discordant genotype calls for the
mother and daughter cells arising from a single segre-
gant were deemed to be PMS events.
Calculating the probability of observing terminal and
adjacent PMS events by chance
The likelihood that adjacent PMS markers occurred by
chance depends in a complex way on the full configura-
tion of recombination events. Using the observed config-
uration of recombination events containing three or
more markers and at least one PMS event, we per-
formed two simulations. First, this collection of events
was observed to contain 32 PMS markers. To assess
whether PMS markers’ apparent preferenc e for the ends
of recombination events could be due to chance, we
assigned 32 simulated PMS markers uniformly at ran-
dom. (For COs, simulated markers were allowed to fall
on either of the two involved strands.) We then com-
puted the fraction of simulated recombination events
with a terminal marker. In 1,000 simula tions, this fra c-
tion was always far below the observed fract ion (Figure
S2 in Additional file 4).
Next, we performed a second simulation to assess
the observed occurrence of multiple PMS markers at
consecutive positions within a single recombination
event. Given the results of the first simulation, we now
hypothesized that a substantial fraction (76.9%) of
PMS markers must be terminal, but that the remain-
der are uniformly distributed within the interiors of
the intervals. In 1,000 repetitions of this s econd, non-
uniform sampling scheme, we only once found two
simulated recombination events with multiple, conse-
cutive terminal markers; we never found three such
events.
Data deposition
The array data have been deposited in the ArrayExpress
database (accession number E-TABM-1031).
Mancera et al. Genome Biology 2011, 12:R36
/>Page 7 of 9
Additional material
Additional file 1: Markers where post-meiotic segregation has been
inferred. The first_S288c and last_S288c columns correspond to the
chromosomal coordinates of the marker using the S288c coordinate
system. The rest of the headers give the spore number, the chromosome
(chr), the S288c:YJM789 segregation ratio and the S288c and YJM789
genotype of the marker.
Additional file 2: Marker coordinates and genotype calls for all
spores. The first, last and chr columns are as described in the legend of
Additional file 1. The type column contains S for SNPs, I for insertions, D
for deletions, and M for probe sets that interrogated more than one
polymorphism (that is, consecutive SNPs, or a SNP near an insertion or
deletion). Apart from those columns there is one column per genotyped
cell, the header of which is composed of “wt”, the tetrad number (1, 5, 7,
8), the mother or daughter cell (1,2) and the spore (a, b, c, d), each
separated by an underscor e. A genotype call of 1 corresponds to S288c.
Additional file 3: Inferred CO and NCO interval locations. The
first_S288c and last_S288c columns correspond to the maximal method
described in [16], in which the tract is defined by the two nearest
unconverted markers. In the type column, × denotes a CO and C
denotes an NCO as described in [16]. The pms column denotes whether
a PMS event was observed in a given recombination interval. Other
column headers give tetrad number and spore letter.
Additional file 4: Supplementary figures. Figure S1: position of PMS
markers within recombination tracts. Each row corresponds to a single
recombination event and each vertical segment depicts a marker
involved in such an event. Markers where PMS occurred are shown as
larger red segments. Indel markers are shown as rectangles instead of
segments. Vertical axis labels give tetrad, chromosome, and first base of
the recombination event. For the event wt_7 chr06:74792, also depicted
in Figure 2b, only one conversion tract is show n. Figure S2: PMS tends to
occur at the ends of conversion tracts. The figure shows the degree to
which there is overrepresentation of events with PMS markers exactly at
one end or the other of the conversion tract. In 1,000 simulations, the
fraction of recombination events with one or more terminal PMS markers
was recorded (see Materials and methods). The histogram shows the
distribution of these fractions; the blue vertical line shows the observed
fraction of events with terminal PMS events. Figure S3: Events where
more than one PMS marker was observed. Four recombination events
had more than one marker where PMS occurred. Two of these events
are depicted in Figure 2 in the main text and the other two are
illustrated here: (a) a CO in chromosome II; and (b) a NCO in
chromosome IX. As in Figure 2, red/blue vertical segments represent
markers with the S288c/YJM789 genotype along the chromosomes of
the two mother and daughter cells resulting from the first mitosis of
each spore (A, B, C and D). Horizontal black lines indicate inferred NCOs,
and the diagonal, inferred COs. Green vertical segments immediately on
top of the coordinate axis denote markers where PMS occurred and
orange segments denote markers with non-Mendelian segregation.
Figure S4: SNP distribution along gene conversion tracts. For each
recombination interval, markers were assigned to the fraction of the
interval they spanned. For example, in a one-marker interval, the one
and only marker was assigned to the full range from 0% to 100%; for a
three marker interval, the first marker was assigned to 0% to 33%, the
second to 33% to 66%, and the third to 66% to 100%, and so on. Non-
SNP markers were ignored. The frequency with which any position
corresponded to a particular SNP type was then computed over the full
range of 0% to 100%. No SNP type appears to show positional bias.
Abbreviations
Bp: base pair; CO: crossover; DSB: double-strand break; indel: insertion or
deletion; MMR: mismatch repair; NCO: non-crossover; PMS: post-meiotic
segregation; SNP: single nucleotide polymorphism.
Acknowledgements
We thank W Wei and C Girardot for technical help; E Alani for discussions
and critical comments on the manuscript; and the contributors to the
Bioconductor and R projects for making their software available. This work
was supported by grants to LMS from the National Institutes of Health and
the Deutsche Forschungsgemeinschaft, and to WH from the European
Community’s Seventh Framework Programme.
Author details
1
European Molecular Biology Laboratory, Meyerhofstrasse 1, 69117
Heidelberg, Germany.
2
European Molecular Biology Laboratory, European
Bioinformatics Institute, Cambridge CB10 1SD, UK.
3
Genentech, Inc., 1 DNA
Way, South San Francisco, CA 94080-4990, USA.
Authors’ contributions
EM and LMS designed the study, EM performed the experiments, RB and EM
analyzed the data, LMS and WH provided suggestions for data analysis, and
all authors co-wrote the manuscript.
Received: 2 November 2010 Revised: 27 January 2011
Accepted: 11 April 2011 Published: 11 April 2011
References
1. Gordo I, Charlesworth B: Genetic linkage and molecular evolution. Curr
Biol 2001, 11:R684-686.
2. Wolf KW: How meiotic cells deal with non-exchange chromosomes.
Bioessays 1994, 16:107-114.
3. Bishop DK, Zickler D: Early decision; meiotic crossover interference prior
to stable strand exchange and synapsis. Cell 2004, 117:9-15.
4. Surtees JA, Argueso JL, Alani E: Mismatch repair proteins: key regulators
of genetic recombination. Cytogenet Genome Res 2004, 107:146-159.
5. Leslie JF, Watt WB: Postmeiotic segregation as a source of mosaics in
diploid organisms. Genet Res 1984, 44:225-229.
6. Alani E, Reenan RA, Kolodner RD: Interaction between mismatch repair
and genetic recombination in Saccharomyces cerevisiae. Genetics 1994,
137:19-39.
7. Detloff P, Sieber J, Petes TD: Repair of specific base pair mismatches
formed during meiotic recombination in the yeast Saccharomyces
cerevisiae. Mol Cell Biol 1991, 11:737-745.
8. Lichten M, Goyon C, Schultes NP, Treco D, Szostak JW, Haber JE, Nicolas A:
Detection of heteroduplex DNA molecules among the products of
Saccharomyces cerevisiae meiosis. Proc Natl Acad Sci USA 1990,
87:7653-7657.
9. White JH, Lusnak K, Fogel S: Mismatch-specific post-meiotic segregation
frequency in yeast suggests a heteroduplex recombination intermediate.
Nature 1985, 315:350-352.
10. Leblon G, Rossignol JL: Mechanism of gene conversion in Ascobolus
immersus. 3. The interaction of heteroallelas in the conversion process.
Mol Gen Genet 1973, 122:165-182.
11. Olive LS: Aberrant tetrads in Sordaria fimicola. Proc Natl Acad Sci USA
1959, 45:727-732.
12. Yeadon PJ, Catcheside DE: Long, interrupted conversion tracts initiated
by cog in Neurospora crassa. Genetics 1998, 148:113-122.
13. Esposito MS: Postmeiotic segregation in Saccharomyces. Mol Gen Genet
1971, 111:297-299.
14. Gutz H: Site
specific induction of gene conversion in
Schizosaccharomyces pombe. Genetics 1971, 69:317-337.
15. Chen SY, Tsubouchi T, Rockmill B, Sandler JS, Richards DR, Vader G,
Hochwagen A, Roeder GS, Fung JC: Global analysis of the meiotic
crossover landscape. Dev Cell 2008, 15:401-415.
16. Mancera E, Bourgon R, Brozzi A, Huber W, Steinmetz LM: High-resolution
mapping of meiotic crossovers and non-crossovers in yeast. Nature 2008,
454:479-485.
17. Qi J, Wijeratne AJ, Tomsho LP, Hu Y, Schuster SC, Ma H: Characterization of
meiotic crossovers and gene conversion by whole-genome sequencing
in Saccharomyces cerevisiae. BMC Genomics 2009, 10:475.
18. McCusker JH, Clemons KV, Stevens DA, Davis RW: Genetic characterization of
pathogenic Saccharomyces cerevisiae isolates. Genetics 1994, 136:1261-1269.
Mancera et al. Genome Biology 2011, 12:R36
/>Page 8 of 9
19. Mortimer RK, Johnston JR: Genealogy of principal strains of the yeast
genetic stock center. Genetics 1986, 113:35-43.
20. Johnston JR, Baccari C, Mortimer RK: Genotypic characterization of strains
of commercial wine yeasts by tetrad analysis. Res Microbiol 2000,
151:583-590.
21. Mortimer RK: Evolution and variation of the yeast (Saccharomyces)
genome. Genome Res 2000, 10:403-409.
22. Borts RH, Haber JE: Meiotic recombination in yeast: alteration by multiple
heterozygosities. Science 1987, 237:1459-1465.
23. Demogines A, Wong A, Aquadro C, Alani E: Incompatibilities involving
yeast mismatch repair genes: a role for genetic modifiers and
implications for disease penetrance and variation in genomic mutation
rates. PLoS Genet 2008, 4:e1000103.
24. Heck JA, Argueso JL, Gemici Z, Reeves RG, Bernard A, Aquadro CF, Alani E:
Negative epistasis between natural variants of the Saccharomyces
cerevisiae MLH1 and PMS1 genes results in a defect in mismatch repair.
Proc Natl Acad Sci USA 2006, 103:3256-3261.
25. Bourgon R, Mancera E, Brozzi A, Steinmetz LM, Huber W: Array-based
genotyping in S. cerevisiae using semi-supervised clustering.
Bioinformatics 2009, 25:1056-1062.
26. Getz TJ, Banse SA, Young LS, Banse AV, Swanson J, Wang GM, Browne BL,
Foss HM, Stahl FW: Reduced mismatch repair of heteroduplexes reveals
“non"-interfering crossing over in wild-type Saccharomyces cerevisiae.
Genetics 2008, 178:1251-1269.
27. Detloff P, Petes TD: Measurements of excision repair tracts formed during
meiotic recombination in Saccharomyces cerevisiae. Mol Cell Biol 1992,
12:1805-1814.
28. Weng YS, Nickoloff JA: Evidence for independent mismatch repair
processing on opposite sides of a double-strand break in Saccharomyces
cerevisiae. Genetics 1998, 148:59-70.
29. Wei W, McCusker JH, Hyman RW, Jones T, Ning Y, Cao Z, Gu Z, Bruno D,
Miranda M, Nguyen M, Wilhelmy J, Komp C, Tamse R, Wang X, Jia P,
Luedi P, Oefner PJ, David L, Dietrich FS, Li Y, Davis RW, Steinmetz LM:
Genome sequencing and comparative analysis of Saccharomyces
cerevisiae strain YJM789. Proc Natl Acad Sci USA 2007, 104:12825-12830.
30. Marsischky GT, Kolodner RD: Biochemical characterization of the
interaction between the Saccharomyces cerevisiae MSH2-MSH6 complex
and mispaired bases in DNA. J Biol Chem 1999, 274:26668-26682.
31. Bishop DK, Andersen J, Kolodner RD: Specificity of mismatch repair
following transformation of Saccharomyces cerevisiae with heteroduplex
plasmid DNA. Proc Natl Acad Sci USA 1989, 86:3713-3717.
32. Kramer B, Kramer W, Williamson MS, Fogel S: Heteroduplex DNA
correction in Saccharomyces cerevisiae is mismatch specific and requires
functional PMS genes. Mol Cell Biol 1989, 9:4432-4440.
33. Schar P, Munz P, Kohli J: Meiotic mismatch repair quantified on the basis
of segregation patterns in Schizosaccharomyces pombe. Genetics 1993,
133:815-824.
34. Mazurek A, Johnson CN, Germann MW, Fishel R: Sequence context effect
for hMSH2-hMSH6 mismatch-dependent activation. Proc Natl Acad Sci
USA 2009, 106:4177-4182.
35. Modrich P: DNA mismatch correction. Annu Rev Biochem 1987, 56:435-466.
36. Schar P, Kohli J: Marker effects of G to C transversions on intragenic
recombination and mismatch repair in Schizosaccharomyces pombe.
Genetics 1993, 133:825-835.
37. Liti G, Carter DM, Moses AM, Warringer J, Parts L, James SA, Davey RP,
Roberts IN, Burt A, Koufopanou V, Tsai IJ, Bergman CM, Bensasson D,
O’Kelly MJ, van Oudenaarden A, Barton DB, Bailes E, Nguyen AN, Jones M,
Quail MA, Goodhead I, Sims S, Smith F, Blomberg A, Durbin R, Louis EJ:
Population genomics of domestic and wild yeasts. Nature 2009,
458:337-341.
38. Kramer B, Kramer W, Fritz HJ: Different base/base mismatches are
corrected with different efficiencies by the methyl-directed DNA
mismatch-repair system of E. coli. Cell 1984, 38:879-887.
39. Lynch M, Sung W, Morris K, Coffey N, Landry CR, Dopman EB, Dickinson WJ,
Okamoto K, Kulkarni S, Hartl DL, Thomas WK: A genome-wide view of the
spectrum of spontaneous mutations in yeast. Proc Natl Acad Sci USA
2008, 105:9272-9277.
40. Nishant KT, Wei W, Mancera E, Argueso JL, Schlattl A, Delhomme N, Ma X,
Bustamante CD, Korbel JO, Gu Z, Steinmetz LM, Alani E: The baker’s yeast
diploid genome is remarkably stable in vegetative growth and meiosis.
PLoS Genet 2010, 6:e1001109.
41. Buhler C, Shroff R, Lichten M: Genome-wide mapping of meiotic DNA
double-strand breaks in Saccharomyces cerevisiae. Methods Mol Biol 2009,
557:143-164.
42. Colman-Lerner A, Chin TE, Brent R: Yeast Cbk1 and Mob2 activate
daughter-specific genetic programs to induce asymmetric cell fates. Cell
2001, 107:739-750.
43. Wang Y, Shirogane T, Liu D, Harper JW, Elledge SJ: Exit from exit: resetting
the cell cycle through Amn1 inhibition of G protein signaling. Cell 2003,
112:697-709.
44. Yvert G, Brem RB, Whittle J, Akey JM, Foss E, Smith EN, Mackelprang R,
Kruglyak L: Trans-acting regulatory variation in Saccharomyces cerevisiae
and the role of transcription factors. Nat Genet 2003, 35:57-64.
45. Huber W, von Heydebreck A, Sultmann H, Poustka A, Vingron M: Variance
stabilization applied to microarray data calibration and to the
quantification of differential expression. Bioinformatics 2002, 18(Suppl 1):
S96-104.
doi:10.1186/gb-2011-12-4-r36
Cite this article as: Mancera et al.: Genome-wide survey of post-meiotic
segregation during yeast recombination. Genome Biology 2011 12:R36.
Submit your next manuscript to BioMed Central
and take full advantage of:
• Convenient online submission
• Thorough peer review
• No space constraints or color figure charges
• Immediate publication on acceptance
• Inclusion in PubMed, CAS, Scopus and Google Scholar
• Research which is freely available for redistribution
Submit your manuscript at
www.biomedcentral.com/submit
Mancera et al. Genome Biology 2011, 12:R36
/>Page 9 of 9