Báo cáo y học: " ZINBA integrates local covariates with DNA-seq data to identify broad and narrow regions of enrichment, even within amplified genomic region" doc
Bạn đang xem bản rút gọn của tài liệu. Xem và tải ngay bản đầy đủ của tài liệu tại đây (1.57 MB, 20 trang )
MET H O D Open Access
ZINBA integrates local covariates with DNA-seq data
to identify broad and narrow regions of enrichment,
even within amplified genomic regions
Naim U Rashid
1†
, Paul G Giresi
2†
, Joseph G Ibrahim
1
, Wei Sun
1,3*
and Jason D Lieb
2*
Abstract
ZINBA (Zero-Inflated Negative Binomial Algorithm) identifies genomic regions enriched in a variety of ChIP- seq and
related next-generation sequencing experiments (DNA-s eq), calling both broad and narrow modes of enrichment
across a range of signal-to-noise ratios. ZINBA models and accounts for factors that co-vary with background or
experimental signal, such as G/C content, and identifies enrich ment in genomes with complex local copy number
variations. ZINBA provides a single unified framework for analyzing DNA-seq experiments in challenging genomic
contexts.
Software website: />Background
Next generat ion sequencing (NGS) technologies are now
routinely utilized for genome-wide detection of DNA frag-
ments isolated by a diverse set of assays interrogating
genomic processes [1]. We refer to these collectively as
DNA-seq experiments, which include chromatin immuno-
precipitation (ChIP-seq), DNase hypersensitive site map-
ping (DNase-seq) [2], and formaldehyde-assisted isolation
of regulatory elements (FAIRE-seq) [3], among others.
Several algorithms are currently available for the identifi-
cation of genomic regions enriched by a given experiment.
Although each is well suited for the analysis of a particular
intended data type , the underlying assumptions are not
always suit able for the multitude of possible enrichment
patterns found in DNA-seq datasets [4]. An algorithm
capable of robust detection of enrichment across a multi-
tude of enrichment patterns, with performance compar-
able to the existing set of algorithms specific to each data
type, would have high utility.
For example, regions of ChIP-seq enrichment for tran-
scription factors [5-16] typically comprise a small
proportion of the genome (< 1%), are short (< 500 bp),
and have relatively high signal-to-noise ratios. Histone
modification data [2,6] can vary widely in terms of
length of enriched regions (Figure 1a), the proportion of
the genome enriched [4], and the signal-to-noise ratio.
To assess the statistical significance of an identified
enriched region, assumptions regarding the distribution
of signal in background and enriched regions must be
made. The majority of algorithms perform optimally for
the identification of transcription factor binding sites
(TFBSs)fromChIP-seqdata[17].However,asthepro-
portion of the genome that is enriched increases and/or
the signal-to-noise ratio decreases compared with TFBS
data [2,6,18-20] the performance of many existing tools
declines [17,19,21-23]. Researchers interested in the ana-
lysis of several types of data for a given experiment must
often combine results from different algorithms. In addi-
tion, NGS data often contain biases due to several fac-
tors, including G/C content [24-26] and mappability [6].
Data from a matched input control sample may control
for the effects of such confounding factors [27], but
input data are often not available, and it is unclear
whether input alone is suffic ient to model background
signals in DNA-seq data.
To address these issues, we introduce a flexible statis-
tical framework called ZINBA (Zero-Inflated Negative
Binomial Algorithm) that ident ifies genomic reg ions
enri ched for sequenced reads across a wide spectrum of
* Correspondence: ;
† Contributed equally
1
Department of Biostatistics, Gillings School of Global Public Health, The
University of North Carolina at Chapel Hill, Chapel Hill, NC 27599, USA
2
Department of Biology, Carolina Center for Genome Sciences, and
Lineberger Comprehensive Cancer Center, The University of North Carolina
at Chapel Hill, Chapel Hill, NC 27599, USA
Full list of author information is available at the end of the article
Rashid et al. Genome Biology 2011, 12:R67
/>© 2011 Rashid et al.; licensee BioMed Central Ltd. This is an open access article distributed under the terms of the Creative Commons
Attribution License (http: //creativecommons.org/licenses/by/2.0), which permits unrestricted use, distribution, and reproduction in
any medium, provided the original work is properly cited.
chr2:
ATF2 ATP5G3
100 kb
175,650,000 175,700,000 175,750,000
Broad Institute H3K36me3 (ChIP-seq)
Duke DNase-seq
UNC FAIRE-seq
UT-Austin CTCF (ChIP-seq)
UT-Austin RNA Pol II (ChIP-seq)
100
0
50
0
100
0
200
0
150
0
Coordinates of enriched
windows
Refined peak boundaries
in BED format
Step 2 Step 3
Data
preprocessing
Repeated on each chromosome individually, run in parallel
Step 1
Classification by
mixture regression
Peak boundary
refinement
(
a
)
(b)
R
ea
d
over
l
ap
Apply user model, or
BIC-suggested model
Enriched windows merged,
read overlap profiles calculated
Coordinates of enriched
windows
Mapped reads,
raw covariate sources
Tabulate window reads,
score window covariates
Window-level data
for classification
Window-level data
for classification
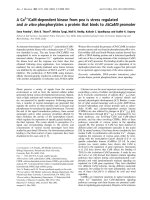
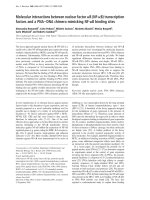
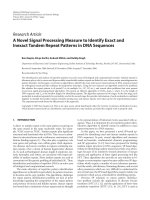
Figure 1 ZINBA provides a unified framework for the detection of enriched sites across a wide variety of DNA-seq datasets . (a) A 100-
kb region of chromosome 2 at the ATF2 gene locus illustrating the diversity of enrichment patterns in DNA-seq data, which includes histone H3
lysine 36 tri-methylation (H3K36me3), CCCTC-binding factor (CTCF) and RNA polymerase II (RNA Pol II) ChIP-seq along with the FAIRE-seq and
DNase-seq assays. Data for each of the DNA-seq experiments are displayed as the number of overlapping extended reads at each base pair,
which was produced by the indicated groups and is available from the UCSC genome browser. (b) ZINBA comprises three steps that can each
operate as an independent module. In step 1, the set of aligned reads from the experiment along with a set of covariate measures are collated
for each contiguous non-overlapping window spanning the genome. In step 2, the component-specific model formulations of covariates are
employed by the mixture regression framework to compute the posterior probability of each window belonging to either the zero-inflated,
background or enriched components. The component-specific model formulations of covariates can be generated using an automated model
selection procedure or specified by the user. In step 3, the windows exceeding the user-specified probability threshold (default 0.95) are merged
to form broad regions of enrichment and a shape detection algorithm is employed on the read overlap representation of the data to refine the
boundary estimates of distinct punctate peaks. BED, browser extensible data; BIC, Bayesian information criterion.
Rashid et al. Genome Biology 2011, 12:R67
/>Page 2 of 20
signal patterns and experimental conditions. ZINBA
implements a mixture regression approach, which prob-
abilistically classifies genomic regions into three general
components: background, enrichment, and an artificial
zero count. The regression framework allows each of
the components to be modeled separately using a set of
covariates, which leads to better characteriz ation of each
component and subsequent classification outcomes. In
addition, the mixture-modeling approach affords ZINBA
the flexibility to determine the set of genomic regions
comprising background without relying on any prior
assumptions of the proportion of the genome that is
enriched. Following classification, neighboring regions
classified as enriched are merged and boundaries of
punctate signal within enriched regions a re determined,
allowing the isolation of both broad and narrow
elements.
We applied ZINBA to FAIRE-seq and ChIP-seq of
CCCTC-binding factor (CTCF), RNA polymerase II (RNA
Pol II), and histone H3 lysine 36 tri-methylation
(H3K36me3) (Figure 1a). These datasets represent a diver-
sity of signal patterns ranging from narrow peaks with
high signal-to-noise ratios (CTCF) to broad enrichment
regions with low signal-to-noise ratios (H3K36me3). In
addition to identifying biologically relevant signals in each
of these datasets, ZINBA is capable of estimating the con-
tribution of component-specific covariates to signal in
each component. Incorporation of covariates into the
model improved peak detection in difficult modeling situa-
tions, such as in amplified genomic regions. In the absence
of input control, we show that other covariates allow for
comparable performance as when input control is utilized.
Lastly, we demonstrate that ZINBA’ s ability to isolate
broad and narrow enr ichment regions reveals functional
differences in RNA Pol II elongation status. We conclude
that ZINBA provides a general and flexible framework for
the analysis of a diverse set of DNA-seq datasets.
Results
ZINBA overview
ZINBA p erforms three steps: data preprocessing, deter-
mination of significantly enriched regions, and an
optional boundary refinement for more narrow sites (Fig-
ure 1b). The first step involves t abulating the number of
reads falling into contiguous non-overlapping windows
(default 250 bp) tiled across each chromosome and scor-
ing corresponding covariate information. Covariates can
consist of any quantity that may co-vary with signal in a
given region, including, for example, G/C content, a
smoothed average of local background, read counts for
an input control sample, or the proportion of mappable
[28] bases, which we define as the mappability score
(Materials and methods). Optionally, additional sets of
contiguous windows with offset starting positions can be
tabulated for increased resolution. Each set of offset win-
dows is analyzed independently in the next step.
In the second step, a novel mixture regression model
is used to probabilistically class ify each window into one
of three components: background, enrichment, or zero-
inflated. In this context, and throughout the manuscript,
the term ‘ enrichment’ will refer to genomic DNA
sequences that were captured specifically as the result of
the biological experiment under consideration. The term
‘ background’ includes genomic DNA sequences that
appear due to experimental noise, noise that arises in
the sequencing process, or noise that arises in the c om-
putational processing of the data. The term ‘ zero-
inflated’ refers to those genomic locations at which we
might expect coverage by a sequencing read derived
from either the b ackground or enrichment signal com-
ponents, but that are not represented in the real data.
Zero-inflation typically occurs due to a lack of sequen-
cing depth and is common in many NGS datasets.
Regions containing higher proportions of non- mappable
bases are also more likely to be zero-inflated, as it is
more difficult to assign reads to these regions during
the mapping process.
ZINBA utilizes an iterative approach [29] to determine
for each window the relative likelihood of belonging to
each component, in addition to estimating the relationship
between average signal in each component and a set of
covariates (Materials and methods). Each iteration consists
of two steps. In the first step, a set of posterior probabil-
ities of component membership is computed for each win-
dow, based on how well each window fits with the average
signal level in each component, adjusted for covariate
effects. In the next step, the average signal level in each
component is modeled separately with its own formulation
of covariates using weighted generalized linear models
(GLMs). The posterior probabilities of component mem-
bership are used as regression weights and serve to parti-
tion the genome into likely background, enrichment, and
zero-inflated regions to determine component signal. The
model iterates between these two steps until the classifica-
tion and component-specific covariate estimates cease to
change.
Adjusting for covariate effects is ofte n beneficial or
necessary for dissecting enrichment regions and back-
ground. For example, although signal in background
regions is typically lower thaninregionsofenrichment,
background regions in copy-number amplified regions
may have higher signal than enrichment regions that
occur in locations with a normal DNA copy number.
Thus, adjusting for copy number changes is necessary for
correct separation of background and enrichment regions.
The set of covaria tes used to model each component can
be selected based on either prior knowledge or an infor-
mation criterion, such as the Bayesian information
Rashid et al. Genome Biology 2011, 12:R67
/>Page 3 of 20
criterion (BIC). Covariates with no or weak relations hips
with mean signal in a component will have little effect on
classification, but do contribute to model complexity. The
BIC criterion helps to remove such covariates to balance
model fit and model size.
In the third step, all overlapping or adjacent windows
classified as enriched are merged. For the detection of
broader elements, especially helpful for histone modifica-
tions demarcating broad genomic regions (such as
H3K36me3), an additional ‘bro ad’ setting is available that
merges enriched windows within a fixed distance. An
optional shape-detection algorithm may then be applied to
identify sharp enrichment signals within broader enriched
regions.
Modeling signal components with relevant covariates
improves enrichment detection
To evaluate the utility of incorporating covariate informa-
tion for the detection of enriched regions, we constructed
simulated datasets, and used G/C content as one example
of such a covariate. Simulated datasets were constructed
to artificially control the relationship between G/C content
and the enrichment, background, and zero-inflated com-
ponents. Window count data were simulated to represent
three types of common NGS signal patterns, ranging from
TFBSs (high signal -to-noise ratio, 1% of genome bel ongs
to enrichment component), FAIRE (moderate signal-to-
noise ratio, 5% of genome belongs to enrichment compo-
nent), to some histone modifications (low signal-to-noise
ratio, 10% of genome belongs to enrichment component).
For each data type, three sets of data were simulated,
hence nine datasets in total. In each data set, G/C content
always had a positive relationship with signal in the back-
ground component and a positive relationship with the
probability of being zero-inflated. However, G/C content
was simulated to have either a positive, neutral or negative
relationship with enrichment. For each of the nine data-
sets, 100,000 windows were simulated. These consisted of
250-bp windows from human chromosome 22 (Materials
and methods). G/C content was simulated from these
windowsaswell.
Now, for each of the nine simulated datasets, three
different uses of the covariate were employed to model
the simulated data: (a) mode l 1, no covariates ; (b) model
2, G/C content is incorporated in modeling the zero-
inflated and background components only; (c) model 3,
G/C content is incorporated in modeling all three
components.
Our results show that models that properly accounted
for the underlying simulated relationships with G/C con-
tent in each component resulted in the best classification
outcomes. For example, when enrichment had an inverse
relationship with G/C content (Figure 2a, b), model 3
consistently led to higher sensitivity and specificity
relative to models 1 and 2 (Figure 2c, d). Simulated com-
ponent-specific relationships between G/C content and
signal were also correctly captured in model 3 (Figure 2e,
f), with average enrichment signal decreasing and average
background signal increasing with respect to G/C con-
tent. Ignoring the ro le of G/C content completely (model
1) resulted in classification based purely on signal, which
misses informative trends in the data (Figure S1 in Addi-
tional file 1). We find similar results fo r the simulated
condition of positive and neutral relationships between
G/C content and enrichment (Figures S2 and S3 in Addi-
tional file 1). Thus, including relevant covariates to
model each component provides a more informed assess-
ment of enrichment versus background.
These results also serve to illuminate how ZINBA distin-
guishes the separate roles of component-specific covari-
ates. For example, covariates that are relevant to the
background component explain variability in background
signal that may otherwise be confused for enrichment.
This benefit of ZINBA is more apparent when the signal-
to-noise ratio is low (Figure 2b, d, f) because, in that case,
many background and enrichment windows contain simi-
lar numbers of reads, and the two s tates are difficult to
distinguish by signal alone. In the situation where we
simulated a neutral relationship of G/C content with
enrichment, model 3 had similar performance to model 2,
suggesting that the use of G/C content to model the
enrichment component did not degrade classification per-
formance. Rather, the estimated ef fect of G/C content in
the enrichment component was close to zero, and thus
had li ttle effect on classification (Figure S2 in Additional
file 1) at the cost of greater model complexity.
While we chose to simulate our data in this section
with respect to only one covariate, the regression basis
for the mixture model allows the inclusion of multiple
covariates simultaneously, as is inherent in any regres-
sion-based framework. Regardless of whether the data
consist of rare, high signal-to-noise enrichment or com-
mon, low signal-to-noise enrichment, the model per-
forms better when each component is modeled with
relevant sets of covariates. However, the performance
gain when using relevant covariates is greatest in lower
signal-to-noise data.
Automated model selection
Relevant covariates are not always known apriori.To
discover the appropriate formulation of covariates for
each component, ZINBA employs the BIC [30] to select
the b est model among all possible models, given a set of
starting covariates (Materials and methods). BIC balances
model fit and model complexity and has long been
employed as a statistical assessment of model perfor-
mance. The regression framework inherent in ZINBA
also allows for the modeling of interact ions between
Rashid et al. Genome Biology 2011, 12:R67
/>Page 4 of 20
(
a
)
(
c)
(
b
)
(d)
(
e) (f)
Simulated window data Simulated window data
GC contentGC content
GC
co
n
t
e
n
t
GC
co
n
t
e
n
t
Relative model performance Relative model performance
1-Specificity
Model 3 component fit
1-Specificity
Model 3 component fit
Window read count
(High signal-to-noise)
Window read count
(High signal-to-noise)
Sensitivity
(High signal-to-noise)
Window read count
(Low signal-to-noise)
Window read count
(Low signal-to-noise)
Sensitivity
(Low signal-to-noise)
Mean background
Mean enrichment
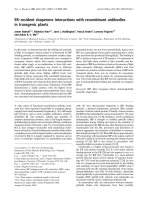
Figure 2 Accounting for relevant component-specific covariates r esults in the optimal classification of background and enriched
components for a simulated data set. (a, b) Density plots showing the distribution of background (blue shading) and enriched (black circles)
simulated counts (y-axis) versus G/C content (x-axis). Window counts were simulated with either (a) a low proportion of high signal-to-noise sites
or (b) a high proportion of low signal-to-noise sites. In this example G/C content had a positive and negative relationship with the background
and enriched components, respectively. (c, d) Receiver operating characteristic (ROC) curves for the performance of three different component-
specific covariate model formulations, including no covariates (model 1, red dashed line), G/C content modeling the background and zero-
inflated components (model 2, green dashed line) and G/C content modeling the background, zero-inflated and enriched components (model
3, black solid line). Classification results for the simulated (c) low proportion of high signal-to-noise sites and (d) high proportion of low signal-to-
noise sites. Utilization of relevant covariates in each component resulted in better classification outcomes (model 3). This impact is greater in
lower signal-to-noise data (d), where it is more difficult to distinguish enrichment from background. (e, f) Scatter plot of G/C content (x-axis)
versus simulated window counts (y-axis) using model 3 to estimate the posterior probability of a window being enriched, which is depicted as a
color gradient. Lighter colors correspond to higher posterior probability and a greater likelihood of being enriched. Posterior probabilities for the
simulated (e) low proportion of high signal-to-noise sites and (f) high proportion of low signal-to-noise sites are shown along with model
estimates for the background (solid black line) and enriched components (dashed black line).
Rashid et al. Genome Biology 2011, 12:R67
/>Page 5 of 20
covariates. Therefore, all pair-wise and three-way interac-
tions between the starting covariates for each component
are considered in the model selection procedure. The
automated model selection procedure was able to select
the most appropriate model for all nine simulated condi-
tions from the previous section.
ZINBA detects relationships between covariates and
component signal that vary by experiment
Evaluation of the relationships between the set of compo-
nent-specific covariates selected using the automated
model selection procedure and the datasets shown in
Figure 1a [31,32] revealed that our mappability score and
input control were positively related with mean back-
ground signal in each ChIP-seq dataset, which is consis-
tent with previous reports [5,28]. Each dataset exhibits
distinctly different degrees of signal-to-noise ratio, length
of enriched regions, and total proportion of the genome
enriched. These differences can be attributed to both
functional differences related to biological activity and
technical aspects of the different assays. However, the
relationship between G/C content and background signal
was not consistent between different DNA-seq experi-
ments (Table S1 in Additional file 1), nor were they con-
sistent between components of the same dataset.
For the RNA Pol II and CTCF data, model estimates
reveal that G/C content had a positive relationship in
background regions, similar to previous reports on G/C
content bias [24-26] (Figure 3a). However, in FAIRE-seq
data, G/C content was negatively associated with the
background component (Figure 3b). These differences
can easily be observed from scatter plots of the raw read
counts from windows classified as background versus
the corresponding G/C content for the RNA Pol II
ChIP-seq and FAIRE-seq datasets (Figure 3c, d). The
exact cause of the differences in the relationship
between G/C content and background signal between
datasets, and whether it could be technical or biological,
is not known.
The relationship for each covariate also differed in
magnitude and direction across components of the same
dataset. For example, in FAIRE-seq data, while there
was a negative relationship with G/C content in back-
ground regions, there was a positive relationship in
enric hed regions (Table S1 in Additional file 1). A simi-
lar difference between the relationship of G/C content
in the background and enrichment regions w as found
for the RNA Pol II ChIP-seq data. Thus, the relation-
ships of covariates with background signal may not be
consistent across different data types, and may differ in
their relationships to signal in background and enrich-
ment regions of the same data type.
An input control may be used to account for the rela-
tionships of G/C content and mappability wit h
background signal. However, the model estimates sug-
gest that input data alone may not explain all of the
variability in DNA-seq background. Examination of the
relationships of covariates with input signal and DNA-
seq background revea ls differences in the effects of cov-
ariates within each (Figure S4 in Additional file 1). In
the case of RN A Pol II (Figure S4a, b in Additional file
1) and CTCF (Figure S4c, d in Additional file 1), where
the estimated relationship of G/C content with back-
ground DNA-seq signal is positive, in the matching
input control sample the relationship with G/C content
is relatively neutral. The reason for these differences is
currently unknown, but may be related to sa mple hand-
ling differences between the ChIP and input samples.
Incorporation of a covariate for copy number allows peak
calling within amplified genomic regions
One challenge for the analysis of DNA-seq data is fluc-
tuations in background signal resulting from copy num-
ber variations (CNVs). If not properly accounted for,
such changes in background can result in significant false
positives. This is especially true if there are no input con-
trol sampl es for compar ison, or if the input control sam-
ples are insufficiently sequenced. To account for this, we
constructed a new covariate to measure local back-
ground, and included this covariate in our mixture
regression framework to account for local copy number
changes. Changes in background signal levels due to
CNVs were estimated locally using the DNA-seq sample
itself, supplemented by a change-point detection method
to determine boundaries of likelyCNVs(Materialsand
methods). Application of this approach provided an accu-
rate estimation of signal changes due to local CNVs i n a
FAIRE-seq MCF-7 dataset, which is aneuploid and has
extensive CNVs [33] (Figure 4a).
Using a BIC-selected model considering the local back-
ground estimate, G/C content, and mappability score as
starting covariates, we found ZINBA was able to correctly
classify background regions within CNVs (Figure 4b) and
called 8 and 11 times fewer peaks (1,258) using a FAIRE-
seq dataset in MCF-7 CNV regions in chromosome 20
[34] relative to MACS [5] and F-seq [35] (Figure 4c).
Incorporation of this covariate also leads to the better
recovery of relevant peak regions within ENCODE [36]
datasets, as we demonstrate in later sections.
Estimation of local background from the experimental
data is only effective when local background is sampled
from a sufficiently large window size, where these large
windows (default 100 kb) will not be dominated by
enriched signal. This is the case with the majority of data
types, as most contain enriched features that span no
more than several kilobases. In any case, the flexibility of
ZINBA allows for CNV estimates from any source to be
included into the model selection procedure and
Rashid et al. Genome Biology 2011, 12:R67
/>Page 6 of 20
determination of enrichment. ZINBA also includes a ‘CNV
mode’, which can be run on input DNA for a quick esti-
mation of the extent o f amplified genomic regions in a
given sample. This mode utilizes 10-kb windows in the
ZINBA mixture model without any covariates, aiming to
detect extended region enrichment of input reads.
Evaluation of ZINBA over a wide range of signal patterns
and amplitudes
We selected a variety of DNA-seq datasets, including
FAIRE-seq, CTCF, RNA Pol II, and H3K36me3 ChIP-
seq, to compare the performance of ZINBA with other
existing methods across a range of signal-to-noise ratios,
GC Map Input GC*Input
0.0 0.1 0.2 0.3 0.4 0.5
Standardized background
coefficients
GC Map BG Map*BG
0.0 0.2 0.4 0.6
0.0 0.2 0.4 0.6 0.8
02468
Median regression line
K562 Pol II ChIP−seq
(Ln window read count)
GC content
0.0 0.2 0.4 0.6 0.8
02468
Median regression line
K562 FAIRE−seq
(Ln window read count)
GC content
(
a
)(
b
)
(
c) (d)
Standardized background
coefficients
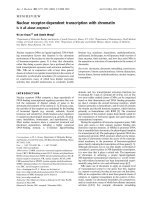
Figure 3 Estimates of covariate effects differ among DNA-seq data types. (a, b) Estimates for the set of BIC selected covariates for th e
background components of the (a) RNA Pol II ChIP-seq and (b) FAIRE-seq data from chromosome 22 in K562 cells. The set of covariates was
standardized to a mean of 0 and variance of 1, which included G/C content (’GC’), mappability score (’Map’), the local background estimate
(’BG’), and input control (’Input’). The G/C content covariate (yellow bars) had an opposing effect on the background component for the RNA Pol
II (positive) (a) and FAIRE (negative) (b) data. (c, d) Density plots of G/C content (x-axis) versus the natural log of window read count (y-axis) in
non-enriched windows (enrichment posterior probability < 0.50) from the (c) RNA Pol II and (d) FAIRE data. Median regression lines fit to the set
of background windows from each dataset parallel the ZINBA-estimated relationships between G/C content and signal in background regions.
Rashid et al. Genome Biology 2011, 12:R67
/>Page 7 of 20
patterns of enrichme nt, and proportion of total genomic
enrichment. For example, CTCF ChIP-seq da ta exhibit
punctate, high signal-to-noise ratio peaks, FAIRE-seq
data have broader, low signal-to-noise ratio peaks, and
RNA Pol II ChIP-seq data contain a mixture of punctate
high sign al-to-noise and diffus e low signal-to-nois e
peaks. H3K36me3 enrichment encompasses very broad
domains of many kilobases, extending over large por-
tions of transcribed regions. For each dataset, we applied
the automated model selection tool to determine the set
45,000,000 46,000,000 47,000,000
0 500 1000 1500
Base pair position
(Chr 20)
MCF−7 FAIRE−seq
Window read count
Local BG
Estimate
MCF−7 FAIRE−seq
Probability of belonging
to enrichment component
chr20:
20 Mb
5,000,000
15,000,000
25,000,000
35,000,000 45,000,000
55,000,000
MCF7 FAIRE-seq
75
0
chr20:
F-Seq Peaks
100 kb
45,300,000 45,350,000 45,400,000 45,450,000 45,500,000 45,550,000
MACS Peaks
75
0
MCF-7 FAIRE-seq
1000
0
MCF-7 FAIRE-seq (extended Y-axis)
(
a
)(
b
)
(c)
ZINBA Peaks
0 100 200 300 400 500 600
0.0 0.2 0.4 0.6 0.8 1.0
Read
overlap
Read
overlap
Window read count (Chr 20)
Figure 4 Covariate-mediated adjustment of classification aids in the discriminat ion of background and enriched regions. (a) The local
background (BG) estimate (red line) approximates a CNV detected by FAIRE-seq (black line) within a 2-Mbp region of chromosome 20 in MCF-7
cells. (b) Density plot of the window read counts for FAIRE-seq data in MCF-7 (chromosome 20) versus the posterior probability of a given
window being classified as enriched, which included the local background estimate as a covariate in the ZINBA model formulation. The red box
highlights a set of windows with high read counts (CNV background) being assigned a low posterior probability of being enriched. (c) The read
overlap representation of MCF-7 FAIRE-seq data for all of chromosome 20 (top row) is displayed in the UCSC Genome Browser. The bottom
panels zoom in on the black box outlining a CNV (same as panel (a)). Here a set of peak calls by F-Seq, MACS and ZINBA are shown as black
boxes along with the FAIRE-seq data displayed using either an extended (top) or standard y-axis.
Rashid et al. Genome Biology 2011, 12:R67
/>Page 8 of 20
of component-specific covariates to model each dataset
(Materials and methods).
ZINBA was compared with MACS [5] and F-Seq [2],
which represent two classes of peak calling algorithms
that also do not require an input control sample to call
regionsofenrichment.MACS[5]representsaclassof
algorithms that uses a sliding window approach for the
detection of enriched regions compared to a matching
input control sample or local b ackground estimate. F-
Seq [17] represents a class of algorithms that use kernel
density estimation to estimate local read density and
identifies enriched regions as those with a kernel density
estimation larger than a user-defined threshold, which is
estimated using simulations assuming random assort-
ment of sample reads.
For each algorithm, the top N set of ranked peaks
(500, 1,000, 2,000, and so on) were selected. The perfor-
mance of each was evaluated by calculating the average
peak length, the proportion of peaks overlapping a set
of biologically significant features (within 150 bp) and
the average distance to these features. For ZINBA, the
set of unrefined peak calls (merged enriched windows)
and refined peak calls (boundaries of punctate peaks
within merged regions) were evaluated separately to
determine their relative utility in each dataset. For the
H3K36me3 data, we utilized the ZINBA ‘bro ad’ setting
(Materials and methods) to capture regions of enrich-
ment that may extend for many kilobases.
All algorithms perform comparably for the analysis of
punctate high signal-to-noise datasets
For the CTCF ChIP-seq data set, the set of ranked peaks
for each algorithm was compared to the occurrence of
the CTCF motif (JASPAR motif MA0139.1). The gen-
ome-wide set of motifs was identified using FIMO, part
of the MEME suite [37], with default parameters. All of
the algorithms were able to identify a high proportion of
sites containing the CTCF motif (Figure 5a) and had
comparable peak lengths (Figure 5c). Positioning of
peaks called by ZINBA was slightly closer to the CTCF
motifs (Figure 5b). These results are consistent with
other comparisons of ChIP-seq peak calling algorithms
[17], which revealed few differences in sensitivity and
specificity when applied to high signal-to-noise ChIP-
seq data . Of the 50,228 refined peaks called by ZINBA,
95.2% were in common with MACS (60,135 peaks) and
99.9% were in common with F-seq (276,879 peaks).
The set of broad and punctate peaks identified by ZINBA
for RNA Pol II ChIP-seq data reflects the elongation status
of the polymerase
One unique feature of RNA Pol II ChIP-s eq data is that
enrichment consists of both punctate high signal-to-
noise ratio peaks at transcription start sites (TSSs) and
broader, low signal-to-noise peaks into the body of
genes [4]. All of the algorithms were able to capture a
large proportion of annotated TSSs (Figure 5d, e; Figure
S5a in Additional file 1). However, the set of refined
peaks called by the shape detection algorithm within
ZINBA resulted in a set of narrower peaks much more
closely as sociated with the TSSs of genes (Figure 5e, f)
compared with MACS, F-Seq, and unrefined ZINBA
peak calls. A relatively high degree of overlap can be
seen between each of the peak sets, although the overlap
isnotasstrongcomparedtothoseobservedforthe
CTCF dataset (Figure S5b in Additional file 1).
The ability to produce both a refined (punctate) and
unrefined (broad) set of peak calls using ZINBA pro-
vides an opportunity to infer elongating versus stalled
RNA Pol II. For the case of stalled RNA Pol II, one
would expect a punctate peak at the TSS, but no broad
peak within the body of the gene [38]. Under this expec-
tation, we computed a ‘ stalling score’ (Materials and
methods), where smaller values correspo nd to a broad
high-amp litude signal across the gene, and larger values
to a punctate signal near the 5’ end of the gene and
lower-amplitude signal along the gene body. Previous
computations of RNA Pol II stalling scores utilized a
height ratio between the punctate peak at the TSS and
the median height of the broader region [39] (Figure
S6a in Additional fil e 1). Using ZINBA, our stalling
score further incorporates the lengths of the broad and
punctate enriched regions found in the experimental
sample. The stalling index had a strong negative rela-
tionship (P-value < 10
-10
) to the expression of the
nearby gene (Figure S6b in Additional file 1) and
explained more of the variance in measured gene
expression (R
2
= 3.5%) than a score utilizing only the
ratio of punctate to broad signal height (R
2
= 0.04%).
The ability to calculate this metric reflects one potential
use of the peak boundary refinement module within the
ZINBA framework.
ZINBA accurately identifies regions of enrichment in low
signal-to-noise datasets without the use of input for
background estimation
FAIRE-seq [3,40] differs from ChIP-seq in that it is an
antibody-free method that recovers DNA fragments that
are relatively resistant to formaldehyde crosslinking to
proteins. The crosslinking profile of chromatin is likely
dominated by histo ne-DNA interactions, and therefore
the sites preferentially recovered by FAIRE correspo nd to
sites of nucleosome depletion. On average the size of
each FAIRE site corresponds to the loss of approximately
one nucleosome (200 to 300 bp). Compared to the bind-
ing events identified for TFBSs by ChIP-seq, the FAIRE-
seq sites tend to have much lower signal-to-noise, have a
slightly broader pattern of enrichment, and encompass a
larger proportion (1 to 2%) of the genome. In addition,
input control is often not available. Therefore, many of
the assumptions utilized by existing algorithms, especially
Rashid et al. Genome Biology 2011, 12:R67
/>Page 9 of 20
(
a
)(
b
)(
c
)
(d) (e) (f)
(g) (h) (i)
ZINBA refined ZINBA unrefined MACS F-Seq
ZINBA refined ZINBA unrefined MACS F-Seq
0 10,000 30,000 50,000
0.0 0.2 0.4 0.6 0.8 1.0
Proportion of calls within
150 bp of CTCF motif
Number of top CTCF peak calls
(cumulative )
0 10,000 30,000 50,000
20 30 40 50
Average distance to motif
(given within 150 bp)
Number of top CTCF peak calls
(cumulative )
5,000 10,000 15,000 20,000
0 200 400 600 800 1000
Mean CTCF peak length
Number of top CTCF peak calls
(cumulative )
0 5,000 15,000 25,000
0.0 0.2 0.4 0.6 0.8 1.0
Proportion of calls within
150 bp of TSS
Number of top Pol II Peak Calls
(cumulative )
0 5,000 15,000 25,000
55 60 65 70
Average distance to TSS
(given within 150 bp)
Number of top Pol II peak calls
(cumulative )
0 500 1500 2500
Mean Pol II peak length
Number of top Pol II peak calls
(cumulative )
5,000 10,000 15,000 20,000
0 10,000 20,000 30,000 40,000
0.0 0.2 0.4 0.6 0.8 1.0
Proportion of calls within
150 bp of DHS
Number of top FAIRE peak calls
(cumulative )
0 10,000 20,000 30,000 40,000
40 45 50 55 60 65 70
Mean distance to DHS
(given within 150 bp)
Number of top FAIRE peak calls
(cumulative )
0 1000 3000 5000
Mean FAIRE peak length
Number of top FAIRE peak call
s
(cumulative )
5,000 10,000 15,000 20,000
ZINBA refined ZINBA unrefined MACS F-Se
q
Figure 5 Robust detection of biologically relevant features across a variety of DNA-seq data types by ZINBA. (a-i) For CTCF ChIP-seq (a-
c), RNA Pol II ChIP-seq (d-f) and FAIRE-seq (g-i) data, the top N ranked peaks from MACS (red dashed line), F-Seq (green dashed line) and ZINBA
unrefined regions (light blue dashed line), and ZINBA refined regions (blue solid line) were compared based on the proportion overlapping a
biologically relevant set of features (a, d, g), average distance to the biologically relevant set of features (b, e, h) and average length of peaks (c,
f, i). The biologically relevant set of features included the CTCF motif (a), transcription start sites (TSSs) for RNA Pol II (d) and DNase
hypersensitive sites (DHSs) for FAIRE (g).
Rashid et al. Genome Biology 2011, 12:R67
/>Page 10 of 20
for the analysis of TFBS ChIP-seq, are not well-suited to
the analysis of this data type [22].
We analyzed a K562 FAIRE-seq dataset lacking a
matching input control sample with each algorithm, and
compared the resulting set of peaks from each algorithm
to a set of DNase I hypersensitivity sites (DHSs) [31,32]
isolated from the exact same set of cells. The DHSs
were called b y F-seq, and were selected as a standard
because of the l ongstanding use of DNase as a method
for identification of open chromatin sites. Both ZINBA
and MACS called a high proportion of FAIRE sites that
overlapped a DHS, but a low propo rtion of FAIRE sites
called by F-seq were l ocalized to a DHS (Figure 5g).
The set of sites called by both MACS and F-Seq tended
to be longer and more errant in K562 CNV regions
[31,32] (Figure S7a in Additional file 1), where approxi-
mately 37% of MACS and 27% of F-seq peaks were loca-
lized to a DHS, compared to 50% of ZINBA peaks.
Overlap between called peak sets from ZINBA, MACS,
and F-seq for FAIRE were more disparate than those
found in high signal-to noise CTCF data (Figure S7b in
Additional file 1).
Open chromatin r egions tend to have strong corre-
spondence to active regulatory elements and promoter
regions of expressed genes [40]. Comparison of the set
of ZINBA RNA Pol II and FAIRE-seq refined peak calls
yielded a significantly higher d egree of overlap com-
pared to the other algorithms (Figure 6a), indicating
consistency in ZINBA peak calls across data types.
ZINBA captures broad patterns of enrichment
The deposition of H3K36me3 is mediated by enzymes
that travel along with RNA Pol II during transcriptional
elongation, and therefore this histone modification typi-
cally occurs in broad segments encompassing a large pro-
portion of gene bodies [41]. Utilizing the ‘broad’ ZINBA
setting (Materials and methods), the H3K36me3-
enriched regions identified by ZINBA correspond to the
broad patterns of enrichment covering actively tran-
scribed gene bodies, as expected.
On average, 80% of the lengths of the top ‘N’ most
active UCSC gene bodies were covered by the set of
H3K36me3 ZINBA peaks (Materials and methods; Fig-
ure 6b). A lower level of gene body coverage was found
from other methods. Of the 40,180 H3k36me3 merged
ZINBA peaks, 71% overlap a gene body, compared with
only 59% of F-seq peaks merged in a simi lar fashion,
suggesting higher specificity of these b road ZINBA
regions to gene bodies. Of the set of ZINBA merged
peak calls that overlapped a gene body, the median and
75th percentile of peak lengths was 5,374 and 18,370 bp
respectively, indicative of the broader set of features that
are being called (Figure S8 in Additional file 1).
Within the set of H3K36me3 enrichment regions
identified by ZINBA, those that overlap ZINBA RNA
Pol II broad regions also contain significantly higher
levels of RNA expression compared to those that do not
overlap broad RNA Pol II regions (Figure 6c). Approxi-
mately 85% of ZINBA H3K36me3 broad regions that
overlap a ZINB A RNA Pol II broad region contain non-
zero RNA-seq signal (7,585 out of 8,873 overlapping
regions), compared to only 58% of those that do not
(18,134 ou t of 31,312 non-overlapping regions). Further-
more, of ZINBA H3K36me3 regions with non-zero
RNA-seq signal, those that overlapped a ZINBA RNA
Pol II broad region had three-fold higher median RNA
expression. The relationships we observe among our
ZINBA calls recapitulates the biology of H3K36me3,
where higher levels RNA Pol II activity correspond to
higher levels of RNA transcription and histone modifica-
tion (Figure 6d).
ZINBA performs comparably with or without input
control data
Comparison of ZINBA peak c alls from BIC-selected
models consider ing input as a covariate versus th ose that
do not reveal similar performance in isolating rele vant
enriched regions. For example, 94% of the CTCF ChIP-
seq peaks discove red using a model that included input
(Table S1 in Additional file 1) were held in common with
a model considering only G/C content, mappability
score, and the local background estimate as starting cov-
ariates. Recovery of sites overlapping a CTCF motif was
also very similar (Figure S9a in Additional file 1). This
similarity in performance with and without input
extended to the lower signal-to-noise H3K36me3 ChIP-
seq data (Figure S9b in Additional file 1). Because of the
broad nature of H3K36me3 enrichment, we only consid-
ered G/C content and the mappability score as potential
covariates in the no-input model. These results demon-
strate the ability o f ZINBA to distinguish regions of
enrichment from background in the absence of input
control.
Modeling enrichment covariates is especially beneficial in
low signal-to-noise data
Choosing not to model covariates in the enrichment
component (Table S1 in Additional file 1) resulted in
almost uniform decreases in model confidence in the
classification of ‘ enriched’ windows rela tive to when
enrichment covariates are considered (Figure S10 in
Additional file 1). This is especially severe in the low sig-
nal-to-noise FAIRE and H3K36me3 dataset (Figure S10a,
b i n Additional file 1), in contrast to the higher signal-to-
noise CTCF data (Figure S10c Additional file 1). In
H3K36me3 data, significantly fewer windows in chromo-
some 22 were classified as enriched over background
(posterior probability of enrichment greater than 0.5)
when enrichment covariates are ignored. Applying this
Rashid et al. Genome Biology 2011, 12:R67
/>Page 11 of 20
50 kb
57,200,000 57,250,000 57,300,000 57,350,000
ZINBA FAIRE peaks
ZINBA RNA Pol II Peaks
ZINBA H3K36me3 peaks
RNA-seq signal in K562 cells (RPKM)
H3K36me3 ChIP-seq signal in K562 cells
RNA Pol-II ChIP-seq signal in K562 cells
FAIRE-seq signal in K562 cells
UCSC genes
(
a)
(c)(b)
(
d)
0
0
203
0
0
31
2.8
Read overlap Read overlap Read overlap
RPKM
38
ZINBA MACS F-SEQ Random
ZINBA MACS
F-SEQ
ZINBA (merged)
ZNF615 638FNZ616FNZ148FNZ234FNZ416FNZ
K36 regions
No Pol II overlap
K36 regions
Pol II overlap
Proportion of uniquely
overlapping FAIRE peaks
Number of top Pol II peak calls
(cumulative)
by H3K36me3 peaks
Average gene coverage
Number of genes sorted by activity
(high to low, cumulative)
Measured gene activity
(mean RPKM)
Figure 6 ZINBA calls broader regions of signal and selects sets of peaks that are coherent across datasets. (a) The proportion of the top
cumulative sets of MACS (red dashed line), F-Seq (green dashed line) and ZINBA refined (light blue line) RNA Pol II peaks that uniquely overlap a
FAIRE-seq peak called by the respective method. For comparison, overlap was also compared using randomly permuted RNA Pol II and FAIRE-
seq ZINBA peak calls (black dashed line). (b) The average coverage of the cumulative sets of the top N ranked genes (expression, high to low)
by H3K36me3 regions called by MACS (red dashed line), F-Seq (green dashed line) and ZINBA unrefined regions (light blue dashed line). The set
of unrefined ZINBA H3K36me3 regions were further clustered throughout the genome to merge nearby peaks (blue solid line) and compared to
the ranked list of genes in terms of gene body coverage. (c) Comparison of measured gene expression levels for the set of ZINBA H3K36me3
broad regions that either did or did not overlap a ZINBA RNA Pol II broad region. Those overlapping a ZINBA RNA Pol II broad region had three-
fold higher median levels of measured gene expression than H3K36me3 regions that did not have any overlap. (d) Representative view of the
set of H3K36me3 broad, FAIRE-seq refined and RNA Pol II refined ZINBA peak calls displayed in the UCSC Genome Browser along with the
respective read overlap data. For reference, the set of genes (top row) and RNA-seq data (second row) are included. RPKM, reads per kilobase
per million mapped reads.
Rashid et al. Genome Biology 2011, 12:R67
/>Page 12 of 20
model genome-wide, we find that 60% fewer windows
were called at the default threshold prior to window mer-
ging, and post-merging we observe much lower coverage
of active gene bodies (Figure S9a in Additional file 1), in
contrast to CTCF peaks, which change little as a result of
ignoring enrichment covariates (Figure S9b in Additional
file 1). These results and the simulated data suggest that
utilizing covariates provide an increased discriminatory
power for distinguishing background and enriched
regions, especially in low signal-to-noise data or when
information such as an input control is lacking.
Discussion
A major challenge in the analysis of genomic experi-
ments that employ NGS technology for detection is the
reliable integrat ion of information across a multitude of
assays and data types, where such integration would
provide a more complete picture of genome-wide cellu-
lar regulation. We have developed a st atistical frame-
work named ZINBA that addresses these issues by
providing a platform that is flexible enough to identify
genomic regions of enrichment for a variety of DNA-
seq data types and signal patterns. ZINBA can also uti-
lize pot entially informative covariates to aid in the clas-
sification of genomic regions as like ly ba ckground,
enrichment, or zero-inflated regions.
Application of our approach resulted in the recovery of
relevant enriched sites across a wide variety o f data types
without the need for extensive user input to the analysis
procedure. In addition, we show that ZINBA peak calls
across different sets of d ata are highly consistent with
known biological processes (Figure 6). Enriched regions
can be identified in challenging situations, such as in the
absence of input control or within DNA copy number
amplifications. In the absence of input control, utilizing
other covariates yielded similar results as to when input
was used in real data.
Previous studies have commented on the non-random
nature of background signal in ChIP-seq data [4,27], and
that accounting for t his non-randomness can improve
modeling of background regions and the ability to detect
regions of enrichment. In some peak-finding applications,
background models assume signal is complet ely random,
and loci with signal greater than this background are
deemed as enriched [2,6]. In datasets where certain cov-
ariates have strong effects on background signal, this
assumption of randomness is violated. Thus, methods
relying on this assumption may result in lower sensitivity
and lower specificity to de tect enriched sites. Our results
suggest that this non-randomness may be due in some
part to the effects of certain covariates, and their effects
on signal may vary depending on the data being analyzed.
We account for t his non-random ness by modeling bac k-
ground signal with multiple covariates.
The mixture regression framework used in ZINBA is a
natural way to accommodate arbitrary sets of relevant cov-
ariates, probe for their relationships with component-spe-
cific signal, and account for their effects without the need
for user specificati on of the proportion of background in
the sample. One of the inherent advantages of our regres-
sion-based approach is that read sample and input read
counts do not need to be normalized or scale d, and read
coverage is accounted for by each component’s regression
model. This modeling approach is preferable over normal-
ization procedures that adjust for covariate effects prior to
enrichment detection for two reasons. First, these normali-
zation procedures assume the covariates have the same
effect on both ba ckground and enrichment signals, and
thus normalize signal across each region in a similar man-
ner. Second, these procedures cannot naturally account
for the effects of multiple covariates simultaneously, which
is an inherent feature in a regression framework. It is
unknown to the user the impact of such normalization
procedures on sensitivity, as the effects of covariates may
vary between datasets or between background and
enriched regions.
As high-throughput sequencing technology matures, the
ZINBA framework can allow for the continued evaluation
of existing covariates and the addition of new covariates to
model DNA-seq data. Examples of additional potential
covariates could be scores for the presence of transcription
factor motifs, strand cross-corre lation, or local overlap with
a particular feature of interest. While not implemented
currently, we can easily apply our ZINBA to paired-end
reads by assigning a paired-end read to a window if the
center of the paired end read belongs to t his window.
A major drawback to our approach is the computation-
ally intensive model selection process via BIC. We are
currently developing a variable selection procedure based
on penalized likelihood that will be able to efficiently
select component variables. There are also several general
fact ors that affect all methods regardless of the modeling
assumptions used. One such covariate is the sequencing
depth of a DNA-seq sample, which is directly related to
the sensitivity of the assay to detect enriched sites [14].
Often overlooked, however, is the sequencing depth of
the matching input control sample, which typically
requires greater sequencing depth to obtain coverage
levels similar to the experimental sample.
Conclusions
Two major challenges in the analysis of DNA-seq data are
the diversity in signal patterns that exist across the wide
range of possible experiments, and sample-specific issues
such as CNV that may further complicate analysis. ZINBA
is a flexible statistical framework capable of identifying
regions of enrichment across a wide va riety of DNA -seq
data types, enrichment patterns, and experimental
Rashid et al. Genome Biology 2011, 12:R67
/>Page 13 of 20
conditions. ZINBA’s flexibility in modeling background
and enrichment regions with sets of co variates allow s for
the identification of enriched regions in difficult modeling
conditions, such as in datasets with complex local CNVs
or lacking a matching input control sample. ZINBA can
identify both broad and sharp regions of enrichment, and
we demonstrate this capability in differentiating RNA Pol
II elongation status. In addition, the statistical framework
used is applicable to both high signal-to-noise data such as
from CTCF ChIP-seq, as well as to low signal-to-noise
data such as from FAIRE-seq. ZINBA produces peak calls
that are consistent with known biological patterns, and
performs favorably relative to existing specialized methods
over a b road range of signal patterns and data types.
ZINBA is implemented as a freely available R package.
Materials and methods
Datasets and model parameters
All data were produced by members of the E NCODE
Consortium [31,32] and downloaded as ali gned reads
(tagAlign) from the UCSC Genome Browser. The FAIRE-
seq, RNA Pol-II ChIP-seq, and H3K36me3 ChIP-seq data-
sets were derived from K562 cells while the CTCF ChIP-
seq dataset was derived from GM12878 cells. For data
access and generation method s see Additional file 2. The
MCF-7 FAIRE-seq data are not yet available through
ENCODE, but access to the relevant portions of the data
can be found in Additional file 2. All data were analyzed
within ZINBA using 250-bp windows and an additional
offsets of 125 bp. The set of covariates and all possible
pair-wise and three-way interactions were evaluated using
the BIC, with the best scoring model formulation being
selected for subsequent downstream analyses. For the
RNA Pol II, CTCF, and H3K36me3 ChIP-seq datasets we
considered G/C content, mappability score, and input con-
trol as starting covariates in our model selection procedure
unless stated otherwise. For FAIRE, we only considered G/
C content, mappability score, and the local background
estimate.
ZINBA step 1: data preprocessing
Calculation of signal values
Raw NGS data are composed of milli ons of relatively
shor t (25 to 75 bp) reads aligned to a reference genome
sequence. A sequenc e read often does not represent the
entire DNA fragmen t recovered with a given assay, but
instead one or both ends of the fragment. Therefore, for
single-end reads we attempt to approximate the center
of each DNA fragment by ext ending the coordinates for
each aligned read in the 3’ direction to the average frag-
ment length. For each ChIP-seq dataset, we used an
average fragment length of 200 bp, and 134 bp for our
FAIRE-seq d ataset. The average fragment can be either
specified by the user or estimated from the data directly
using the cross-correlation function [14] implement ed
in ZINBA. All subsequent references to a read refer to
the extended coordinates, and raw reads refer to the
original coordinates.
The genome-wide set of reads is summarized as the
count of reads within a set of contiguous non-overlap-
ping windows. Each read is assigned to a single genomic
position based on the position of the central base. To
avo id bisecting a potentially significant region, a similar
set of contiguous non-o verlapping windows can be pro-
duced that are offset from the starting position by a
user specified distance.
Calculation of covariate values
A series of covariates are scored for each window, which
include G/C content, mappability score, a local back-
ground estimate, and read counts from an input control
sample (if available). The G/C content is calculated as
the proportion of G and C bases in a given window.
The tabulation of window read counts from the input
control sample is handled exactly as reads from the
experimental sample.
The mappability score is calculated as the proportion
of all bases withi n a window that met the criteria for
uniqueness imposed during alignment of the raw reads.
Typically, raw reads will only be aligned to positions
that are unique throughout the genome. However, in
some instances a more relaxed criterion may be used,
such as with the FAIRE-seq data where raw reads could
be aligned to a position that occurred four or less times
throughout t he genome. ZINBA i mplements the mapp-
abilitysoftwareprovidedbyPeakSeq[28]tocalculate
for each base pair the number of times a given k-mer
(36 bp) starting at that base occurs throughout the gen-
ome. If a base pair receives a score of 1, then only one
occurrence of the given k-mer exists throughout the
genome and would be a mappable position under the
absolute uniqueness criteria. Whereas if a base pair
received a score of 5, then it would not be considered
mappable for either the uniqueness or the relaxed cri-
teria described above. Before the mappability scores are
summarized into the windows, those bases that meet
the specified criteria are assigned a new score of 1,
while those that do not are assigned a new score of 0.
Finally, since the central positio n of each extend ed read
is used for wind ow assignment, the mappability data are
shifted in the same way, where for each base the score
of 0 or 1 is shifted both plus and minus one half the
average fragment length. As a result, each ba se in the
genome has a score of 0, 1 or 2 depending on whether
neither, one or both of the up- and downstream base
pairs were mappable, respectively. The sum of mappabil-
ity scores is tabulated and divided by two times the win-
dow size to derive the proportion of mappable bases in
the window.
Rashid et al. Genome Biology 2011, 12:R67
/>Page 14 of 20
The local background estimate aims to roughly
approximate large-scale fluctuations in background sig-
nal resulting from local variations in genomic copy
number. It is calculated using a sliding window
approach where, by default, 100-kb windows are stepped
every 2.5 kb across each chromosome. The size of these
large windows was selected to be sufficiently large to
prevent sites of enrichment from influencing the esti-
mate, but small enough to preserve enough resolution
to capture local fluctuation in background signal. The
number of r eads per mappable base pair is calculated
for each window. Windows that span the boundaries of
CNVs are problematic, resulting in artificially inflated
and deflated estimates of local background. Therefore,
an additional step is employed to identify these change
points and any windows straddling these boundaries are
removed (Additional file 2). For each ZINBA window,
which is considerably smaller than 100 kb, the local
background estimate is computed as the average nu m-
ber of reads per mappable base for all overlapping
100-kb windows, multiplied by the length of the ZINBA
window.
ZINBA step 2: data analysis
Because of the discrete nature of window r ead counts,
this summary of the data can be modeled by either the
Poisson or the negative binomial distribution. The nega-
tive binomial distribution can be considered as an exten-
sion of Poisson distribution to handle over-dispersion,
that is, the situation where the variance of the counts is
larger than expected by a Poisson distribution. Instead of
using a single Poisson or negative binomial distribution,
we find that our approach of modeling DNA-seq data by
a mixture of negative binomial distributions provides an
adequate representation of the data (Figure S11 in Addi-
tional file 1)
Mixture regression to select enriched regions
The mixture regression model is implemented using an
EM algorithm [29] that consists of four major steps:
initialization, expectation-Step, maximization-Step, and
convergence checking. Given a model file from ZINBA
step 1, windows that meet a user-defined enrichment
posterior probability threshold are selected in the fol-
lowing manner (mathematical details are given in Addi-
tional file 2).
Model in itialization Initialization of the EM algorithm
is the assignment of initial component memberships for
each window. Each window has an associated posterior
probability vector (τ
i0
, τ
i1
, τ
i2
) describing its po sterior
probability of belonging to each component, where for
window i, 0 corresponds to the zero-inflated compo-
nent, 1 corresponds to the background component, 2
corresponds to the enrichment component, and τ
i0
, τ
i1
,
τ
i2
= 1. To initialize the model parameters, we create sev-
eral starting partitions of the data and use these parti-
tions to determine the initial values of model
parameters for each component. Under the assump tion
that enrichment signal is generally larger than back-
ground signal, windows with largest window read counts
are assigned to the enrichment component such that
(τ
i0
, τ
i1
, τ
i2
) = (0,0,1). Multiple starting partitions are
generated such that 0.1%, 1%, 5%, 10%, and 15% of the
largest windows in terms of read count are assigned to
the enrichmen t component, and all other windo ws with
non-zero window read counts are assigned to back-
ground. All windows with zero read counts are as signed
to the zero-inflated component. For each partition we
run the EM algorithm multiple times cycling between
the E and M steps and choose the par tition that pro-
vides the best fit.
M-step In the maximization-step (M-step), we apply
weighted GLMs to each component, where τ
i0
, τ
i1
and
τ
i2
are used as the weights of the i
th
window in the cor-
responding component. These weights represent current
knowledge of the probabilistic classification of a window
into each component and are updated in the E-step.
Window counts in the enriched and background com-
ponents are modeled using weighted negative binomial
regression, a llowing for over-dispersion in the distribu-
tion of window read counts.
The prior pro bability that a windo w is zero-inflated
π
i0
is directly modeled using weighted logistic regression.
By using τ
i0
, τ
i1
,andτ
i2
as regression weights for the
zero-inflated, background, and enriched regression mod-
els, respective ly, we are able to partition the s ame win-
dow count across three regression models in a manner
proportional to the likelihood that it belongs to each
component. For example, windows with a zero-inflation
weight of 0, background weight of 1, and enrichment
weight of 0 will contribute only to the estimation of the
background regression model. Each weighted G LM is
maximized using the iteratively reweighted least squares
algorithm. At the end o f this step, we have estimates of
the component-specific covariate effects and the propor-
tion of data belonging to the background and enrich-
ment components (denoted by π
1
and π
2
, respectively).
These two proportions are derived from τ
1
= τ
11
, τ
21
,
τ
n1
and τ
2
= τ
12
, τ
22
, τ
n2
, the vector of window posterior
probabilities corresponding to enrichment and back-
ground, respectively.
E-step In the Expectation-step (E-step), we update the
posterior probability of component membership τ
i0
, τ
i1
,
and τ
i2
for each window given the regression estimates
from the M-step. Given the read count of a window y
i
and an associated covariate vector X
i
,weupdate(τ
i0
, τ
i1
,
τ
i2
) at iteration k such that:
Rashid et al. Genome Biology 2011, 12:R67
/>Page 15 of 20
τ
(k)
i0
=
π
(k)
i0
(X
i0
, γ
(k)
)f
0
y
i
Total
i
τ
(k)
i1
=
1 − π
(k)
i0
X
i0
, γ
(k)
π
(k)
1
NB
1
y
i
, μ(X
i1
, β
(k)
1
), θ
(k)
1
Total
i
τ
(k)
i2
=
1 − π
(k)
i0
(X
i0
, γ
(k)
)
π
(k)
2
NB
2
y
i
, μ(X
i2
, β
(k)
2
), θ
(k)
2
Total
i
where
Tot al
i
= π
(k)
i0
(X
i0
, γ
(k)
)f
0
y
i
+
1 − π
(k)
i0
(X
i0
, γ
(k)
)
2
j=1
π
(k)
j
NB
j
y
i
, μ(X
ij
, β
(k)
j
), θ
(k)
j
and
f
0
y
i
=
1 y
i
=0
0 y
i
> 0
is the indicator function that y
i
is equal to zero. Also:
NB
j
y
i
, μ(X
ij
, β
(k)
j
), θ
(k)
j
=
(y
i
+ θ
(k)
j
)
y
i
!(y
i
+ θ
(k)
j
)
θ
(k)
j
θ
(k)
j
+ μ(X
ij
, β
(k)
j
)
θ
(k)
j
μ(X
ij
, β
(k)
j
)
θ
(k)
j
+ μ(X
ij
, β
(k)
j
)
y
i
corresponding to the negative binomial distributions
for the background component (j = 1) and the enrich-
ment component (j = 2). The predicted mean for each
window
μ(X
ij
, β
(k)
j
)
is dependent on the estimate of the
component-specific covariate effects
β
(k)
j
,thesetof
component-specific covariates for window iX
ij
, and
θ
(k)
j
is the estimate for the dispersion parameter in compo-
nent j.Thevalue
π
(k)
i0
(X
i0
, γ
(k)
)
is the prior probability
that a window is zero-inflated given the zero-inflated
covariate estimates g
(k)
from the M-step and associated
set of covariates X
i0
(Additional file 2). Mixture propor-
tions
π
(k)
1
and
π
(k)
2
are defined as before for iteration k.
Each posterior probability τ
i0
, τ
i1
,andτ
i2
can be thought
of as the weighted likelihood that window i belongs to
component j given a windows signal value, set covari-
ates, and the estimated component-specific covariate
relationships with average signal in each component.
Because enrichment makes up a small proportion of the
genome, enrichment covariates generally have a smaller
role in influencing classification because of the smaller
enrichment proportion π
i2
. In iteration k +1,
(τ
(k)
i0
, τ
(k)
i1
, τ
(k)
i2
)
are again used as regression weights for
each component’s weighted GLMs.
Convergence The algorithm cycles between the E-step
and the M-step until the absolute change in model log
likelihood from 10 iterations prior is less than 10
-5
.
Windows with posterior probabilities of enrichment
greater than a user-specified threshold are considered to
be enriched. By default the threshold is 0.95, although
this can be lower ed to 0.5 if needed. Window s with
enrichment posterior probabilities close to 0.5 have
ambiguous membe rship, although the majority of these
probabilities f or BIC selected models tend to be either
close to zero or one (Figure S11b in Additional file 1).
In this modeling framework, there is an inherent
assumption of the i ndependence of neighboring win-
dows; however, in real data, correlations between nearby
windows are to be expected. This correlated structure is
most similar to those found in the analysis of a time ser-
ies of discrete counts, where neighboring counts are cor-
related in a serial fashion. More complicated models,
such as hidden Markov models and related methods
incorporating covariates, would be c omputationally
intensive to implement given the model’scomplexity
[42] and the size of each chromosome. With the default
window size, the number of observations for the smal-
lest chromosome is nearly 134,000 windows. One rea-
sonable assumption of the correlation structure is a
symmetric autoregressive structure such that the corre-
lation between the i
th
window and the l
th
window is r
|i-
l|
,wherer is the correlation parameter to be estimated.
Under this assumption, previous studies have shown
that ignoring local correlation leads to smaller standard
errors of covariates but has little effect on the estimated
covariate effects themselves in GLMs [43,44]. Therefore,
we do not expect correlation to have a significant
impact on covariate estimates; however, we still only
discuss covariate effects in a qualitative fashion.
Selecting relevant covariates using BIC Selecting the
most optimal set of model covariates to achieve the best
classification outcome and model fit is not a trivial task.
ZINBA uses the BIC [30] to choose the most parsimo-
nious set of covariates that best explains the variation
seen within each mixture component. A typical set of
covariates includes the mappability score, G/C content,
and input co ntrol. When sequencing data from an input
control sample are not available, the local background
estimate can be considered to control for local fluctua-
tions in copy number or other changes in local chroma-
tin structure. Higher order pair-wise and three-way
interaction terms a re also included between covariates
when their lower order effects are in the model. For
example, a pair-wise interaction term between G/C con-
tent and mappability score will not be considered if any
one of these two covariates is not included in the
model. Due to the computational cost, the BIC calcula-
tions are performed on a restricted set of chromosomes.
While the resulting model fit may not be optimal, ignor-
ing interaction terms between starting covariates greatly
reduces the numb er of m odels to b e computed under
the BIC procedure. This results in faster processing and
does not adversely impact the recovery of relevant peaks
(Figure S12 in Additional file 1). We also provide an
Rashid et al. Genome Biology 2011, 12:R67
/>Page 16 of 20
additional heuristic that further reduces the number of
models considered by only considering covariates in the
enriched and background components during model
selection. With this heuristic and considering three
starting covariates with interac tion, model selection
takes approximately 4 hours for FAIRE data using eight
2.8 GHz Intel Xeon processors (361 models considered).
Step 3: peak boundary refinement
Isolating exact peak boundaries within merged regions
Following analysis using the mixture regression model,
overlapping or adjacent windows with an enrichment
probability greater than a user-specified threshold
(default 0.95) are merged to form significant regions.
ZINBA employs a shape detection algorithm to analyze
the higher-resolution read overlap data (single base pair
count) within each significant region to identify and
refine the boundaries of potential punctate enrichment
sites. This sequential detection of broader regio ns and
then punctate regions within broader regions allows for
more flexibility in detecting various enrichment patterns.
The shape detection algorithm consists of two steps.
First, the set of local maxima within t he merged signifi-
cant region is identified. Second, the boundaries of
punctate enrichment sites surrounding these local max-
ima are determined. Specifically, local maximums are
determined using a modified matrix-based algorithm
from the massspecwavelet package in R. Local maxima
greater than a user-defined quantile threshold are
retained for boundary refinement. The boundaries are
determined using best linear fit for the read overlap
data on either side of each maximum. For each side, a
simple linear model is fitted originat ing at the maxima
and extending to the base pair position t hat maximizes
the R
2
of the linear model. Any local maxima within N
bp of each other or whose boundaries overlap are
merged into a single peak, where N is 100 bp by default.
The set of chromosomal coordinates for each refined
region is returned along with the position of the local
maxima, the single base pair count score at the maxima,
and the maximum posterior probability of the original
windows within the merged region.
In general, pe ak refinement is most useful when one
expects a mix of punctate peaks within broader regions,
as in RNA Pol II data (Figure S13 in Additional file 1),
where ZINBA peak refinement improves the results of
other software. In CTCF ChIP-seq, refinement does not
make much of a difference, as expected, and in FAIRE,
ZINBA still performs favorably to other methods. In
addition, ZINBA’s peaks have much more favorable cor-
respondence across data types in relation to ZINBA-
refined peaks from other software (Figure S13d in Addi-
tional file 1).
Simulation of data
Zero-inflated, backgr ound, and enriched window counts
are simulated using a two-step procedure. In the first
step, background and zero-inflated window counts are
randomly simulated given a set of pre-specified covari-
ates and their effects. A random subset of background
windows is selected to be enriched and the read counts
of these are adjusted according to conditioning on the
selected covariates for enriched windows if desired.
Let (X
z
,X
B
) be covariate matrices for the zero-inflated
component and background component. The number of
rows in each matrix is the total number of windows
sampled and the number of columns is equal to the
number of chosen covariates plus the intercept. The
covariates could include, for example, mappability score,
G/C content, local background, and read counts from
an input control sample in each window. According to
the modeling assumptions in Additional file 2, the p re-
dicted background mean count of a window is given as
μ
i,B
= exp(X
i,B
ˆ
β
B
)
and the probability that a window
will be zero-inflated is
π
i,Z
=
exp(X
i,Z
ˆγ )
1 + exp(X
i,Z
ˆγ )
,where
( ˆγ ,
ˆ
β
B
)
are pre-specified covariate estimates for the
zero-inflated and background components, respectively.
These pre-specified parameters are taken from a pre-
vious real data analysis in order to simulate realistic
background counts.
For the vector of calculat ed background window
means μ
B
and dispersion parameter
ˆ
θ
B
, a set o f window
counts is simulated using the negative binomial distribu-
tion in R. A window is randomly selected to be zero-
inflated with probability π
i, z
, where windows selected as
zero-inflated are set to 0. To simulate enriched win-
dows, the desired proportion of background wind ows
are randomly selected as enriched. To incorporate rela-
tionshipbetweenthesetofenrichedwindowsandcov-
ariates, such as with G/C content, the count for
enri ched window i is simulated such that Y
i, sim
~ NB(μ
= b×GC
i
+ a, θ
E
), where Y
i, sim
is a random count
from th e negative binomial distribution with mean value
b×GC
i
+ a, and over-dispersion parameter of enrich-
ment θ
E
. The signal-to-noise ratio and the strength of
the G/C content covariate effect on enrichment counts
can be tuned by altering parameters a and b. For exam-
ple, when b is 0 there is no relation between window
read counts and G/C content; otherwise, the sign of b
determines whether G/C content is positively or nega-
tively related to window counts.
Calculation of RNA pol II stalling score
For ZINBA RNA Pol II peaks within 1 kb of genes with
non-zero gene expression, we calculate an RNA Pol II
Rashid et al. Genome Biology 2011, 12:R67
/>Page 17 of 20
‘stalling’ index for each peak such that:
Score
i
=
Length
i,punctate
Length
i,broad
•
Max
Height
i,punctate
+1
Median
Height
i,broad
+1
where Length
i, punctate
is the length of the punctate
peak fo und within a broad ZINBA peak region, Length
i,
broad
is the length of the broader ZINBA peak, MAX
(Height
i, punctate
) is the maximum read overlap height
corresponding to the punctate peak, and Me dian
(Height
i, broad
) is the median read overlap height of the
broader r egion excluding the punctate peak. A pseudo-
count o f 1 was added to the numerator and denomina-
toroftheheightratiotoavoiddividingbyzero.To
determine the relationship between the stalling score
and gene expression (in RPKM (reads per kilobase per
million mapped reads)), a median regression line (robust
to outliers) was fit to the natural log of the gene expres-
sion data using the stalling score as a covariate. To bet-
ter capture broad regions, we merge enriched windows
within 5 kb and then applied the ZINBA peak refine-
ment to these broad region s to obtain the punctate sites
within.
Assessing performance across peak calling algorithms
and datasets
ZINBA, MACS and F-Seq were run using the default set
of parameters with the goal o f calling at least 50,000
peaks. Running MACS on FAIRE-seq data without an
input control sample required the mfold parameter to
be lowered to 10 and the P-value threshold increased to
0.001 to generate enough peaks. For the RNA Pol II
ChIP-seq data the ZINBA posterior probability thresh-
old had to be lowered to 0.5 to generate enough peaks.
The set of ranked peaks for each algorithm was com-
pared to a set of biologically relevant features. Ranked
peaks were used because there was not a straightforward
way to impose a single threshold for all algorithms due
to differences in the assessment of significance (MACS
uses P-values, F-Seq uses kernel density estimate, and
ZINBA uses posterior probability). Peaks were consid-
ered to overlap a biologically relevant feature when the
peak center was within 150 bp, which emphasized loca-
lization at the set of features. The set of metrics related
to overlap, peak length and proximity to features was
carried on an increasing cumulative set of the top N
ranked peaks. It is common for ZINBA regions called as
enriched to have a posterior enrichment probability of
1; therefore, these windows were further differentiated
based on the maximum read overlap score.
Overlap between the FAIRE-seq, RNA Pol II and
H3K36me3 peaks with the set of active genes (UCSC
knownGenes, hg18) was carried out using the
intersectBed function in BEDTools [45] with default
parameters. The broader set of enriched regions called by
ZINBA for the H3K36me3 and RNA Pol II datasets were
collapsed by clustering regions within 5 kb (optional) of
eachotherintoasingleregion.Togenerateasetofran-
dom peaks, the shuffleBed function in BEDTools was
used to randomize the locations of ZINBA enriched
regions, while maintaining localization on the same chro-
mosome and ignoring centrometric regions using the
-chrom and -excl options.
Gene activity was measured as the isoform with the
maximal value contained within UCSC gene bodies
using RNA-seq data (RPKM), where a gene body wa s
defined as from transcription start to stop. Therefore,
each gene was assigned a signal score based on this
measured value. Then, the average coverage by
H3K36me3 peak regions of the set of N most active
gene bodies by this measure was calculated using the
coverageBed function in BEDTools for each method.
Software implementation
ZINBA ( version 2.0) is implemented as an R package
(Additional file 3), and upd ated versions can be accessed at
the software website [46]. The core of the mixture regres-
sion framework is implemented in C to improve computa-
tional efficiency. ZINBA can be run on a desktop
computer with at least 3 GB of RAM and a 2 GHz proces-
sor. The software is applicable to any species with a
sequenced genome. ZINBA can be run using a GUI (gra-
phical user interface) or from the command line, and is
capable of being installed on multi -core computing clus-
ters, allowing for extremely high-throughput capacity. Cur-
rently, ZINBA is available for Linux, UNIX, and Mac OSX.
Additional material
Additional file 1: Figures S1 to S13 and Table S1. Supplementary
Figures S1 to S13, and Table S1, corresponding to parameter estimates
from the ZINBA BIC-selected models.
Additional file 2: Supplementary methods. Mathematical details of the
ZINBA mixture regression algorithm, in addition to data access details.
Additional file 3: ZINBA version 2.0. A freeze of the ZINBA software as
of 9 July 2011, which is included in the manuscript for archival purposes
only. We recommend that users download ZINBA from our website [46]
to ensure that the most up-to-date version is installed.
Abbreviations
BIC: Bayesian information criterion; bp: base pair; ChIP: chromatin
immunoprecipitation; CNV: copy number variation; CTCF: CCCTC-binding
factor; DHS: DNase hypersensitivity site; FAIRE: formaldehyde-assisted
isolation of regulatory elements; GLM: generalized linear model; H3K36me3:
histone H3 lysine 36 tri-methylation; NGS: next generation sequencing; RNA
Pol II: RNA polymerase II; RPKM: reads per kilobase per million mapped
reads; TFBS: transcription factor binding site; TSS: transcription start site;
ZINBA: Zero-Inflated Negative Binomial Algorithm.
Rashid et al. Genome Biology 2011, 12:R67
/>Page 18 of 20
Acknowledgements
We would like to thank the Iyer lab at the University of Texas-Austin and the
Bernstein lab at the Broad Institute for generating the ENCODE DNA-seq
data used in the evaluation of ZINBA. This work was supported by the NIH
Biostatistics Training Grant in Cancer Genomics and NIH grants Bayesian
Approaches to Model Selection for Survival Data (GM70335), Inference with
Missing Covariates in Regression Models (CA74015), and ENCODE grant U54
HG004563.
Author details
1
Department of Biostatistics, Gillings School of Global Public Health, The
University of North Carolina at Chapel Hill, Chapel Hill, NC 27599, USA.
2
Department of Biology, Carolina Center for Genome Sciences, and
Lineberger Comprehensive Cancer Center, The University of North Carolina
at Chapel Hill, Chapel Hill, NC 27599, USA.
3
Department of Genetics and
School of Medicine, University of North Carolina at Chapel Hill, Chapel Hill,
NC 27599, USA.
Authors’ contributions
NR and PG conceived of the project under the direction of WS, JI, and JDL.
NR, PG, WS, JI, and JDL wrote the manuscript. NR, PG, and WS coded the
software. All authors read and approved the final manuscript.
Competing interests
The authors declare that they have no competing interests.
Received: 26 April 2011 Revised: 11 July 2011 Accepted: 25 July 2011
Published: 25 July 2011
References
1. Park PJ: ChIP-seq: advantages and challenges of a maturing technology.
Nat Rev Genet 2009, 10:669-680.
2. Boyle AP, Davis S, Shulha HP, Meltzer P, Margulies EH, Weng Z, Furey TS,
Crawford GE: High-resolution mapping and characterization of open
chromatin across the genome. Cell 2008, 132:311-322.
3. Giresi PG, Lieb JD: Isolation of active regulatory elements from eukaryotic
chromatin using FAIRE (formaldehyde assisted isolation of regulatory
elements). Methods 2009, 48:233-239.
4. Pepke S, Wold B, Mortazavi A: Computation for ChIP-seq and RNA-seq
studies. Nat Methods 2009, 6(11 Suppl):S22-S32.
5. Zhang Y, Liu T, Meyer CA, Eeckhoute J, Johnson DS, Bernstein BE,
Nussbaum C, Myers RM, Brown M, Li W, Liu XS: Model-based analysis of
ChIP-Seq (MACS). Genome Biol 2008, 9:R137.
6. Auerbach RK, Euskirchen G, Rozowsky J, Lamarre-Vincent N, Moqtaderi Z,
Lefrancois P, Struhl K, Gerstein M, Snyder M: Mapping accessible chromatin
regions using Sono-Seq. Proc Natl Acad Sci USA 2009, 106:14926-14931.
7. Valouev A, Johnson DS, Sundquist A, Medina C, Anton E, Batzoglou S,
Myers RM, Sidow A: Genome-wide analysis of transcription factor binding
sites based on ChIP-Seq data. Nat Methods 2008, 5:829-834.
8. Tuteja G, White P, Schug J, Kaestner KH: Extracting transcription factor
targets from ChIP-Seq data. Nucleic Acids Res 2009, 37:e113.
9. Ji H, Jiang H, Ma W, Johnson DS, Myers RM, Wong WH: An integrated
software system for analyzing ChIP-chip and ChIP-seq data. Nat
Biotechnol 2008, 26:1293-1300.
10. Jothi R, Cuddapah S, Barski A, Cui K, Zhao K: Genome-wide identification
of in vivo protein-DNA binding sites from ChIP-Seq data. Nucleic Acids
Res 2008, 36:5221-5231.
11. Hu M, Yu J, Taylor JM, Chinnaiyan AM, Qin ZS: On the detection and
refinement of transcription factor binding sites using ChIP-Seq data.
Nucleic Acids Res 2010, 38:2154-2167.
12. Blahnik KR, Dou L, O’Geen H, McPhillips T, Xu X, Cao AR, Iyengar S,
Nicolet CM, Ludascher B, Korf I, Farnham PJ: Sole-Search: an integrated
analysis program for peak detection and functional annotation using
ChIP-seq data. Nucleic Acids Res 2010, 38:e13.
13. Wang C, Xu J, Zhang D, Wilson ZA: An effective approach for
identification of in vivo protein-DNA binding sites from paired-end ChIP-
Seq data. BMC Bioinformatics 2010, 11:81.
14. Kharchenko PV, Tolstorukov MY, Park PJ: Design and analysis of ChIP-seq
experiments for DNA-binding proteins.
Nat Biotechnol 2008, 26:1351-1359.
15.
Lun DS, Sherrid A, Weiner B, Sherman DR, Galagan JE: A blind
deconvolution approach to high-resolution mapping of transcription
factor binding sites from ChIP-seq data. Genome Biol 2009, 10:R142.
16. Nix DA, Courdy SJ, Boucher KM: Empirical methods for controlling false
positives and estimating confidence in ChIP-Seq peaks. BMC
Bioinformatics 2008, 9:523.
17. Wilbanks EG, Facciotti MT: Evaluation of algorithm performance in ChIP-
seq peak detection. PLoS One 2010, 5:e11471.
18. Zang C, Schones DE, Zeng C, Cui K, Zhao K, Peng W: A clustering
approach for identification of enriched domains from histone
modification ChIP-Seq data. Bioinformatics 2009, 25:1952-1958.
19. Hon G, Ren B, Wang W: ChromaSig: a probabilistic approach to finding
common chromatin signatures in the human genome. PLoS Comput Biol
2008, 4:e1000201.
20. Xu H, Handoko L, Wei X, Ye C, Sheng J, Wei CL, Lin F, Sung WK: A signal-
noise model for significance analysis of ChIP-seq with negative control.
Bioinformatics 2010, 26:1199-1204.
21. Liu ET, Pott S, Huss M: Q&A: ChIP-seq technologies and the study of gene
regulation. BMC Biol 2010, 8:56.
22. Laajala TD, Raghav S, Tuomela S, Lahesmaa R, Aittokallio T, Elo LL: A
practical comparison of methods for detecting transcription factor
binding sites in ChIP-seq experiments. BMC Genomics 2009, 10:618.
23. Hawkins RD, Hon GC, Ren B: Next-generation genomics: an integrative
approach. Nat Rev Genet 2010, 11:476-486.
24. Dohm JC, Lottaz C, Borodina T, Himmelbauer H: Substantial biases in
ultra-short read datasets from high-throughput DNA sequencing. Nucleic
Acids Res 2008, 36:e105.
25. Hillier LW, Marth GT, Quinlan AR, Dooling D, Fewell G, Barnett D, Fox P,
Glasscock JI, Hickenbotham M, Huang W, Magrini VJ, Richt RJ, Sander SN,
Stewart DA, Stromberg M, Tsung EF, Wylie T, Schedl T, Wilson RK,
Mardis ER: Whole-genome sequencing and variant discovery in C.
elegans. Nat Methods 2008, 5:183-188.
26. Quail MA, Kozarewa I, Smith F, Scally A, Stephens PJ, Durbin R, Swerdlow H,
Turner DJ: A large genome center’s improvements to the Illumina
sequencing system. Nat Methods 2008, 5:1005-1010.
27. Zhang ZD, Rozowsky J, Snyder M, Chang J, Gerstein M: Modeling ChIP
sequencing in silico with applications.
PLoS Comput Biol 2008, 4:e1000158.
28.
Rozowsky J, Euskirchen G, Auerbach RK, Zhang ZD, Gibson T, Bjornson R,
Carriero N, Snyder M, Gerstein MB: PeakSeq enables systematic scoring of
ChIP-seq experiments relative to controls. Nat Biotechnol 2009, 27:66-75.
29. Dempster AP, Laird NM, Rubin DB: Maximum likelihood from incomplete
data via Em algorithm. J Roy Stat Soc B Met 1977, 39:1-38.
30. Schwarz G: Estimating the dimension of a model. Ann Stat 1978,
6:461-464.
31. Birney E, Stamatoyannopoulos JA, Dutta A, Guigo R, Gingeras TR,
Margulies EH, Weng Z, Snyder M, Dermitzakis ET, Thurman RE, Kuehn MS,
Taylor CM, Neph S, Koch CM, Asthana S, Malhotra A, Adzhubei I,
Greenbaum JA, Andrews RM, Flicek P, Boyle PJ, Cao H, Carter NP,
Clelland GK, Davis S, Day N, Dhami P, Dillon SC, Dorschner MO, Fiegler H,
et al: Identification and analysis of functional elements in 1% of the
human genome by the ENCODE pilot project. Nature 2007, 447:799-816.
32. Rhead B, Karolchik D, Kuhn RM, Hinrichs AS, Zweig AS, Fujita PA,
Diekhans M, Smith KE, Rosenbloom KR, Raney BJ, Pohl A, Pheasant M,
Meyer LR, Learned K, Hsu F, Hillman-Jackson J, Harte RA, Giardine B,
Dreszer TR, Clawson H, Barber GP, Haussler D, Kent WJ: The UCSC Genome
Browser database: update 2010. Nucleic Acids Res 2010, 38:D613-619.
33. Hampton OA, Den Hollander P, Miller CA, Delgado DA, Li J, Coarfa C,
Harris RA, Richards S, Scherer SE, Muzny DM, Gibbs RA, Lee AV,
Milosavljevic A: A sequence-level map of chromosomal breakpoints in
the MCF-7 breast cancer cell line yields insights into the evolution of a
cancer genome. Genome Res 2009, 19:167-177.
34. Miller CA, Hampton O, Coarfa C, Milosavljevic A: ReadDepth: a parallel R
package for detecting copy number alterations from short sequencing
reads. PLoS One 2011, 6:e16327.
35. Boyle AP, Guinney J, Crawford GE, Furey TS: F-Seq: a feature density
estimator for high-throughput sequence tags. Bioinformatics 2008,
24:2537-2538.
36. ENCODE Project Consortium, Birney E, Stamatoyannopoulos JA, Dutta A,
Guigó R, Gingeras TR, Margulies EH, Weng Z, Snyder M, Dermitzakis ET,
Thurman RE, Kuehn MS, Taylor CM, Neph S, Koch CM, Asthana S,
Malhotra A, Adzhubei I, Greenbaum JA, Andrews RM, Flicek P, Boyle PJ,
Rashid et al. Genome Biology 2011, 12:R67
/>Page 19 of 20
Cao H, Carter NP, Clelland GK, Davis S, Day N, Dhami P: Identification and
analysis of functional elements in 1% of the human genome by the
ENCODE pilot project. Nature 2007, 447:799-816.
37. Bailey TL, Boden M, Buske FA, Frith M, Grant CE, Clementi L, Ren J, Li WW,
Noble WS: MEME SUITE: tools for motif discovery and searching. Nucleic
Acids Res 2009, 37:W202-208.
38. Wu JQ, Snyder M: RNA polymerase II stalling: loading at the start
prepares genes for a sprint. Genome Biol 2008, 9:220.
39. Zeitlinger J, Stark A, Kellis M, Hong JW, Nechaev S, Adelman K, Levine M,
Young RA: RNA polymerase stalling at developmental control genes in
the Drosophila melanogaster embryo. Nat Genet 2007, 39:1512-1516.
40. Giresi PG, Kim J, McDaniell RM, Iyer VR, Lieb JD: FAIRE (formaldehyde-
assisted isolation of regulatory elements) isolates active regulatory
elements from human chromatin. Genome Res 2007, 17:877-885.
41. Rando OJ, Chang HY: Genome-wide views of chromatin structure. Annu
Rev Biochem 2009, 78:245-271.
42. Frühwirth-Schnatter S: Finite Mixture and Markov Switching Models Springer
Verlag; 2006.
43. Zeger S: A regression model for time series of counts. Biometrika 1988,
75:621.
44. Davis R, Wu R: A negative binomial model for time series of counts.
Biometrika 2009, 96:735-749.
45. Quinlan AR, Hall IM: BEDTools: a flexible suite of utilities for comparing
genomic features. Bioinformatics 2010, 26:841-842.
46. ZINBA [ />doi:10.1186/gb-2011-12-7-r67
Cite this article as: Rashid et al.: ZINBA integrates local covariates with
DNA-seq data to identify broad and narrow regions of enrichment, even
within amplified genomic regions. Genome Biology 2011 12:R67.
Submit your next manuscript to BioMed Central
and take full advantage of:
• Convenient online submission
• Thorough peer review
• No space constraints or color figure charges
• Immediate publication on acceptance
• Inclusion in PubMed, CAS, Scopus and Google Scholar
• Research which is freely available for redistribution
Submit your manuscript at
www.biomedcentral.com/submit
Rashid et al. Genome Biology 2011, 12:R67
/>Page 20 of 20