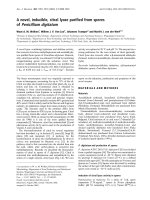
Báo cáo y học: " NF- B subunits RELB C-Rel RELA p50 p52 bound DNA b EMS" docx
Bạn đang xem bản rút gọn của tài liệu. Xem và tải ngay bản đầy đủ của tài liệu tại đây (2.28 MB, 19 trang )
RELB C-Rel RELA p50 p52
bound
DNA
complex
NF-țB subunits
EMSA
b
Electrophoretic Mobility Shift Assay
(EMSA)
Protein-DNA Binding microarrays
free
DNA
Deep sequencing of
EMSA
Sl
microarray scanning
(EMSA)
DNA-sequences bound by
Transcription Factors (TFs) in vitro
high binding affinity
low binding affinity
EMSA
-
S
eq samp
l
es
TCACCAAAACT
UV-laser foot
p
rintin
g
of
Create TF-bindin
g
p
rofiles
G
T
rs2205960
Disease Disease haplotypehaplotype
pg
TF-bound DNA sequences
gp
for dimers
Extensive characterization of NF-κB binding
uncovers non-canonical motifs and advances the
interpretation of genetic functional traits
Wong et al.
Wong et al. Genome Biology 2011, 12:R70
(29 July 2011)
RESEARCH Open Access
Extensive characterization of NF-B binding
uncovers non-canonical motifs and advances the
interpretation of genetic functional traits
Daniel Wong
1†
, Ana Teixeira
1†
, Spyros Oikonomopoulos
1†
, Peter Humburg
1
, Imtiaz Nisar Lone
2
, David Saliba
3
,
Trevor Siggers
4
, Martha Bulyk
4,5,6
, Dimitar Angelov
2
, Stefan Dimitrov
7
, Irina A Udalova
3
and Jiannis Ragoussis
1*
Abstract
Background: Genetic studies have provided ample evidence of the influence of non-coding DNA polymorphisms
on trait variance, particularly those occurring within transcription factor binding sites. Protein binding microarrays
and other platforms that can map these sites with great precision have enhanced our understanding of how a
single nucleotide polymorphism can alter binding potential within an in vitro setting, allowing for greater
predictive capability of its effect on a transcription factor binding site.
Results: We have used protein binding microarrays and electrophoretic mobility shift assay-sequencing (EMSA-
Seq), a deep sequencing based method we developed to analyze nine distinct human NF-B dimers. This family of
transcription factors is one of the most extensively studied, but our understanding of its DNA binding preferences
has been limited to the originally described consensus motif, GGRRNNYYCC. We highlight differences between NF-
B family members and also put under the spotlight non-canonical motifs that have so far received little attention.
We utilize our data to interpret the binding of transcription factors between individuals across 1,405 genomic
regions laden with single nucleotide polymorphisms. We also associated binding correlations made using our data
with risk alleles of disease and demonstrate its utility as a tool for functional studies of single nucleotide
polymorphisms in regulatory regions.
Conclusions: NF-B dimers bind specifically to non-canonical motifs and these can be found within genomic
regions in which a canonical motif is not evident. Binding affinity data generated with these different motifs can
be used in conjunction with data from chromatin immunoprecipitation-sequencing (ChIP-Seq) to enable allele-
specific analyses of expression and transcription factor-DNA interactions on a genome-wide scale.
Background
Single nucleotide polymorphisms (SNPs) that change the
pattern of transcripti on factor (TF) binding to DNA are
believed to be a major contributing factor to cis-modu-
lation of gene expression; approximately 30% o f
expressed genes show evidence of cis-regulation being
influenced by common alleles [1]. In particular, poly-
morphisms occurring in TF binding sites (TFBSs) that
change the pattern of re gulatory protein binding to
DNA are believed to be a major contributing factor to
cis-modulation of gene expression. Recent advances in
genomic technologies [2-4] are now making allele-speci-
fic analyses of expression, TF-DNA interactions and
chromatin states possible across the human genome,
aiding in evaluation of how DNA polymorphisms in reg-
ulatory elements control gene expression.
Chromatin immunoprecipitation-sequencing (ChIP-
Seq) and related approaches are now extensivel y applied
to study genome-wide binding of TFs. ChIP-Seq allows
the detection of total binding at specific sequences and
of their allele-specific activity in cases in which hetero-
zygous sites overlap ChIP-Seq peaks. For example,
recent reports extended global allel e-specific analysis
across individuals to DNA-protein binding [5,6]. Of par-
ticular relevance to our study is the work of Kasowski
* Correspondence:
† Contribu ted equally
1
Wellcome Trust Centre for Human Genetics, University of Oxford, Roosevelt
Drive, Oxford OX3 7BN, UK
Full list of author information is available at the end of the article
Wong et al. Genome Biology 2011, 12:R70
/>© 2011 W ong et al.; licensee BioMed Central Ltd. This is an open acc ess article distributed un der the terms of the Creative Commons
Attribution License (http://creativec ommons.org/licenses/by/ 2.0), which permits unrestricted use, distribution, and reproduction in
any medium, provided the original work is properly cited.
and co-workers [6], in which the authors analyzed bind-
ing of the NF-B protein RELA in stimulated lympho-
blastoid cells across eight individuals and documented
binding differences between paired individuals at
numerous genomic locations.
A major impediment to the ChIP-based evaluation of
cis-regulatory SNPs is that, by its nature, ChIP can iden-
tify genomic regions that interact with TFs but not indi-
vidual binding sites [7,8]. Other limiting factors in ChIP
that can confound m easured TF-DNA binding include
the state of chromatin at binding regions [9], differing
extents of nucleosome occupancy [10], the quality of the
antibodies that are so vital to its success and also the
near impossibility of isolating a specific dimer instead of
all dimers having a subunit in common. Thus, a ChIP-
based method is typically used in conjunction with
other techniques that can map the site of TF-DNA
interactions more precisely. In particular, protein bin d-
ing microarrays have significantly enhanc ed our under-
standing of what individual sequence variants do to alter
binding potential within an in vitro setti ng, allowing for
greater predictive capability of the effect of a SNP on a
TFBS [11-13]. While microarrays were established using
a stable attachment of DNA to a solid surface that is in
contact with a TF through a liquid medium, other alter-
native high-throughput platforms, such as Bind-n-Seq
[14] or multiplexed massively parallel SELEX (systematic
evolution of ligands by exponential enrichment) [8]), are
based on both the TF and DNA b eing in a purely liquid
environment. SELEX is a process through which conse-
cutive rounds of selective purification are employed to
progressively enrich for a population of DNA ligands
that are ‘preferentially’ bound by the TF in question.
This study focuses on NF-B, but there is, in general,
a great interest within the scientific community to quali-
tatively and quantitatively define at high resolution all
the different DNA sequences bound by TFs [15]. The
NF-B family of TFs has been extensively studied due
to its roles in different biological processes like inflam-
mation, apoptosis, development and oncogenesis
[16-20]. NF-B proteins function as homo- or heterodi-
mers, which are made up of Rel homology domain-con-
taining monomers from two subfamilies: the p50 and
p52 subfamily (type I subunits); and the RELA, RELB
and C-Rel subfamily (type II subunits). Type I subunits
lack a transactivation domain and can only activate tran-
scription as a heterodimer with a type II subunit or as a
homodimer in complex with co-factors, such as BCL3,
IKBZ,andsoon[18].Inagivenheterodimer,thetype
II subunit confers transcription-activating capability.
Members of the NF-BTFfamilybindtoa‘core motif’
that is between 10 to 11 bases in length [21-23].
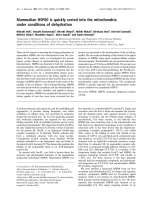
Our overall approach is outlined in Figure 1. We first
characteri zed the b inding of nine NF-Bdimers
(homodimers of RELA, p50 and p52 and the heterodi-
mers RELAp50, RELAp52, RELBp50, RELBp52, C-
Relp50 and C-Relp52) to a limited, 11-mer NF-Bcon-
sensus binding space using our microarray platform.
This produced data that did not require extensive post-
processing and al lowed for rapid visualization of the dif-
ferent binding profiles for the dimers. Previously, Badis
and co-workers [24] highlighted binding m odels with
coverage of sequence space beyond what has been
definedbymorecanonicalmodels. Included in their
study were models with sequence compositions that
were again substantially different from those in the
canonical models. This suggested that there may be an
entire area of ‘less canonical’ k-mer space that is, as yet,
not well defined. We therefore extended our observa-
tions to cover this space by further profiling the three
RELA dimers using a method we have developed, elec-
trophoretic mobility shirt assay-sequencing (EMSA-Seq)
combining EMSA assays done with purified proteins
and degenerate oligonuc leotide libraries with complete
coverage of 11-mer space followed by next generation
sequencing of bound DNA molecules. Our results show
that a high number of sequences are binders that fall
outside of the canonical NF-Bconsensusandspecifi-
city of binding for typicalexamplesofthesenovel
sequences was validated by UV-laser footprinting.
Finally, we examine the relationships between N F-B
in vitro binding affinities (defined as binding potential)
and their significance in vivo by overlaying sequences
and measured bin ding affinities from our datasets onto
genomic locations of RELA ChIP-Seq peaks containing
SNPs in stimulated lymphoblastoid cells across eight
individuals [6]. Direct positive correlation of NF-B
binding potential with in vivo NF-B binding can be
found in 65% of relevant cases examined and these span
1,405 genomic locations that show differences in ChIP-
Seq peak heights between individuals. These include
regions that may also have potential implications for
disease association studies and we show examples in
which the risk allele for disease is present in the haplo-
type associated with higher binding properties in vitro
and
in vivo,
whereas the n ormal allele haplotype con-
tains motifs with lower binding properties. This illus-
trates the utility of studies utilizing TF binding potentia l
for the interpretation of regulatory functional traits.
Results
Microarrays show that members of the NF-B TF family
have different binding profiles
To profile DNA b inding preferences of multiple NF- B
dimers, double-stranded DNA microarrays containing
803 11-mer sequences within the generalized NF-B
consensus RGGRNNHHYYB flanked by four distinct
flanking sequences were hybridized in triplicate with
Wong et al. Genome Biology 2011, 12:R70
/>Page 2 of 18
each of the nine recombinant NF -B dimers (homodi-
mers of RELA, p50 and p52 and the heterodimers
RELAp50, RELAp52, RELBp50, RELBp52, C-Rel p50 and
C-Relp52). A high degree of consistency across experi-
ments was evident given similarity coefficients of at least
0.95 between replicates (Pearson-correlation test).
Pair-wise analysis of flank-specific datasets revealed
that the binding affinities (z-score) of dimers for the 11-
mer sequences were largely unaffected by the presence
of flanks (Table S1 in Additional file 1). For each pro be
the median of binding affinities across the f our flank-
specific datasets of individual dimers was thus used to
b
RELB C-Rel RELA p50 p52
bound
DNA
complex
NF
-κ
B
su
b
un
i
ts
EMSA
Electrophoretic Mobility Shift Assay
(EMSA)
Protein-DNA Binding microarrays
free
DNA
Deep sequencing of
EMSA-Seq samples
microarray scanning
DNA-sequences bound by
Transcription Factors (TFs) in vitro
high binding affinity
low binding affinity
Individual 1 (Chromatin ImmunoPrecipitated or ChIP-ed region)
Individual 2 (Chromatin ImmunoPrecipitated or ChIP-ed region)
UV-laser footprinting of
TF-bound DNA sequences
Rationalize differences for in vitro binding potential and
in vivo binding by projecting DNA-sequences with measured
binding affinities (EMSA-Seq) onto ChIP-ped regions
Create TF-binding profile
s
for dimers
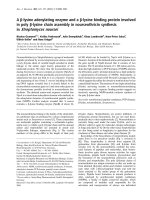
Figure 1 Outline of the dual platform approach used to profile NF-B family dimers. Double-purified, His-tagged NF-Bdimersinteract
with DNA-probes (microarray) or DNA-ligands (electrophoretic mobility shift assay-sequencing (EMSA-Seq)). Two separate stains are available for
the visualization of DNA and protein on EMSA-gels. SYBR Green highlights both DNA bound by the dimer (’bound DNA’) and also unbound
DNA (’free DNA’). The SYPRO Ruby stain identifies proteins such as those within a dimer-DNA complex (’complex’). Both microarray and EMSA-
Seq platforms generate data that provide binding affinities for individual sequences that interact with a dimer. Profiles of nine different dimers
illustrating their binding affinities for 803 sequences were constructed using microarrays. In addition, RELARELA, RELAp50 and RELAp52 were also
profiled using EMSA-Seq. Deep sequencing revealed dimer-specific binding affinities for distinctive groups of 11-mer sequences. Two classes of
these sequences, formed on the basis of similarity to a reference NF-B binding-model, were used as targets for a UV footprinting experiment.
Finally, differences for in vitro binding potential as determined using binding affinities from EMSA-Seq and differences for in vivo binding as
established by a ChIP-Seq study were then co-examined across 7,762 comparisons of paired individuals.
Wong et al. Genome Biology 2011, 12:R70
/>Page 3 of 18
build representative binding profiles for each dimer
(Additional file 2). Pair-wise comparisons of these pro-
files revealed that the RELA homodimer was most dis-
tinct within the entire grouping, with as little as 57%
similarity (Pearson-correlation test) to that of the p50
homodimer (Table S2 in Additional file 1). Binding
models repres enting the 50 highest affinity binders were
also created for each dimer (Figure S1 in Additional file
1). The use of quantitative data overcomes a known lim-
itati on in the classical method of position weight matrix
(PWM) construction where individual nucleotide posi-
tions within the matrix are assumed to be independent
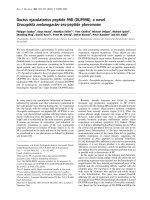
[15]. When the binding data were organized within a
heat map and subj ected to hierarchical clustering, the
profile of RELARELA was clearly distinct from those of
the other eight dimers, which was also reflected by the
derived binding model for this homodimer (Figure 2).
At the same time, there are also elements within the dif-
ferent profiles that are shared across the NF- B family
(Figure 2). On the whole, homodim ers had a lower
degree of similarity between each other than did hetero-
dimers, with an average similarity coeffi cient of 0.71
(Table S2 in Additional file 1). Heterodimers, on the
other hand, have similarity coefficients averaging 0.95
and tend to recognize DNA sequences in a manner that
is more similar to each other (Table S2 in Additional
file 1).
Binding data generated by the EMSA-Seq platform are in
good agreement with microarrays
To extend our observations to a substantially larger
number of sequences, we then developed a compl emen-
tary EMSA-seq platform. All sequencing results
obtained with this have been deposited into the Gene
Expression Omnibus (GEO) database [25] under acces-
sion number [GSE:29460]. EMSA-seq employs oligonu-
cleotides containing either 10-mer degenerate regions
flankedbyasinglesetof4-mer sequences (intrinsically
comparable to our microarray probes), or a longer 20-
mer degenerate region (that is, indirect representation of
sequences of different lengths, each one a potential
binding site) as DNA ligands in an EMSA assay, fol-
lowed by DNA extraction, library preparation and deep
sequencing of the DNA fraction that has been bound by
a transcription factor. To examine the extent of DNA
enrichment that is required to generate specific and sen-
sitive binding data, a pool of 10-mer degenerate
sequences was subjected to three consecutive rounds of
selection by the dimer p52p5 2. Af ter implementation of
quality control measures and a statistical method for
determining enrichment, we found that 14,7 58, 12,420
and 11,065 out of a possible 522,857 10-mer seque nces
were enriched after one, two and three rounds of
SELEX (SELEX1 to SELEX3), respectively (Figure 3a;
datasets in GEO under accession number [GSE:29460]).
Examination of the non-selected pool revealed that
99.7% of all possible 10-mer combinations were present
and this represents a substantial coverage of the entirety
of 10-mer space.
In line with reports that an increasingly enriched DNA
pool of reduced complexity is typically obtained with
more rounds of SELEX [26], we too observed that 25%
of sequences identified in the first round were conse-
quently lost after SELEX3 (Figure 3a). The remaining
11,065 sequences were enriched across all three rounds
of SELEX and have similarity coefficients of between
0.84 and 0.89 (Pearson correlation tests; Figure 3b). This
indicates that SELEX1 would already have revealed the
relative enrichment levels for the majority of sequences
from SELEX3 (75%) and provides the basis fo r a single
round of enrichment being implemented in EMSA-Seq.
Moreover, ligands bound by p52p52 after SELEX1
(Table 1) are substantially less than the 25% of 8-mer
sequences thought to be bound specifically by TFs in
the study by Jolma and co-workers [8], likely due to an
increased presence of non-specific competitor in our
TF-DNA binding experiments (see Materials and meth-
ods). For these comparisons, we did not perform more
than three rounds of SELEX and it is conceivable that
the dynamics of TF-binding beyond the third round
may be dramatically different from that in preceding
rounds. However, this is unlikely given that Jolma and
co-workers obtained comparable datasets using between
two and four rounds of SELEX [8].
Profiling of NF- B p52p52 from SELEX1 and SELEX3
revealed there wa s an over-representa tion of sequences
from our arrays and data from Linnell et al. [13] (Table
1). In conclusion, the binding data generated by the
EMSA-Seq protocol is in good agreement with results
obtained using microarrays.
In-depth profiling of binding specificities of RELA-
containing dimers by EMSA-Seq uncovers a binding
landscape that extends beyond the known consensus
Next, we applied EMSA-Seq to profile binding prefer-
ences of three RELA-containing dimers using DNA
ligands containing a 20-mer degenerate region and
uncovered a rich ‘ TF-binding landscape’ composed of
sequences bound with varying affinities. Our deep
sequencing approach produced enough data to allow an
exhaustive representation of every possible sequence up
to a length of 11-mers. Approximately 10 to 13% of all
possible 11-mer combinations were bound by each of
the three RELA-containing dimers. A breakdown of this
is shown in F igure 4a, and datasets have been deposited
into the GEO under accession number [GSE:29460].
Binding models representing the 50 and 1,000 highest
affinity binders were created for each dimer (Figure 4b).
Wong et al. Genome Biology 2011, 12:R70
/>Page 4 of 18
Once again, the profile of RELARELA was distinct from
that of the heterodimers RELAp50 and RELAp52 (Table
2). This is consistent with what we observed using
microarrays where binding profiles of the two RELA
heterodimers are more similar to one a nother than they
are to that of the RELA homodimer (Figure 2).
Binding sequences can be categorized on the basis of
similarity (MATCH score) to a reference binding model,
either an established PWM or an alternative constructed
from quantitative data (Table S3 in Additional file 1).
We created two sets of MATCH scores for 11-mer
sequences in our microarray and EMSA-Seq datasets,
one based on the reference binding model and another
on the alternative formed using the 300 h ighest affinity
binders from our EMSA-Seq data (see Materials and
methods and Supplementary Material in Additional file
1). Both are highly comparable, with 95% similarity
between the two sets (Pearson correlation test).
For subsequent analysis, we also defined a group of
4,399 11-mer sequences termed ‘ canonical NF-Bbin-
ders’, computationally derived on the basis of a greater
than 0.75 MATCH score similarity to the canonical NF-
B PWM (Additional file 3). These were over-repre-
sented in our EMSA-Seq datasets and many would be
RELARELA
p50p50
p52p52
RELBp50
RELBp52
C-Relp52
RELAp52
RELAp50
C-Relp50
o
n microarray
common NF-κB motif formed
using 93 11-mer sequences
803 11-mer sequences
o
RELARELA dimer-specific motif
formed using 61 11-mer sequence
s
-0.5 0 0.5
Binding affinity of dimer for
11-mer sequence (z-score)
Figure 2 Binding profiles of the different NF-Bdimers. Heat map illustration of binding profiles obtained from microarray analysis of
dimers. Within the heat map, probes that contain the 803 11-mer sequences and represent ‘k-mer’ space given by the consensus
RGGRNNHHYYB can be found as rows whilst the nine NF-B dimers have been organized into columns. A graded color scheme has been used
to represent the ranked affinities of a dimer for a probe. From lightest to darkest this corresponds to decreasing affinity. Hierarchical clustering
was used to describe relationships between binding profiles of the different dimers (Euclidean distance correlation; complete linkage analysis).
The profile of RELARELA was largely distinct from those of the other eight dimers. On the whole, homodimers also have binding profiles that
render these TFs to be less alike as a class. This is in contrast to the higher degree of similarity found between profiles within the heterodimer
class. Two groups of sequences that contribute to similarities and differences between RELARELA and the other dimers have been used to
construct representative binding models.
Wong et al. Genome Biology 2011, 12:R70
/>Page 5 of 18
recognized as being familiar targets of NF-B(Table2).
One of the most intriguing observations from th is study
is that some of the most enriched sequences do fall out-
side of the known NF-B consensus space (Table 2).
Examples of such non-canonical sequences include
AGGGGGATCTG, AGGGAAGTTA and CTGGGG
ATTTA. MATCH scores of 0.49, 0.4 3 and 0.29, respec-
tively, render these three sequ ences quite different from
the generalized 11-mer consensus RGGRNNHHYYB.
Non-canonical sequences identified in EMSA-Seq exhibit
specific binding by UV laser and DNaseI footprinting
To further examine the interactions of NF-Bdimers
with these non-canonical sequences that are different to
the reference, we used DNase I and UV laser footprint-
ing combined with EMSA techniques. As a positive con-
trol, we studied the binding of NF-Bdimerstotwo
known NF-B binding sequences, H-2 (GGGGAAT
CCCC) and HIV (GGGGACTTTCC).
EMSA with the p50p50 and RELA homodimers,
RELAp50 and RELAp52, was first used to establish that
a dimer-DNA complex was f ormed, which was subse-
quently studied using DNase I and UV laser footprint-
ing. These t wo techniques identify the specific binding
of a dimer to a DNA sequence in the form of a signa-
ture or ‘ footprint’ of reduced intensity at binding
regions. DNase I footprinting allows one to qualitatively
distinguish between specific and non-specific binding,
while UV laser footprinting works on the principle of
dimer-DNA c omplexes being irradiated by a single UV
laser pulse followed by mapping of the induced photo
lesions at 1-bp resolution. It has the added capability of
quantifying the strength of a dimer-DNA interaction
(binding constant K
d
). Both H-2 and HIV sequences
a
ffinities)
least enriched
SELEX1 (p52p52)
SELEX2 (p52p52)
SELEX3 (p52p52)
2338
(0.45 %)
1355
(0.26 %)
0
NF B p52p52
a
nked affinity (ranked
a
Correlation of ranked affinities
SELEX2 SELEX3
11065
(2.12 %)
0
0
0
R
a
most enriched
SELEX1 0.89 0.84
SELEX2 1 0.95
10-mer sequences after 3 rounds of SELEX
SELEX1
SELEX2
SELEX3
number of distinct 10-mers enriched
during EMSA-Seq
from a starting pool
of 522
,
857 se
q
uences
,
q
(
a
)(
b
)
Figure 3 One rou nd of enrichment was sufficient with NF-kB p52p52. (a) 10 -mer sequences enriched af ter one, two an d three rounds of
selection with NF-kB p52p52 during EMSA-Seq. (b) Ranked affinities of 11,065 10-mers that were continually enriched throughout the three
rounds of SELEX with p52p52. The correlations of ranked affinities for these sequences throughout the process are shown (Pearson correlation
test).
Table 1 Comparison and validation of p52p52
SELEX1 SELEX3
Number/proportion of 10-mer sequences (n = 522,857) that were enriched 14,758 (2.8%) 11,065 (2.1%)
Number of 10-mer sequences shared with microarrays (n = 757) 249
a
(32.9%) 196
b
(25.9%)
Number of 10-mer sequences shared with Linnell et al. [13] (n = 63) 21
c
(33.3%) 18
d
(28.6%)
Hypergeometric probability test for over-representation:
a
P = 6.9e-187;
b
P = 3.1e-148;
c
P = 2.3e-19;
d
P = 1.5e-17. Number of enriched sequences identified during
SELEX and overlaps with two microarray datasets (ours and Linnell et al. [13]).
Wong et al. Genome Biology 2011, 12:R70
/>Page 6 of 18
produced strong and specific binding patterns with the
different dimers tested (Figure 5a).
Next, we determined by UV laser footprinting the
binding affinities of the three RELA-containing dimers
for one canonical, AGGAAATTCCG, and three ran-
domly selected non-canonical sequences (the three
examples described in the previous section). We cross-
comp ared these results with those from the microarrays
and EMSA-Seq (Table 3). The canonical AGGAA
ATTCCG sequence was bo und by the RELA homodi-
mer in all assays. Interestingly, all three non-canonical
sequences, AGGGGGATCTG, AGGGAAGTTA and
CTGGGGATTTA, were not specifically bound by this
same homodimer. Correspond ingly, RELARELA also
either did not bind these sequences in EMSA-Seq or
bound them with only low affi nity. In contrast, specific
dimer-DNA interactions occurred between the RELA
heterodimers and non-canonical sequences (Figure 5b),
in agreement with EMSA-Seq data (Table 3). Thus, we
concluded that the binding of selected NF-B dimers to
non-canonical sequences was indeed specific. Impor-
tantly, whilst our data show that there is the overall ten-
dency for sequences with higher MATCH scores to be
bound by a TF with higher affinities (Figure 5c), there is
RELARELA
RELAp50
RELAp52
from top 1000 binders
from top 50 binders
Binding models generated using the
top affinity binders from EMSA-Seq
15347
(0.7 %)
117942
(5.6 %)
64847
(3.1 %)
19407
(0 9 %)
11
555
2
40478
(1.9 %)
RELAp50
% non-canonical: 80 %
(MATCH<0.75)
% non-canonical: 72.3 %
(MATCH<0.75
)
(0
.
9
%)
555
(5.5 %)
28411
(1.4 %)
number of distinct 11
-
mers enriched
RELARELA
% non-canonical: 48 %
(MATCH<0.75)
% non-canonical: 59.3 %
(MATCH<0.75
)
(
a
)
number
of
distinct
11
mers
enriched
during EMSA-Seq
from a starting pool
of 2,097,152 sequences
(
b
)
RELAp52
% non-canonical: 96 %
(MATCH<0.75)
% non-canonical: 90.1 %
(MATCH<0.75
)
Figure 4 EMSA-Seq profiling of the NF-B RELA-containing dimers. (a) Grouping of 11-mer sequences bound by the homodimer RELARELA
and the heterodimers RELAp50 and RELAp52 during EMSA-Seq. In parentheses are proportions out of all possible 2,097,152 11-mer sequences.
(b) De novo motif identification was performed on the 50 and 1,000 top-scoring 11-mer sequences from each experiment using the Priority
algorithm [51]. No priors were used for motif identification and logos were generated using the enoLOGOS web tool [52]. For every dimer, the
percentage proportion of sequences that are non-canonical (MATCH < 0.75) and that have contributed towards construction of the motif has
been indicated.
Table 2 Comparison of profiles for RELA-containing dimers
RELARELA RELAp50 RELAp52
Proportion of 11-mer sequences shared with RELARELA 61% 63%
Proportion of 11-mer sequences shared with RELAp50 81%
Proportion of 11-mer ‘canonical NF-B binders’ (n = 4,399) that are enriched 72% (3,167)
a
84% (3,683)
a
82% (3,599)
a
Proportion of enriched 11-mer sequences that have a MATCH score < 0.5 43% (n = 217,543) 47% (n = 289,319) 61% (n = 281,312)
Similarities between the binding profiles of the three dimers with proportions of ‘canonical NF-B binders’ and sequences with MATCH scores < 0.5 present in
each.
a
Hypergeometric probability test for over-representation: P = 1e-99.
Wong et al. Genome Biology 2011, 12:R70
/>Page 7 of 18
GGGGAATCCCC
GGGGACTTTCC
H
-2
HIV
complex-
NF-kB
(nM)
- 20 40 26 22
- 20 40 26 22
p50p50
RELARELA
RELAp50
RELAp52
p50p50
RELAp50
RELAp52
RELARELA
DNA-
EMSA
r
egion
UV-laser
footprint
NF-kB interactor
r
DNase
teractor region
DNase
I
footprint
NF-kB in
1 2 3 4 5 6 7 8 9 10
(a)
NF-kB
NF-kB
p50
p50
RELA
RELA
RELAp5
AGGGGAAGTTA
DNase I
-10 - 80 7153060 10204080
- 20 100 60 80
AGGGGAAGTTA
UV
NF-kB
(nM)
CTGGGGATTTA
DNase I
- 10 - 80 7 153060 10204080 - 20 100 60 80
RELARELA
RELAp50
RELAp52
p50p50
p50
p50
RELA
RELA
RELAp50
RELARELA
RELAp50
RELAp52
p50p50
UV
CTGGGGATTTA
-
UV
-
UV
(nM)
DNA-
complex-
EMSA
DNA-
complex-
EMSA
k
B interactor region
kB interactor region
NF-
k
NF-
2111019 8 7 6 5 4 3 2 12111019 8 7 6 5 4 3 2 1
DNase I footprint
1314 151617
UV-laser footprint DNase I footprint
1314 151617
UV-laser footprint
(b)
40
45
25
30
35
affinity (z-score)
(AGGAAATTCCG)
10
15
20
binding
RELARELA
RELAp50
CTGGGGATTTA
5
similarity of sequence to reference (MATCH-score)
0.20 0.40 0.60 0.80 1.00
Grp1
Grp5
UV-footprinte
d
11-mer
(c)
Grp4
RELAp52
GGGGACTTTCC(HIV)
AGGGGAAGTTA
AGGGGGATCTG
CGGAATTTCCT
GGGGAATCCCC(MHC H-2)
Grp3
Grp2
(nM)
RELAp52
(nM)
RELAp52
NF-kB
Figure 5 Specific interaction of NF-B dimers with canonical and non-canonical sequences. (a) Interaction of four NF-B dimers, p50p50,
RELARELA, RELAp50 and RELAp52, with canonical sequences containing either a H-2 binding site (lanes 1 to 5), or a HIV recognition site (lanes 6
to 10). These were profiled using EMSA (top panel), UV laser (middle panel) and DNAse I (bottom panel) footprinting techniques (with interactor
regions demarcated with vertical black lines). For example, RELA dimer-DNA complexes were detected with EMSA (lanes 3 and 8; red arrows).
Furthermore, a ‘UV footprint’ in the form of lower intensity banding observed within the interactor region (relative to controls in lanes 1 and 6)
indicates specific interactions of varying affinities between the dimer and DNA. (b) Interaction of RELARELA with the non-canonical sequences
was non-specific. With both sequences, distinct dimer-DNA complexes were observed by EMSA with all dimers except RELARELA, for which a
smear was obtained (lane 4: RELARELA). No footprint was observed with RELARELA, whilst for the other dimers a stronger footprint was obtained
with AGGGGAAGTTA compared to CTGGGGATTTA. (c) Median enrichment of 11-mers bound by the three RELA-containing dimers in EMSA-Seq.
Five groupings of sequences were formed on the basis of MATCH similarity (Grp1 ≤ 0.20, 0.201 ≥ Grp2 ≤ 0.40, 0.401 ≥ Grp3 ≤ 0.60, 0.601 ≥ Grp4
≤ 0.80 and Grp5 ≥ 0.801). There is a trend of enrichment increasing alongside MATCH similarity. Also shown are the average enrichment values
and corresponding similarities to the reference for the six 11-mer sequences that were footprinted (crosses with sequence indicated).
Wong et al. Genome Biology 2011, 12:R70
/>Page 8 of 18
also variat ion in affinities amongst sequences with com-
parable MATCH scores (Figure S2 in Additional file 1).
Examining NF-B activity in vivo using data from DNA-
binding platforms
To estimate the NF-B binding potentia l as measured
by EMSA-Seq for the interpretation of in vivo NF-B
binding, we overlaid dimer-specific 11-mers from our
datasets onto all binding region summits (BRSs; see
Materials and methods) from a study by Kasowski and
co-workers [6]. In effect, 11-mer binders identified by
EMSA-Seq were mapped onto a 300-bp region, the BRS,
which is centered on the summit point within a binding
region (BR) (Figure 6). For visualization purposes, the
intensity of the coloration used during mapping is
reflective of the binding affinity of a NF-Bdimerfor
11-mer sequences identified by EMSA-Seq. The NF-B
binding potential of a BRS was then calculated by add-
ing up the in vi tro binding affinities of a set of dimer-
specific 11-mers, either the homodimer or a heter odi-
mer of RELA. Using data from the 1000 Genomes Pro-
ject,weidentifiedpolymorphisms,ifany,withinthe
BRSs of paired individuals. Polymorphisms may or may
not alter the composition of 11-mer sequences within
the BRS of an individual. For example, as a direct conse-
quence of two polymorphisms, individual NA18505 has
higher NF-B binding potential compared to individual
NA12891 and this corresponds to a greater extent of in
vivo NF-B binding observed (Figure 6).
Kasowski and co-workers [6] determined that a total
of 25,764 comparisons had differences in NF-B binding
between paired individuals. Our analysis revealed that of
these, only 7,762, covering 2,710 BRSs, are associated
with paired individuals having sequence polymorphisms
within the BRS. This is an important point as only in
this subset of comparisons can differences in NF-B
binding between paired individuals be direct ly attributed
to differences in DNA sequence. Using our data in
conjunction with these comparisons, we sought to gen-
erate an ‘exten ded NF-B binder’ set of 11-mers defined
on the basis of enrichment during EMSA-Seq, but also
taking into account similarity to the reference binding
model. Estimations of in vitro-in vivo correlation made
using the 5,000 most enriched sequences were consider-
ably more successful (71% direct positive correlation;
Figure S3a in Additional file 1) than those with the
5,000 least enriched sequences (51% direct positive cor-
relation; Figure S3a in Additional file 1). A direct posi-
tive correlation is when the trend of bindin g differences
for in vivo binding and in vitro binding potential
(EMSA-seq) is in the same direction across paired indi-
viduals. It is also striking that with the exclusive use of
binding potentials derived from a subgroup of highly
enriched sequences that are not within the defined
‘canonical NF-Bbinders’ subset, we were still able to
achieve 71% in vitro-in vivo correlation (Figure S3b in
Additional file 1). Our optimal result was achieved using
only 11-mer s enri ched at levels greater than the median
z-scores for specific sets or ‘bins’ of sequences formed
on the basis of MATCH scores (minimum of no less
than 10% below median value for each MATCH score
‘bin’ ; Figure S3c in Additional file 1). This included all
the enriched sequences that also interacted specifically
with the RELA-containing dimers as judged by foot-
printing (Figure 5c) and allowed for the investigation of
5,452 comparisons covering 1,959 BRSs, in essence
representing the best compromise between sensitivity
and accuracy for in vivo-in vitro comparisons. Dire ct
positive correlation of in vitro NF-B binding potential
with in vivo NF-B binding was o bserved in 3,559 com-
parisons covering 1,405 BRSs ( or 65% of 5,452 compari-
sons). There are 1,893 comparisons covering 883 BRSs
(
or 35%) that display ed no direct correlation between in
vitro and in vivo data, and there are 2,310 (958 BRSs)
comparisons in which genomic variation between indivi-
duals has not resulted in any detectable difference in
Table 3 Binding affinities of RELA-containing dimers for canonical and non-canonical sequences
RELARELA RELAp50 RELAp52
Binding affinity
(z-score)
Binding
affinity (K
d
)
Binding affinity
(z-score)
Binding
affinity (K
d
)
Binding affinity
(z-score)
Binding
affinity (K
d
)
11-mer
sequence
MATCH_score Microarray EMSA-
Seq
UV-laser
footprint
Microarray EMSA-
Seq
UV-laser
footprint
Microarray EMSA-
Seq
UV-laser
footprint
AGGAAATTCCG 0.86 3.70 40.90 3.25 1.20 20.42 4.60 0.55 13.00 1.70
AGGGGGATCTG 0.49 Non-
binding
Non-
binding
Non-binding 2.39 23.10 10.50 1.76 18.35 2.00
AGGGGAAGTTA 0.43 NA 3.78 Non-binding NA 35.41 26.00 NA 27.50 20.00
CTGGGGATTTA 0.29 NA 10.84 Non-binding NA 24.17 16.00 NA 19.54 13.80
Binding affinities were measured using microarrays, EMSA-Seq and UV laser footprinting. Canonical sequences have MATCH scores ≥ 0.75 whilst non-canonical
sequences have MATCH scores < 0.75. Where a sequence was not present on the microarrays this has been indicated with ‘NA’. Decreasing binding affinities
correspond to decreasing z-scores for both microarrays and EMSA-Seq, but increasing K
d
values in the case of measurements done with UV laser footprinting. All
values were derived from three and two independent experiments for microarrays and UV laser footprinting, respectively. Values for EMSA-Seq were derived
from datasets obtained from the pooling of three independent experiments per dimer.
Wong et al. Genome Biology 2011, 12:R70
/>Page 9 of 18
binding potential, due to SNPs either not affecting 11-
mers within our datasets or affec ting only very low affi-
nity binders (Figure S4 in Additional file 1).
Using the 3,559 comparisons covering 1,405 BRSs for
which there is direct positive correlation, we examined
potential implications for disease association studies.
From a database listing all genome-wide association stu-
dies (GWASs) [27], we created a comprehensive list
identifying the trait/disease-associated SNPs (TASs) hav-
ing the highes t risk association within each study (Addi-
tional file 4). All 3,407 TASs analyzed were mapped to
the nearest BRS. We focused on TASs within 1 kb from
the center of the nearest BR (this region is also referred
toasaBRS)toensuregoodlinkagedisequilibrium
between the TAS and a SNP unde r the peak. From all
TASs identified in the database, 13 were within this
limit and from these we observed a prevalence of
inflammatory disease-associ ated polymorphisms, in par-
ticular those linked to autoimmune diseases (8 of 13
TASs with P = 2.8e-05; hypergeometric probability test
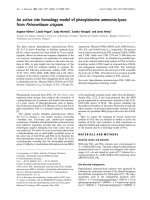
for over-representation). We present two examples of
this. In Figure 7a, TAS rs2205960 is a SNP that is within
the BRS, and not only is the disease allele (T) associated
with systemic lupus erythematosus, but according to our
data it creates a potential binding site which in turn is
associated with increased in vivo RELA binding . In
another case (Figure 7b), TAS rs6806528 has been
described as being associated with celiac disease; this
TAS is found within the BR, not the BRS, but more
importantly it is in perfect linkage disequilibrium with
another SNP that is under the BRS, rs6776243. The dis-
ease allele (rs6806528, allele T) thus segregates perfectly
with the allele associated with both high in vivo binding
and in vit ro binding potential (rs6776243, allele C). In
both cases, the risk allele for disease is present in the
haplotype associated with higher in vivo binding and
also higher in vitro binding potential, whereas the other
haplotype containing the normal allele is associated with
lower in vivo binding and lower in vitro binding
potential.
Discussion
Eukaryotic genes are regulated largely through the inter-
actions of TFs and their assembly into enhancer com-
plexes. There are many examples of DNA variation in
enhancers that affects transcription factor binding and
has functional consequences for gene expression, for
example in the NF-B and OCT1 sites in the tumor
NA12891
NA18505
300bp BR-Summit
(BRS)
300bp BR-Summit
(BRS)
BR
BR
highest affinity
lowest affinity
RELARELA
RELA 50
11-mer
highest affinity
45,370,813 45,370,860 45,370,813 45,370,860
RELA
p
50
RELAp52
non-binde
r
RELAp50
RELARELA
lowest affinity
highest affinity
lowest affinity
Chromatin ImmunoPrecipitated region (ChIP-ed region) Genomic co-ordinates
Binding Region (BR) chr2: 45,370,457- 45,371,303
BR-Summit (BRS)* chr2: 45,370,702- 45,371,001
*BRS is a 300 bp region centered about the point of maximum binding intensity within the BR
RELAp52
NF-țB Binder
(MATCH >0.75)
sequence
polymorphism
between
paired individuals
Figure 6 Direct positive correlation of binding potential and in vivo binding. Presence of dimer-specific 11-mer sequences (colored boxes)
enriched during EMSA-Seq within a 300-bp region (BRS) inside a binding region (BR) that was isolated during immunoprecipitation of RELA.
Boxes are 11-mer sequences shown with an overlap of 10 bp for adjacent boxes. The gradient of coloration within boxes corresponds to relative
binding affinities as determined by EMSA-Seq. A non-colored box represents an 11-mer sequence that was not bound by a RELA-containing
dimer. Sequences that are also known NF-B binders are indicated (filled triangles). Arrows indicate the positions of sequence polymorphisms
between the two individuals.
Wong et al. Genome Biology 2011, 12:R70
/>Page 10 of 18
NA 12878
BR-Summit (BRS); a 300 bp region
centered about the point of
maximum binding
intensity within the
G
T
rs2205960
Disease haplotype
NA 12891
TCACCAAAACT
{MATCH-score: 295}
ChIP-ed Binding
Region (BR)
Binding Region (BR) on 1q25.1
G
NA
12891
(a)
NA 12878
GGGGGATCCCC
GGGGATCCCCC
GGGATCCCCCT
G
G
A
T
C
C
C
C
C
T
G
{MATCH-score: 815 }
{MATCH-score: 815 }
{MATCH-score: 703 }
{MATCH
-
score: 417 }
BR-Summit (BRS); a 300 bp region centered
about the point of maximum binding intensity
within the ChIP-ed Binding Region (BR)
T
Disease haplotype
C
G
G
A
T
C
C
C
C
C
T
G
GATCCCCCTGC
ATCCCCCTGCT
TCCCCCTGCTA
CCCCCTGCTAT
CCCCTGCTATT
CCCTGCTATTA
{MATCH
-
score:
417
}
{MATCH-score: 232 }
{MATCH-score: 231 }
{MATCH-score: 274 }
{MATCH-score: 61 }
{MATCH-score: 107 }
{MATCH-score: 74 }
C
T
rs6806528
rs6776243
GGGGGATCCCT
GGGGATCCCTC
GGGATCCCTCT
ATCCCTCTGCT
TCCCTCTGCTA
{MATCH-score: 728 }
{MATCH-score: 706 }
{MATCH-score: 598 }
{MATCH-score: 345 }
{
MATCH-score: 279
}
Binding Region (BR) on 3p14.1
NA 10847
CCCTCTGCTAT
{
}
{MATCH-score: 64}
(b)
Figure 7 Binding potential and risk alleles of disease. (a) The trait/disease-associated (TAS) SNP rs2205960 (box, red outline) is associated
with systemic lupus erythematosus. The 300-bp region (BRS) of individual NA12878, who is a carrier of the risk allele (T), contains a single 11-
mer that was enriched during EMSA-Seq with RELAp50 whereas NA12891, who carries the normal allele, does not. This has resulted in NA12878
having a higher NF-B binding potential that is directly correlated to higher in vivo binding. (b) The TAS rs68065278 (box, red outline) is
associated with celiac disease. It is in linkage disequilibrium with another polymorphism, rs6776243, present within the BRS (box, green outline).
The BRS of individual NA12878, who is a carrier of the C allele for rs6776243, contains more 11-mers that were enriched during EMSA-Seq with
RELAp50 than that of the other individual. This has resulted in NA12878 having a higher NF-B binding potential that is likewise directly
correlated to higher in vivo binding.
Wong et al. Genome Biology 2011, 12:R70
/>Page 11 of 18
necrosis factor promoter [28,29]. Our earlier studies
aimed to predict in silico the effects of SNPs within reg-
ulatory sequences using a statistical model to describe
NF-B-DNA interactions [21]. Here we applied a novel
experimental approach to profile NF-BDNAbinding
properties in vitro (but which is applicable to any o ther
TF) and documented differences in binding preferences
between the various protein dimers. We then used our
data to explain differences in in vivo NF-B recruitment
between eight individuals [6]. We achieved a signi ficant
increase in the number of interpretable effects compared
to when only canonical motifs were considered and also
observed an association between TF binding and the
allelic signature for disease.
Profiles of binding affinities built using this dual-platform
approach (microarrays and EMSA-Seq)
The correlation of binding data g enerated by both
EMSA-Seq and microarray platforms is in the order of
77 to 84% (Figure S5 in Additional file 1), indicating
that they cross-validate each other well. Using both plat-
forms we observed that the RELARELA homodimer was
most distinct from the other dimers (Figures 2 and 4a),
a finding confirmed by DNaseI and UV laser footprint-
ing. On the other hand, the binding profiles of heterodi-
mers containing p50 or p52 subunits were more simil ar
(Table 3). These results agree with the findings of Chen
and co-workers [30,31], who showed that DNA
sequences bound by RELARELA were distinct from
those bound by homodimers of p50 and p52. The
GGAA motif was strongly associated with RELA-bound
sequences whilst GGGRY was more prevalent in
sequences bound by p50 and p52. Indeed, we found that
within the 100 11-mer sequences for which RELARELA
had the highest affinity, 76% of these contained a
GGAA motif whilst only 42% contained a GGGRY
motif. This is manifested in a representative binding
model for RELARELA built using 61 sequences that
were preferentially bound by this dimer only (Figure 2).
Conversely, with RELAp50 and p50p50, only 37 to 47%
of the 100 sequences for which they had the highest affi-
nity contained a GGAA motif, whilst 64 to 67% of these
sequences contained a GGGRY mo tif. Our results sup-
port the hypothesis that p50 and p52 subunits have a
major influence on the binding characteristics of NF-B
dimers (Figures 2 and 4a; Table 3). Of interest, in agree-
ment with Badis and co-workers [24], we observed that
lower affinity sequences contributed most to dimer-spe-
cific preferences. Two of the proteins in our study,
RELAp50 and RELBp52, are activated by distinct NF-B
pathways within the cell, the canonical and alternative,
respectively. Interestingly, two previous studies examin-
ing the binding cha racteristics of these TFs reached dif-
ferent conclusions. In their approach using 200
sequences containing 10-me r motifs derived from ran-
dom site selection, Britanova et al. [32] reported a lack of
distinction in the binding of these two heterodimers.
This contradicts a previous report by Bonizzi et al. [33]
in which these two hete rodimers could reco gnize distinct
motifs. In particular, the sequence GGGAGATTTC pre-
sent at the B-Lymphocyte Chemoattractant (BLC)-B
binding site, for which Britanova et al. could not detect
any bindi ng. Overall, our data agree with Britanova et al.
in that we did observe a 95% correlation in the binding
properties of these two dimers (Table S2 Additional file
1). On the other hand, we also identified RELBp52 as
being the stronger binder of the BLC-B sequenc e and
this is in agreement with Bonizzi et al (microarray data
provided as Additional file 2). The discrepancy concern-
ing specifically this sequence may have arisen from differ-
ences between protein preparations (mammalian- versus
bacteria-based systems) or experimental conditions.
We feel that whilst our profiling, done using microar-
rays that encompass a comparatively larger number of
sequences, has shown that RELBp52 has an overall simi-
lar binding profile to RELAp50, individual sequences did
show distinct binding properties between the two pro-
teins. Thus, an exhaustive profiling of these dimers
using EMSA-Seq would be a logical follow-on to this
study, which should then give us more insight into their
binding preferences.
Optimal interpretation of NF-B DNA binding requires
both canonical and non-canonical sequences
A recent study examining the relationship between pro-
tein binding microarray-derived binding-models and in
vivo binding had to make an assumption that the experi-
mentally derived affi nities of DNA sequences were
equally applicable to binding in vivo [7]. Analyzing the
relationship between DNA sequence and binding using
a dataset de rived from several in dividuals offers the
advantage of examining binding between individuals at
the same genomic location rather than across different
ones. Data from the 1000 Genomes P roject coupled
with those from Kasowski and co-workers have enabl ed
us to compare differences in binding between indivi-
duals across the same genomic locations but that had
polymorphisms in DNA sequence. Our set of ‘extended
NF-Bbinders’ provided the optimal compromise
between sensitivity and accuracy for estimation (Figure
S3c in Additional file 1). When we interrogated the
same data using only our measured binding affinities
obtained for 3,109 of the 4,399 ‘canonical NF-Bbin-
ders’ , we could visualize differences across only 892
comparisons covering 276 BRSs with direct positive cor-
relation in 82% of the d ata (Figure S6 in Additional file
1). Whilst this is comparable to a computationally
derived result of 79% in yeast [4], it also clearly
Wong et al. Genome Biology 2011, 12:R70
/>Page 12 of 18
demonstrates the limitation of ca nonical NF-Bbinding
motifs in interpreting more than a small fraction of
binding events overall. For example, 1,273 BRSs do not
involve ‘canonical N F-B binders’ in any pair-wise com-
parison but do include ‘extended NF-Bbinders’.Our
data thus provide strong evidence for the value of in
vitro-enriched k-mers in estimating NF-Bbinding
potential and emphasize the positive contribution of
non-canonical binders outside of the classical NF-B
consensus (Figure 6; Figure S3b in Additional file 1).
Of interest, despite us having profiled three RELA-
containing dimers, there are still 1,893 comparisons cov-
ering 883 BRS s for which there is no direc t correlation
between binding potential and in vivo binding (Figure
S3c in Additional file 1). Immunoprecipitated TFs are
often part of larger protein complexes and identifying
direct bindin g to DNA is ther efore no trivial ta sk in
these cases [34,35]. It is possible, therefore, that for the
comparisonswherewewereunabletocorrelateNF-B
binding potential with in vi vo NF-B binding, REL A
may not have bound directly to DNA. By mapping
TASs within the BRS, we observed that there was a high
prevalence of inflammatory disease-associated poly-
morphisms. This includes auto-immune conditions,
such as celiac disease [36], systemic lupus erythematosus
[37], primary biliary cirrhosis [38], rheumatoid arthritis
[39], Crohn’ s disease [36], multiple sclerosis [40] and
also a trait associated with immunoglobulin A deficiency
[41]. The inflammatory response, of which NF-Bisa
key modulator, features prominently in all of the above
mentioned conditions. As a ubiquitously expressed TF,
NF-B plays a major role in many biological processes,
namely inflammation and immunity. Upon activation,
NF-B translocates to the nucleus and binds specific
motifs within the genome in order to activate transcrip-
tion of genes associated with these and other processes.
We used a database of disease-associated polymorph-
isms and identified 13 SNPs, all present within 1 kb of
theBRS,ofwhich8werelinkedtoinflammatorydis-
eases. It is reasonable to hypothesize then that increased
NF-B binding observed at BRs associated with disease
traits may contribute to increased levels of inflammation
and immune activity.
Our design for EMSA-Seq included a deep sequencing
approach, which allowed for an extensive survey of
sequences bound by TFs far beyond the numbers
achieved by methods such as standa rd SELEX, and pro-
vided the statistical power to discriminate enriched
sequences from background. Our deep sequencing
approach yielded an average of 6 million reads per
experiment, with the highest being 15 million, in con-
trast to 30,000 to 300,000 reads obtained in experiments
with a single TF in two other comparable methodologies
[8,14]. Despite this, there remained 2,310 comparisons
in which genomic variation has apparently not resulted
in any difference in binding potential between indivi-
duals (see Results). To address this, deeper sequencing
may be required in order to both id entify other binders
and enhance perception of differences in binding affi-
nities between binders, thus offering invaluable insights
into the strengths and limitations of different implemen-
tations of EMSA-based technologies.
Conclusions
With our data we were able to describe differences in
binding preferences between NF-B dimers. We showed
that NF-B binds not only canonical but also non-cano-
nical motifs and generated data that greatly enhances
our ability to describe NF-B binding sites. This facili-
tated the analysis of NF-B binding sites throughout the
genome, revealing SNP variation between individuals.
Through this we were able to determine the effect of
SNPs on NF-B binding. T his study represents a major
development in interpreting data generated by techni-
ques like ChIP-Seq, as well as expression quantitative
trait loci (eQTL) data and variations reported in
GWASs of functional traits. NF-Bisonlyoneamong
scores of common TFs that regulate a majority of genes.
It should be feasible, therefore, to generate similar data
for other TFs to interpret and predict the effects of var-
iations on TF binding genome-wide and to begin to
model how gene ex pression varies as a function of poly-
morphisms within binding sites.
Materials and methods
Sequences of the different primers and DNA ligands can
be found in Additional file 5. All q uantification of
nucleic acid samples was performed according to manu-
facturer instructions on a Qubit Fluorometer (Invitrogen
#Q32857, Paisley, United Kingdom) and with either the
Quant-iT dsDNA High Sensitivity Assay Kit (Invit rogen
#Q33120) or the Quant-iT dsDNA Broad Range Assay
Kit ( Invitrogen #Q33130). Protein assays were per-
formed using the Quant-iT™ Protein Assay Kit (Invitro-
gen #Q33210).
Protein expression and purification
Expression constructs for the nine NF-B dimers (Homo
sapiens)usedinthisstudywerecreatedfollowingaset
of procedures previously established by Udalova and co-
workers [42]. T he dimers ar e formed from these subu-
nits: RELA (p65), RELB, C-Rel (REL), p50 (NFKB1) and
p52 (NFKB2). Briefly, pET vectors for expression in
BL21 (DE3) Escherichia coli (Merck, Nottingham, Uni-
tedKingdom)wereusedtoproduce histidine-tagged
(His-tagged) recombinant proteins. Proteins were over-
expressed through induction with 0.2 mM isopropyl b-
D-1-thiogalactopyranoside (IPTG) at 30°C for 5 hours.
Wong et al. Genome Biology 2011, 12:R70
/>Page 13 of 18
Pellets of cells were harvested in ‘Ni-NTA binding’ buf-
fer with added EDTA-free protease inhibitor (Roche,
West Sussex, United Kingdompulse-sonicated for 2 min-
utes and debris removed via centrifugation at 16,000 g.
A two-step purification procedure was then employed,
first with the ‘Ni-NTA His-Bind Resin’ system (Merck
#70666) and then a subsequent purification based on
DNA-affinity isolation of functional, DNA-binding pro-
tein. Ni-NTA purification was carried out according to
the manufacturer’s guidelines. For DNA-affinity isola-
tion, the processing of a sample derived from 250 ml of
bacteria culture required 0.128 μM of oligonucleotides
comprising the TNF prom oter (biotinylated) and com-
plementary sequence of this. Prior to use, the oligonu-
cleotides were annealed via incubation in NEB Buffer 3
at 94°C for 1 minute then subsequently for an additional
69 cycles of 1 minute each coupled to a per-cycle, step-
wise decrease of 1°C. A pre-annealed oligo mixture
(712.5 μl) was conjugated with streptavidin-agarose
(Sigma, Dorset, United Kingdom) before once-purified
material from the preceding step was added to it.
Protein binding microarrays
We designed 8 × 15 K Agilent arrays using eArray [43]
(details can be found in Additional file 6). Briefly, using
the canonical consensus sequence GGRRNNYYCC
[13,23] as a start point, we expanded this in order to
represent not only the strict consensus but also a host
of other sequences. Our expanded 11-mer motif,
RGGRNNHHYYB, was processed using the principal
co-ordinates method developed by Udalova and co-
workers [21]. The outcome was 803 DNA sequences
that are representative of the ‘k-mer space’ encompassed
by the expanded motif. Our microarray covers relatively
little of ‘11-mer space’ when compared to another pre-
viously described by Berger and co-workers [44] that
has exhaustive coverage of ‘10-mer space’. However, our
uncomplicated probe-desi gn with its well-defined
regions has the advantage of fewer confounding factors
when interpreting TF-DNA binding events. For exam-
ple, only one variable region 11-mer is present on a
probe (Additional file 6). In addition, four different con-
figurations of each 11-mer, as determined by the flank-
ing sequence around it, are represented on four
separate sets of probes. Protocols for the preparation
and hybridization of microarrays can be found in Addi-
tional file 1.
EMSA-Seq (TF-DNA binding followed by EMSA and deep
sequencing)
We chose DNA ligands that were 60-mers in length to
facilitate both the formation of double strands and the
library preparation procedure that precedes sequencing.
Protocols for the creation of double-stranded
oligonucleotide pools and preparation of libraries for
deep sequencing can be found in Additional file 1.
For TF-DNA binding followed by EMSA, essentially a
20-μl reaction composed of purified protein, double-
stranded DNA ligand and 125 μg/μl poly dI-dC buffered
in 12 mM HEPES pH7.8, 75 mM KCl, 1 mM EDTA, 4
mM GTP and 12.5% glycerol was incubated at room
temperature f or 1 hour. A DNA:protein ratio of 8:1
molecules was maintained in our TF binding experi-
ments. TF-DNA mixtures were subsequently loaded
onto a 6% DNA retardation gel (Invitrogen
#EC6365BOX) alongside ‘no protein’ and ‘no DNA’ con-
trols, and migrated in Novex 0.5 × TBE running buffer
(Invitrogen #LC6675) for 1.5 hours. Gels were stained
using Invitrogen’ s EMSA-Kit (#E33075) following the
manufacturer’ s procedures. Visualization of gels was
performed using either a DR46B Transilluminator (Clare
Chemical Research, Dolores, Colorado, USA o r LAS-
4000 system (Fujifilm, Japan). Bands containing TF-
DNA complexes were excised from gels, elution of DNA
carried out overnight at room temperature using a diffu-
sion buffer (0.5 M ammonium acetate, 10 mM magne-
sium acetate, 1 mM EDTA pH 8.0, 0.1% SDS) and the
DNA purified using QIAGEN’ s polyacrylamide gel
extraction protocol (#20021) (QIAGEN, West Sussex,
United Kingdom). This was then processed for deep
sequencing (Supplementary Material in Additional file
1).
For experiments in which several rounds of SELEX
were carried out, the following procedure was adopted.
DNA obtained after the first round of TF-DNA binding
followed by EMSA, elution and purification was ampli-
fied using a high-fidelity PCR procedure adapted from
Beinoraviciute-Kellner and co-workers [45]. Briefly, mul-
tiple 100-μl reactions, each composed of 0.2 mM
dNTPs, 1 μM primers 1 and 2, together with 2 units of
KOD Hot Start Polymerase (Merck #71086-3) buffered
in accompanying 1 × PCR buffer, were incubated for 15
s at 95°C, then subjected to 25 PCR cycles (5 s 95°C, 5 s
60°C,5s70°C).DNAwaspooled,purifiedusingphe-
nol-chloroform and concentrated via ethanol precipita-
tion. This was subsequently used as starting material for
TF-DNA binding in the second round of SELEX.
EMSA, DNase I and UV laser footprinting
High performance liquid chromatography-purified oligo-
nucleotides containing NF-B binding sites were pur-
chased from MWG (Ebersberg, Germany) a nd further
processed into labelled probes as described in the Sup-
plementary Material in Additional file 1.
TF-DNA binding reactions were then prepared in buf-
fered volumes of 25 μl(10mMTris,pH7.4,75mM
NaCl, 1 mM EDTA, 1 mM dithiothr eitol, 200 μg/ml
bovine serum albumin, 0.005% NP-40). From this, an
Wong et al. Genome Biology 2011, 12:R70
/>Page 14 of 18
aliquot of 5 μlwasusedforEMSA,10μlforDNaseI
footprinting as previously described [46] and the
remainder for UV laser footprinting, which involved
exposure to a single, high intensity UV pulse from the
fourth harmonic generation of a nanosecond Nd:YAG
laser (wavelength, 266 nm; pulse duration, 5 ns; energy,
0.1 J/cm
2
; Surelite 1, Continuum USA, Villebon sur
Yvette, France). DNA was then supplemented with 0.1%
SDS, purified by phenol-chloroform extraction, ethanol
precipitated, dissolved in the binding buffer and thor-
oughly digested using Fpg protein and T4 endonuclease
V (Trevigen, Montucon, France) for 30 minutes at 30°C.
This was then resuspe nded in a formamide loading buf-
fer and migrated on a 13% polyacrylamide sequencing
gel. Dried gels were exposed overnight on a phosphori-
mager screen and the images analyzed using a Fuji 5100
Phosphorimege scanner and Multi Gauge 3.0 software
(Fujifilm). Affinities (K
d
) of the different dimers for
binding sites represented on each probe were deter-
mined using the following procedure. Intensities of gua-
nine (8-oxoG) and pyrymidine (cyclobutane pyrimidine
dimers) ‘ cleavage ba nds’ within the binding site were
quantified by integration and normalized to either total
radioactivity loaded or a reference guanine ‘ cleavage
band’ located outside of the binding site. Curves repre-
senting normalized cleavage band intensities versus
dimer-concentration were ‘least s quare deviation fitted’
by smooth dependencies, and K
d
was determined as
dimer concentration corresponding to half of the ampli-
tude change.
Statistical analyses
Data pre-processing
For microarrays, a z-score was obtained using log
2
-
transformed intensities and the median of replicat es cal-
culated for each probe within every array. EMSA-Seq
involved establishment of enriched 10- and 11-mer sets
corresponding to selection by the dimers p52p52,
RELARELA (p65p65), RELAp50 (p65p50) and RELAp52
(p65p52). The processing of reads obtained after dee p
sequencing is described in the Supplementary Mater ial
in Additional file 1. All ‘ Meryl’ k-mer counts for a
sequence obtained from these processed reads have
been normalized against t he dataset with the lowest
number of acceptable reads for that sequence.
A binomial distribution model was used to determine
enrichment (z-score) of ‘ Meryl’ k-mers for all datas ets.
To determine which 10- or 11-mers were significantly
enriched (10-mers used in p52p52 experiments, 11-mers
for everything else) as a result of the selection process,
the number of Meryl 10- or 11-mers obtained after pro-
tein selection was compared against the number of
Meryl 10- or 11-mers generated by the sequencing of a
controlpool.Tothisend,wemodeledthenumberof
times each 10- or 11-mer is observed in a pool as a
binomial distribution with parameters ‘n’ and ‘p’; ‘n’ cor-
responds to the total number of 10- or 11-mer observa-
tions in the pool and ‘p’ the probability of observing a
given 10- or 11-mer. In the absence of selection this
probability is assumed to be identical for both the con-
trol and protein-selected pools. If, o n the other hand,
the 10- or 11-mer is preferentially bound by the protein,
the probability of observing this 10- or 11-mer is then
expected to be increased in the protein-selected pool.
These two scenarios are compared through a likelihood
ratio test and P-values are corrected for multiple testing
using a Benjamini-Hoc hberg procedure to enforce a
false discovery rate of 0.01. Fundamentally, a 10- or 11-
mer that is highly enriched after selection (high z-score)
and has a low, corrected P-value is one that is bound by
a protein at high affinity (Figure S7 in Additional file 1).
Over-representation of a category within datasets
Hypergeometric probability tests were used to test the
significance of categories within datasets.
Analyses of enriched 10- or 11-mers
Mapping of 11-mers within BRs, derivation of NF-B
binding potential and determination of direct positive
correlation between binding potential and in vivo TF
binding
Scripts were used to map the presence and location of
11-mers within a 300-bp segment centered about the
position within the BR that has the maximum number
of ChIP-Seq tags (these are BRSs). For our analyses we
have established the genom ic coordinates of a BRS to be
BR-specific and these do not vary between different
individuals . Mapping was performed for all BRSs across
eight individual genomes.
Two methods to determine overall NF-Bbinding
potential for a BRS were tested. First, z-scores for all
enriched 11-mers from the three RELA-containing
dimer datasets that could be mapped within a BRS were
added up. A difference, if any, in binding potential
between BRSs of paired individuals was then deter-
mined. Between paired individuals, a ‘successful’ rationa-
lization of binding potential and in vivo TF binding
(direct positive correlation) was when the trends of dif-
ference in both were in the same direction. Second, z-
scores for all enriched 11-mers from one RELA-contain-
ing dimer within a BRS were added up. For pairwise
comparisons that were not succes sfully ration alized, the
process was repeated with a different RELA-containing
dimer until all datasets had been covered. The optimal
result was given by the second method.
Use of the tool MATCH as a basis for similarity to a
reference binding model
MATCH as implemented by Kel and co-workers [47]
was used for the derivation of a similarity score for 11-
Wong et al. Genome Biology 2011, 12:R70
/>Page 15 of 18
mer sequences in relation to a reference binding model.
Two sets of MATCH scores have been assigned to 11-
mer sequences (Additional file 7). One set was derived
using a binding model based on V$NFKB_Q6_01, a
PWM for NF-B in the TRANSFAC database (this is
also our refere nce binding model; Table S3 in Addi-
tional file 1), and the other on the 300 highest affinity
binders from all three RELA-containing dimer EMSA-
Seq datasets ( this is an alternative binding model cre-
ated using our EMSA-Seq binding data; Table S3 in
Additional file 1). Theoretically, a MATCH score of 1.0
corresponds to the highest degree of similarity possible
whilst 0 corresponds to the lowest.
’Canonical NF-B binders’, a group of 11-mer sequences
with high similarity to V$NFKB_Q6_01
A grouping of 4,399 sequences termed ‘canonical NF-B
binders’ was formed by using all sequences with
MATCH scores > 0.75 (based on reference binding
model). These can be found in Additional file 3.
General organization of information used for analyses
There are 6,383 BRs represented within the 25,764 pair-
wise comparisons examining b indi ng differences across
eight different individuals (NA18526, NA19099,
NA12892, NA18951, NA18505, NA12878, NA12891 and
NA10847) and these were previously established in the
study encompassing multiple RELA-ChIP experiments
[6]. Genomic information for the eight individuals (April
2009 release) w as obtained from a database maintained
as part of the ‘1000 Genomes’ project [48].
Analysis of trait/disease associated SNPs in relation to in
vitro and in vivo data
The National Human Genome Research Institute has
created a comprehensive database of all GWAS publica-
tions, which must assay over 100,000 SNPs in the initial
stage to be included [49]. Also, only SNPs with P < 10e-
5 are reported in the database. This database was
accessed and available content downloaded on 15
November 2010. All 3407 TASs in the database were
mapped to the nearest BRS and ordered according to
distance of the TAS to the center of t he peak summit.
Figure 7 shows examination of the TAS together with
the SNP(s) under the peak that leads to changes in the
in vitro binding affinity in the EMSA-seq data. Genoty-
pic information was obtained for these TASs for all
eight individuals in the study using the hapmap database
[50]; this contains all eight individuals in their geno-
typed cohorts.
Additional material
Additional file 1: Supplementary figures, tables (with legends) and
documentation.
Additional file 2: Dataset for nine NF-B dimers (protein-binding
microarrays).
Additional file 3: Information for canonical sequences of NF-B.
Additional file 4: Information from GWASs used in our analyses.
Additional file 5: Sequences of primers and oligonucleotides used
in this study.
Additional file 6: Complete probe-specifications for protein-binding
microarrays in this study.
Additional file 7: MATCH scores for all 11-mer sequences derived
using both reference and alternative binding models.
Abbreviations
bp: base pair; BR: binding region; BRS: binding region summit; ChIP-Seq:
chromatin immunoprecipitation-sequencing; EMSA-Seq: electrophoretic
mobility shirt assay-sequencing; GEO: Gene Expression Omnibus; GWAS:
genome-wide association study; NF: nuclear fact or; PCR: polymerase chain
reaction; PWM: position weight matrix; SELEX: systematic evolution of
ligands by exponential enrichment; SNP: single nucleotide polymorphism;
TAS: trait/disease-associated SNP; TF: transcription factor; TFBS: transcription
factor binding site.
Acknowledgements
The research leading to these results has received funding from the
European Community’s Seventh Framework Programme FP7/2007-2013:
Model-In (222008) awarded to JR, IAU, DA and SD, the FP7 ITN Network
INTEGER (214902) awarded to JR. In addition, the MRC project grant
G0700818 awarded to IAU and JR. JR was also supported by the Wellcome
Trust through grant 075491/Z/04. We would like to thank Ross Richardson
for his invaluable contribution to our earlier efforts towards data analyses,
and also Ray Owens and Rene Assenberg from the Oxford Protein
Production facility (OPPF) for their expertise and generous support.
Author details
1
Wellcome Trust Centre for Human Genetics, University of Oxford, Roosevelt
Drive, Oxford OX3 7BN, UK.
2
Université de Lyon, Laboratoire de Biologie
Moléculaire de la Cellule, CNRS-UMR 5239/INRA 1237/IFR128 Biosciences,
Ecole Normale Supérieure de Lyon, 46 Allée d’Italie, 69007 Lyon, France.
3
Kennedy Institute of Rheumatology, Imperial College, 65 Aspenlea Road,
London W6 8LH, UK.
4
Division of Genetics, Brigham and Women’s Hospital
and Harvard Medical School, 45 Francis Street, Boston, MA 02115, USA.
5
Harvard-MIT Division of Health Sciences and Technology (HST), Harvard
Medical School, Boston, MA 02115, USA.
6
Department of Pathology, Brigham
and Women’s Hospital and Harvard Medical School, 75 Francis Street,
Boston, MA 02115, USA.
7
Université Joseph Fourier - Grenoble 1; INSERM
Institut Albert Bonniot, U823, Site Santé-BP 170, 38042 Grenoble Cedex 9,
France.
Authors’ contributions
DW and AT did experimental design, performed experiments, analyzed data
and wrote the manuscript. SO performed data analysis. PH did statistical
analysis. INL, DA and SD did auxiliary experimental work and interpretation
of data. DS supplied material. MLB and TS supplied auxiliary data and
contributed to discussions. IAU conceived the study, supplied material and
contributed to the writing of the manuscript. JR conceived and coordinated
the study, and contributed to the writing of the manuscript. All authors
have read and approved the final manuscript.
Competing interests
The authors declare that they have no competing interests.
Received: 2 February 2011 Revised: 11 July 2011
Accepted: 29 July 2011 Published: 29 July 2011
References
1. Ge B, Pokholok DK, Kwan T, Grundberg E, Morcos L, Verlaan DJ, Le J,
Koka V, Lam KC, Gagne V, Dias J, Hoberman R, Montpetit A, Joly MM,
Wong et al. Genome Biology 2011, 12:R70
/>Page 16 of 18
Harvey EJ, Sinnett D, Beaulieu P, Hamon R, Graziani A, Dewar K, Harmsen E,
Majewski J, Goring HH, Naumova AK, Blanchette M, Gunderson KL,
Pastinen T: Global patterns of cis variation in human cells revealed by
high-density allelic expression analysis. Nat Genet 2009, 41:1216-1222.
2. Pastinen T: Genome-wide allele-specific analysis: insights into regulatory
variation. Nat Rev Genet 2010, 11:533-538.
3. Farnham PJ: Insights from genomic profiling of transcription factors. Nat
Rev Genet 2009, 10:605-616.
4. Zheng W, Zhao H, Mancera E, Steinmetz LM, Snyder M: Genetic analysis of
variation in transcription factor binding in yeast. Nature 2010,
464:1187-1191.
5. McDaniell R, Lee BK, Song L, Liu Z, Boyle AP, Erdos MR, Scott LJ,
Morken MA, Kucera KS, Battenhouse A, Keefe D, Collins FS, Willard HF,
Lieb JD, Furey TS, Crawford GE, Iyer VR, Birney E: Heritable individual-
specific and allele-specific chromatin signatures in humans. Science 2010,
328:235-239.
6. Kasowski M, Grubert F, Heffelfinger C, Hariharan M, Asabere A, Waszak SM,
Habegger L, Rozowsky J, Shi M, Urban AE, Hong MY, Karczewski KJ,
Huber W, Weissman SM, Gerstein MB, Korbel JO, Snyder M: Variation in
transcription factor binding among humans. Science 2010, 328:232-235.
7. Gordan R, Hartemink AJ, Bulyk ML: Distinguishing direct versus indirect
transcription factor-DNA interactions. Genome Res 2009, 19:2090-2100.
8. Jolma A, Kivioja T, Toivonen J, Cheng L, Wei G, Enge M, Taipale M,
Vaquerizas JM, Yan J, Sillanpaa MJ, Bonke M, Palin K, Talukder S, Hughes TR,
Luscombe NM, Ukkonen E, Taipale J: Multiplexed massively parallel SELEX
for characterization of human transcription factor binding specificities.
Genome Res 2010, 20:861-873.
9. Robertson AG, Bilenky M, Tam A, Zhao Y, Zeng T, Thiessen N, Cezard T,
Fejes AP, Wederell ED, Cullum R, Euskirchen G, Krzywinski M, Birol I,
Snyder M, Hoodless PA, Hirst M, Marra MA, Jones SJ: Genome-wide
relationship between histone H3 lysine 4 mono- and tri-methylation and
transcription factor binding. Genome Res 2008, 18:1906-1917.
10. Badis G, Chan ET, van Bakel H, Pena-Castillo L, Tillo D, Tsui K, Carlson CD,
Gossett AJ, Hasinoff MJ, Warren CL, Gebbia M, Talukder S, Yang A,
Mnaimneh S, Terterov D, Coburn D, Li Yeo A, Yeo ZX, Clarke ND, Lieb JD,
Ansari AZ, Nislow C, Hughes TR: A library of yeast transcription factor
motifs reveals a widespread function for Rsc3 in targeting nucleosome
exclusion at promoters. Mol Cell 2008, 32:878-887.
11. Bulyk ML, Gentalen E, Lockhart DJ, Church GM: Quantifying DNA-protein
interactions by double-stranded DNA arrays. Nat Biotechnol 1999,
17:573-577.
12. Ge H: UPA, a universal protein array system for quantitative detection of
protein-protein, protein-DNA, protein-RNA and protein-ligand
interactions. Nucleic Acids Res 2000, 28:e3.
13. Linnell J, Mott R, Field S, Kwiatkowski DP, Ragoussis J, Udalova IA:
Quantitative high-throughput analysis of transcription factor binding
specificities. Nucleic Acids Res 2004, 32:e44.
14. Zykovich A, Korf I, Segal DJ:
Bind-n-Seq: high-throughput analysis of in
vitro
protein-DNA interactions using massively parallel sequencing.
Nucleic Acids Res 2009, 37:e151.
15. Stormo GD, Zhao Y: Determining the specificity of protein-DNA
interactions. Nat Rev Genet 2010, 11:751-760.
16. Beinke S, Ley SC: Functions of NF-kappaB1 and NF-kappaB2 in immune
cell biology. Biochem J 2004, 382:393-409.
17. Dutta J, Fan Y, Gupta N, Fan G, Gelinas C: Current insights into the
regulation of programmed cell death by NF-kappaB. Oncogene 2006,
25:6800-6816.
18. Gilmore TD: Introduction to NF-kappaB: players, pathways, perspectives.
Oncogene 2006, 25:6680-6684.
19. Hayden MS, West AP, Ghosh S: NF-kappaB and the immune response.
Oncogene 2006, 25:6758-6780.
20. Li Q, Verma IM: NF-kappaB regulation in the immune system. Nat Rev
Immunol 2002, 2:725-734.
21. Udalova IA, Mott R, Field D, Kwiatkowski D: Quantitative prediction of NF-
kappa B DNA-protein interactions. Proc Natl Acad Sci USA 2002,
99:8167-8172.
22. Chen FE, Kempiak S, Huang DB, Phelps C, Ghosh G: Construction,
expression, purification and functional analysis of recombinant
NFkappaB p50/p65 heterodimer. Protein Eng 1999, 12:423-428.
23. Chen FE, Huang DB, Chen YQ, Ghosh G: Crystal structure of p50/p65
heterodimer of transcription factor NF-kappaB bound to DNA. Nature
1998, 391:410-413.
24. Badis G, Berger MF, Philippakis AA, Talukder S, Gehrke AR, Jaeger SA,
Chan ET, Metzler G, Vedenko A, Chen X, Kuznetsov H, Wang CF, Coburn D,
Newburger DE, Morris Q, Hughes TR, Bulyk ML: Diversity and complexity in
DNA recognition by transcription factors. Science 2009, 324:1720-1723.
25. Gene Expression Omnibus [ />26. Roulet E, Busso S, Camargo AA, Simpson AJ, Mermod N, Bucher P: High-
throughput SELEX SAGE method for quantitative modeling of
transcription-factor binding sites. Nat Biotechnol 2002, 20:831-835.
27. Hindorff LA, Sethupathy P, Junkins HA, Ramos EM, Mehta JP, Collins FS,
Manolio TA: Potential etiologic and functional implications of genome-
wide association loci for human diseases and traits. Proc Natl Acad Sci
USA 2009, 106:9362-9367.
28. Udalova IA, Richardson A, Denys A, Smith C, Ackerman H, Foxwell B,
Kwiatkowski D: Functional consequences of a polymorphism affecting
NF-kappaB p50-p50 binding to the TNF promoter region. Mol Cell Biol
2000, 20
:9113-9119.
29.
Knight JC, Udalova I, Hill AV, Greenwood BM, Peshu N, Marsh K,
Kwiatkowski D: A polymorphism that affects OCT-1 binding to the TNF
promoter region is associated with severe malaria. Nat Genet 1999,
22:145-150.
30. Chen YQ, Ghosh S, Ghosh G: A novel DNA recognition mode by the NF-
kappa B p65 homodimer. Nat Struct Biol 1998, 5:67-73.
31. Chen YQ, Sengchanthalangsy LL, Hackett A, Ghosh G: NF-kappaB p65
(RelA) homodimer uses distinct mechanisms to recognize DNA targets.
Structure 2000, 8:419-428.
32. Britanova LV, Makeev VJ, Kuprash DV: In vitro selection of optimal RelB/
p52 DNA-binding motifs. Biochem Biophys Res Commun 2008, 365:583-588.
33. Bonizzi G, Bebien M, Otero DC, Johnson-Vroom KE, Cao Y, Vu D, Jegga AG,
Aronow BJ, Ghosh G, Rickert RC, Karin M: Activation of IKKalpha target
genes depends on recognition of specific kappaB binding sites by RelB:
p52 dimers. EMBO J 2004, 23:4202-4210.
34. Taylor IA, McIntosh PB, Pala P, Treiber MK, Howell S, Lane AN, Smerdon SJ:
Characterization of the DNA-binding domains from the yeast cell-cycle
transcription factors Mbp1 and Swi4. Biochemistry 2000, 39:3943-3954.
35. Chou S, Lane S, Liu H: Regulation of mating and filamentation genes by
two distinct Ste12 complexes in Saccharomyces cerevisiae. Mol Cell Biol
2006, 26:4794-4805.
36. Bianchi ML: Inflammatory bowel diseases, celiac disease, and bone. Arch
Biochem Biophys 2010, 503:54-65.
37. Ronnblom L, Elkon KB: Cytokines as therapeutic targets in SLE. Nat Rev
Rheumatol 2010, 6:339-347.
38. Harada K, Nakanuma Y: Biliary innate immunity in the pathogenesis of
biliary diseases. Inflamm Allergy Drug Targets 2010, 9:83-90.
39. Scott DL, Wolfe F, Huizinga TW: Rheumatoid arthritis. Lancet 2010,
376:1094-1108.
40. Amor S, Puentes F, Baker D, van der Valk P: Inflammation in
neurodegenerative diseases. Immunology 2010, 129:154-169.
41. Castigli E, Geha RS: Molecular basis of common variable
immunodeficiency. J Allergy Clin Immunol 2006, 117:740-746; quiz 747.
42. Field S, Udalova I, Ragoussis J: Accuracy and reproducibility of protein-
DNA microarray technology. Adv Biochem Eng Biotechnol 2007, 104:87-110.
43. Agilent Technologies eArray [ />44. Berger MF, Bulyk ML: Universal
protein-binding microarrays for the
comprehensive characterization of the DNA-binding specificities of
transcription factors. Nat Protoc 2009, 4:393-411.
45. Beinoraviciute-Kellner R, Lipps G, Krauss G: In vitro selection of DNA
binding sites for ABF1 protein from Saccharomyces cerevisiae. FEBS Lett
2005, 579:4535-4540.
46. Angelov D, Lenouvel F, Hans F, Muller CW, Bouvet P, Bednar J,
Moudrianakis EN, Cadet J, Dimitrov S: The histone octamer is invisible
when NF-kappaB binds to the nucleosome. J Biol Chem 2004,
279:42374-42382.
47. Kel AE, Gossling E, Reuter I, Cheremushkin E, Kel-Margoulis OV,
Wingender E: MATCH: A tool for searching transcription factor binding
sites in DNA sequences. Nucleic Acids Res 2003, 31:3576-3579.
48. 1000 Genomes Project [ />Wong et al. Genome Biology 2011, 12:R70
/>Page 17 of 18
49. Hindorff LA, Junkins HA, Hall PN, Mehta JP, Manolio TA: A Catalog of
Published Genome-Wide Association Studies.[ />gwastudies].
50. International HapMap Project [ />51. Narlikar L, Hartemink AJ: Sequence features of DNA binding sites reveal
structural class of associated transcription factor. Bioinformatics 2006,
22:157-163.
52. Workman CT, Yin Y, Corcoran DL, Ideker T, Stormo GD, Benos PV:
enoLOGOS: a versatile web tool for energy normalized sequence logos.
Nucleic Acids Res 2005, 33:W389-392.
doi:10.1186/gb-2011-12-7-r70
Cite this article as: Wong et al.: Extensive characterization of NF-B
binding uncovers non-canonical motifs and advances the interpretation
of genetic functional traits. Genome Biology 2011 12:R70.
Submit your next manuscript to BioMed Central
and take full advantage of:
• Convenient online submission
• Thorough peer review
• No space constraints or color figure charges
• Immediate publication on acceptance
• Inclusion in PubMed, CAS, Scopus and Google Scholar
• Research which is freely available for redistribution
Submit your manuscript at
www.biomedcentral.com/submit
Wong et al. Genome Biology 2011, 12:R70
/>Page 18 of 18