Báo cáo y học: " The contrasting roles of PPARδ and PPARg in regulating the metabolic switch between oxidation and storage of fats in white adipose tissue" ppt
Bạn đang xem bản rút gọn của tài liệu. Xem và tải ngay bản đầy đủ của tài liệu tại đây (680.27 KB, 19 trang )
RESEARCH Open Access
The contrasting roles of PPARδ and PPARg in
regulating the metabolic switch between
oxidation and storage of fats in white adipose
tissue
Lee D Roberts
1,2
, Andrew J Murray
3
, David Menassa
3
, Tom Ashmore
1
, Andrew W Nicholls
4
and
Julian L Griffin
1,2,5,6*
Abstract
Background: The nuclear receptors peroxisome proliferator-activated receptor g (PPARg) and peroxisome
proliferator-activated receptor δ (PPARδ) play central roles in regulating metabolism in adipose tissue, as well as
being targets for the treatment of insulin resistance. While the role of PPARg in regulating insulin sensitivity has
been well defined, research into PPARδ has been limited until recently due to a scarcity of selective PPARδ
agonists.
Results: The metabolic effects of PPARg and PPARδ activation have been examined in vivo in white adipose tissue
from ob/ob mice and in vitro in cultured 3T3-L1 adipocytes using
1
H nuclear magnetic resonance spectroscopy and
mass spectrometry metabolomics to understand the receptors’ contrasting roles. These steady state measurements
were supplemented with
13
C-stable isotope substrate labeling to assess fluxes, in addition to respirometry and
transcriptomic microarray analysis. The metabolic effects of the receptors were readily distinguished, with PPARg
activation characterized by increased fat storage, synthesis and elongation, while PPARδ activation caused increased
fatty acid b-oxidation, tricarboxylic acid cycle rate and oxidation of extracellular branch chain amino acids.
Stimulated glycolysis and increased fatty acid desaturation were common pathways for the agonists.
Conclusions: PPARg and PPARδ restore insulin sensitivity through varying mechanisms. PPAR δ activation increases
total oxidative metabolism in white adipose tissue, a tissue not traditionally thought of as oxidative. However, the
increased metabolism of branch chain amino acids may provide a mechanism for muscle atrophy, which has been
linked to activation of this nuclear receptor. PPARδ has a role as an anti-obesity target and as an anti-diabetic, and
hence may target both the cause and consequences of dyslipidemia.
Background
The World Health Organization estimates over 180 mil-
lion people worldwide suffer from type 2 diabetes melli-
tus (T2DM). The incidence of obesity, a major risk
factor for the development of T2DM, is also increasing
globally. While a number of anti-diabetic treatments
have been produced, they rarely address the related
obese state and consequently fail to confront this under-
lying risk factor. Therefore, it becomes imperative that
new treatment approaches with both anti-diabetic and
anti-obesity properties are found.
The peroxisome proliferator-activated receptors
(PPARs) are ligand activatedtranscriptionfactors,
belonging to the nuclear receptor superfamily, that con-
trol the expression of genes involved in organogenesis,
inflammation, cell differentiation, proliferation, and lipid
and carbohydrate metabolism [1]. Activation of the
PPARs by their selective ligands results in heterodimeri-
zation of the receptor with the 9-cis-retinoic acid recep-
tor. The PPARs can then bind to specific sequences in
their target genes known as peroxisome proliferator
response elements [2].
* Correspondence:
1
Department of Biochemistry University of Cambridge, Tennis Court Road,
Cambridge CB2 1QW, UK
Full list of author information is available at the end of the article
Roberts et al. Genome Biology 2011, 12:R75
/>© 2011 Roberts et al.; licensee BioMed Central L td. This is an open access article distributed under the terms of the Creative Commons
Attribution License (http://creativecom mons.org/licenses/by/2.0), which permits unrestricted use, distribu tion, and reproduction in
any medium, provided the original work is properly cited.
There are three distinct PPAR subtypes, PPARa,
PPARg and PPA Rδ, with eac h demonstrating a particu-
lar tissue d istribution and ligand specificity [3]. PPARa
is primarily expressed in heart, liver, macrophages and
intestines, and is activated by polyunsaturated fatty acids
and leukotriene B4 [4]. PPAR g is principally expressed
in adipocytes but is also found in a range of tissues,
including the placenta. The receptor has a key role in
adipocyte differentiation and li pid storage; it is activated
by po lyunsaturated fatty acids and 15d-prostaglandin J2
[5]. PPARδ is expressed almost ubiquitously, though
some tissues express higher concentrations of the
mRNA, including the brain, skin, liver, skeletal muscle
and adipose tissue [6,7]. In recent studies, the vitamin A
metabolite retinoic acid has been identified as a physio-
logical ligand for the PPARδ nuclear receptor, acting to
control cell survival [8].
The P PARs have already yielded viable targets for the
treatment of T2DM and dyslipidemia; thiazolidine-
diones, PPARg agonists, are currently used in the clinic
for the treatment of T2DM; and fibrates, PPARa ago-
nists, are routinely used to treat dyslipidemia. Treatment
with thiazolodinediones results in the recruitment of
new metabolically active adipocytes, causing an increase
in lipid storage capacity and normalization of adipocyto-
kine levels [9].
A pharmacological agonist for PPARδ is yet to make it
into the clinic and the receptor remains to be fully func-
tionally defined. However, the development of a number
of high affinity synthetic ligands for PPARδ has shown
the receptor holds considerable promise for the treat-
ment of T2DM, the metabolic syndrome, dyslipidemia
and obesity. Insulin-resistant obese rhesus monkeys
treated with the selective PPARδ agonist GW5 01516
demonstrated sign ificant increases in high-density lipo-
protein cholesterol with concomitant decreases in tria-
cylglycerols (TAGs) and low-density lipoprotein
cholesterol [10]. PPARδ activation has also shown effi-
cacy in reducing adiposity by decreasing intracellular tri-
glyceride accumulation in mouse brown adipose tissue
and liver [11].
Investigation into the function of PPARδ in white adi-
pose tissue has demonstrated that the receptor has an
important role in the regulation of met abolis m. Tissue-
specific over-expression of PPARδ in the white adipose
tissue of transgenic mice resulted in a decrease in body
weight, adipocyte triglyceride accumulation, circulating
free fatty acids and circulating triglyceride [11]. The
same transgenic mice were also protected against weight
gain, adipocyte hypertrophy, hypertriglyceridemia, and
steatosis. PPARδ activation also leads to elevated expres-
sion of uncoupling protein-1 in white adipose tissue [11].
In order to contrast the roles of PPARg and PPARδ in
regulating metabolism in white ad ipose tissue, we have
performed a metabolomics study using both in vivo ana-
lysis in the ob/ob mouse and in vitro analysis using the
murine 3T3-L1 adipocyte cell line. The ob/ob mouse
was used to investigate the influence of PPAR activation
on adipose tissue metabolism in a model of insulin
resistance and obesity. The ob/ob mouse model is
robust, well characterized and used extensively to study
T2DM and its therapies; however, it is worthy of note
that it is a monogenic paradigm of leptin deletion,
whereas T2DM is a polygenic disorder.
A synthetic, high affinity pharmacological agonist,
GW610742, was used to activate PPARδ in both the
mice and the adipocyte cell line (GW610742 EC50 for
murine PPARδ
is 28 nM compared to 8,900 nM for
PPARa and
> 10,000 nM f or PPARg)[12]andcon-
trasted with a well defined PPARg agonist (GW347845).
Steady state concentrations were assessed in vivo and in
vitro using a combination of mass spectrometry (MS)
and
1
H nuclear magnetic resonance (
1
H NMR) spectro -
scopy in conjunction with multivariate statistics to
probe the metabolic phenotypes resulting from activa-
tion of the two nuclear receptors. To unambiguously
define the mechanisms by which PPARδ and PPARg
alter the metabolism of adipose tissue, this was further
characterized by
13
C-stable isotope substrate labeling
studies using 1-
13
C glucose and U-
13
C palmitate,
respirometric analysis using a Clark-type oxygen elec-
trode and transcriptomic microarray analysis.
It was found that PPARδ activation was characterized
not only by increased fatty acid oxidative metabolism as
previously observed but also by i ncreased glucose and
amino acid oxidation. In c ontrast, activation of PPARg
was associated with fatty acid synthesis and sequestra-
tion of fats. This implicates PPARδ as a control for glo-
bal oxidative energy metabolism and suggests a
mechanism by which activation of the nuclear receptor,
in part, brings about its anti-diabetic and anti-obesity
properties by simultaneously reducing the quantity of
triglycerides and glucose in white adipose tissue and sys-
temic metabolism as a whole. However, this metabolic
systems biology approach also suggests that increased
demand for branched chain amino acids (BCAAs) in
adipose tissue may explain why the wider metabolic
effects of PPARδ activation may cause muscle atrophy.
Results
Metabolomic analysis of adipose tissue from ob/ob mice
treated with the PPAR agonists
A combination of ga s chromatography (G C)-MS and
direct infusion (DI)-MS combined with multivariate pat-
tern recognition was used to profile metabolism within
the white adipose tissue of ob/ob mice treated with
either GW610742 (a selective PPARδ agonist),
GW347845 (a selective PPARg agonist) or a vehicle
Roberts et al. Genome Biology 2011, 12:R75
/>Page 2 of 19
control. These analytical approaches provided coverage
of total fatty acids and intact lipids and free fatty acids,
respectively. The various spectra and chromatograms
were interrogated using multivariate statistics comparing
the dosed groups with the vehicle control.
Both PP ARδ and PPARg agonists induced large
changes in the total fatty acid profile of white adipose
tissue as measured by GC-MS of the fatty acid methyl
esters and subsequent multivariate analysis (Figure 1a-
c). Treatment with the PPARδ agonist induced decreases
in the medium-chain fatty acids, while the concentration
of the shorter chain fatty acids increased (Figure 1d).
This was contrasted by the effect of PPARg where the
most profound change was an increase in activity of Δ-9
desaturase , increasing the concentrations of desaturated
fat ty acids, as well as an increase in the long chain fatty
acid arachidate C20:0.
Analysis of the DI-MS negative mode ionization data
of the organic phase was used to analyze changes in free
fat ty acids and a number of classes of intact lipids, with
this approach distinguishing both adipose tissue from
ob/ob mice treated with either of the agonists (Figure
-7
0
7
-9
-12
12
-12
6 8 10 12 14 16 18 20 22
0
50
100
Relative Abundance
Palmitate
Palmitoleate
11-hexadecenoic
Tetradecanoic
Linoleic
Oleic
Stearic
Linolenic
Eicosenoic
Arachidonic
(a)
(c)
(
b)
Control PPAR-delta PPAR-gamma
7
8
9
10
11
12
13
x 10
-4
C8:0/C16:0
Control PPAR-delta PPAR-gamma
4
5
6
7
8
9
10
x 10
-3
C10:0/C16:0
Control PPAR-delta PPAR-gamma
0.04
0.06
0.08
0.1
C12:0/C16:0
Control PPAR-delta PPAR-
g
amma
0.13
0.14
0.15
0.16
0.17
0.18
C16:1/C16:0
Ratio C12:0/C16:0
Ratio C8:0/C16:0
Ratio C16:1/C16:0Ratio C10:0/C16:0
(d)
Time (min)
Lauric
9
0
12
0
0
***
*
*
**
-0.4
0.0
0.4
-0.5
PLS-DA Component 2
PLS-DA Component 1
(e)
-0.4
0.4
-1.2
0.0
1.
2
PLS-DA Component 1
(f)
PLS-DA Component 2
PC (36:3)
TAG (18:1/18:1/18:1)TAG (16:1/16:0/18:1)
TAG (18:1/18:1/16:0)
TAG (18:1/18:2/16:0)
TAG (16:1/18:1/18:1)
TAG (16:1/18:1/18:2)
PC (40:6)PC (22:6/18:0)
PC (36:2)PC (18:1/0:0)
PC (34:1)PC (16:0/0:0)
PC (18:0/0:0)PC (16:0/18:1)
Metabolites increased in
PPARG agonist treated mice
serum relative to control
(g)
0.0
0.5
Metabolites increased in
PPARJ agonist treated mice
serum relative to control
TAG (18:1/18:1/16:0)
TAG (18:1/18:2/16:0)
TAG (16:1/18:1/18:1)
TAG (16:1/18:1/18:2)
= Control
= PPAR G
= Control
= PPAR
J
= Control
= PPARG
= Control
= PPARJ
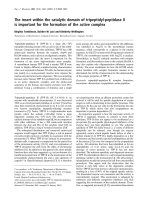
Figure 1 Metabolomic investigation of PPARδ and PPARg activation in white adipose tissue from ob/ob mice. (a) Chromatogram of GC-
MS analysis of the total fatty acid content of white adipose tissue from an ob/ob mouse treated with the PPARδ agonist. Key metabolites are
labeled. (b) Partial least squares-discriminant analysis (PLS-DA) of the GC-MS chromatograms from white adipose tissue from control animals
(filled squares; n = 8) or those treated with a PPARδ (filled circles; n =8)(R
2
(X) = 32%, Q
2
= 69%). (c) PLS-DA of the GC-MS chromatograms from
white adipose tissue from control animals (filled squares; n = 8) or those treated with the PPARg agonist (diamonds; n =8)(R
2
(X) = 32%, Q
2
=
74%). (d) Box whisker plots of key metabolic changes in total fatty acids in white adipose tissue following treatment with either the PPARδ
agonist (n = 8) or PPARg agonist (n = 8). Significant differences were measured by ANOVA followed by a Tukey post-hoc test. *P < 0.05; **P <
0.01; ***P < 0.005. (e) Plot of PLS-DA scores showing the clustering of DI-MS negative ionization mode mass spectra run in triplicate from the
organic phase of white adipose extracts from ob/ob mice treated with a PPARδ agonist compared with control animals: PPARδ agonist-treated
(filled circles; n = 8), control (filled squares; n =8)(R
2
(X) = 72%, Q
2
= 58%). (f) Plot of PLS-DA scores showing the clustering of DI-MS positive
ionization mode mass spectra run in triplicate from the organic phase of white adipose extracts from ob/ob mice treated with a PPARg agonist
compared with control animals: PPARg agonist-treated (diamonds; n = 8), control (filled squares; n =8)(R
2
= 89%, Q
2
= 95%). (g) Key metabolic
changes detected by liquid chromatography-MS in blood serum from animals treated with either a PPARδ agonist (n = 8) or PPARg agonist (n =
8) compared with wild-type controls (n = 8). The metabolite changes demonstrate a restructuring of specific lipid species, particularly
phosphatidylcholines (PC) and triacylglycerols (TAG), within the circulating lipid pool of PPARδ and PPARg agonist-treated mice. The TAG species
increased in the PPARδ agonist-treated mice marked in red are decreased in the PPARg agonist-treated mice marked in blue.
Roberts et al. Genome Biology 2011, 12:R75
/>Page 3 of 19
1e, f). Interrogating the loadings plots of the multivariate
models, both agonists stimulated increases in the consti-
tuents of the ω-6 fatty acid pathway, demonstrating that
both agonists stimulate the activity of desatura ses. How-
ever, the most profound difference between the two
agonists was characterized by decreased concentrations
of the long chain saturated fatty acids (C19:0, C20:0,
C21:0 and C22:0) following PPARδ agonist treatment,
while free palmitic acid, stearic acid and its desaturated
forms (C18:1 and C18:2) increased in compensation.
Given the important role adipose tissue plays in mod-
ulating the lipid composition of blood serum, liquid
chromatography (LC)-MS was used to profile intact
lipids in blood serum (Figure 1g). While both agonists
induced changes in p olar lipids, the most dramatic con-
trast was apparent in changes in the TAG content. The
PPARδ agonist induced increases in the concentration
of a number of circulating TAG species containing
C16:0, C18:0 and C18:1 fatty acids in blood serum,
while the same TAG species were decreased following
PPARg ago nist treatment (Figure 1g). Thus, stimulation
of PPARδ increased the mobilization of TAGs, and
PPARg stimulation increased the sequestration of TAGs.
These metabolic changes demonstrate that while both
agonists induced the activity of desaturases, the PPARδ
agonist was characterized by a reduction in fatty acid
chain length consistent with increased b-oxidation.
However, because both agonists influence metabolism in
a range of organs, this st udy was complemented with an
analysis of 3T3-L1 adipocytes to examine adipocyte
metabolism in isolation.
Metabolomic analysis of 3T3-L1 adipocytes treated with
the PPAR agonists
To profile total fatty acid changes, GC-MS of fatty acid
methyl esters was again applied in conjunction with
multivariate statistics (Figure 2a). The loadings plots of
the partial least squares-discriminant analysis (PLS- DA)
models of the data were again used to determine the
key metabolic changes in total fatty acid profiles induced
by the two agonists (Figure 2b, c). Similar to the
changes detected in adipose tissue, both agonists
affected the ω-6 fatty acid pathway, with the PPARδ
agonist increasing the concentrations of a number of
the later pathwa y intermediates, w hile the PPARg ago-
nist decreased g-linolenate, and increased dihomo-g -
linolenate. PPARδ activat ion also stimulated an increase
in the end products of the ω-3 fatty acid pathway
(C20:5, C22:5 and C22:6).
However, the major difference between the two ago-
nists was a general decrease i n the concentration of
fatty acids observed in PPARδ agonist-treated cells)
while PPARg stimulation induced a relative change in
overall chain length characterized by decreases in the
concentrations of the medium chain fatty acids (C13:0,
C14:0, C15:0, C16:1, C17:0, C17:1, C18:1) and a conco-
mitant increase in the steady state concentrations of the
long chain fatty acids (C20:0 and C22:0). These changes
in total fatty acids were also represented in the free fatty
acid profile measured by DI-MS and modeled by multi -
variate analysis (Figure 2d, e).
Changes in the composition of complex lipids was
observed in the PPARδ activated 3T3-L1 adipocytes. An
increase in the concentration of a number of glycero-
phosphocholine and phosphatidylcholine (PCs) species
was ascertained and this was acc ompanied by a decrease
in the concentration of specific TAGs (Table 1). Unlike
the shift from TAGs to p hospholipids induced by
PPARδ, the activation of PPARg produced a more com-
plex remodeling of TAGs with an inc rease in longer
chain and desaturated fatty acids, which dominated the
resultant PLS-DA model (Table 1). In addition, a range
of PCs, glycerophosphocholines, glycerophosphoethano-
lamines and glycerophosphoinsoitols decreased in con-
centration while the concentration of several cholesterol
esters increased (data not shown).
A combination of both NMR spectroscopy and GC-
MS analysis of aqueous metabolites readily distinguished
the action of the two PPAR receptors. PPARδ activatio n
increased the concentration of the peroxisomal oxida-
tion product adip ic acid, while PPARg stimulation
decreased the concentration of carnitine, the main
transporter of fatty acids across the mitochondrion. The
PPARδ agonist also decreased the concentration of glu-
cose and other carbohydrates in adipose cells, as we ll as
increased the concentration of citrate and glutamate
(the latter in fast exchange with 2-oxogluturate). While
PPARg stimulation also decreased the concentration of
glucose, it also decreased the concentrations of the later
tricarboxylic acid (TCA) cycle metabolites. Changes in
the steady state concentrations of specific metabolites
and corresponding metabolic pathways in 3T3-L1 adipo-
cytes treated with either the PPARδ or PPARg agonist
are summarized in Figure 2f, g.
To assess how metabolism in the 3T3-L1 cells influ-
enced their environments, metabolite changes in the
media were investigated using a combination of GC-MS,
probing fatty acid export from the cells, and
1
HNMR
spectroscopy, determining changes in aqueous phase
metabolites. While the PPARδ agonist did not affect
fatty acid export compared with cells treated with the
vehicle control, PPARg reduced the export of fatty acids,
particularly of saturated fatty acids (palmitate, P =0.01,
23% reduction; stearate, P = 0.04, 19% reduction). How-
ever, PPARδ activation markedly reduced the concentra-
tions of amino acids in the PPARδ cell culture media
compared with both the control group and cells treated
with the agon ist, in partic ular the BCAAs leucine (P <
Roberts et al. Genome Biology 2011, 12:R75
/>Page 4 of 19
(a)
4 6 8 10 12 14 18
Retention time (min)
C9:0
C10:0
C8:0
C10:1
C11:0
C11:1
C12:0
C13:0
C14:0
C14:1
C15:0
C15:1
C16:0
C16:1
C17:0
C17:1
C18:0
Elaidate
Oleate
C18:2w6
C18:3w6
C19:1
C20:4
C20:3w9
C20:0
C20:5w3
-40
-20
0
20
-40
PLS-DA component 2
PLS-DA component 1
(d)
-12
0
12
-10
PLS-DA component 2
PLS-DA component 1
(
b)
-6
0
6
-12
PLS-DA component 1
PLS-DA component 2
(c)
-0.4
0
0.4
-0.6
PLS-DA component 1
PLS-DA component 2
(e)
16
10
12
400
0.6
0
(f)
Acetyl-CoA
Pyruvate
Glucose
Alanine
Glutamate
Glutamate
Glutamine
Proline
Methionine
Isoleucine
Valine
Threonine
Aspartate
Fatty Acid
E-Oxidation
C11:0
C13:0
C14:0
C14:1
12-Methyl C14:0
C15:0
C15:1
7-C16:1
14-Methyl C16:0
C16:1
Ethyl-9-C16:1
C17:0
C17:1
C18:1 Elaidate and Oleate
Galactose
Serine
Glycine
Alanine
Fructose
Maltose
Glucitol
Pentose and Glucoronate interconversions
D-Glucoronate-1-P
Glucoronate
Myo-Inositol
Arabitol
Creatine
Creatine-P
Creatinine
Linoleate
-linolenate
Dihomo- -linolenate Arachidonate
4,7,10,13,16,19-Docosahexaenoic Acid
Essential Fatty Acid Patway
Citrate
2-Oxoglutarate
Succinyl Co-A
Succinate
Fumarate
Malate
Ovaloacetate
(g)
Acetyl-CoA
Pyruvate
Glucose
Alanine
Glutamate
Glutamate
Glutamine
Proline
Methionine
Isoleucine
Valine
Thr
eo
nin
e
Aspartate
Fatty Acid
Synthesis
Palmitate
Stearate
C20:0
C22:0
C13:0
C14:0
12-Methyltetradecanoate
C15:0
C15:1
C16:1
C17:0
C17:1
Isostearate
Eleate and Oleate
Carnitine
Galactose
Alanine
Fructose
Maltose
Glucitol
Pentose Phosphate Pathway
Linolenate
-linolenate
Dihomo -linolenate Arachidonate
Essential Fatty Acid Pathway
Lactate
Gluconic Acid
D-Ribose-5-Phosphate
Cholesterol Esters
Phosphate
Urea
Asparagine
Myo-Inositol Phosphate
alpha-glycerophosphoric acid
Citrate
2-Oxoglutarate
Isocitrate
Succinyl Co-A
Succinate
Fumarate
Malate
Oxaloacetate
Isomyristate
Isocitrate
Leucine
Intensity
0.000
0.002
0.004
0.006
0.008
Valine
Intensity
0.00
0.02
0.04
0.06
Isoleucine
Intensity
0.000
0.002
0.004
0.006
0.008
Control
PPARG Agonist
Control
PPARG Agonist
Control
PPARG Agonist
(h)
**
**
****
= Control
= PPARG 100 nM
= PPARG 1 μM
= Control
= PPARG 100 nM
= PPARG 1 μ M
= Control
= PPARJ 10 nM
= PPARJ 100 nM
= Control
= PPARJ 10 nM
= PPARJ 100 nM
Figure 2 Metabolomic investigation of PPARδ and PPARg activation in 3T3-L1 adipocytes. (a) Chromatogram of GC-MS analysis of the
total fatty acid content of 3T3-L1 adipocytes treated with the PPARδ agonist. Key metabolites are labeled. (b) Plot of partial least squares-
discriminant analysis (PLS-DA) scores showing the clustering of GC-MS chromatograms from the lipid fraction of 3T3-L1 adipocytes treated with
100 nM and 1 μM PPARδ agonist GW610742 compared with the control group: 1 μM PPARδ agonist dose (diamonds; n = 6), 100 nM PPARδ
agonist dose (filled circles; n = 6), control (filled squares; n =6)(R
2
(X) = 77%, Q
2
= 75%). (c) Plot of PLS-DA scores showing the clustering of GC-
MS chromatograms from the organic fraction of 3T3-L1 adipocytes treated with 10 nM PPARg agonist GW347845 and 100 nM PPARg agonist
GW347845 compared with the control group: 10 nM PPARg agonist dose (asterisks; n = 6), 100 nM PPARg agonist dose (squares; n = 6), control
(filled squares; n =6)(R
2
(X) = 87%, Q
2
= 90%). (d) Plot of PLS-DA scores showing the clustering of DI-MS negative mode ionization
chromatograms from the organic fraction of 3T3-L1 adipocytes treated with 100 nM and 1 μM PPARδ agonist GW610742 compared with the
control group: 1 μM PPARδ agonist dose (diamonds; n = 6), 100 nM PPARδ agonist dose (filled circles; n = 6), control (filled squares; n =6)(R
2
(X)
= 70%, Q
2
= 85%). (e) Plot of PLS-DA scores showing the clustering of DI-MS negative mode ionization chromatograms from the organic
fraction of 3T3-L1 adipocytes treated with 10 nM PPARg agonist GW347845 and 100 nM PPARg agonist GW347845 compared with the control
group: 10 nM PPARg agonist dose (asterisks; n = 6), 100 nM PPARg agonist dose (squares; n = 6), control (filled squares; n =6)(R
2
(X) = 86%, Q
2
=
88%). (f) Key steady state metabolic changes detected in 3T3-L1 adipocytes following treatment with the PPARδ agonist GW610742 using a
combination of
1
H NMR spectroscopy and GC-MS. Metabolites increased in concentration are labeled in red, and metabolites decreased in
concentration are labeled in blue. (g) Key steady state metabolic changes detected in 3T3-L1 adipocytes following treatment with the PPARg
agonist GW347845 using a combination of
1
H NMR spectroscopy and GC-MS. Metabolites increased in concentration are labeled in red, and
metabolites decreased in concentration are labeled in blue. (h) Changes in BCAAs in the culture media of PPARδ agonist-treated 3T3-L1 cells **P
< 0.005, ****P < 0.0001. Error bars represent standard errors of the mean.
Roberts et al. Genome Biology 2011, 12:R75
/>Page 5 of 19
0.0001), isoleucine (P = 0.002) and valine (P = 0.005)
(Figure 2h). Concomitantly, the steady state intracellular
concentration of valine was increased in PPARδ agonist-
treated cells (P < 0.05)
13
C-labelled substrate studies
In order to identify the metabolic mechanisms asso-
ciated with PPARδ and PPARg activation in white adi-
pose tissue and 3T3-L1 adipocytes, the
13
C-labeled
substrates 1-
13
Cglucose and U-
13
C-palmitate were used
to monitor flux through glycolytic and fatty acid oxida-
tive pathways.
The use of 1-
13
C glucose and GC-MS readily distin-
guished the two agonists. Examination of the aqueous
phase by GC-MS revealed that lactate, glutamate (read-
ily labeled from the TCA cycle from labeled 2-oxogluta-
rate)andsuccinatefromPPARδ agonist-treated cells
were enriched with
13
C when compared to control (Fig-
ure 3a). In contrast, the PPARg agonist caused a reduc-
tion in labeling of lactate, succinate and glutamate
compared to the vehicle-treated cells (Additional file 1).
The PPARδ agonist also decreased labeli ng of the med-
ium chain fatty acid palmitate from 1-
13
C glucose, while
Table 1 Lipid species altered in concentration in 3T3-L1
adipocytes treated with either the PPARδ agonist
GW610742 or the PPAR g agonist GW347845
PPARδ PPARg
Increased Decreased Increased Decreased
PC 32:0 (16:0/
16:0)
TAG 52:1 TAG 48:0 TAG 44:2
PC 34:0 TAG 52:5 TAG 50:1 TAG 44:1 (15:0/15:0/
14:1)
PC 34:1 TAG 52:6 TAG 52:4 TAG 44:1 (15:1/14:0/
15:0)
PC 35:5 TAG 53:2 TAG 54:6 TAG 45:2
PC 36:1 TAG (18:3/17:0/
19:0)
TAG 54:5 TAG 46:2
PC 36:2 TAG (18:1/17:1/
19:1)
TAG 54:4 TAG 47:2
PC 36:3 TAG (20:1/17:1/
17:1)
TAG 47:3
TAG (20:1/15:0/
19:2)
TAG 48:3
TAG (20:1/15:1/
19:1)
TAG 48:2
TAG 49:3
TAG 50:3
Species were detected using LC-MS. Lipids identified in the VIP/coefficient
plots as significantly contributing to separation in the principal components
analysis (PCA) and PLS-DA models built for the LC-MS analysis of the organic
metabolite fraction (P < 0.05 for significant contribution to the first
component of the PLS-DA plot). The control group (n = 6) was compared with
the PPARδ agonist-treated group (n = 6) or PPARg agonist-treated group (n =
6). All triacylglycerols (TAGs) were observed as ammonium adducts. Where
stated, exact composition was confirmed by tandem mass spectrometry (MS/
MS) and phosphocholines (PCs) were identified by monitoring for the loss of
the choline head group during MS/MS.
Lactate M+1/M
Control
PPAR agonist
0.00
0.02
0.04
0.06
0.08
0.10
0.12
0.14
*
Succinate M+1/M
Control PPARG agonist
0.00
0.05
0.10
0.15
0.20
0.25
**
G
lutamate M+1
/
M
Control PPAR
agonist
0.00
0.1
0.2
0.3
0.4
0.5
0.6
**
(a)
Palmitic acid M+1/M
Control PPARG agonist
0.00
0.05
0.10
0.15
0.20
0.25
*
Citrate
2-Oxoglutarate
Isocitrate
Succinyl-CoA
Succinate
Fumarate
Malate
Oxaloacetate
Acetyl-CoA
Pyruvate
13C-Glucose
Lactate
Glutamate
Glucose-6P
Succinate M+1/M
Control
PPAR G agonist
0.00
0.05
0.10
0.15
0.20
0.25
***
Glutamate M+1/M
Control PPAR
G agonist
0.00
0.1
0.2
0.3
0.4
*
Malate M+1/M
Control
PPARG
agonist
0.05
0.05
0.10
0.15
0.20
0.25
0.30
0.35
*
Fumarate M+1/M
Control
PPAR
G
0.00
0.05
0.10
0.15
0.20
0.25
**
13
C-Palmitate (C16:0)
Stearate (C18:0)
Arachidate (C20:0)
Myristate (C14:0)
Palmitoleate C16:1)
Laurate (C12:0)
Palmitoleic acid (C16:1)
Control PPAR agonist
0
5
10
15
20
25
30
35
40
45
50
M+16/M
**
Myristc acid (C14:0)
Control
PPAR G agonist
0.00
0.05
0.10
0.15
0.20
M+14/M
Stearic acid (C18:0)
Control PPAR G
agonist
0.00
0.01
0.02
0.03
M+16/M
Lauric acid (C12:0)
Control PPAR a
g
onist
0.00
0.05
0.10
0.15
0.20
M+12/M
Arachidic acid (C20:0)
Control PPAR agonist
0.00
0.01
0.02
0.03
0.04
0.05
0.06
0.07
0.08
0.09
0.10
0.11
0.12
M+16/M
*
**
*
*
Citrate
2-Oxoglutarate
Isocitrate
Succinyl CoA
Succinate
Fumarate
Malate
Oxaloacetate
Acetyl-CoA
Pyruvate
Glutamate
(b)
13C-Palmitate
agonist
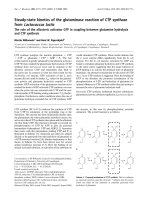
Figure 3 Stable isotope flux analysis of PPA Rδ agonist-treated
3T3-L1 adipocytes. (a) Graphs showing the M+1/M isotope ratio
13
C enrichment of lactate, glutamate and succinate analyzed by GC-
MS of the aqueous fraction and M+1/M isotope ratio
13
C
enrichment of palmitic acid analyzed by GC-MS of the organic
fraction from control (n = 6) and PPARδ agonist-treated (n = 6) 3T3-
L1 cells incubated with 1-
13
C glucose. *P < 0.05, **P < 0.01. The
metabolites have been mapped to the glycolysis and TCA cycle
metabolic pathways. Red indicates a metabolite increased in
13
C
enrichment by PPARδ activation. (b) Graphs showing the M+1/M
isotope ratio
13
C enrichment of malate, glutamate, fumarate and
succinate analyzed by GC-MS of the aqueous fraction and
enrichment of arachidic acid, stearic acid, palmitoleic acid, myristic
acid and lauric acid analyzed by GC-MS of the organic fraction from
Roberts et al. Genome Biology 2011, 12:R75
/>Page 6 of 19
the PPARg agonist increased the labeling of the long
chain fatty acid arachidate. In addition,
13
C NMR spec-
troscopy of the organic fraction of control and PPARδ
agonist-treated adipocytes incubated in media contain-
ing 1-
13
C glucose showed that glycerol and esterified
glycerol from PPARδ agonist-treated cells had reduced
enrichment compared with the control group (Addi-
tional file 2).
Similarly, the labeled substrate U-
13
C palm itate readily
distinguished the two agonists. Assessment of the aqu-
eous phase by GC-MS indicated that several TCA cycle
intermediates from PPARδ agonist-treated adipocytes
were enriched compared to control cells (Figure 3b).
Investigation of the organic phase by GC-MS demon-
strated that the fatty acids downstream of palmitic acid
in the b-o xidation pathway showed g reater
13
Cenrich-
ment in PPARδ agonist-treated cells; as did the Δ-9
desaturation product of palmitic acid. Simultaneously,
the enrichment of fatty acids upstream of palmitic acid
in the fatty acid synthesis pathway was reduced in
PPARδ agonist-treated cells (Figure 3b).
GC-MS analysis o f the aqueous phase of cells incu-
bated in U-
13
C palmitate indicated that the early TCA
cycle intermediates exhibited decreased
13
Cenrichment
in PPARg agonist-treated adipocytes when compared to
control adipoc ytes (Additional file 1). Assessmen t of the
organic phase by GC-MS indicated that the
13
Cenrich-
ment of the long chain fatty acid arachidate was
increased in the PPARg a gonist-trea ted cells when com-
pared to control (Additional file 1). Concurrently, the
13
C enrichment of the shorter chain fatty acid myristate
was decreased.
Respirometric analysis
To further characterize the PPARδ induced upregulation
of oxidative pathways in adipocytes, the oxygen con-
sumption of PPARδ agonist-treated and control 3T3-L1
cells was measured both when using fatty acid as sub-
strate and during isolated electron transport chain com-
plex IV oxidation using in situ st udies in a Clarke type
oxygen electrode. Both complex IV and fatty acid oxida-
tion were significantly increased in the adipocytes
exposed to the PPARδ agonistwhencomparedtocon-
trol adipocytes (Figure 4a, b). This was accompanied by
a profound decrease in TAGs as measured by Oil Red
O staining of neutral lipids (Figure 4c).
Microarray transcriptomic analysis
The combination of steady state metabolomic changes
in adipose tissue and adipocytes and isotope labeling
studies indicated a profound upregulation of glucose
and fatty acid oxidation following PPARδ activation. To
investigate these changes in more detail, we moved
focus to the transcriptome using microarray analysis of
PPARδ activation in adipocytes. Of the 45,281 probes
utilized, 13,718 were expressed above the background
defined by the negative control probe. From these, 2,349
were determine d to be differentially expressed with a
95% confidence level between PPARδ agonist-treated
and control 3T3-L1 adipocytes. In addition to the uni-
variate analysis, multivariate models were also built
using the total normalized data (Figure 5a). The 6% of
transcripts most responsible for separation in the multi-
variate models wer e then examined (3% with the highest
positive contribution to principal component 1 and 3%
with the highest negative contribution to principal com-
ponent 1 in PPARδ agonist-treated cells as identified in
the multivariate models). The multivariate analysis indi-
cated that the mRNA of genes involved in a number of
key metabolic pathways was altered following PPARδ
activation. The Reactome Skypainter tool was then uti-
lized to determine which pathways and reactions were
statistically overrepresented by the 3% most inc reased
and 3% most decreased transcripts in PPARδ agonist-
treat ed cells identified in th e multivariate models (Table
2; Figure 5b) [13].
The expression of genes encoding proteins in volved in
the mitochondrial b-oxidation pathway and the peroxi-
somal fatty acid b-oxidation pathway was increased in
PPARδ agon ist-treated cells. Alongside these changes
were an incr ease in the transc ription of genes invol ved
in both mitochondrial and peroxisomal biogenesis and
maintenance. The transcription of several genes whose
products play a role in the gl ycolytic metabolic pathway
and the TCA cycle was also upregulated in PPARδ ago-
nist-treated cells. In addition, there was a detected
increase in the concentrations of expressed mRNA for
components of the electron transport chain, and genes
involved in fatty acid desaturation (Table 2; Additional
file 3).
The results from the steady state metabolomic experi-
ments in adipose tissue and adipocytes and the isotope
labeling studies suggest PPARg activation has a pro-
nounced effect on glucose utiliza tion and fatty acid
synthes is and m etabolism in adipocytes. Transcriptional
changes were investigated by DNA microarrays to
further define the changes associated with PPARg activa-
tion in adipocytes. Of the 45,281 probes utilized, 13,755
were expressed above the background defined by the
negative control probe. From these, 3,282 were deter-
mined to be differentially expressed with a 95%
control (n = 6) and PPARδ agonist-treated (n = 6) 3T3-L1 cells
incubated with U-
13
C palmitate. *P < 0.05, **P < 0.01,***P < 0.005.
Red indicates a metabolite increased, and blue indicates a
metabolite decreased in
13
C enrichment by PPARδ activation. Parent
ions were used to calculate ion ratio. Error bars represent standard
errors of the mean.
Roberts et al. Genome Biology 2011, 12:R75
/>Page 7 of 19
Fatty acid oxidation
Control
0
1
2
3
4
5
6
7
picomoles oxygen/min/million cells
Electron transport chain
complex IV
Control
0
5
10
15
20
25
picomoles oxygen/min/million cells
*
*
(a)
(b)
PPARG agonist
(c)
0
0.2
0.4
0.6
0.8
1
1.2
1.4
Control
G agonist treatment grouppPPAR
Abs 510 nm
PPARG agonist
100 nM 1 μM
Figure 4 Respirometri c analysis of PPARδ agonist-treated 3T3-L1 adipocytes. (a) Graph showing the respiratory rates of in situ
permeabilized control (n = 3) and PPARδ agonist-treated (n = 3) 3T3-L1 cells performing b-oxidation using palmitoyl-carnitine measured using a
Clark-type oxygen electrode. *P = 0.05. (b) Graph showing the respiratory rates of the electron transport chain complex IV of in situ
permeabilized control (n = 3) and PPARδ agonist-treated (n = 3) 3T3-L1 cells measured using a Clark-type oxygen electrode. *P < 0.05. (c)
Spectrophotometric measurement at 510 nm of Oil Red O eluted from stained 3T3-L1 cells treated with DMSO control (n = 3) or 100 nM (n =3)
or 1 μM(n = 3) of the PPARδ agonist GW610742. Error bars represent standard errors of the mean.
Roberts et al. Genome Biology 2011, 12:R75
/>Page 8 of 19
-80
-40
0
40
80
-100
0
100
PLS-DA component 2
PLS-DA component 1
(a)
-80
-40
0
40
80
-100
0
100
PLS-DA component 2
PLS-DA component 2
(c)
(b)
citrate
2-oxoglutarate
isocitrate
succinyl-CoA
succinate
fumarate
malate
oxaloacetate
glutamate
glucose
glucose-6-phosphate
fructose-6-phosphate
fructose-1,6-bisphosphate
glyceraldehyde 3-phosphate
dihydroxyacetone phosphate
1,3-bisphosphoglycerate
3-phosphoglycerate
2-phosphoglycerate
phosphoenolpyruvate
pyruvate
NADH
NADH
deh
y
dro
g
enase
coenzyme Q
coenzyme Q: cytochrome c
-oxidoreductase
cytochrome c cytochrome c oxidase
acetyl CoA
lactate
very long chain fatty acyl carnitine
long chain fatty acyl-CoA
trans-
2
L-3-hydroxyacyl CoA
3-ketoacyl CoA
succinate dehydrogenase
dihydrolipoamide dehydrogenase
malate dehydrogenase
long-chain 3-keto-acyl-coenzyme A thiolase
long-chain acyl-CoA dehydrogenase
very long-chain acyl-CoA dehydrogenase
aldolase A, fructose-bisphosphate
triose-phosphate isomerase
phosphoglycerate kinase
glucose phosphate isomerase
ATP synthase
long chain fatty acyl carnitine
very long chain fatty acyl-CoA
carnitine palmitoyl transferase II
free fatty acids
desaturated fatty acids
fatty acid desaturase 3stearoyl-CoA desaturase 2
-enoyl CoA
Peroxisomal E -oxidation
D3, D2-enoyl-CoA-isomerase
peroxisomal enoyl-CoA hydratase 1
adipic acid
= Control
= PPARG
=
C
ontrol
= PPARJ
Figure 5 Transcriptomic analysis of PPARδ and PPARg activation in 3T3-L1 adipocytes. (a) Plot of PLS-DA scores showing the clustering of
gene transcription in control and PPARδ agonist-treated 3T3-L1 adipocytes as measured with microarray analysis: PPARδ agonist-treated (filled
circles; n = 6), control (filled squares; n =6)(R
2
(X) = 35%, Q
2
= 90%). (b) Diagram showing the effect of PPARδ activation on the integration of
the energy metabolism pathways of 3T3-L1 adipocytes based on the combination of results from the metabolomic, transcriptomic and stable
isotope labeling studies. Red indicates an increase in concentration or expression in cells treated with the PPARδ selective agonist GW610742.
Blue indicates a decrease in concentration in cells treated with the PPARδ selective agonist GW610742. (c) Plot of PLS-DA scores showing the
clustering of gene transcription in control and PPARg agonist-treated 3T3-L1 adipocytes as measured with microarray analysis: PPARg agonist-
treated (filled circles; n = 6), control (filled squaresl n =6)(R
2
(X) = 42%, Q
2
= 84%).
Roberts et al. Genome Biology 2011, 12:R75
/>Page 9 of 19
confidence limit. Multivariate models were then built
using the total normalized data (Figure 5c). The 6% of
transcripts most responsible for separation in the multi-
variate models (that is, those contributing most to the
total variance of the multivariate model) were then
examined using a combination of multivariate analysis
and the Reactome Skypainter tool as described above
[13]. The pathways and reactions that were statistically
overrepresented by the 3% most increased and 3% most
decreased transcripts in PPARg agonist-treated cells
identified in the multivariate models are shown in Table
3, Figure 5c, and Additional file 4.
The expression of genes encoding proteins in volved in
the glycolytic metabolic pathway were upregulated in
PPARg agonist-treated cells. In a ddition, the expression
ofthegeneencodingtheTCAcycleenzymeisocitrate
dehydrogenase was ide ntified as decrease d, suggesting
that citrate was being channeled to fatty acid synthesis
rather than being metabolized by the TCA cycle. PPARg
activation was also discerned to significan tly affect the
transcription of genes responsible for the remodeling
and metabolism of lipids. Genes for fatty acid desa-
turases (Scd2 and Fads3) were increased in expression
following PPARg activation. The transcripts of a number
of genes that favor conditions of fatty acid synthesis
were also increased in concentration in the adipocytes
following treatment with the PPAR g agonist. Concomi-
tantly, the expression of genes e ncoding enzymes that
catalyze the hydrolysis of medium and long chain acyl-
CoAs to free fatty acids and coenzyme A (CoA) was
upregulated in the treated adipocytes (Acot7 and
Nudt19). In addition, the transcription of an insulin
responsive fatty acid transporter gene (Slc27a1) respon-
sible for the import of long chain fatty acids into adi-
pose tissue undergoing high levels of TAG synthesis was
increased.
Several genes involved in the restructuring and remo-
deling of complex lipids were also affected by PPARg
activation. There was an increase in transcription of
genes encoding enzymes responsible for conversion of
lysophospholipids to phospholipids, favoring polyunsatu-
rated fatty acyl-CoAs as acyl donors (lysophosphatidyl-
choline acyltransferase 3 acyltransferase). In addition,
mRNA transcripts of genes encodi ng products that reg-
ulate lipolysis, alongside other metabolic processes,
including gluconeogenesis, were increased in the PPARg
agonist-treated ce lls (platelet act ivating factor acetylhy-
drolase 2 lipase, angiopoietin-related protein 4 and
nuclear receptor corepressor 1). Additionally, t ranscrip-
tion of the PPAR transcriptional coactivator gene chro-
modomain helicase DNA binding protein 9 was
upregulated in the PPARg agonist-treated adipocytes.
Several transcripts were increased in both PPARδ and
PPARg agonist-treated cells, principally involved with
glycolysis and lipid metabolism. However, PPARδ activa-
tion was unique in its effect on t he citric acid cycle, the
electron transport chain and fatty acid b-oxidation
(Tables 2 and 3).
Discussion
A comprehensive array of analytical techniques was used
in a metabolomic investigation to study the metabolic
Table 2 The pathways statistically significant in the 3% most increased transcripts in PPARδ agonist-treated cells
identified in the multivariate models
P-
value
Pathway Transcripts increased in PPARδ agonist-treated cells mapping to the pathway
6.3e-
08
Glucose regulation of insulin secretion Cycs, Etfa, Mdh2, Aldoa, Dld, Ndufb10, Ndufb9, Atp5a1, Ndufb5, Gpi1, Tpi1, Pgk1, mt-Co2,
Sdhb, Sdhd, mt-Atp6, Cox7b, Ndufb2
1.3e-
06
Integration of energy metabolism Cycs, Etfa, Mdh2, Aldoa, Dld, Ndufb10, Ndufb9, Atp5a1, Cpt2, Ndufb5, Gpi1, Tpi1, Pgk1, mt-Co2,
Sdhb, Sdhd, mt-Atp6, Cox7b, Ndufb2
1.3e-
06
Diabetes pathways Hspa8, Cycs, Wdr89, Etfa, Mdh2, Aldoa, Dld, Ndufb10, Myo5a, Ndufb9, Atp5a1, Rps21, Rps3a,
Sec11c, Ndufb5, Gpi1, Tpi1, Pgk1, Sdhb, mt-Co2, Dnajb9, Sdhd, mt-Atp6, Cox7b, 2900062
L11Rik,
Ndufb2
8.5e-
06
Electron transport chain Cycs, Ndufb5, Etfa, mt-Co2, Ndufb10, Sdhb, Sdhd, Ndufb9, Cox7b, Ndufb2
7.1e-
04
Citric acid cycle (TCA cycle) Dld, Sdhb, Sdhd, Mdh2
1.4e-
03
Mitochondrial fatty acid b-oxidation of saturated
and unsaturated fatty acids
Hadhb, Acadl, Acadvl
1.6e-
03
Glycolysis Aldoa, Tpi1, Pgk1, Gpi1
4.5e-
03
Metabolism of lipids and lipoproteins Agpat3, Hadhb, Ppp1cc, Slc27a1, Lass2, Angptl4, Cpt2, Akr1b3, Abcd3, Acadl, Sgpl1, Acaa2,
Acadvl, Mod1, Hmgcs2, Adfp
7.8e-
03
Formation
of acetoacetic acid in synthesis of
ketone bodies
Hmgcs2, Acaa2
Transcripts in bold were increased in both PPARδ and PPARg agonist-treated cells.
Roberts et al. Genome Biology 2011, 12:R75
/>Page 10 of 19
changes occurring in white adipose tissue from ob/ob
mice and 3T3-L1 adipocytes following either PPARδ or
PPARg activation, to understand the role of these
nuclear hormone receptors in treating T2DM a nd obe-
sity. Our metabolomic analysis demonstrates the large
differences between the action of the two receptors,
with PPARδ asso ciated with a profound increase in oxi-
dation of glucose, fats and a mino acids, and PPARg
associated with the sequestration and restructuring of
lipids w ithin adipose tissue . This was confirmed by not
only observing changes in steady state metabolite con-
centrations but a lso using stable isotope techniques to
probe flux, oxygen consumption measurements and
monitoring transcriptional changes, with agreement
across these different tiers of biological organization.
PPARδ activation is known to increase the oxidation
of fatty acids [11,14] and this was confirmed by both the
relative increase in short chain fatty acids compared
with long chain fat ty acids in both adipose tissue and
3T3-L1 cells as well as respiration rate measurements
and the in creased concentration of adipic ac id, the pri-
mary end product of peroxisomal b-oxidation [15], in
cells. Transcriptomic analysis also indicated an increase
in b-oxidation, with increases in the transcription of a
panel of genes involved in fatty acid mitochondrial and
peroxisomal b-oxidation (Table 2; Cpt2, Acadvl, Acadl,
Hadhb, Acaa2, Abcd3, Ech1, Peci). The oxi dation of fa ts
was directly followed by monitoring the metabolism of
U-
13
C palmitate, with increased labeling of shorter chain
fatty acids following the stimulation of PPARδ. PPARδ
stimulation also increased the TCA cyc le rate, as ind i-
cated by following the labeling patterns induced by 1-
13
C glucose, the increased labeling of TCA cycle inter-
mediates during metabolism of U-
13
C palm itate, and the
increased steady state concentrations of TCA cycle
intermediates in 3T3-L1 cells. Tr anscriptomic analysis
substantiated this finding, with the expression of genes
with roles in glycolysis and the TCA cycle significantly
increased upon PPARδ activation (Table 2; Tpi1, Gpi1,
Aldoa, Pgk1, Mdh2, Sdhb, Sdhd, Dld).
Wang and colleagues [11] discussed the upregulation
of fatty acid oxidati on in brown adipose tissue following
the over expression of PPARδ in terms of the expression
of a range of enzymes involved in uncoupling (uncou-
pling protein 1 and 3), fatty acid oxidation (acyl-CoA
oxidase, muscle carnitine palmitoyltransferase-1, long
Table 3 The pathways statistically significant in the 3% most increased transcripts in PPARg agonist-treated cells
identified in the multivariate models
P-
value
Pathway Transcripts increased in PPARg agonist-treated cells mapping to the
pathway
6.4e-
05
Glycolysis Aldoa, Pgam1, Pfkl, Gapdh, Gpi1
1.1e-
03
Gluconeogenesis Aldoa, Slc25a11, Pgam1, Gapdh, Gpi1
1.2e-
03
Ca
2+
signaling via IP3 binding to the IP3 receptor, opening the
endoplasmic reticulum Ca
2+
channel
Itpr2, Itpr1
1.8e-
03
Phospholipase C-mediated signaling events Prkaca, Itpr2, Itpr1, Adcy6, Pde1b
2.5e-
03
Hormone-sensitive lipase-mediated triacylglycerol hydrolysis Prkaca, Abhd5, Ppp1ca
2.6e-
03
Metabolism of lipids and lipoproteins Prkaca, Abhd5, Abcd3, Ppp1ca, Ncor1, Chd9, Slc27a1, Hsd17b4, Acaa2,
Sin3b, Scd2, Hmgcl, Fads3, Csnk1g2, Angptl4
3.2e-
03
Regulation of insulin secretion Prkaca, Dlst, Ndufb6, Itpr1, Gpi1, Aldoa, Ndufs6, Pgam1, Itpr2, Pfkl, Gapdh
5.8e-
03
Formation of acetoacetic acid in the synthesis of ketone bodies Hmgcl, Acaa2
8.2e-
03
Additional metabolism of carbohydrates Aldoa, Slc25a11, Pgam1, Pfkl, Gapdh, Gpi1, G6pdx
1.1e-
02
Protein
kinase A-mediated events Prkaca, Pde1b
1.1e-
02
Regulation of lipid metabolism by peroxisome proliferator-
activated receptor alpha
Sin3b, Scd2, Fads3, Ncor1, Chd9, Slc27a1, Angptl4
1.7e-
02
Integration of energy metabolism Prkaca, Dlst, Ndufb6, Gpi1, Aldoa, Ndufs6, Pgam1, Pfkl, Adcy6, Gapdh
2.0e-
02
b-Oxidation of very long chain fatty acids Abcd3, Hsd17b4
0.1e-
02
Peroxisomal lipid metabolism Abcd3, Slc27a1, Hsd17b4
Transcripts in bold were increased in both PPARδ and PPARg agonist-treated cells.
Roberts et al. Genome Biology 2011, 12:R75
/>Page 11 of 19
chain acyl dehydrogenase, very long chain acyl dehydro-
genase) as well as morphological changes within the tis-
sue. However, at the transc riptional level there was only
an increase in hormone-sensitive lipase in white adipose
tissue, despite there being reductions in adipose mass
and increased oxygen consumption in the equivalent
cell line. While the authors still infer increased oxidation
of fatty acids in whit e adipose t issue, our metab olomic
analysis demonstrates this in vivo in terms of the
changes of metabolites involved in fatty acid oxidation,
demonstrating the pharmacological differences between
different PPAR agonists, as well as the fact that steady
state changes in metabolite concentrations can be as
sensitive as transcriptional changes induced by a
perturbation.
One possible driving force for this increased oxidation
of both glucose and fats, and increased flux through b-
oxidation and the TCA cycle, is the increased expression
of the components of the electron transport chain
(Table 2; Ndufb5, Ndufb10, Ndufb9 , Ndufb2, Cys, Etfa,
mt-Co2, Sdhb, Sdhd, Cox7b, mt-Atp6). This finding in
adipocytes is concordant with previous studies per-
formed in skeletal muscle that demonstrated that
PPARδ activation increases the expression of several
electron transport chain protei ns, including cytochrome
c and cytochrome oxidase [16]. Furthermore, respirome-
try studies confirmed that independently of fatty acid
oxidation the oxidative rate of electron transport chain
complex IV was increased upon PPARδ activation. This
effect was independently observed by the increase in the
creatine concentration within 3T3-L1 adipocytes treated
with the PPARδ agonist, demonstrating an alteration to
the high energy phosphate buffering capacity of the
cells. These findings are consistent with previously
reported observations in skeletal muscle. A decrease in
the intramyocellular l ipid-to-total creatine ratio in the
soleus and tibialis anterior muscles from Sprague-Daw-
ley rats treated with the selective PPARδ agonist
GW610742 has been detected using in vivo
1
HNMR
spectroscopy [17]. In addition, an increase in the con-
centrations of creatine and phosphocreatine were
detected in the gastrocnemius of ob/ob mice following
pharmacological activation of PPARδ [14].
Intriguingly, this increased oxidative capacity also
manifested itself in increased amino acid metabolism, as
indicated by the decrease in BCAAs in the cell culture
media from PPARδ agonist-treated 3T3-L1 cells. PPARδ
agonists have been linked to muscle atrophy [18], and
one potential cause is the increased oxidation of amino
acids, producing cachexia through increased protein
turnover. Metabolomic profiling of obese versus lean
humans h as also recently indicated that BCAA concen-
trations are increased in obesity in the context of high
fat consumption [19], which may be correlated with
decreased PPARδ activity. BCAAs have also been cau-
sally implicated in the pathogenesis of insulin resistance
[19,20], indicating that one possible mechanism by
which PPARδ improves insulin resistance is by reducing
the concentration of BCAAs.
In contrast to the PPARδ-mediated upregulation of
oxidative pathways, PPARg activation has previously
been linked to an increase i n glucose uptake and glyco-
lysis in white adipose tissue [2,21]. A consistent observa-
tion from both the white adipose tissue and 3T3-L1
adipocytes exposed to the PPARg agonist was a decrease
in the concentration of glucose and other carbohydrate
species. Transcriptomic analysis of the 3T3-L1 c ells
showed that the enzymes of glycolysis were increased in
expression, but the labeling of lactate from 1-
13
Cglu-
cose was decreased compared with the control group.
This was also associated with an increase in the concen-
trations of citrate and succinate and decreases in fuma-
rate and malate. The 1-
13
C glucose labeling experiment
and increased citrate concentration demonstrate that
the increased glycolytic flux, and hence ability to m eta-
bolize extracellular glucose, is in fact associated with
fatty acid synthesis. In addition, the microarray analysis
of mRNA expression in 3T3-L1 adipocytes demon-
strated a decrease in expression of isocitrate dehydro-
genase, which in turn will stimulate the export of citrate
out of mitochondria into the cytosol for fatty acid synth-
esis. Transcriptomic analysis also highlighted the signifi-
cant upregulation in the expression of genes involved in
calcium and calmodulin signaling within adipocytes
treated with the PPARg agonist GW347845. Calcium
signaling increases GLUT4 translocation to the plasma
membrane, increasing glucose transportation into adipo-
cytes [2].
PPARg activation also decreased flux through b-oxida-
tion, as demonstrated by both decreased i ntracellular
concentrations of carnitine and reduced labeling of TCA
cycle intermediates and shorter chain fatty acids from
U-
13
C palmitate. In addition, the expression of acyl-CoA
thioesterase 7 and nudix-type motif 19 coenzyme A
dipho sphatase enzymes, which catalyze the hydrolysis of
medium- and long-chain acyl-CoAs to FFA and CoA,
and therefore prevent the b-oxidation of medium- and
long-chain fatty acids once they are formed, was upregu-
lated in the treated adipocytes. Transcription of nuclear
receptor corepressor (Ncor1), a transcrip tional repressor
indicated in the downregulation of gluconeogenesis, oxi-
dative and ketotic metabolism and lipo lysis [22], was
also increased in th e adipocytes treated with the PPARg
agonist.
In contrast to the differences between fatty acid oxida-
tion and synthesis associated with PPARδ and PPARg
stimulation, respectively, the changes induced in the
desaturation of fats by the different agonists showed a
Roberts et al. Genome Biology 2011, 12:R75
/>Page 12 of 19
high degree of similarity. Both PPARδ and PPARg sti-
mulation increased flux through stearoyl-CoA desatur-
ase, a Δ-9 desaturase of saturated fatty acids u nder
PPAR expressional control [23]. For PPARδ,themeta-
bolism of U-
13
C palm itate in 3T3-L1 adipocytes demon-
strated increased synthesis of palmitoleate from
palmitate, while the normalized microarray data for
stearoyl-CoA desaturase and fatty acid desaturase 3
show increased expression. PPARg stimulation similarly
upregulated the expression of stearoyl-CoA desaturase.
The ω-3 and ω-6 essential fatty acid pathways were also
upregulated by both PPARδ and PPARg st imulation, as
exemplified by total fatty acid content and transcrip-
tional changes. The Δ 6-desaturase is integral to both
pathways; the enzyme introduces the initial double bond
into linoleate forming g-linolenate in the ω-6 pathway
and introduces the double bond into linolenate formi ng
stearidonic acid. The Δ 6-desaturase gene is known to
contain a peroxisome proliferator response element and
is under PPAR transcriptional control [24] and may be
the point of transcriptional control for both receptors
within the essential fatty acid pathways.
The fundamental diff erences in fatty acid metabolism
between the two agonists had a profound effect on the
remodeling of triglycerides within adipose tissue. A
decrease in the concentration of several TAGs was
observed in the 3T3-L1 adipocytes following PPARδ
activation. Within white adipose tissue sever al free fatty
acids, such as palmitic acid, were increased in concen-
tration despite th eir total concentration across lipid spe-
cies within the tissue decreasing. These metabolic
alterations are complicit with previously observed
changes indicating that PPARδ activation in white adi-
pose results in an increase in lipolysis in the tissue [25].
The results are corroborated by our observation, made
using h eteronuclear single quantum coherence (HSQC)
NMR spectroscopy, that there was a decrease in the
enrichment of glycerol in adipocytes incubated with 1-
13
C glucose and treated with PPARδ agonist when com-
pared to control cells, indi cating reduced synthesis of
glycerol from glucose on activation of PPARδ.This,in
part, could also explain the decrease in the concentra-
tion of TAGs due to reduced synthesis. Thu s, PPARδ
activation leads to a mobilization of lipid stores and
concomitant decrease in the synthesis of the complex
lipids such as TAGs required for fatty acid storage.
A distinct restructuring of the TAG pool also
occurred as a consequence of PPARg activ ation; the
length and desaturation of fatty acids esterified to TAGs
in cultured adipocytes was increased due to increased
activities of fatty acid elongase and Δ-9 desaturase in
white adipose tissue. PPARg also directly regulates the
glycerol kinase promoter and therefore promotes the
esterification of fatty acids into TAGs [2]. Microarray
analysis indicated that expression of genes encoding
enzymes that catalyze the formation of phospholipids
from lysophospholipids ( lysophosphatidylcholine acyl-
transfera se 3 acyltransferase), with a bias for incor pora-
tion of polyunsaturated fat ty acid moieties, was
increased in adipocytes treated with PPARg [26]. In
addition, the expression of mRNA encoding platelet
activating factor acetylhydrolase 2 lipa se, a lipase selec-
tive for phospholipids with short acyl chains at the sn-2
position, and angiopoietin-related protein 4, an inhibitor
of lipoprotein lipase and therefore lipolysis, was
increased in the PPARg agonist-treated 3T3-L1 cells
[27]. Angiopoietin-related protein 4 is a known target
gene for PPARδ in muscle, and its apparent upregula-
tion in adipose tissue by PPARg identified in this study
may give further insight into t he tissue-specific targets
of the PPAR isoforms [28]. Furthermore, the upregula-
tion of the transcription of genes involved in calcium
signaling as a consequence of PPARg activation may
playaroleindefiningtheconstituentsofthecomplex
lipid pool within the adipocytes. An increase in intracel-
lular calcium stimulates the a ctivity of fatty acid
synthase, stimulates l ipogenesis, inhibits basal lipolysis,
and promotes TAG accumulation within murine and
human adipocytes [2].
The concentrations of several metabolites in the
polyol pathway were decreased following PPAR δ activa-
tion, presumably attributable to increased glucose cata-
bolism. On the other hand, PPARg activation increased
the production of glucitol and fructose, with sorbitol
dehydrogenase being increa sed in e xpression in adipo-
cytes following treatment. Given the role that the polyol
pathway and aldose reductase have in t he formation of
toxic advanced glycation end-products and the resultant
diabetic complications, such as neuropathy, nephropathy
and retinopathy, a decrease in the activity of this path-
waymayproveasignificantanti-diabetic effect of
PPARδ activation [29].
One of the most striking differences between the two
agonists in vivo was the mobilization of TAGs derived
from C16:0, C18:0 and C18:1 fatty acids, representing in
part the most highly synthesized fatty acids from glu-
cose, in blood plasma by PPARδ activation and a reduc-
tion in the same TAGs by PPARg activation. This would
appear to be contrary to previous studies reporting
PPARδ activation to be associated with a reduction of
TAGs in blood plasma as a result of increased oxidation
in skeletal musc le and w hite and brown adipose tissue
[10,11,30]. However, it should be noted that different
studies have used different agonists with differing rela-
tive doses and regimes, and so the effectiveness of short
term lipid lowering in blood plasma may be variable.
The detected increase in certain TAGs containing C16
and C18 saturated and monounsaturated fats in blood
Roberts et al. Genome Biology 2011, 12:R75
/>Page 13 of 19
plasma, and a concomitant decrease in adipose tissue,
following PPARδ activation most likely indicate an
increase in mobilization of TAG stores as a result of
increased oxidation of fats in skeletal muscle. However,
as the mobilization of fat stores continues across time,
presumably these TAGs in the blood plasma will
decrease in concentration, reflecting the anti-atherogenic
properties of PPARδ agonists.
Conclusions
It has been shown that the anti-diabetic and anti-obesity
effects of PPARδ activation are brought about, in part,
by a decrease in fatty acid synthesis and fat storage
within synthesized TAG depots and a concomitant
mobilization of complex lipid fat stores. The mobiliza-
tion of lipid energy stores is accompanied by upregula-
tion of not only fatty acid oxidation but also
carbohydrate and amino acid oxidative metabolism in
white adipose, a tissue not traditionally thought of as
being energetic and oxidative. This novel finding
demonstrates PPARδ’s ability to control global oxidation
within adipose tissue. Essential to this process is the
integration and co-ordination of the energy metabolism
pathways, which PPARδ accomplishes by upregulating
the transcription of a series of genes involved in glycoly-
sis, the TCA cycle, the electron transport chain and
fatty acyl b-oxidation.Thisisinmarkedcontrastto
PPARg activation, where metabolic restructuring
increases fatty acid synthesis in addition to the ultimate
sequestration of fatty acids into triglycerides. Thus,
while both agonists alleviate the effects of T2DM by
potentially decreasing the lipid load on peripheral tissue
and the induction of insulin resistance by lipotoxicity
[31], stimulation of PPARδ mayalsoreduceobesity,
thus being a potent target for the treatment of the meta-
bolic syndrome.
Materials and methods
Ob/Ob mouse study and tissue collection
All animal studies were performed within the relevant
local legislation. Two-month-old male ob/ob mice (Jack-
son Labs, Bar Harbor, ME, USA) were f ed standard
laboratory chow ad li bitum under controlled tempera-
ture, lighting and humidity. D uring the st udies, body
weight and food consumption (cage average) were
recorded. The ob/ob mice were weight matched (mean
weight 46 ± 1 g), assigned to three groups of eight and
dosed o rally daily with vehicle control, the PPARδ ago-
nist GW610742 (30 mg/kg) or t he PPARg agonist
GW347845 (5 mg/kg). Serum was collected via cardiac
stick under isoflourane anesthesia at completion of the
studyonday15.Whiteadiposetissue(gonadalfatpad)
was rapidly dissecte d (< 60 s post mortem), snap frozen
in liquid nitrogen and stored at -80°C until extraction.
3T3-L cell culture and PPAR activation
3T3-L1 preadipocytes were grown in T75 flasks and
maintained in DMEM (high glucose 4.5 g/l; Sigma-
Aldrich, Gillingham, Dorset, UK) supplemented with
10% (v/v) new born calf serum (Sigma-Aldrich), 50
units/ml penicillin, and 50 μg/ml streptomycin (Sigma-
Aldrich) in a humidified 5% CO
2
incubator at 37°C. At
2 days post-confluence cells were induced to differenti-
ate with DMEM supplemented with 10% (v/v) fetal
bovine serum (FBS; Invitrogen, Paisley, Renfrewshire,
UK), 1 μM dexamethasone (Sigma-Aldrich), 0.5 mM
isobutylmethylxanthine (Sigma-Aldrich) , 100 nM insulin
(Sigma-Aldrich), 50 units/ml penicillin, and 50 μg/ml
streptomycin. The cells were maintained in this media
for 7 2 h as this was found to improve the reproducibil-
ity of differentiation between flasks. After 72 h the med-
ium was re placed with DMEM supplemented with 10%
FBS, 100 nM insu lin, 50 units/ml penicillin, and 50 μg/
ml streptomycin. The medium was subsequently chan-
ged for DMEM supplemented with 10% FBS, 50 units/
ml penicillin, and 50 μg/ml streptomycin every 48 h
[32].
At day 11 post-induction the medium on the cells was
replaced with DMEM supplemented with 10% FBS, 100
nM insulin, 50 units/ml penicillin, and 50 μg/ml strepto-
mycin containing DMSO (control; n = 6), the PPARδ
selective agonist GW610742 (n = 6 at 100 nM and 1
μM) or the PPARg selective agoni st GW347845 ( n =6
at 10 nM and 100 nM) for 2 days prior to cell collection
and metabolite extraction. These d oses were based on
the specific affinities of the compounds for t heir respec-
tive receptors.
Cells were collected by removing the medium and
washing each T75 flask with 10 ml of phosphate-buf-
fered saline. Cells were then washed with 1.5 ml tryp-
sin-EDTA solution (5 BAEE units tryp sin/ml, 1.8 μg
EDTA/ml; Sigma-Aldrich) for 2 minutes at 37°C to
remove the cells from the surface of the flask. DMEM
(8.5 ml) supplemented with 10% (v/v) new born calf
serum, 50 units/ml penicillin, and 50 μg/ml streptomy-
cin was added to each flask. The DMEM containing the
cells was transferred to a falcon tube and centrifuged at
200 g for 2 minutes to pellet the cells. The remaining
medium was removed and the cells washed with physio-
logical saline (0.9% NaCl) solution, and 2 ml of media
was stored for further analysis.
Tissue and 3T3-L1 metabolite extraction
Metabolites were extracted from white adipose tissue
and 3T3-L1 cells using a modified Bligh and Dyer
method [33]. Frozen white adipose tissue (approximately
100 mg for NMR and approximately 50 mg for GC-MS
analysis) was pulverized with liquid nitrogen. Metha nol-
chlo roform (2:1, 600 μl) was added to the white adipose
Roberts et al. Genome Biology 2011, 12:R75
/>Page 14 of 19
tissue, serum (50 μl), and to 5 mg cell pellets (3T3-L1
cells) and the samples were sonicated for 15 minutes.
Chloroform-water (1:1) was then added (200 μl of each).
Samples were centrifuged (16,100 g, 20 minutes) and
the organic and aqueous phases were separated and
stored at -80°C until analysis. Of these fractions, 100 μl
of the organic phase was used for LC-MS, and the
remaining organic phase was used for GC-MS. Prior to
analysis the organic fractions were dried in a fume
hood. For the aqueous phase, 100 μl of the aqueous
phase was taken for GC-MS analysis, and the remaining
aqueous phase sample was used for
1
HNMR
spectroscopy.
1
H-NMR spectroscopy
Dried extracts were dissolved in 600 μlofD
2
O and buf-
fered in 0.24 M sodium phosphate (pH 7.4) containing
1 mM TSP (sodium-3-(trimethylsilyl)-2,2,3,3-tetradeu-
teriopropionate; Cambridge Isotope Laboratories, A nd-
over, MA, USA) and 0.02% sodium azide. Samples were
analyzed using a DRX Avance II+ spectrometer inter-
faced to a 5-mm TXI ATMA probe (Bruker BioSpin
GmbH, Rheinstetten, Germa ny) at a proton frequency
of 500.13 MHz. A presaturation pulse sequence for
water suppression based on a one-dimensional nuclear
Overhauser effect spectroscopy pulse seque nce was used
to saturate the residual water proton signal (relaxation
delay = 2 s, t
1=
4 μs, mixing time = 50 ms). We col-
lected 128 and 256 transients for white adipose tissue
extracts and 3T3- L1 cell extracts, respectively, into 64 K
data points over a spectral width of 8,000 Hz at 300 K.
NMRspectrawereprocessedinACD1DNMRMan-
ager (Advanced Chemistry Development Inc., Toronto,
Canada). The NMR spectra were integrated using 0.04
ppm integral regions between 0.2 and 9.56 ppm (exclud-
ing water resonance between 4.20 and 5.08 ppm). Spec-
tra were normalized to total integrated a rea to account
for differences in concentration between samples and
assigned by comparison with previous literature and
Chenomx NMR suite 5.0 libraries.
GC-MS analysis
Dried aqueous phase samples were derivatized using
methoxyamine hydrochloride solution (20 mg/ml in pyr-
idine; Sigma-Aldrich) and 30 μlofN-methyl-N-tri-
methylsilyltrifluoroacetamide (Macherey-Nagel, Duran,
Germany) using the method described by Gullberg et al.
[34].
Acid-catalyzed esterification was used to derivatize the
organic phase samples. Chloroform-methanol (1:1, 0.25
ml) and BF
3
-methanol (10%, 0.125 ml) was added to the
organic phase and incubated at 90°C for 90 minutes.
Water (0.15 ml; ultrapurified to resistivity 18.2 MΩ cm)
and hexane (0.3 ml) were added and the samples vortex
mixed for 1 minute and left to form a bilayer. The aqu-
eous phase was discarded and the organic layer evapo-
ratedtodrynesspriortoreconstitution in analytical
grade hexane (200 μl) before GC-MS analysis. All GC-
MS analyses were made using a Trace GC Ultra coupled
to a Trace DSQ II mass spectrometer (Thermo Scienti-
fic, Hemel Hempstead, UK). Der ivatized aqueous sam-
ples were injected splitless onto a 30 m × 0.25 mm 5%
phenylpolysilphenylene-si loxane column with a 0.25 μm
ZB-5 ms stationary phase (Phenomenex, Macclesfield,
Cheshire, UK) as described in Roberts et al. [32]. Full-
scan spectra were collected using three scans/s over a
range of 50 to 650 m/z.
The derivatized organ ic samples were injected wi th a
split ratio of 60 for white adipose tissue and 8 for 3T3-
L1 cells onto a 30 m × 0.25 mm 70% cyanopropyl poly-
silphenylene-siloxane 0.25 μmTR-FAMEstationary
phase column (Thermo Scientific) as described above
and by Roberts et al. [32].
GC-MS chromatograms were processed using Xcaliber
(version 2.0; Thermo Scientific). Each individual peak
was integrated and then normalized. Overlapping peaks
were separated using traces of single ions. Peak assign-
ment was based on mass fragmentation patterns
matched to the National Institute of Standards and
Technology (USA) library and to previously reported lit-
erature. Identification of metabolites from organic phase
GC-MS analysis was supported by comp arison with a
FAME standard mix (Supelco 37 Component FAME
Mix; Sigma-Aldrich).
Ultra performance LC-MS analysis
Chromatography was performed using an ACQUITY
UPLC
®
system (Waters Corporation, Centennial Park,
Elstree, Hertfordshire) equipped with an Acquity UPLC
1.7 μm Bridged Ethyl Hybrid (BEH) C8 column (2.1 ×
100 mm Waters), which was kept at 65°C and coupled
to a Micromass QTof-Ultima™ with a Z-spray™ elec-
trospray source as described by Roberts et al. [32]. The
binary solvent system used was solvent A comprising
HPLC grade water (Sigma-Aldrich), 1% 1 M ammonium
acetate (NH
4
Ac; Sigma-Aldrich) and 0.1% formic acid
(Sigma-Aldrich) and solvent B comprising analytical
grade acetonitrile (chromosolv, Sigma-Aldrich)/isopro-
panol (Fisher Scientific, Loughborough, Leicestershire,
UK) 5:2, 1% 1 M NH
4
Ac, and 0.1% formic acid [35].
Mass spectrometric data were collected in full scan
mode from 100 to 1,350 m/z for adipose and 100 to
1,500 m/z for 3T3-L1 cells from 0 to 14 minutes with a
scan duration of 0.5 s and an interscan delay of 0.1 s.
For tissue extracts, the column mobile phase was held
at 85% solvent B for 0.5 minutes followed by an increase
from 85 to 100% solvent B over 0.5 to 8 minutes. The
mobile phase was then held at 100% solvent B for 4
Roberts et al. Genome Biology 2011, 12:R75
/>Page 15 of 19
minutes. Between 12 and 12.25 minutes the mobile
phase was returned to 85% solvent B held for 1.75 min-
utes to re-equilibrate the column. For serum extracts,
the column mobile phase was held at 70% solvent B for
0.5 minutes followed by an increase from 70 to 100%
solvent B over 0.5 to 6.5 minutes. The mobile phase was
then held at 100% solvent B for 3.5 minutes. Between
10 and 10.25 minutes the mobile phase was returned to
70% solvent B held for 3.75 minutes to re-equilibrate
the column. For 3T3-L1 cell organic phase metabolites,
the column mobile phase was held at 50% solvent B for
0.5 minutes followed by an increase from 50 to 100%
solvent B over 0.5 to 6.5 minutes. The mobile phase was
then held at 100% solvent B for 3.5 minutes. Between
10 and 10.25 minutes the mobile phase was returned to
50% solvent B held for 3.75 minutes to re-equilibrate
the column. The total ultra performance liquid chroma-
tography (UPLC) cycle was 14 minut es and the eluent
flow rate was 600 μl/minute for both methods.
Tandem mass spectrometry (MS/MS) was used for the
identification of selected lipids. Data were processed
using Micromass Markerlynx Applications Manager
(Waters Corporation).
DI-MS analysis
Mass spectrom etric analysis was also performed using a
Thermo Finnigan LTQ equipped with a Finnigan Sur-
veyor pump and Finnigan Micro AS Autosampler
Thermo Finnigan, Hemel Hempstead, Hertfordshire,
UK.
The 3T3-L1 organic phase samples for DI-MS were
reconstituted in 500 μl methanol:tetrahydrofuran (2:1, v/
v). Samples were analyzed in triplicate using both posi-
tive and negative mode. The scan range was set at 100
to 1,100 m/z in prof ile for both positive and negat ive
mode. DI-MS chromatog rams were processed using
Xcaliber (versio n 2.0; Thermo Electron). The mass data
were summed from the chromatogram for the period of
sample injection and the exact masses were exported;
thedatapointsweresummedbetweenMandM+1,
normalized to total metabolite concentration and inte-
grated. Tandem mas s spectrometry data were collected
for identification purposes.
13
C-glucose substrate labeling study
At 2 days post-differentiation medium was removed
from the T75 flasks and replaced with DMEM (10% (v/
v) fetal bovine serum, 50 units/ml penicillin, and 50 μg/
ml streptomycin) and either 4.5 g/l unlabeled g lucose
with DMSO control (n =6),1μM GW610742 (n =7)
or 1 μM GW347845 (n =7),or4.5g/l1-
13
C-glucose
with DMSO control (n =7),1μM GW610742 (n =7)
or 1 μM GW347845 (n = 7). After 2 days cells were col-
lected and metabolites extracted as previously described.
13
C-palmitate substrate labeling study
Palmitate was solubilized using a dialyzed albumin solu-
tion. At 2 days post-differentiation medium was
removed from the T75 flasks and replaced with DMEM
(serum free, 50 units/ml penicillin, and 50 μg/ml strep-
tomycin) and either 70 μM unlabeled palmitate with
DMSO control (n =6),1μM GW610742 (n =7)or1
μMGW347845(n =7),or70μMU-
13
C labeled palm i-
tate with DMSO control (n =6),1μM GW610742 (n =
7) or 1 μM GW347845 (n = 7). After 2 days cells were
collected and metabolites extracted as previously
described.
13
C-Heteronuclear single quantum coherence NMR
Dried organic phase extracts were dissolved in 600 μlof
deuterated chloroform. Samples were analyzed using a
DRX Avance II+ spectrometer interfaced to a 5-mm
TXI ATMA probe. Analysis was performed using two-
dimensional H-1/X correlation via double inept transfer
with sensitivity improvement. Spectral widths of 10.00
ppm and 160 ppm were used in the F2 (1H) a nd F1
(13C) dimensions, respectively, with an offset of 75.00
ppm. Spectra were acquired using 96 scans with a
relaxation delay of 1.0 s. Datasets were zero-filled and
multiplied by sine bell squared functions prior to Four-
ier transformation.
13
C-labeled substrate GC-MS analysis
Analysis of organic and aqueous phases was carried out
as previously described above. Enrichment of metabo-
lites was identified by calculating isotope ratios of the M
and M+1 ions for the parent ion of the fragmentation
pattern in the case of
13
C-glucose metabolism analysis
and T CA cycle intermediates originating from
13
C-pal-
mitate oxidation. For fatty acid s ynthesis and desatura-
tion products from
13
C-labeled palmitate an ion ratio of
M+16/M was used, and for fatty acids originating from
oxidation of
13
C-labeled palmitate an ion ratio of M+n/
M was used, where n = the carbon chain length of the
fatty acid. Statistical analysis was performed using a uni-
variate Student t-test.
Multivariate analysis
Multivari ate data analysis was performed using SIMCA-
P
+
11.0 (Umetrics AB, Umeå, S weden). NMR, DI-MS
and UPLC-MS data sets were mean-centered and Par-
eto-scaled prior to analysis. GC-MS data sets were
scaled to unit variance (UV) as only manually fitted
peaks were analyzed. Da ta sets were analyzed using
principal components analysis and PLS-DA. Metabolite
changes responsible for clustering or regression trends
within the pattern recognition models were identified by
interrogating the corresponding loadings plot. Metabo-
lites identified i n the variable importance in projections/
Roberts et al. Genome Biology 2011, 12:R75
/>Page 16 of 19
coefficients plots were deemed to have changed globally
if they contributed to separation in the models w ith a
confidence limit of 95%.
Respirometric analysis of PPARδ and PPARg agonist-
treated 3T3-L1 cells
Cells were grown, treated with either vehicle control, the
PPARδ agonist or the PPARg agonist for 2 days prior to
collection into respiration medium (100 mM KCl, 50
mM MOPS (3-(N-morpholino)propanesulfonic acid), 1.0
mM KH
2
PO
4
, 1.0 mg/ml defatted bovine serum albu-
min, pH 7.4). Respiratory rates of in situ permeabilized
3T3-L1 cells were measured using a Clark-type oxygen
electrode (Strathkelvin Instruments Ltd, Glasgow, UK)
[36]. Respiration rates were recorded and quantified
using 782 Oxygen System v3.0 software (Strathkelvin
Instruments). Oxygen concentrations were measured
continuously in 0.5 ml respiration medium containing
250,000 cells in a respiration chamber maintained at 37°
C for 40 minutes. The cells were initially permeabilized
with the addition of Digitonin ( 25 μg/ml), before malate
(5 m M) plus palmitoyl-carnitine (0.04 mM) were added
as respiratory substrates to measure the fatty acid oxida-
tion rates. Respiration was stimulated by the addition of
a saturating concentration of ADP (2 mM) plus MgCl
2
(0.6 mM) and subsequently measured. Antimycin (5
μM) was then added to inhibit complex III of the elec-
tron transport chain, and respiration ceased. Complex
IV respiration was stimulated by addition of the artificial
substrates TMPD (N, N, N’,N’ -tetramethyl-p-phenyle-
nediamine dihydrochloride, 0.5 mM) and ascorbate ( 2
mM). F inally, respiration was terminated by addition of
the complex IV inhibitor sodium azide (3 mM).
Microarray analysis of PPARδ agonist-treated 3T3-L1 cells
3T3-L1 adipocytes were cultured and then treated with
either the PPARδ agonist, the PPARg agonist or vehicle
control as described above (n = 6 independent indivi-
dual hybridizations for each treatment group). RNA was
extracted using RNeasy (Qiagen GmbH, Hilden, Ger-
many). Approximately 5 mg of cells was used per sam-
ple for RNA isolation. Procedures were carried out
according to the manufacturer’s instructions. Extracted
RNA was quantified and its purity assessed using a
Nanodrop ND-1000 Spectrometer (Nanodrop Technolo-
gies Inc., Wilmington, NC, USA) to measure the absor-
bance at 260 nm and the A
260
/A
280
ratio, respectively.
Illumina Infinium Gene Expression BeadArrays (Illu-
mina Inc., San Diego, CA, USA) were used to perform
transcriptomics. A mouse WG6 array platform was used
with 45,281 probes. Analysis was performed with R/Bio-
Conductor version 2.5. The R package lumi [37] was
used with the d etection P-value threshold set to 0.01.
Probes were required to be successfully detected ( P-
value < 0.01 in Lumi) in at least one sample to pass the
selection. The data were transformed using variance st a-
bilization [38] and then normalized using quantile nor-
malization. Gene expression was compared using the R
package limma [39] with a 95% confidence interval . The
selected and normalized data were then analyzed using
Simca-P+. The 6% of transcript s most responsible for
separation in the multivariate models were then exam-
ined (3% most increased and 3% most decreased in trea-
ted cells as identified in the multivariate models). The
microarray data have been deposited with the Gene
Expression Omnibus and have the accession number
[GSE26207].
The Reactome Skypainter tool was used to determine
which pathways were statistically significant in terms of
key perturbations [13]. From a given set of genes parti-
cipating in a pathway, the total genes for Mus mus culus
and the submitted genes (genes increased in PPARδ-or
PPARg-activated cells) of which N genes participate in a
pathway, the probability of observing at least N genes
from a pathway if that pathway is not overrepresented
in the submitted list of genes is calculated using F isher’s
exact test. A P-value smaller than the significance level
suggests the pathway is significantly represented.
Univariate statistical analysis methodology
Univariate analysis was performed using an unpaired
Student’s t-test with a significance level set to P <0.05.
An F-test was also utilized to compare the variance of
two distributions. All univariate analysis was conducted
in GraphPad Prism (version 4).
Additional material
Additional file 1: Figure S1 - M+1/M isotope ratio
13
C enrichment of
lactate, succinate, glutamate and arachidate. (a-c) M+1/M isotope
ratio
13
C enrichment of (a) lactate, (b) succinate and (c) glutamate
analyzed by GC-MS of the aqueous fraction from control and PPARg
agonist-treated 3T3-L1 cells incubated with 1-
13
C-glucose. (d) M+1/M
isotope ratio
13
C enrichment of arachidate analyzed by GC-MS of the
organic fraction from control and PPARg agonist-treated 3T3-L1 cells
incubated with 1-
13
C-glucose. *P < 0.05. The metabolites have been
mapped to the glycolysis, TCA cycle and fatty acid synthesis metabolic
pathways. An upward pointing arrows indicates a metabolite increased
in
13
C enrichment by PPARg activation, and a downward pointing arrows
indicates a metabolite decreased in
13
C enrichment by PPARg activation.
Parent ions were used to calculate ion ratio.
Additional file 2: Figure S2 - the average integrated area of the
two-dimensional HSQC-NMR organic fraction glycerol peak. (a) A
graph of the average integrated area of the two-dimensional HSQC-NMR
organic fraction glycerol peak (
13
C chemical shift 62.04) from control and
1 μM PPARδ agonist-treated 3T3-L1 adipocytes incubated in 1-
13
C
glucose. (b) A graph of the average integrated area of the two-
dimensional HSQC-NMR organic fraction glycerol peak (
13
C chemical shift
62.17) from control and 1 μM PPARδ agonist-treated 3T3-L1 adipocytes
incubated in 1-
13
C glucose. (c) A graph of the average integrated area of
the two-dimensional HSQC-NMR organic fraction esterified glycerol peak
from control and 1 μM PPARδ agonist-treated 3T3-L1 adipocytes
Roberts et al. Genome Biology 2011, 12:R75
/>Page 17 of 19
incubated in 1-
13
C glucose. *P < 0.05, ***P < 0.005. Parent ions were
used to calculate ion ratio.
Additional file 3: Figure S3 - M+1/M isotope ratios. (a, b) The M+1/M
isotope ratio
13
C enrichment of (a) glutamate and (b) isocitrate analyzed
by GC-MS of the aqueous fraction from control and PPARg agonist-
treated 3T3-L1 cells incubated with
13
C-U-palmitate. (c-e) Graphs
showing the isotope ratio
13
C enrichment of myristate (c), arachidate (d)
and palmitate (e) analyzed by GC-MS of the organic fraction from control
and PPARg agonist-treated 3T3-L1 cells incubated with
13
C-U-palmitate.
The metabolites have been mapped to the TCA cycle and fatty acid b-
oxidation/synthesis metabolic pathways. Red indicates a metabolite
increased in
13
C enrichment by PPARg activation. Blue indicates a
metabolite decreased in
13
C enrichment by PPARg activation. *P < 0.05,
**P < 0.01,***P < 0.005. Parent ions were used to calculate ion ratio.
Additional file 4: Figure S4 - the effect of PPARg activation on the
integration of the energy metabolism pathways of 3T3-L1
adipocytes. A diagram showing the effect of PPARg activation on the
integration of the energy metabolism pathways of 3T3-L1 adipocytes
based on the combination of results from the metabolomic,
transcriptomic and stable isotope labeling studies. Red indicates an
increase in concentration or expression in cells treated with the PPARg
selective agonist GW347845. Blue indicates a decrease in concentration
in cells treated with the PPARg selective agonist GW347845.
Abbreviations
BCAA: branched chain amino acid; CoA: coenzyme A; DI: direct infusion;
DMEM: Dulbecco’s modified Eagles media; FBS: fetal bovine serum; GC: gas
chromatography; HSQC: heteronuclear single quantum coherence; LC: liquid
chromatography; PC: phosphatidylcholine; MS: mass spectrometry; NMR:
nuclear magnetic resonance; PLS-DA: partial least squares-discriminant
analysis; PPAR: peroxisome proliferator-activated receptor; T2DM: type 2
diabetes mellitus; TAG: triacylglycerol; TCA: tricarboxylic acid; UPLC: ultra
performance liquid chromatography.
Acknowledgements
The authors gratefully acknowledge the support from the Biotechnology
and Biological Sciences Research Council, UK (LDR, JLG, AWN), the Medical
Research Council, UK (JLG), the British Heart Foundation (JLG: PG/05/081 &
TA: FS/09/050), the Wellcome Trust (JLG: PG 078652/Z/05/Z), GlaxoSmithKline
(LDR, AWN), and the Royal Society (UK) (JLG). The authors would also like to
acknowledge Cambridge Genomic Services for performing the microarray
analysis.
Author details
1
Department of Biochemistry University of Cambridge, Tennis Court Road,
Cambridge CB2 1QW, UK.
2
The Cambridge Systems Biology Centre,
University of Cambridge, Tennis Court Road, Cambridge CB2 1QR, UK.
3
Department of Physiology, Development and Neuroscienc e University of
Cambridge, Downing Street, Cambridge CB2 3EG, UK.
4
GlaxoSmithKline,
Investigative Preclinical Toxicology, Park Road, Ware, SG12 0DP, UK.
5
MRC
Human Nutrition Research, Elsie Widdowson Laboratory, Fulbourn Road,
Cambridge, CB1 9NL, UK.
6
The MRC Centre for Obesity and Related
Disorders (CORD), Institute of Metabolic Sciences, University of Cambridge,
Addenbrooke’s Hospital, Cambridge, CB2 0QQ, UK.
Authors’ contributions
LDR was responsible for document preparation, tissue culture, metabolomic,
oxygen consumption, flux and statistical analysis. AJM and DM performed
the oxygen consumption analysis. TA performed the metabolomic analysis
of cell culture media. AWN was responsible for scientific discussion and
guidance. JLG was responsible for document preparation, metabolomic
analysis of cell culture media, scientific discussion and guidance. All authors
have read and approved the manuscript for publication.
Competing interests
The authors declare that they have no competing interests.
Received: 16 March 2011 Revised: 27 June 2011
Accepted: 11 August 2011 Published: 11 August 2011
References
1. Kota BP, Huang TH, Roufogalis BD: An overview of biological mechanisms
of PPARs. Pharmacol Res 2005, 51:85-94.
2. Castelein H, Gulick T, Declercq PE, Mannaerts GP, Moore DD, Baes MI: The
peroxisome proliferator activated receptor regulates malic enzyme gene
expression. J Biol Chem 1994, 269:26754-26758.
3. van Bilsen M, van der Vusse GJ, Gilde AJ, Lindhout M, van der Lee KA:
Peroxisome proliferator-activated receptors: lipid binding proteins
controlling gene expression. Mol Cell Biochem 2002, 239:131-138.
4. Barbier O, Torra JP, Duguay Y, Blanquart C, Fruchart JC, Glineur C:
Pleiotropic actions of peroxisome proliferator-activated receptors in lipid
metabolism and atherosclerosis. Arterioscler Thromb Vasc Biol 2002,
22:717-726.
5. Lee CH, Olson P, Evans RM: Minireview: lipid metabolism, metabolic
diseases, and peroxisome proliferator-activated receptors. Endocrinology
2003, 144:2201-2207.
6. Peters JM, Lee SS, Li W, Ward JM, Gavrilova O, Everett C, Reitman ML,
Hudson LD, Gonzalez FJ: Growth, adipose, brain, and skin alterations
resulting from targeted disruption of the mouse peroxisome
proliferator-activated receptor beta(delta). Mol Cell Biol 2000,
20:5119-5128.
7. Muoio DM, MacLean PS, Lang DB, Li S, Houmard JA, Way JM, Winegar DA,
Corton JC, Dohm GL, Kraus WE: Fatty acid homeostasis and induction of
lipid regulatory genes in skeletal muscles of peroxisome proliferator-
activated receptor (PPAR) alpha knock-out mice. Evidence for
compensatory regulation by PPARdelta. J Biol Chem 2002,
277:26089-26097.
8. Schug TT, Berry DC, Shaw NS, Travis SN, Noy N: Opposing effects of
retinoic acid on cell growth result from alternate activation of two
different nuclear receptors. Cell 2007, 129:723-733.
9. Larsen TM, Toubro S, Astrup A: PPARgamma agonists in the treatment of
type II diabetes: is increased fatness commensurate with long term
efficacy. Int J Obes Relat Metab Disord 2003, 27:147-161.
10. Oliver WR, Shenk JL, Snaith MR, Russell CS, Plunket KD, Bodkin NL,
Lewis MC, Winegar DA, Sznaidman ML, Lambert MH, Xu HE, Sternbach DD,
Kliewer SA, Hansen BC, Willson TM: A selective peroxisome proliferator-
activated receptor delta agonist promotes reverse cholesterol transport.
Proc Natl Acad Sci USA 2001, 98:5306-5311.
11. Wang Y-X, Lee C-H, Tiep S, Yu RT, Ham J, Kang H, Evans RM: Peroxisome-
proliferator-activated receptor delta activates fat metabolism to prevent
obesity. Cell 2003, 113:159-170.
12. Veen JN, Kruit JK, Havinga R, Baller JF, Chimini G, Lestavel S, Staels B,
Groot BH, Groen AK, Kuipers F: Reduced cholesterol absorption upon
PPARdelta activation coincides with decreased intestinal expression of
NPC1L1. J Lipid Res 2005, 46:526-534.
13. Joshi-Tope G, Gillespie M, Vastrik I, D’Eustachio P, Schmidt E, de Bono B,
Jassal B, Gopinath GR, Wu GR, Matthews L, Lewis S, Birney E, Stein L:
Reactome: a knowledgebase of biological pathways. Nucleic Acids Res
2005, 33:D428-D432.
14. Roberts LD, Hassall DG, Winegar DA, Haselden JN, Nicholls AW, Griffin JL:
Increased hepatic oxidative metabolism distinguishes the action of
peroxisome proliferator-activated receptor delta from peroxisome
proliferator-activated receptor gamma in the Ob/Ob mouse. Genome
Med 2009,
1:115.
15.
Cerdan S, Kunnecke B, Dolle A, Seelig J: In situ metabolism of 1, omega
medium chain dicarboxylic acids in the liver of intact rats as detected
by 13C and 1H NMR. J Biol Chem 1988, 263:11664-11674.
16. Wang YX, Zhang CL, Yu RT, Cho HK, Nelson MC, Bayuga-Ocampo CR,
Ham J, Kang H, Evans RM: Regulation of muscle fiber type and running
endurance by PPARdelta. PLoS Biol 2004, 2:e294.
17. Jucker BM, Yang D, Casey WM, Olzinski AR, Williams C, Lenhard SC,
Legos JJ, Hawk CT, Sarkar SK, Newsholme SJ: Selective PPARdelta agonist
treatment increases skeletal muscle lipid metabolism without altering
mitochondrial energy coupling: an in vivo magnetic resonance
spectroscopy study. Am J Physiol Endocrinol Metab 2007, 293:E1256-1264.
18. Constantin D, Constantin-Teodosiu D, Layfield R, Tsintzas K, Bennett AJ,
Greenhaff PL: PPARdelta agonism induces a change in fuel metabolism
Roberts et al. Genome Biology 2011, 12:R75
/>Page 18 of 19
and activation of an atrophy programme, but does not impair
mitochondrial function in rat skeletal muscle. J Physiol 2007, 583:381-390.
19. Newgard CB, An J, Bain JR, Muehlbauer MJ, Stevens RD, Lien LF, Haqq AM,
Shah SH, Arlotto M, Slentz CA, Rochon J, Gallup D, Ilkayeva O, Wenner BR,
Yancy WS Jr, Eisenson H, Musante G, Surwit RS, Millington DS, Butler MD,
Svetkey LP: A branched-chain amino acid-related metabolic signature
that differentiates obese and lean humans and contributes to insulin
resistance. Cell Metab 2009, 9:311-326.
20. Wang TJ, Larson MG, Vasan RS, Cheng S, Rhee EP, McCabe E, Lewis GD,
Fox CS, Jacques PF, Fernandez C, O’Donnell CJ, Carr SA, Mootha VK,
Florez JC, Souza A, Melander O, Clish CB, Gerszten RE: Metabolite profiles
and the risk of developing diabetes. Nat Med 2011, 17:448-453.
21. Wu Z, Xie Y, Morrison RF, Bucher NL, Farmer SR: PPARγ induces the
insulin-dependent glucose transporter GLUT4 in the absence of C/EBPα
during the conversion of 3T3 fibroblasts into adipocytes. J Clin Invest
1998, 101:22-32.
22. Alenghat T, Meyers K, Mullican SE, Leitner K, Adeniji-Adele A, Avila J,
Bucan M, Ahima RS, Kaestner KH, Lazar MA: Nuclear receptor corepressor
and histone deacetylase 3 govern circadian metabolic physiology. Nature
2008, 456:997-1000.
23. Miller CW, Ntambi JM: Peroxisome proliferators induce mouse liver
stearoyl-CoA desaturase 1 gene expression. Proc Natl Acad Sci U S A 1996,
3:9443-9448.
24. Kawashima Y, Musoh K, Kozuka H: Peroxisome proliferators enhance
linoleic acid metabolism in rat liver. Increased biosynthesis of omega 6
polyunsaturated fatty acids. J Biol Chem 1990, 265:9170-9175.
25. de Lange P, Lombardi A, Silvestri E, Goglia F, Lanni A, Moreno M:
Peroxisome proliferator-activated receptor delta: a conserved director of
lipid homeostasis through regulation of the oxidative capacity of
muscle. PPAR Res 2008, 2008:172676.
26. Kazachkov M, Chen Q, Wang L, Zou J: Substrate preferences of a
lysophosphatidylcholine acyltransferase highlight its role in
phospholipid remodeling. Lipids 2008, 43:895-902.
27. Hato T, Tabata M, Oike Y: The role of angiopoietin-like proteins in
angiogenesis and metabolism. Trends Cardiovasc Med 2008, 18:6-14.
28. Staiger H, Haas C, Machann J, Werner R, Weisser M, Schick F, Machicao F,
Stefan N, Fritsche A, Häring HU: Muscle-derived angiopoietin-like protein
4 is induced by fatty acids via peroxisome proliferator-activated
receptor (PPAR)-delta and is of metabolic relevance in humans. Diabetes
2009, 58:579-589.
29. Sato T, Iwaki M, Shimogaito N, Wu X, Yamagishi S, Takeuchi M: TAGE (toxic
AGEs) theory in diabetic complications. Curr Mol Med 2006, 6:351-358.
30. Risérus U, Sprecher D, Johnson T, Olson E, Hirschberg S, Liu A, Fang Z,
Hegde P, Richards D, Sarov-Blat L, Strum JC, Basu S, Cheeseman J,
Fielding BA, Humphreys SM, Danoff T, Moore NR, Murgatroyd P, O’Rahilly S,
Sutton P, Willson T, Hassall D, Frayn KN, Karpe F: Activation of peroxisome
proliferator-activated receptor (PPAR)delta promotes reversal of multiple
metabolic abnormalities, reduces oxidative stress, and increases fatty
acid oxidation in moderately obese men. Diabetes 2008, 57:332-339.
31. Muoio DM, Newgard CB: Mechanisms of disease: molecular and
metabolic mechanisms of insulin resistance and beta-cell failure in type
2 diabetes. Nat Rev Mol Cell Biol 2008, 9:193-205.
32. Roberts LD, Virtue S, Vidal-Puig A, Nicholls AW, Griffin JL: Metabolic
phenotyping of a model of adipocyte differentiation. Physiol Genomics
2009, 39:109-119.
33. Bligh EG, Dyer WJ: A rapid method of total lipid extraction and
purification. Can J Biochem Physiol 1959, 37:911-917.
34. Gullberg J, Jonsson P, Nordstrom A, Sjostrom M, Moritz T: Design of
experiments: an efficient strategy to identify factors influencing
extraction and derivatization of Arabidopsis thaliana samples in
metabolomic studies with gas chromatography/mass spectrometry. Anal
Biochem 2004, 331:283-295.
35. Pietiläinen KH, Marko S, Rissanen A, Seppänen-Laakso T, Yki-Järvinen H,
Kaprio J, Orešič M: Acquired obesity is associated with changes in the
serum lipidomic profile independent of genetic effects - a monozygotic
twin study. PLoS ONE 2007, 2:e218.
36. Kuznetsov AV, Veksler V, Gellerich FN, Saks V, Margreiter R, Kunz WS:
Analysis of mitochondrial function in situ in permeabilized muscle
fibers, tissues and cells. Nat Protoc 2008, 3:965-976.
37. Du P, Kibbe WA, Lin SM: lumi: a pipeline for processing Illumina
microarray. Bioinformatics 2008, 24:1547-1548.
38. Lin SM, Du P, Huber W, Kibbe WA: Model-based variance-stabilizing
transformation for Illumina microarray data. Nucleic Acids Res 2008, 36:
e11.
39. Smyth GK: Linear models and empirical Bayes methods for assessing
differential expression in microarray experiments. Stat Appl Genet Mol Biol
2004, 3:Article3.
doi:10.1186/gb-2011-12-8-r75
Cite this article as: Roberts et al.: The contrasting roles of PPARδ and
PPARg in regulating the metabolic switch between oxidation and
storage of fats in white adipose tissue. Genome Biology 2011 12:R75.
Submit your next manuscript to BioMed Central
and take full advantage of:
• Convenient online submission
• Thorough peer review
• No space constraints or color figure charges
• Immediate publication on acceptance
• Inclusion in PubMed, CAS, Scopus and Google Scholar
• Research which is freely available for redistribution
Submit your manuscript at
www.biomedcentral.com/submit
Roberts et al. Genome Biology 2011, 12:R75
/>Page 19 of 19