Neuroimmunology in Clinical Practice - part 3 pdf
Bạn đang xem bản rút gọn của tài liệu. Xem và tải ngay bản đầy đủ của tài liệu tại đây (354.53 KB, 27 trang )
Multiple sclerosis 49
manual dexterity, impaired verbal memory and
language deficits in all forms of the disease. Cortical
aphasia, agnosia, and apraxia are rare in MS, while
verbal fluency and verbal memory are often impaired
relatively early during the disease. Callosal discon-
nection as well as alexia without agraphia was
described in case reports (Mao-Draayer and Panitch,
2004). Since the observed cognitive abnormalities
predominantly affect executive functions, such impair-
ments by themselves may become highly disabling
in MS, and significantly interfere with professional and
social functioning. The combination of abnormal-
ities in attention, planning, working memory, speed
of information processing and visuo-spatial skills,
along with physical disability, can significantly
interfere with the performance of complex daily
tasks. Impairments in all cognitive domains may
result from a diffuse distribution of microscopic
pathology, while a large lobar lesion can present
with a predominant lobar deficit. Extensive cortical
pathology accompanying varying loads of subcort-
ical lesions may result in mixed forms of dementia
(Buchanan et al., 2005). The severity of cognitive
impairment best correlates with the total cerebral
disease burden defined by recently developed con-
ventional and nonconventional MRI sequences, and
both gray- and white-matter atrophy contributes to
cognitive and neuropsychological impairments in
MS (Sanfilipo et al., 2006). Metabolic and functional
abnormalities detected by PET scan or functional
MRI in cortical neurons likely reflect disruption
of intercortical and subcortical pathways, lesions
directly affecting neurons and toxic effect of soluble
inflammatory products (De Souza et al., 2002;
La Rocca, 2000; Rao et al., 1991). A trans-synaptic
alteration of neuronal activity is also possible.
Mapping of compensatory changes and plasticity of
the brain represents an important field of functional
imaging (Tartaglia and Arnold, 2006).
Psychological disability in MS most commonly in-
cludes emotional lability, irritability, euphoria, apathy,
depression, bipolar disorder, suicidal ideation, anti-
social behavior, and psychosis (Figved et al., 2005;
De Souza et al., 2002). These symptoms negatively
influence the quality of life and add to the disabling
effects of cognitive abnormalities. Depression may
be caused by the disruption of normal anatomy,
changes in neurotransmitter production, and altera-
tion of the neuroendocrine pathways. Reaction to
disability and medication side effects may also con-
tribute to depression. Most studies testing the relation-
ship between depression and cognition suggest that
there is little or no relationship. However, a meta-
analysis by Thronton and Naftail (1997) reveals a
strong correlation between depression and working
memory, but no relationship between depression
and short-term or long-term memory (La Rocca,
2000; De Souza et al., 2002). Euphoria is an inappro-
priate expression of optimism and happiness that
is often associated with signs of emotional dysin-
hibition. Euphoria usually results from a diffuse and
severe pathology in patients with advanced physical
and cognitive disability.
Bedside testing cannot adequately assess cognitive
function or mood disorders, and the use of compre-
hensive neuropsychological batteries may be ne-
cessary in a great proportion of MS patients. The
increasing availability of immunomodulatory, neuro-
protective, antipsychotic, and mood-stabilizer drugs,
along with other symptomatic treatments and
rehabilitation methods, underscore the importance
of early evaluation of cognitive and mood disorders
in MS.
Variants of MS
ON, ATM, Marburg’s type of MS and Balo’s con-
centric sclerosis are discussed above. Neuromyelitis
optica or Dévic’s disease is reviewed in Chapter 4.
MS mimics
There are several autoimmune, infectious, and
granulomatosus disorders which imitate sporadic
MS. A short list includes lupus, Sjögren’s syn-
drome, Behçet’s disease, antiphospholipid antibody
syndromes, Susac’s syndrome, Lyme disease,
cysticercosis, and sarcoidosis. The history, clinical
presentation, MRI characteristics, and a compre-
hensive laboratory work up usually help to establish
the differential diagnosis. Familial forms of MS
occasionally present with pseudomendelian inherit-
ance patterns. Therefore, inherited forms of white-
matter diseases including leukodystrophies with
autosomal dominant, recessive, or X-linked trans-
mission patterns have been misdiagnosed as familial
MS. Adrenomyeloneuropathy, an adult-onset vari-
ant of X-linked adrenoleukodystrophy, can particu-
larly pose diagnostic difficulties. Alexander’s disease
and cerebral autosomal dominant arteriopathy
with subcortical infarcts and leukoencephalopathy
(CADASIL) are other rare disorders with features
imitating MS. The recently described vanishing
white-matter disease only seldom causes confusion
NICP_C03 04/05/2007 12:26PM Page 49
50 BERNADETTE KALMAN ET AL.
with MS. With the recent availability of imaging,
specific molecular genetic and biochemical tests, the
diagnostic dilemma can be easily solved in most of
these disorders (Kalman and Leist, 2004).
Pregnancy and MS
While family planning may profoundly be influenced
by the level of disability in MS patients, the effect of
pregnancy on the disease has also been a matter of
controversy. Korn-Lubetzki et al. (1984) determined
in a large retrospective study that the frequency of
relapses decreased during pregnancy, increased in
the postpartum period, and was similar in the preg-
nancy year (nine months pregnancy plus three
months postpartum) to that of out of pregnancy. The
Pregnancy in Multiple Sclerosis (PRIMS) study was
a large prospective natural history analysis of MS
in pregnant women (Confavreux et al., 1998). This
multicenter study confirmed the significant decline
of relapse rate during pregnancy, most marked in
the third trimester, and the increase of relapse rate
in the first three months postpartum. However,
no acceleration of disability was noted during the
puerperium, and neither breast feeding nor epidural
analgesia had negative effects. In an extension of this
study, patients were followed up to two years post-
partum (Vukusic et al., 2004). This second PRIMS
study added that from the second trimester onwards
and for the following 21 months, the annualized
relapse rate did not significantly differ from that of
the prepregnancy year. Despite the increased risk in
the first three postpartum months, 72% of women
did not have relapses. Increased relapse rate in the
prepregnancy year and during pregnancy and a
higher disability status score at pregnancy onset,
correlated with the postpartum relapses.
3.5 The pathology of MS: A quest for clinical
correlation (William F. Hickey)
Introduction
Merely a decade ago if one were to delve into the
basic pathology of MS, the picture that would emerge
was relatively consistent, but it contained great
variability. The pathognomonic lesions of MS, called
plaques, were chronic inflammatory foci randomly
affecting the white matter of the central nervous
system that resulted in myelin loss and gliosis
(Figs. 3.5 and 3.6). The features of the histological
lesions of MS have long been acknowledged to be
highly variable. They differed with the age of the
lesion and seemed to correlate poorly with the clinical
syndrome exhibited by the patient (Figs. 3.5 and 3.6),
except for the fact that if they were situated in the
CNS at a specific site, they could be correlated with
the resulting neurological deficit. Their histological
Old plaque
with
myelin loss
gliosis and
axonal loss
(late)
B
CDA
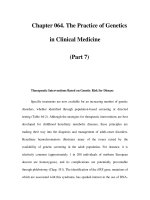
Fig. 3.5 The gross photographs (A) of the parietal
lobes with totally demyelinated, old MS plaques in the
periventricular area on each section. Histological sections
were prepared from the brain slice in the lower right, and
are depicted in B–D. B is a Holzer stain to demonstrate
gliosis that extends well beyond the area of the MS plaque
itself. C is a Bodian stain and D is a Bielshowsky stain which
identify axons. Both demonstrate the near total axonal loss
in the demyelinated zone.
Fig. 3.6 The edge of a typical, actively demyelinating MS
plaque is shown (hematoxylin and eosin (H&E) stain, X125).
The tissue at site “A” is neither inflamed nor demyelinated,
and no loss of oligodendroglia has occurred. At site “B” loss
of myelin and oligodendroglial cells is nearly complete. As
indicated by the arrow, the border of the advancing plaque
is hypercellular and contains large numbers of T cells and
macrophages.
NICP_C03 04/05/2007 12:26PM Page 50
Multiple sclerosis 51
appearance neither helped with prognosis, selection
of therapy nor insight into etiology or pathogenesis.
While there had been steady progress in dissect-
ing the structure of MS plaques using immuno-
histochemical and ultrastructural techniques, the
fundamental links between the microscopic features
of the plaque and questions regarding etiology, patho-
genesis, and prognosis remained opaque (Hickey,
1999; Lassmann, 2005). The various features of the
lesions found in MS were reviewed and analyzed
at an international symposium that inspected the
complexity of MS plaques varying from their im-
munological constituents and types of damage to
the temporal changes in lesional pathology and
clinical correlations (Lassmann et al., 1998). It was
obvious that MS was a highly complex, variable, and
enigmatic problem.
The histopathology of MS has been examined for
nearly a century and a half, but progress in under-
standing the disease has been slow. Pathologists
accept that while there are certain general features of
the MS lesion that could be expected based on a lesion’s
age, inflammatory activity, and the clinical features
of the illness, a reliable and informative classification
system had not evolved . . . if such a system was ever
to prove to be appropriate and useful.
Lucchinetti et al. (1996) for the first time proposed
a classification schema that apparently permitted
MS cases to be characterized and subdivided based
upon specific immunohistochemical features of the
lesions. The concept that the pathogenesis of MS
might fall into a set number of specific patterns, each
representing a distinct immunopathological mech-
anism, was revolutionary.
Pathological subtypes – reality or illusion?
While there have been some minor modifications
in the proposed classification, at this time there are
basically four types of MS lesions that are presumed
to be histologically, immunophenotypically, and
pathogenetically distinct (Lucchinetti et al., 2005).
Type I lesions are those characterized by extensive
infiltration by T cells and macrophages. The plaques
have sharp, distinct edges and the disappearance of
the various molecular components of myelin seems
to occur simultaneously, not in a selective or sequent-
ial manner. In this type of inflammatory focus some
oligodendroglial cells survive the insult and remyeli-
nation (partial or complete) may be possible. Shadow
plaques, areas of incomplete remyelination, can be
associated with type I lesions. In many ways type I
lesions are reminiscent of the pathology found in
EAE, a well-established animal model of MS. If so,
this MS subtype may represent a true autoimmune
attack by T cells against one or more specific myelin
components.
Type II plaques are in many ways similar to the
prior type, but are associated with extensive deposi-
tion of antibodies and the presence of activated com-
plement components, including formation of the
membrane attack complex from the final elements
of the complement cascade. The lesions have sharp
edges and the loss of myelin components occurs
simultaneously. As before, some oligodendroglial
cells are able to survive in the inflammatory foci,
thus remyelination can occur and shadow plaques
are found. This subtype of MS lesion resembles the
pathology of EAE induced by MOG. MOG-induced
EAE is distinct in that it requires not only antigen-
specific T cells, but also the simultaneous presence
of anti-MOG antibodies. Hence, it would seem that
in type II lesions the T cells may be permitting leak-
age of antibodies into the CNS, but it is the binding
of antimyelin antibodies and the activation of the
complement cascade that actually leads to myelin
destruction.
Type III lesions are distinct from the former two.
While there are T cells and macrophages present,
the lesions are irregular and the borders ill-defined.
Moreover, in this subtype there seems to be a prefer-
ential loss of myelin-associated glycoprotein (MAG)
over the other molecular components of compact
myelin; in other words, the molecules making up
compact myelin are lost selectively. Oligodendroglial
cells undergo destruction in what appears to be
an apoptotic fashion, their loss is nearly total and
remyelination does not seem possible. This MS type
is believed to represent a degeneration of oligoden-
drocytes that starts at their most distal processes.
Since at the subcellular level MAG is restricted to
the portions of the oligodendroglial processes in the
periaxonal area, it has been suggested that type III
lesions may represent a “dying-back oligodendro-
gliopathy”. Such an unusual finding may be parallel
to certain features found in hypoxic/ischemic lesions
of the white matter. This has led to the hypothesis
that demyelinating foci in some forms of MS may
represent hypoxia-like tissue injury (Aboul-Enein
et al., 2005). Indeed, it is possible that some form
of small-vessel vasculitis, possibly one mediated
by activated T cells, may underlie this class of MS
damage (Kornek and Lassmann, 2003; Lassmann
et al., 1998).
NICP_C03 04/05/2007 12:26PM Page 51
52 BERNADETTE KALMAN ET AL.
The type IV lesions in MS are a bit more difficult
to discern. Those proposing the classification suggest
that this subtype may represent a distinct disorder
affecting the oligodendroglial cell itself – a so-called
primary oligodendrogliopathy. Histologically, the
plaques have sharp edges, are infiltrated by T cells
and macrophages, and the loss of the various myelin
components appears to occur simultaneously. There
is abundant apoptotic death of oligodendroglia in
the white matter around the edge of the plaque. Yet,
the nature of the problem that leads to oligoden-
droglial death has not been defined. Moreover, this
subtype is rare.
There are some problems with this proposed class-
ification system. These problems are not necessarily
fatal flaws, nor do they reflect negatively on the
proponents who advocate immunophenotypically
categorizing MS lesions. Certainly, few would expect
that an initial classification system based upon a relat-
ively small number of cases would be comprehensive
and never need modification or amendment. It is
most likely that there will be further refinements of
the classification based on yet to be identified para-
meters. Nevertheless, given the proposed classifica-
tion system, the current question is whether it should
be utilized and broadly applied. It is at this point that
we need more data. It is coming, but at this writing,
not yet available.
The aforementioned classification system was
derived from extensive analysis of biopsies from the
brains of patients not previously diagnosed with MS
who presented acutely with a progressive neurolo-
gical disorder. Some argue that this represents a
highly skewed group of patients, even if the majority
(but not all) actually progressed to develop clinical
multiple sclerosis. However, following a further
analysis of a broader group of patients, the cat-
egorization method appears to be sustained (Pittock
et al., 2005).
Another potential difficulty with the classification
system is that it has yet to be replicated and con-
firmed by a group not associated with the system’s
original proponents. Access to MS tissue, the scarcity
of MS brain biopsies, the accurate duplication of the
reagents and methods used by the original authors,
and unfamiliarity with the parameters of analysis
of the tissue employed by the authors of the classi-
fication method, are all impediments that must be
overcome.
One of the major questions concerning the cat-
egorization of MS lesions which still remains to be
resolved is whether MS lesions are homogeneous
and consistent within an individual patient, or if a
spectrum of histopathological types coexists simul-
taneously within one person. There are reports from
experienced MS pathologists stating that various
forms of inflammatory lesions do coexist within indi-
vidual MS patients (Prineas et al., 2001). Also, studies
of some cases of classic relapsing-remitting MS have
shown lesions that do not neatly fit into the above
categories (Barnett and Prineas, 2004). Others have
reported that there is “notable homogeneity within
individual patients” (Morales et al., 2006). The answer
is elusive, but should appear in the next few years. At
present the topic remains a point of much debate.
Another final issue with this categorization method
centers on the extent to which the various histolo-
gical types of lesions correlate with specific clinical
types of MS. It is generally recognized that the
clinical course of MS typically falls into a relapsing-
remitting pattern, or the secondary progressive type;
the primary-progressive form and the so-called
“benign” type are rarer (Lublin, 2005). To date the
correlation of histopathological type with clinical
subtype is weak at best (Pittock et al., 2005); how-
ever, there are ongoing studies that are specifically
designed to address this issue of clinical correlation.
Can prognosis and therapies be directed by the
pathological type? Here there is cause for cautious
optimism. A retrospective study by Keegan et al.
(2005) predicted that patients with type II lesions –
those characterized by extensive antibody and com-
plement deposition – might benefit from therapeutic
plasma exchange. This is what they found. Plasma
exchange did not seem to benefit those with lesion
types I or III, but individuals with type II lesions
experienced moderate to substantial neurological
improvement. Needless to say, if some correspond-
ence between a specific immunohistological pattern
and a predictable clinical syndrome emerges, then
the classification of MS based on the lesions’ histo-
pathological features will be both broadly accepted
and rapidly applied.
Axonal pathology – an unexpected,
unifying feature
From the earliest days of the microscopic study of MS
lesions, it has been known that axons are damaged
in such lesions. But the paper by Trapp et al. (1998)
still caught those who studied MS unawares. What
was so amazing was not that axonal damage existed;
rather it was the extent to which it was present in
MS lesions. Vast numbers of axons were transected
NICP_C03 04/05/2007 12:26PM Page 52
Multiple sclerosis 53
in active MS plaques. Even in inactive or marginally
active plaques, the axon damage continued. Yet, the
most startling observation was that significant axonal
damage was occurring in the normal appearing white
matter, far away from a site of definable inflamma-
tion or demyelination (Bjartmar et al., 2001).
While all who study MS agree that axonal damage
does occur, the puzzle as to whether axonal damage
represents a primary insult versus a secondary
phenomenon is unresolved. The work of Trapp and
colleagues strongly suggests that the axonal patho-
logy is a unique and primary feature of MS (1998).
Axonopathy may be an early feature in MS lesions
(Kornek and Lassmann, 2003). Yet some reports have
questioned this and proposed that axonal damage
occurs in the setting of chronic inflammation and
longstanding disease afflicting the CNS, but is not a
necessary or acute phenomenon (Kutzelnigg et al.,
2005).
The potential causes of axonal degeneration
are manifold. Obviously, the presence of a chronic
inflammatory infiltrate, activated macrophages and
reactive microglial cells, and the elaboration of a
spectrum of cytokines and reactive oxygen meta-
bolites would create an environment conducive to
cell membrane damage (Bjartmar et al., 2000). The
specific offending entities, however, have not yet
been specified. Alternatively, it has recently been
proposed that mitochondrial dysfunction may be the
cause of the axonal damage (Dutta et al., 2006).
Much effort is being expended to dissect this poten-
tially critical aspect of MS lesions.
The great attention currently being paid to this
seemingly isolated feature of the pathology of MS
derives from the fact that many if not all of the
fixed neurological deficits found in longstanding
cases of MS may result from axonal loss rather
than demyelination (Trapp et al., 1999). In cases of
secondary-progressive MS the constant deteriora-
tion of neurological function likewise may be attri-
butable to axonal pathology rather than myelin loss.
In addition, the relentlessly progressive axonal loss
that seems to occur in MS almost certainly provides
the pathological substrate for the extensive atrophy
afflicting all MS patients as they age.
Cortical lesions in MS
The existence of focal lesions in the cerebral cortex
of MS patients was a relatively new observation
(Bo et al., 2003a). These damaged areas do exhibit
gliosis, but are relatively difficult to identify due to
the relative absence of dense myelin in the cortex.
Indeed, subpial demyelination can be an extensive, but
subtle, feature in some cases of MS (Bo et al., 2003b).
While loss of myelin occurs in cortical lesions, there
is remarkably little inflammatory infiltrate (Bo et al.,
2003a). As such, this would suggest that white
matter and cortex operate under different rules
when it comes to inflammatory demyelination.
Perhaps more importantly, this offers the possibility
that lymphocytes might not be essential in produc-
ing damage leading to demyelination, gliosis, and
axonal loss.
Even less certain about these cortical and subpial
lesions is what they mean clinically. Occasional MS
patients exhibit seizures. Are such lesions the cause?
Do they contribute to the unusual affect seen in
some cases of MS? Can they cause motor or sensory
abnormalities? Again, pathological analysis of the
CNS has identified a group of lesions that sporadic-
ally do develop in MS, but the clinical phenomena
attributable to such foci are unknown.
Summary
In the past decade a system for categorizing the
lesions of pathological MS into four discrete subtypes
has been proposed. While it is very attractive, some
question its validity. Currently it is not in universal
use because of the uncertainty regarding its ability to
provide any meaningful correlations with etiology,
clinical course, prognosis, or therapeutic options. At
a deeper level, if the existence of distinct patholo-
gical patterns of MS plaques is verified and can be
employed by pathologists, do these patterns bespeak
different etiologies, different mechanisms, and differ-
ent clinical syndromes? Likewise the conundrum
of whether the CNS lesions are consistently of the
same type within a given patient throughout the
course of the disease must be resolved. The most
elemental and important question regarding MS
that will be answered in the next few years has been
brought into focus by recent and ongoing patholo-
gical analysis of MS tissue. Is MS one disease with
widely varying clinical manifestations, or is it actu-
ally a number of distinct neuroinflammatory diseases
each with its own etiology, pathogenetic mechan-
ism, and prognosis? It is very possible that the protean
disorder called multiple sclerosis represents a final
common pathway for distinct disease entities. With
questions such as this to be resolved the excitement
surrounding the ongoing immunopathological ana-
lysis of MS is not likely to abate soon.
NICP_C03 04/05/2007 12:26PM Page 53
54 BERNADETTE KALMAN ET AL.
3.6 Cerebrospinal fluid (Mark S. Freedman)
The cerebrospinal fluid (CSF) or the brain’s “soup”,
unlike the blood, is in direct contact with brain cells,
hence sampling its contents can give an indication
of what processes may be transpiring in the CNS.
In the case of inflammatory conditions such as MS,
there are abnormalities that reflect activity arising
from within the CNS and help to distinguish them
from those due to inflammation penetrating the
CNS from without. An understanding of just what
the CSF can tell you about inflammatory conditions
that affect the CNS demands some basic knowledge
about CSF as well as the limitations of the tests used
to examine it.
First it should be pointed out that the blood–brain
barrier (BBB) separating the brain from the vascula-
ture is not the same as the blood–CSF barrier (BCB)
that comes between the CSF and the blood. The BBB
tends to be “sealed” by the specialized endothelial
tight junctions seen in the CNS, whereas the BCB
is fenestrated acting as a specialized macrofilter.
Anything that originates in the blood must cross
either barrier by means of diffusion that is facil-
itated either by specialized transporters (e.g. pro-
teins) or by active transport (e.g. glucose). Diffusion
across the BBB is dependent on lipid solubility
whereas more hydrophilic molecules have an easier
passage through the BCB. By measuring the amount
of molecules that are formed outside the CNS, but
found in CSF, it is possible to get some idea of the
“leakiness” of these barriers.
Albumin is the simplest molecule measured; formed
in the liver, any amount found in the CSF had to
have traversed the BCB. It has long been known that
the ratio of CSF/serum albumin is a direct measure-
ment of BCB permeability (Q
alb
) which increases with
age. Using a simple scale, it is possible to estimate
whether permeability is in excess of that expected for
a given age (see Table 3.5).
Conditions that are typically associated with mild
to moderate increase in Q
alb
include neuropathic
processes (e.g. Guillain–Barré), neuroborelliosis or
meningitis. Typically these inflammatory processes
are thought to reduce CSF absorption and therefore
reduce the natural flow of CSF, which leads to con-
centration of albumin within the CSF. This reduced
CSF flow rate would also lead to intra-CSF accumula-
tion of other molecules such as immunoglobulin (Ig).
This is the main reason that any measurement of
intrathecal Igs must take into account some meas-
ure of BCB leakiness to know if the CSF Ig is simply
due to diffusion in from the blood, or is the direct
result of synthesis within the CNS. Numerous math-
ematical formulas have been devised to account for
this leakiness, and one of the simplest to use is known
as the “Link index” (Link and Tibbling, 1977):
Link IgG Index =×
100% (normal range < 70%)
Determining that Ig synthesis had to have arisen
within the CNS is tantamount to saying that there
is an immune process that is taking place locally.
Although this is expected in conditions such as MS,
it is not specific for that disease; rather localized
Ig synthesis is common to any inflammatory CNS
condition that leads to humoral immune responses.
IgG is the commonest Ig to be evaluated, but similar
formulas have been used to assess IgA or IgM, the
latter two being of more importance with respect
to infectious causes. For instance, in Lyme disease
(often considered an important mimic of MS) IgM
prevails over IgA or IgG. Usually the Q
alb
is also
markedly elevated beyond that expected for age
(see Table 3.5) in the case of CNS infectious condi-
tions, whereas in MS, it is typically normal. Though
rarely a concern, as dysfunction of the BCB (indicated
by an increase in Q
alb
) increases, especially due to
conditions outside the CNS such as meningitis, for-
mulas such as the Link index, which are based on a
linear relationship become inaccurate, as the rela-
tionship becomes hyperbolic in function and more
complicated nonlinear formulas are required for
accurately assessing localized Ig synthesis (Reiber
and Peter, 2001). The commonest cause for a local-
ized increase in Ig is infection. However, nonspecific
increases in localized Ig to ubiquitous agents such
as measles, rubella or varicella are common in the
presence of CNS autoimmune-type conditions and
IgG
[CSF]
/Albumin
[CSF]
IgG
[serum]
/Albumin
[serum]
Table 3.5 Increasing values of Q
alb
with age.
Age (range) Q
alb
× 10
−3
<15 5
15–29 6
30–39 7
40–59 8
>60 9
NICP_C03 04/05/2007 12:26PM Page 54
Multiple sclerosis 55
this so-called “MRZ reaction” (measles-rubella-zoster)
typifies the polyspecific nature of Ig activation that
takes place in conditions such as MS (Reiber and
Peter, 2001).
Qualitative analysis of CSF Ig is key to the diagnosis
of conditions such as MS. It is equally important to
insure that this assessment be performed in a qualified
laboratory in a standardized manner (Freedman et al.,
2005). There is a clear consensus as to what consti-
tutes this analysis (Keir and Thompson, 1990) which
is to perform isoelectric focusing (IEF) of Ig on agarose
gels followed by immunoblotting. This technique
separates the Ig present into either distinct “bands”
suggesting either a specific infection or autoimmune
process or into a smear of protein consistent with
a nonspecific increase in Ig. It is imperative that
comparison be made of CSF Ig directly with serum
Ig, as the presence of bands in CSF that are clearly
not in serum is what constitutes the specificity of
the intrathecal response. CSF should be applied to
gels undiluted, whereas serum is usually diluted
empirically 1:400, so as to equate the overall amount
of Ig and minimize overloading in the serum lanes
which can obscure at times the visibility of “bands”.
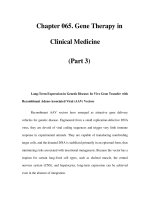
Five patterns of “banding” will emerge using this
methodology (see Fig. 3.7) with types II or III being
indicative of intrathecal synthesis of oligcoclonal
banding. In most cases, the sensitivity of IEF for
detecting oligoclonal bands in MS is >95% (Paolino
et al., 1996). It should raise an alarm therefore, if
clinical suspicion is high that a patient has MS, but
intrathecal synthesis of oligoclonal bands is unde-
tected. This means that more times than not, rather
than the test being “falsely negative,” the absence of
oligoclonal bands usually suggests a diagnosis other
than MS (Zeman et al., 1993).
In considering what the CSF can tell you, it is
important to consider all aspects of CSF analysis:
the cells present (differential or cytology), biochem-
istry (albumin, glucose, or lactate), as well as the Ig.
These features altogether are used to help distin-
guish between causes of systemic inflammation
which spill over into the CNS, such as vasculitis or
chronic infection and intrathecal processes such as
the autoimmune condition MS. It is also therefore
important to draw simultaneously blood for serum
analysis alongside the CSF, as well as to send it for
biochemical studies, such as glucose. Typically 1–4
partially filled tubes of CSF are required and 1–2
tubes of blood for full analysis.
The first tube can sometimes be contaminated
with a few red cells from nicking epidural small
vessels during the lumbar puncture. The cell count
should be performed no later than two hours after
obtaining the CSF, otherwise changes in cell shape
may hamper the ability to offer a correct and full
differential. A red blood cell count that is too high
(5–7 × 10
9
/l) probably indicates too much of a
traumatic tap, rendering other quantitative measure-
ments more difficult to interpret. If a high number of
red cells are noted in the first tube, then the last CSF
tube should also be checked for red cells and if the
number remains as high as the first tube, then often
this is reflective of continued bleeding within the
subarachnoid space such as what might be expected
in a ruptured cerebral aneurysm of arterio–venous
malformation. One only needs 1–2 ml of CSF for cell
counts. White blood cell counts in the CSF are typic-
ally low (normal <5 × 10
6
/l), with any cells present
being of lymphocyte origin. A single neutrophil
seen in a sample free of red cells is cause for concern,
possibly indicating either an infection or severe CNS
injury with necrosis. Higher than normal white
blood cell counts have been found in some 34% of MS
CSF
S
6.5 pH 9.0
CSF
S
CSF
S
CSF
S
CSF
S
Type 1
Type 2
Type 3
Type 4
Type 5
Fig. 3.7 Isoelectric focusing on agarose gels followed by
immunoblotting for IgG. Five classic patterns are known:
type 1, no bands in cerebrospinal fluid (CSF) and serum (S)
sample; type 2, oligoclonal IgG bands in CSF, not in the S
sample, indicative of intrathecal IgG synthesis; type 3,
oligoclonal bands in CSF (like type 2) and additional
identical oligoclonal bands in CSF and the S sample
(like type 4), still indicative of intrathecal IgG synthesis;
type 4, identical oligoclonal bands in CSF and the S sample
illustrative of a systemic not intrathecal immune reaction,
with a leaky or normal or abnormal blood–CSF barrier and
oligoclonal bands passively transferred in the CSF; and
type 5, monoclonal bands in CSF and the S sample; this
is the pattern seen owing to the presence of a paraprotein
(monoclonal IgG component). Courtesy of H. Reiber.
NICP_C03 04/05/2007 12:26PM Page 55
56 BERNADETTE KALMAN ET AL.
cases (Tourtellotte, 1970), however, very high counts
(>50 × 10
6
/l) are most unusual in MS. In some cases,
the presence of unusual looking cells should prompt
a full review of cytopathology to exclude the possibil-
ity of neoplasia or to look for inclusions that might
occur in certain types of chronic infections such as
toxoplasmosis. In some cases where a high white
count is due to lymphocytes, a full tube of 7–10 ml
CSF should be drawn and sent for a cytospin and stain-
ing with cell markers in order to know for instance
if the lymphocytes are all B cells, strongly suggesting
a diagnosis of lymphoma, or T cells, more reflective
of either infection or chronic inflammation.
For biochemical studies such as glucose, lactate,
or angiotensin-converting enzyme (ACE) 3–4 ml of
CSF will usually suffice. Low CSF glucose (when com-
pared to serum, CSF/serum ratio <0.4) and very high
total protein content (e.g. >1 g/l) is more consistent
with an infectious or neoplastic process. Lactate, where
available, is a good substitute and has an advant-
age over paired CSF–plasma glucose measurements
in that only a single CSF measurement is required
(Nelson et al., 1986).
If infectious causes are considered, then a separate
sterile tube for Gram stain and microbial or fungal
cultures is required. Special requests should be made
in cases of chronic meningitis to look for “acid-fast
bacillus” and special cultures requested if tuberculosis
is suspected. In all cases, if a specific pathogen is
suspected, most times specific antigen testing is
available. Regardless, a tube of 3–4 ml of CSF is all
that is required for all these analyses.
Overall, CSF can be very informative in most cases
of suspected CNS disease. A normal CSF in suspected
cases of MS or other possible CNS autoimmune ent-
ities is often reassuring and indicates that these dia-
gnoses are less likely. A typical CSF picture of specific
oligoclonal bands in a patient suspected of MS but
who has a MRI that is either normal or shows non-
specific lesions and in whom infection has been ruled
out would almost certainly turn out to have MS. On
the other hand, the finding of a very high protein, a
leaky BCB, or a high cell count in someone who clin-
ically is highly suspected of having MS should raise
concern that a different diagnosis is being missed.
A lumbar puncture to obtain CSF along with some
serum is a minor procedure with high yields in terms
of reassurance of not missing more treatable condi-
tions such as infections, and can help to reinforce
clinical certainty of a diagnosis of MS, when clinical
presentation is somewhat vague or MRI results are
nonspecific.
3.7 Magnetic resonance imaging
characteristics of MS (Jennifer L. Cox
and Robert Zivadinov)
Introduction
MS is an inflammatory disease of the CNS character-
ized by demyelinating lesions and axonal loss. The
immunopathogenic mechanisms underlying disease
initiation and disease course are unknown. Current
diagnostic criteria (McDonald et al., 2001; Polman
et al., 2005) suggest MRI is the most sensitive and
specific of the radiological and laboratory tools used
to aid in the diagnosis of MS. Although MS could be
diagnosed without MRI by waiting for clinical evid-
ence of a second attack, it is strongly recommended
that MRI be used when available to demonstrate dis-
semination of lesions in space and time. In addition
to its diagnostic usefulness, MRI is routinely used to
monitor the course of MS disease over time.
Although conventional MRI scans such as T2-
weighted images (WI) and gadolinium (Gd)-enhanced
T1-weighted scans have long been used for clinical
diagnosis and monitoring of MS, they cannot dis-
tinguish between inflammation, edema, demyelina-
tion, Wallerian degeneration, and axonal loss. In
addition, they do not exhibit a reliable correlation
with clinical measures of disability. Some patients
have multiple hyperintense lesions on T2-weighted
images, yet show few clinical symptoms of MS, while
other patients with few hyperintense lesions may
have a marked clinical presentation. The lack of a
strong correlation between the presence of lesions
observed with conventional MRI and clinical symp-
toms is often referred to as the “clinical–MRI paradox”
(Barkhof, 2002; Zivadinov and Leist, 2005). Further-
more, there is increasing evidence that pathological
changes in MS can be found in both cortical and
subcortical gray-matter structures, yet conventional
MRI scans are not able to detect these gray-matter
changes. In recent years, the use of nonconventional
MRI sequences as well as advanced analysis methods
of conventional sequences have allowed the capture
of a more global picture of the range of tissue altera-
tions caused by inflammation and neurodegenera-
tion. Newer, nonconventional metrics of MRI analysis
include measurement of hypointense lesions on
T1-weighted imaging (T1-WI), central nervous sys-
tem atrophy, magnetization transfer imaging (MTI),
magnetic resonance spectroscopy (MRS), diffusion
tensor imaging (DTI), high-field MRI, and functional
MRI (fMRI).
NICP_C03 04/05/2007 12:26PM Page 56
Multiple sclerosis 57
When compared to conventional imaging, non-
conventional MRI techniques appear to be better
surrogate markers for monitoring the destructive
pathological processes related to disease activity and
clinical progression. The nonconventional techniques
can reveal the underlying substrate of intrinsic patho-
logy within lesions and normal appearing brain tissue
(NABT) that include edema, inflammation, demyelina-
tion, axonal loss, and neurodegeneration (Bakshi et al.,
2005; Zivadinov and Bakshi, 2004c). Due to their
ability to detect the neurodegenerative aspects of
MS, including recent evidence for cortical demye-
lination (Geurts et al., 2005), these techniques are
receiving increased attention as clinically relevant
markers of disease progression. This section will dis-
cuss both conventional and nonconventional MRI
techniques and their role in detecting inflammation
and neurodegeneration in MS lesions and NABT.
Role of conventional MRI in MS
T2-weighted imaging is highly sensitive in detection
of hyperintense lesions in the white matter (WM)
and, less commonly, the gray matter (GM). The most
typical sites for lesions are in the WM: periventri-
cular region, corpus callosum, posterior fossa, and
cortical regions (Fig. 3.8). Several MRI sequences are
capable of identifying T2 hyperintense lesions; those
preferred most often are conventional spin echo, fast
spin echo, and fluid-attenuated inversion recovery
(FLAIR) (Zivadinov and Bakshi, 2004c). FLAIR pro-
vides improved detection over T2-weighted imaging
in the evaluation of periventricular and cortical/
juxtacortical lesions, as CSF may mask the visualiza-
tion of these plaques on T2-WI (Bakshi et al., 2005;
Zivadinov and Bakshi, 2004c). Continuous technical
improvements in MRI hardware and software over
the last decade have led to the development of more
efficient and sensitive pulse sequences. Among them,
turbo or fast spin-echo (TSE or FSE) and fast-FLAIR
have already demonstrated their usefulness in a
wide variety of neurological diseases, including MS
(Simon et al., 2006; Zivadinov and Bakshi, 2004c).
FSE has shown greater sensitivity than conventional
spin-echo in detecting areas of T2 prolongation in
MS. On the other hand, fast-FLAIR sequences have
emerged as especially helpful in evaluating periven-
tricular and cortical/juxtacortical lesions where CSF
signal may mask these plaques on T2-WI (Zivadinov
and Bakshi, 2004c). Moreover, double-inversion
recovery (DIR) imaging has recently shown a further
increase over FLAIR in the ability to detect cortical
lesions as well as provide better contrast between GM
and WM (Geurts et al., 2005). Due to fat suppression,
areas of T2 prolongation can also be detected using
short tau inversion recovery (STIR) sequences and,
in certain scanning platforms, this sequence may be
superior to T2-WI in detecting spinal cord lesions
in MS (Campi et al., 2000). An added advantage
to using STIR when imaging the optic nerves is
increased contrast between lesions and the sur-
rounding retrobulbar fat (Moseley et al., 1998).
Recently the Consortium of Multiple Sclerosis
Centers (CMSC) proposed MRI consensus guidelines
for imaging of the brain and spinal cord in patients
with MS (Simon et al., 2006). Recommended for
imaging of the brain were sagittal and axial fast
spin-echo fluid-attenuated inversion recovery (fast-
FLAIR), axial FSE with proton density (PD) and T2-
weighting, and post-Gd-enhanced T1 sequences. An
axial T1-weighted pre-Gd scan and T1-weighted 3D
volume scan were suggested as optional series to
include. Recommended for imaging of the spinal cord
were sagittal and axial FSE PD-T2 and Gd-enhanced
T1 sequences, with a 3D volume scan as optional.
ab
cd
Fig. 3.8 Axial T2-weighted FLAIR image from a
26-year-old female with relapsing-remitting MS showing
periventricular (a) cortical, (b) pericallosal (Dawson’s
fingers), (c) hyperintense white-matter lesions. (d) Axial
T2-weighted FLAIR image from a 25-year-old male with
secondary-progressive MS showing hyperintense white
matter lesions in the cerebellum and pons.
NICP_C03 04/05/2007 12:26PM Page 57
58 BERNADETTE KALMAN ET AL.
Similar guidelines have also been provided in Europe
by the European Federation of Neurological Science
Task Force (Filippi et al., 2006).
Despite the sensitivity of T2-WI to reveal disease
activity and lesions over time (Paty and Li, 1993),
there is only modest correlation between MRI findings
and clinical evolution, except in subjects with very
early disease (Rudick et al., 2006a; Sailer et al., 1999;
Zivadinov et al., 2001b). Several long-term studies
have examined the correlation of disability pro-
gression and the accumulation of T2-lesion burden.
One of the longest MRI studies followed patients
with clinically isolated syndrome for up to 14 years
(Brex et al., 2002). After five years of follow up, data
showed that T2-lesion volume accumulation pre-
dicted 25% of the correlation variance in disability,
but at 10 years it was down to 16%, and at 14 years,
it explained only about 10–12% of the variance.
Evidence is increasing that diffuse, and particularly
central, brain atrophy as a characteristic of mid-to-
late stage MS may influence this relationship. It is
possible that T2-lesion volume may be “artificially”
lowered by the loss of lesions along with normal
appearing tissue. A decrease in the relationship be-
tween T2-lesion volume and disability in advanced
disease stages cautions against the assumptions that
T2-lesion volume progression is a function of disease
duration alone and that stabilizing T2-lesion volume
indicates a reduction in disease activity (Dwyer et al.,
2005; Li et al., 2006).
Despite the previously mentioned limits, several
strategies for increasing the sensitivity of T2-WI
have become available in the last few years. Recent
consensus guidelines recommend a ≤3 mm slice
thickness on 2D and ≥1.5 mm on 3D acquisition
sequences for the evaluation of disease burden in MS
patients scanned in clinical routine practice (Simon
et al., 2006). Thinner slices provide increased lesion
detection and higher measurement consistency.
Recent consensus guidelines also recommend that
any scanner used in clinical routine practice should
operate at a field strength higher than 1.0T. With
the introduction of 3T MRI systems into clinical
practice, several questions arise, including the com-
parison of 3T versus 1.5T. It has been previously
demonstrated that scanner field strength has a sub-
stantial impact on the measured T2 lesion volume
(LV), being about 25–40% higher with standard
3T magnets than for lower field scanners (Erskine
et al., 2005; Keiper et al., 1998; Sicotte et al., 2003).
Higher-field MRI increases specificity in the correla-
tion between detected lesions and clinical disability.
Gadolinium enhancement
Gd-enhancement in MS lesions has been connected
with histopathological findings of the blood–brain
barrier breakdown and active inflammation (Filippi,
2000). Gd-enhancing lesions on T1-WI usually cor-
respond to areas of high signal intensity on T2-WI
and low signal intensity on unenhanced T1-WI, prob-
ably due to edema and demyelination associated with
these lesions (Fig. 3.9) (Zivadinov and Bakshi, 2004c).
A transient phenomenon in MS, Gd-enhancement is
usually detectable for an average of 3–6 weeks, and
typically precedes or accompanies the appearance
of a majority of new lesions found on T2-WI in MS
patients. Most of the enhancing plaques are not asso-
ciated with the presentation of clinical symptoms
and do not correlate with clinical status in cross-
sectional, and especially longitudinal, studies in the
mid and long term (Kappos et al., 1999; Zivadinov
and Leist, 2005). This discrepancy supports the con-
cept that varied factors operate in the occurrence of
relapses in MS as well as the development of long-
term sustained disability. Nevertheless, the presence
of continuing enhancement indicates a higher risk
of relapses over the short-to-intermediate term and
may contribute to long-term clinical dysfunction
(Filippi, 2000; Zivadinov and Bakshi, 2004c).
Several strategies have been proposed to increase
the sensitivity of Gd-enhanced MRI for the detection
of active MS lesions. One analysis strategy examines
the pattern of Gd-enhanced lesions and their relation-
ship to lesions found on other MRI sequences. Deter-
mination of an enhancement pattern may indicate
differences in the histopathology of MS plaques. Con-
centric ring-enhancing lesions with central contrast
pallor arise in previously damaged areas or in areas
of accelerated local inflammation (Zivadinov and Leist,
2005). When compared with homogeneously enhanc-
ing plaques, ring-enhancing lesions are larger, have
a shorter duration of enhancement, lower apparent
diffusion coefficient (ADC) and magnetization transfer
ratio (MTR) (Minneboo et al., 2005; Morgen et al.,
2001). It has also been shown that ring-enhancing
lesions are strong predictors for the development
of persisting hypointense lesions on T1-W1 and
brain atrophy (Bagnato et al., 2003; Minneboo et al.,
2005; Zivadinov et al., 2004). Thus, the appearance
of ring-enhancing plaques on Gd-enhanced MRI
may not only be characteristic of a more aggressive
form of MS but also predictive of long-term deteri-
oration. Other strategies that maximize the amount
of information that can be obtained through Gd
NICP_C03 04/05/2007 12:26PM Page 58
Multiple sclerosis 59
enhancement include frequent serial monthly scan-
ning, scanning the spinal cord as well as the brain,
a delay of five minutes or more between Gd injec-
tion and scanning, using doses of higher contrast
(e.g., a double or triple dose instead of a standard
0.1 mmol/kg dose), acquiring thinner tomographic
slices, co-registration, reducing the background
signal by the application of MTI pulses to T1-WI and,
finally, use of high-field strength scanners (Filippi,
2000; Zivadinov and Bakshi, 2004c).
Role of nonconventional MRI in MS
Three-dimensional T1-weighted high
resolution imaging
The CMSC MRI guidelines suggest the option of
collecting high resolution (1 mm × 1 mm × 1.5 mm
voxel size) 3D T1 scans. Although high-quality 3D T1
scans may take longer to acquire than 2D sequences,
they are valuable for many advanced measures of
neurodegeneration in MS, including evaluation of
cross-sectional and longitudinal GM, WM, and CSF
volumes estimates, anatomically defined region of
interest analyses, and voxel-based morphometry.
Mounting evidence supports the idea that brain
atrophy is an important biomarker of the disease
process in MS (Fig. 3.10) (Bermel and Bakshi, 2006;
Miller et al., 2002; Zivadinov and Bakshi, 2004a;
Zivadinov and Bakshi, 2004b; Zivadinov and Bakshi,
2004d). Several studies emphasize the usefulness of
MRI in assessing CNS atrophy and its relationship to
long-term neurodegeneration and disability progres-
sion (Fisher et al., 2002; Zivadinov et al., 2001a).
It has also been established that CNS atrophy is a
moderate but significant predictor of neurological
ab c
de f
Fig. 3.9 Comparison of images from a 25-year-old male with secondary-progressive MS (a, b, c) showing homogeneously
enhancing lesions (a) and from a 29-year-old female with relapsing-remitting MS (d, e, f ) showing ring-enhancing lesions (d).
(a) and (d): Single dose (0.1 mmol/kg) gadolinium postcontrast axial T1-weighted images. (b) and (e): Axial T1-weighted images
(precontrast). (c) and (f ): Axial T2-weighted images.
NICP_C03 04/05/2007 12:26PM Page 59
60 BERNADETTE KALMAN ET AL.
impairment (Zivadinov and Bakshi, 2004a; Zivadinov
and Bakshi, 2004b; Zivadinov and Bakshi, 2004d).
The association between atrophy and disability is
independent of the effect of conventional MRI lesions.
Studies suggest that CNS atrophy begins in patients
with CIS even before the first clinical symptoms,
especially in those at high risk for MS. The estimated
percentage change of brain atrophy varies across
studies in CIS but is estimated to be 0.8% per year
(Zivadinov and Bakshi, 2004a). Natural history and
therapeutic studies of patients treated with placebo
suggest that CNS atrophy is common in patients with
RR-MS, even in the earliest stages of the disease. The
estimated annual rate of whole-brain atrophy varies
across studies but is slightly higher in patients with
early RR-MS (range, −0.7% to 1.33%) than in those
with advanced RR-MS (range, −0.61% to 1.2%)
(Zivadinov and Bakshi, 2004b). Patients with PP-
MS have a slightly higher annual rate of ventricular
enlargement (range, −2.4% to +7.7%) than patients
with SP-MS; however, this rate is lower than the rate
in patients with RR-MS (range, +2.1% to +29.8%).
On the other hand, spinal cord atrophy also develops
at a faster rate than brain atrophy in patients with
PP-MS (Zivadinov and Bakshi, 2004a; Zivadinov
and Bakshi, 2004b).
Although initial reports indicated that brain
atrophy in MS was primarily due to decreases in WM
(Ge et al., 2000), several more recent reports have
noted diffuse GM atrophy in the brains of patients
with MS (Benedict et al., 2006; Bermel et al., 2003;
Chen et al., 2004; Dalton et al., 2004; Fabiano et al.,
2003; Valsasina et al., 2005; Zivadinov et al., 2006).
These findings suggest that the disease process
in MS is not limited to WM and that including GM
atrophy in the assessment of patients with MS may
further improve the usefulness of MRI measure-
ments. Preliminary data from several short- and
long-term studies suggest that GM atrophy develops
at a much faster rate than WM or whole-brain
atrophy (Dalton et al., 2004; Valsasina et al., 2005).
However, it is not clear whether GM atrophy is a
result of the disease process in MS or is secondary to
WM atrophy.
Recently, our research team used an approach based
on regional segmentation called semiautomatic brain
region extraction, or SABRE, to detect predilection
for brain atrophy development on a region-by-region
basis (Carone et al., 2006a). The study compared 66
MS patients and 40 normal controls and found that
the regions most affected in the brain were deep
gray-matter structures including the posterior basal
ganglia and the thalamic regions, as well as the cor-
tical regions in the orbital frontal, superior parietal,
superior frontal, and medial superior frontal regions.
Similarly, reduced thalamic GM volume in patients
with MS was the primary finding in a voxel-based
morphometry study of CIS patients (Cox et al., 2006).
Taken together, these studies suggest that there is a
regional specificity for brain atrophy development,
prevalent mostly in GM structures, in areas of the
brain that do not usually show WM lesions.
Wallerian degeneration and independent neuronal
degeneration are proposed mechanisms for GM
atrophy in MS. We recently investigated partial
correlations between T2 and T1 regional lesion
volumes and regional/total GM atrophy in 110 MS
patients (Carone, 2006b). After controlling for total
GM atrophy, partial correlations between regional
lesion volume and regional GM atrophy were not
significant for any of the 26 investigated regions.
Results suggest that a distinct generalized disease
Fig. 3.10 Axial view of 3D-SPGR image (a) from a 29-year-old female with relapsing-remitting MS. An automated, cross-
sectional method (structural image evaluation including normalization of atropy, SIENAX) method was applied to the image to
generate separate images of gray matter (b), white matter (c), cerebral spinal fluid (d), and segmented image (e).
NICP_C03 04/05/2007 12:26PM Page 60
Multiple sclerosis 61
process better accounts for GM atrophy than region-
ally distinct Wallerian degeneration.
Furthermore, it is not clear whether GM atrophy
contributes to neurological impairment in MS because
several reports have failed to find an association
between GM loss and neurological impairment
(Dalton et al., 2004; Ge et al., 2000; Sastre-Garriga
et al., 2005). On the other hand, other studies have
found a significant association between GM loss and
impairment, in both RR-MS and PP-MS (Chen et al.,
2004; Sanfilipo et al., 2005).
Magnetization transfer imaging, MTI
MTI is an advanced MRI technique that has been
widely used to evaluate characteristics and evolu-
tion of MS lesions and NABT. It is based on the inter-
actions and exchange between two types of protons:
those that are unbound in a free water pool and those
where motion is restricted due to binding with macro-
molecules (Filippi and Rocca, 2004). MT contrast is
achieved by applying radio frequency (RF) power
only to the proton magnetization of the macro-
molecules. Tissue damage in MS is usually reflected
by a reduction in this exchange of protons and thus
a decrease in MTR. Decreases in MTR indicate a
reduced capacity of free water to exchange magnet-
ization with the neighboring brain tissue matrix
and are not specific to MS pathological substrates.
Although MTR decreases are not specific to any of the
various MS pathological substrates, a relationship
has been shown between MTR and the percentage
of residual axons and the degree of demyelination
(van Buchem et al., 1997). The most compelling
evidence in support of this hypothesis comes from a
postmortem study that shows a strong correlation
between MTR values from MS lesions and NABT
with the percentage of residual axons and the degree
of demyelination (Schmierer et al., 2004).
MTI can be used to assess tissue injury in lesions,
in the whole brain and in specific brain structures
(Filippi and Rocca, 2004; Sharma, 2006; Zivadinov
et al., 2001a). MTI studies have demonstrated two
possible evolution paths for new MS lesions: (i) in
some lesions, a moderate decrease in MTR with
subsequent complete recovery of MTR within a
few weeks may reflect edema, demyelination, and
subsequent remyelination (Filippi and Rocca, 2004);
(ii) in other lesions, a marked reduction of MTR with
only partial recovery at follow up (Dousset et al.,
1998). Different MTI studies have revealed clinic-
ally relevant pathological changes in areas of WM
and GM that appear normal on conventional images.
Such changes in normal appearing white matter
(NAWM) and normal appearing gray matter (NAGM)
occur early in the disease process and provide pro-
gnostic information pertaining to the risk of MS
progression (Filippi et al., 2000; Laule et al., 2003).
MTI metrics have been correlated with the degree
of disability (Rovaris et al., 2003). In general, modest-
to-strong correlation was found between baseline
MTR and subsequent change in the EDSS disabil-
ity score. These data support the idea that early
MTR abnormalities in NABT can predict the clinical
evolution of MS.
Magnetic resonance spectroscopy, MRS
MRS offers the potential to investigate tissue structure,
metabolism, and function. Information about the bio-
chemistry of selected brain tissue volumes provides
potential surrogate markers for the pathology under-
lying MS (Narayana, 2005). MRS imaging allows
for the quantitative assessment of inflammation,
demyelination, axonal and neuronal injury pro-
cesses in MS (Tartaglia and Arnold, 2006). The
N-acetylaspartate (NAA) peak in an MR spectrum is
a putative marker of neuronal and axonal integrity,
and axonal and neuronal injury can be quantified
through decreases in NAA. The choline peak appears
to reflect cell-membrane metabolism (Narayana,
2005). An elevated choline peak represents height-
ened cell-membrane turnover, as seen in demyelina-
tion, remyelination, inflammation, or gliosis. MRS
further provides unique information regarding not
only structural, but also metabolic changes in the
CNS. Other metabolic peaks of interest in the study
of MS include the glutamate/glutamine peak and
myoinositol peak. The glutamate/glutamine peak
represents a mixture of amino acids and bioamines
used throughout the CNS as excitatory and inhibit-
ory neurotransmitters (Srinivasan et al., 2005). The
myoinositol peak represents a sugar-like molecule
thought to be a marker of glial proliferation and now
recognized for its importance in osmotic regulation
of brain tissue volume (Narayanan et al., 2006).
Recent MRS studies have shown that neurodegen-
erative changes may be detected in cortical lesions
and deep GM tissue (Geurts et al., 2006; Inglese et al.,
2004). Correlations between disability and decreased
NAA–creatine (NAA–Cr) ratio were found in several
studies, suggesting that MRS measures of brain
metabolites are better predictors of clinical disability
than conventional MRI.
NICP_C03 04/05/2007 12:26PM Page 61
62 BERNADETTE KALMAN ET AL.
Diffusion imaging
DWI (diffusion weighted imaging) and DTI (diffusion
tensor imaging) are unique MRI techniques based on
the diffusional motion of water molecules, and thus
provide an indirect measure of tissue orientation, size,
and geometry (Rovaris et al., 2005b). The mobility
of water molecules is reduced in highly organized
tissue like WM and GM due to interactions with
cellular and tissue structures. In the CNS, diffusion
is influenced by the microstructural components of
tissue, including cell membranes and organelles and,
as a result, the ADC is lower in those tissues than
in pure water. Furthermore, ADC values depend on
the orientation of the tissue relative to the measure-
ment. Thus, conventionally, the average ADC is cal-
culated from three (DWI) or more (DTI) orthogonal
directions that provide information on the overall
diffusivity in the tissue.
Pathological processes that modify tissue organ-
ization can cause abnormal water motion, thereby
altering ADC values. In MS, the two main patholo-
gical processes that affect the brain are demyelina-
tion and neurodegeneration, both of which can alter
the geometry of brain tissue orientation, resulting in
an increase of water diffusivity measurable with dif-
ferent DWI and DTI indices. These measures include
mean diffusivity (MD), fractional anisotropy (FA), and
entropy. FA is an indirect measure of tissue integrity.
In healthy WM, the diffusional movement of water
molecules is restricted by the myelin sheath and axon,
thus water molecules in healthy WM tend to move
along the long axis of the axons. High FA values are
associated with healthy WM, whereas low FA values
are indicative of a disruption in the microstructural
integrity of WM. Changes in FA could be caused
by various factors, including demyelination and
inflammation.
Several DWI-DTI studies have demonstrated
abnormal MD or FA values in MS lesions (Werring
et al., 2000) that differ between Gd-enhancing vs.
nonenhancing lesions. Some studies reported lower
MD in Gd-enhancing lesions when compared with
nonenhancing lesions (Roychowdhury et al., 2000),
whereas others did not observe significant differ-
ences (Cercignani et al., 2001). Conversely, the FA
studies showed a consistent decrease of FA in Gd-
enhancing lesions, compared to nonenhancing lesions
(Werring et al., 1999). Most of the studies have
shown higher MD and lower FA values in lesions
than in areas of NAWM, the most abnormal being
in the hypointense T1 lesions (Filippi et al., 2001;
Rovaris et al., 2005b; Werring et al., 1999). Numer-
ous diffusion MRI studies have consistently shown
increased diffusivity and reduced anisotropy in the
NAWM and NAGM of MS patients when compared
to normal controls (Rovaris et al., 2005b).
Significant cross-sectional correlations between
DWI and DTI and clinical findings have been estab-
lished (Cercignani et al., 2001), indicating that the
disease process does not spare either the NAWM
or the NAGM (Fabiano et al., 2003; Rovaris et al.,
2005a). Diffusion studies have confirmed that the
severity of damage within T2-visible lesions and
in the NAGM, as well as in clinically eloquent WM
regions, might have a significant impact on MS
patients’ neurological disability.
Functional MRI, fMRI
fMRI is an indirect measure of blood flow and neur-
onal activity based on changes in the local magnetic
field (T2*). When neurons are active there is an
increase in blood flow to the region, which increases
the amount of oxygenated hemoglobin in the capillary
beds. The amount of oxygen delivered by the hemo-
dynamic response to neuronal activity exceeds the
amount required by the tissue, thus increasing the
ratio of oxygenated to deoxygenated hemoglobin in
the venous beds compared to the resting state. At rest,
deoxygenated hemoglobin causes a slight disturbance
in the local magnetic field, which is attenuated by
increased presence of diamagnetic oxygenated hemo-
globin during neuronal activity, thereby causing a
longer T2* and increased signal intensity. The signal
change is very small (1–10%), but is reliably meas-
ured by subtracting images collected at rest from
images collected during activity.
Unlike the other measures discussed above, fMRI
is not yet used clinically for diagnosis or monitoring
of the disease. Rather it has been used in research
settings to examine the neural correlates of known
motor and neuropsychological deficits in patients
with MS. The most commonly used paradigms assess
motor ability, processing speed, and working memory.
Several studies have found that patients with MS
show increased bilateral frontal activation during
working memory tasks as compared to healthy con-
trols who show unilateral activation when complet-
ing the same task (Pantano et al., 2006). It has been
suggested that increased activation in patients with
MS is a compensatory mechanism.
The relationship between motor disability and
functional activation was examined in a serial fMRI
NICP_C03 04/05/2007 12:26PM Page 62
Multiple sclerosis 63
study (Reddy et al., 2000). In this case study, a patient
with MS showed an initial increase in sensorimotor
activation on fMRI three weeks after onset of a right
hemiplegia. Structural MRI revealed four large
confluent lesions in the left hemisphere. fMRI scans
completed at six weeks and 24 weeks after presen-
tation showed reduced bilateral activation despite
maintained motor performance. These findings
suggest that dynamic cortical adaptation occurs in
response to disease relapse (Reddy et al., 2000).
fMRI has also been used to demonstrate functional
changes in connectivity even at the earliest stages of
the disease. Decreased functional connectivity between
frontal and anterior cingulate regions was found
during a working memory task, paced auditory serial
addition task (PASAT), in patients with CIS compared
to controls (Audoin et al., 2006). Decreased functional
connectivity was correlated with T2-lesion load and
MTR results in the same study. Indeed, with the
heterogeneous lesion load and lesion pattern in MS,
it will be important to combine fMRI data with many
of the nonconventional measures discussed here.
Conclusions
Nonconventional MRI scans and analysis methods
such as hypointense lesions on T1-WI (“black holes”),
MTI, DWI and DTI, MRS, fMRI and high-field MRI
are emerging as promising tools for improving our
understanding of the pathophysiology of MS. By con-
sidering information from multiple neuroimaging
methods and analyses, we will gain a better under-
standing of the relationship between MRI findings
and clinical symptoms and disease course. The
“clinical–MRI paradox” will not remain such a mystery
as we look beyond conventional MRI measures.
3.8 Treatment of MS (Sean Pittock)
Introduction
Advances have been made in the development of
partially effective disease-modifying parenteral ther-
apies for MS in the past decade. These advances
have primarily been realized in the management of
relapsing remitting MS. This section will focus on the
management of the acute MS relapse, the current
FDA-approved disease-modifying agents (DMAs),
their associated complications and symptomatic
management of MS complications. In addition,
evolving therapies and current controversies in MS
management will be discussed.
Treatment of the acute relapse
Corticosteroid therapy
The natural history of most acute relapses is spon-
taneous resolution with the majority of patients
making full to near-full recovery. However, some
attacks can be disabling with motor weakness, diplopia,
ataxia, or pain. Early treatment with corticosteroids
will accelerate recovery from these acute attacks. The
debate continues as to the most efficacious type, dose,
and route of administration of corticosteroid. A meta-
analysis found no difference in EDSS improvement
between high-dose and low-dose methylprednisolone
regimens (Miller et al., 2000). Most neurologists use
high-dose intravenous methylprednisolone (1 g per
day) for a short period (usually 3–5 days).
Not all patients with an acute relapse should be
treated with corticosteroids. A patient with a mild,
nondebilitating relapse should be allowed to recover
with rest and avoidance of physical and mental stress.
In the assessment of an MS patient with new or
worsening symptoms, it is important to consider the
possibility of pseudoexacerbation or pseudorelapse
(a clinical worsening associated with fever, often in
the setting of a urinary tract infection), which are
not new “attacks” and should not be treated with
immunosuppression but with appropriate antibiotic
treatment or fever-reducing therapy. In addition,
patients may have difficulty in differentiating minor
fluctuations in their baseline function from those of
a true clinical relapse.
Plasmapheresis
Patients with acute, severe disabling attacks who do
not respond to steroid therapy are considered steroid
resistant. Plasmapheresis should be considered the
next step for such patients. In 1993, plasmapheresis
was first reported (Rodriguez et al., 1993) to benefit
patients with steroid-resistant, devastating, acute
relapses (either paraplegia or quadriplegia) occur-
ring within days for some patients. Subsequently,
a randomized double-blind and sham plasmaphere-
sis control study was done in patients with steroid-
resistant devastating relapses. This study showed
convincing benefit though the study size was limited
(Weinshenker et al., 1999). Five of 11 patients who
received plasmapheresis demonstrated moderate
or marked improvement within days of treatment.
In addition, three of eight patients who had failed
the sham treatment subsequently had moderate or
NICP_C03 04/05/2007 12:26PM Page 63
64 BERNADETTE KALMAN ET AL.
marked improvement when switched to plasma-
pheresis. Overall, there was a 42% improvement in
the plasmapheresis group as compared to the 6%
improvement in the sham treatment group.
Other medication therapies
There have been disappointing results from studies
on the use of monoclonal antibody therapy in acute
relapses. A randomized study of the humanized anti-
CD11/CD18 monoclonal antibody, HU23F2G, in
169 patients with acute relapse failed to show benefit
from use of the drug versus placebo (Lublin and the
Hu 23F2G MS Study Group 1999). Natalizumab,
humanized anti-alpha 4 integrin monoclonal anti-
body recently licensed for use in relapsing-remitting
MS, did not reveal any benefit over placebo in terms
of clinical improvement when given within 2–4 days
of acute relapse (O’Connor et al., 2004). Random-
ized studies investigating the use of intravenous
immunoglobulin (IVIg) administered with or before
intravenous methylprednisolone in patients with
acute relapses in MS have been disappointing. These
studies were of limited size and larger drug trials are
warranted. There are also reports of response to
IVIg, methylprednisolone, or plasmapheresis with
other inflammatory demyelinating conditions such
as acute disseminating encephalomyelitis, neuro-
myelitis optica, and tumefactive (Marburg’s or Balo’s)
forms of MS.
Disease-modifying agents
Since the mid-1990s, large randomized clinical
trials have shown that DMAs reduce the number
and severity of relapses as well as the number of
lesions appearing on MRI. This has resulted in FDA
approval of a number of DMAs for use in MS. Current
drugs approved for long-term use by the FDA for
MS include: (i) three beta interferon preparations
(Avonex, Betaseron and Rebif ); (ii) glatiramer acetate
(Copaxone); (iii) mitoxantrone (Novantrone); and
(iv) the monoclonal antibody natalizumab (Tysabri).
The Medical Advisory Board of the National MS
Society recommends initiation of a DMA as soon as
possible following a definite diagnosis of relapsing
remitting MS and in selected patients with a first
attack who are at high risk for MS (clinically isolated
syndrome, CIS). The Therapeutics and Technology
Assessment Committee of the American Academy of
Neurology and the MS Council of Clinical Practice
Guidelines also suggest that it is appropriate to
consider treatment with approved therapy in these
patients.
Beta interferon therapies (Avonex, Betaseron, Rebif )
Beta interferon (IFNβ) exerts its effect through a
variety of mechanisms. These include actions that
(i) inhibit T-cell costimulation and/or activation
processes; (ii) modulate anti-inflammatory and
proinflammatory cytokines; (iii) inhibit interferon
gamma-induced class-II expression; (iv) inhibit anti-
gen presentation; and (v) decrease aberrant T-cell
migration. IFNβ are administered either by sub-
cutaneous injection (Betaseron and Rebif ) or by
intramuscular injection (Avonex).
The IFNβ drugs have demonstrated efficacy in
relapsing-remitting MS with reduction in relapse
rate by approximately one-third and reduction in the
accumulation of new and active lesions on brain MRI
(The IFBN Multiple Sclerosis Study Group, 1993).
Some short- to medium-term studies suggest some
small benefit in terms of EDSS reduction though benefit
in the long term remains unproven. The relative risk
reduction of relapse rate in patients with relapsing-
remitting MS varied from 20–40%. Absolute risk
reduction was even lower with numbers needed to
treat (NNT) calculations revealing mild to moderate
efficacy. For example, 6–8 patients need to be treated
for two years to increase by one the number of patients
free of relapse and 8–9 patients must be treated
for two years to prevent one patient developing an
increase of one point in EDSS (Francis, 2004). It is
important to be aware that randomized control trials
contain an enriched sample of patients defined by
specific inclusion criteria and are likely not repres-
entative of patients seen in a population-based sample.
Therefore, NNT estimated from drug trials may far
underestimate the NNT for patients in community-
based clinical practice (Noseworthy et al., 2005).
The role of IFNβ in secondary-progressive MS is
vague. A study from the United Kingdom reported
slowing of disease progression with Betaseron
(European Study Group on interferon-beta-1b in
secondary-progressive MS, 1998). A subsequent
North American trial did not confirm this finding
(Secondary Progressive Efficacy Clinical Trial of
Recombinant Interferon-beta-1a in MS (SPECTRIMS)
Study Group, 2001). Improvements in some outcome
measures (MS functional composite), but not other
more standard measures (EDSS), make it difficult
to interpret the benefits of Avonex in secondary-
progressive MS (Noseworthy et al., 2005).
NICP_C03 04/05/2007 12:26PM Page 64
Multiple sclerosis 65
Adverse effects of beta interferon therapy
Injection-site reaction: Injection-site reactions
(erythema, bruising, swelling, and pain) are seen
more commonly with subcutaneous injections than
with intramuscular injections (Wingerchuk, 2006).
These reactions usually subside during the first
weeks of treatment. Mild to moderate reactions do
not require discontinuation of treatment. Manage-
ment approaches to injection-site reactions include
rotation of the injection sites, use of topical anesthetics
or corticosteroid, optimization of injection technique,
icing the injection site, warming the medication prior
to injection, and allowing the alcohol cleanser to dry
before injection. The use of nonsteroidal inflam-
matory drugs (NSAIDS) is not recommended as they
may actually increase injection-site reaction. The
use of autoinjectors may allow better approximation
of a standardized technique and reduce discomfort.
Subcutaneous injections should be discontinued if
skin necrosis should occur and consideration given
to switching to an intramuscular injection.
Flu-like symptoms: Flu-like symptoms occur in
a majority of patients after IFNβ therapy initiation.
Symptoms generally resolve by three months and
are characterized by myalgias, fatigue, malaise,
headache, fever, and chills. The symptoms generally
emerge within 2–6 hours of injection and improve
over the following 12–24 hours. Dose titration
is often helpful in controlling symptoms. High-dose
IFNβ preparation may be started at 25% or less of
the target dose and increased incrementally over
2–6 weeks as tolerated. Injections should be admin-
istered at night. NSAIDS or acetaminophen may
alleviate the symptoms.
Laboratory abnormalities: Hematological and
hepatic function laboratory values are commonly
mildly affected by IFNβ therapy. Complete blood
count and liver function tests should be performed
before initiation of treatment as a baseline, at one
week, one month, and three months after initiation
of treatment and then every three to six months
thereafter.
Depression: Because there is a high prevalence of
depression and elevated suicide risk among patients
with MS, there has been some concern regarding
the possibility of worsening depression with the use
of IFNβ drugs. Patients and their caregivers should
report any mood changes immediately.
Gynecological: Other reported adverse effects of
IFNβ therapy include menstrual disorders such as
alterations in the menstrual cycle and breakthrough
bleeding or spotting in premenopausal women. Given
that a large proportion of patients using IFNβ therapy
are women in their child-bearing years, all women
must be advised to utilize effective contraception
techniques while taking IFNβ. Although good data is
lacking, it is recommended that women planning to
become pregnant should discontinue IFNβ at least
three months prior to discontinuation of contracep-
tion to allow a washout period. Two recent studies
have raised some concern regarding use of IFNβ
and pregnancy. One study suggested that the risk of
spontaneous abortion was higher in women exposed
to IFNβ during pregnancy (Sandberg-Wollheim et al.,
2005). A Canadian study revealed a significant
increase in the rate of miscarriage or still birth in the
exposed group as compared with healthy controls
(39% versus 5%) with a decrease in mean birth weight
in the exposed group (Boskovic et al., 2005).
Neutralizing antibodies (NAb): Up to 45% of
patients on IFNβ therapy develop NAb (>20–30%
with high-dose IFNβ such as Rebif and Betaseron
compared with 2–5% with low-dose IFNβ such as
Avonex). Persistent high NAbs reduce biological
activity and may reverse any effect on frequency of
relapses (Kappos et al., 2005). Patients who do not
develop NAbs within the first two years of therapy
are likely to remain seronegative in the future. If
NAbs develop to one IFNβ they will likely develop
with exposure to other preparations as well. Some
neurologists recommend early testing and, if high
titers of antibodies are identified, then discontinua-
tion of IFNβ in favor of one of the other DMAs.
Glatiramer acetate
Glatiramer acetate (GA), approved for use in
relapsing-remitting MS, is a synthetic peptide com-
posed of L-alanine, L-glutamic acid, L-lycine, and
L-tyrosine and was designed to mimic the structure
of myelin basic protein. GA is administered sub-
cutaneously daily at a dose of 20 mg and has been
shown, in large randomized control trials, to reduce
the rate of clinical relapse and of development of
gadolinium-enhancing MRI lesions and T1-weighted
black holes (Comi et al., 2001; Johnson et al., 1995).
Multiple mechanisms of action have been described
and include: (i) modulation of T-cell activation
and proliferation; (ii) modification of dendritic cell
NICP_C03 04/05/2007 12:26PM Page 65
66 BERNADETTE KALMAN ET AL.
costimulation processes and inhibition of antigen
presentation; (iii) increase of IL-10, IL-4, TNFα, and
IL-6 affecting interferon gamma secretion; (iv) induc-
tion of regulatory TH2/3 cells with resultant expres-
sion of anti-inflammatory cytokines and neurotrophic
factors; and (v) enhanced production of brain derived
nerve growth factor (Noseworthy, et al., 2005).
The benefits of GA on relapse-rate reduction are
minimal to moderate with NNT of 14 for two years
to generate one person free of relapse (Francis 2004;
Johnson et al., 1995). Extensive studies suggest some
long-term benefit, but are difficult to interpret due
to high patient drop out and concern that those
who do relatively well tend to remain in therapy,
whereas those who do not tend to discontinue
therapy ( Johnson et al., 2000; Noseworthy et al.,
2005; Wingerchuk, 2006).
Adverse effects
Injection-site reactions: GA is generally better
tolerated than IFNβ therapy. Injection-site reactions
are common and management is similar to manage-
ment for IFNβ injection-site reactions (Wingerchuk,
2006).
Lipoatrophy: Lipoatrophy (for which there is no
treatment) occurs in 10–46% of patients on long-
term GA therapy. Patients should be advised to avoid
injection into an area of lipoatrophy.
Lymphadenopathy: Lymphadenopathy (usually
painless) has been described in up to 30% of patients
in clinical trials and is usually confined to inguinal
lymph nodes, but may be generalized. Rotation of
injection sites and/or temporary discontinuation of
injections may be beneficial. Hematological malig-
nancy should be ruled out by performing complete
blood counts and manual blood smears. Long-term
treatment with GA does not result in hematological
or liver enzyme abnormalities and monitoring is not
required. Nearly all patients receiving GA develop
binding antibodies to the drug within 3–4 months
after initiation of therapy. This does not appear to
interfere with efficacy.
Systemic reactions: Fewer than 15% of patients
experience systemic reaction consisting of flushing,
chest tightness, anxiety, palpitations, or dyspnea
within a few minutes after GA injection and lasting
for 30 seconds to 30 minutes. Although frightening
for some patients, this reaction is benign and self-
limiting and patients should be reassured about the
benign nature of these reactions.
Mitoxantrone (Novantrone)
Mitoxantrone, an anthracenedione agent, interca-
lates DNA, inhibiting both DNA and RNA synthesis
with a resultant depression of T- and B-cell immunity.
Mitoxantrone reduces relapse frequency and MRI
evidence of blood–brain barrier disruption in patients
with relapsing-remitting MS or early secondary-
progressive MS who have active inflammatory dis-
ease and evidence of substantial disease worsening
over short periods of time despite the use of standard
DMAs (Hartung et al., 2002; Noseworthy et al., 2005).
The benefit for patients with relapse-independent
progression is unproven. The Therapeutics and Tech-
nology Assessment Subcommittee of the American
Academy of Neurology, who published a report review-
ing the evidence for efficacy and the range of toxicity
associated with mitoxantrone, recommend caution
with the use of mitoxantrone (Goodin et al., 2003).
In a randomized study of either placebo or mitox-
antrone therapy in 194 patients with either worsen-
ing relapsing-remitting or secondary-progressive MS,
the mitoxantrone in the MS Study group reported
improvement in the mitoxantrone-treated group
(Hartung et al., 2002). The NNT for two years with
mitoxantrone were 11 patients with secondary-
progressive MS to prevent one patient from worsen-
ing by one EDSS point.
The approved dosage of mitoxantrone is 12 mg/m
2
administered quarterly by intravenous infusion.
Adverse effects
Laboratory abnormalities: Leukopenia and neu-
tropenia commonly occur with mitoxantrone. Prior
to each infusion, a complete blood count should
be obtained and if the neutrophil counts are less
than 1500 cells/mm
3
, mitoxantrone should be held.
A complete blood count should be rechecked in one
to two weeks and mitoxantrone treatment can be
resumed when counts normalize. Liver function
tests (LFTs) should also be performed prior to each
infusion and if LFTs increase by greater than 2.5
of the upper limits of normal, mitoxantrone therapy
should be suspended. Concurrent hepatotoxic med-
ications should be stopped (Wingerchuk 2006).
Cardiotoxicity: The risk of cardiomyopathy with
this medication is dose-dependent and may be as
NICP_C03 04/05/2007 12:26PM Page 66
Multiple sclerosis 67
great as 6% in patients receiving up to 140 mg/m
2
(Noseworthy et al., 2005). It is, therefore, recom-
mended that duration of treatment be limited to
approximately two years at the standard dosage
regimen (Wingerchuk, 2006). Mitoxantrone should
not be used in patients with pre-existing cardiac dis-
ease including cardiomyopathy or coronary artery
disease or in those patients who have previously
been treated with anthracycline or have had medi-
astinal radiation therapy. A baseline left ventricular
ejection fraction of less than 50% also precludes
mitoxantrone treatment. Prior to every infusion,
patients should have an echocardiogram or MUGA
scan performed to evaluate their left ventricular ejec-
tion fraction. A reduction in ejection fraction of more
than 10% from baseline should result in permanent
discontinuation of mitoxantrone. There appears to
be some evidence to suggest that concomitant use of
dexrazoxane and the liposomal form of mitoxantrone
may reduce cardiotoxicity. Delayed effects of mitox-
antrone on cardiac function have been reported.
Other: Nausea can be expected during infusion and
for up to several days after infusion of mitoxantrone.
Antiemetic premedications, such as ondansetron, can
be given. Patients should be warned that mitoxan-
trone may cause a harmless, temporary blue dis-
coloration of the urine and sclerae. In women under
the age of 35, 7% may develop secondary amenorrhea,
which can be prolonged for up to several months
after therapy is complete. In women over the age of
35, the risk of permanent amenorrhea may reach
14%. The drug may also reduce fertility in both men
and women. Careful discussion and consultation
with a reproductive endocrinologist is appropriate
before commencing treatment. Mitoxantrone is ter-
atogenic and women of child-bearing age should
be advised to avoid pregnancy. Toxic acute myelo-
genous leukemia is estimated to occur in approx-
imately 0.07% based on review of more than 1300
treated MS patients (Ghalie et al., 2002). Response to
leukemia treatment in these patients is generally
favorable.
Natalizumab (Tysabri)
Natalizumab is a recombinant humanized IgG-4
kappa monoclonal antibody which blocks leukocyte
transmigration across the blood–brain barrier by
multiple ligand-blocking mechanisms including
inhibition of the molecular interaction of alpha 4,
beta 1 integrin with the vascular cell adhesion
molecule (VCAM)-1 on activated vascular endo-
thelium. Natalizumab is administered by monthly
infusions at a dose of 300 mg in 100 ml 0.9% sodium
chloride over approximately one hour. Natalizumab
has been evaluated in two randomized, double-blind,
placebo-controlled trials in patients with MS (Polman
et al., 2006; Rudick et al., 2006b). The first mono-
therapy study of patients who had not received any
other DMA for at least six months showed a 66%
reduction in the annualized relapse rate from 0.74 to
0.25 at one year (Polman et al., 2006). The second
study enrolled patients who had experienced one
or more relapses while on treatment with Avonex
during the year prior to study entry. A combination
of natalizumab and Avonex was compared with
placebo plus Avonex at one year (Rudick et al., 2006).
The annualized relapse rate was reduced by 56%
(0.75 to 0.33) and the percentage of patients remain-
ing relapse-free was 54% in the natalizumab plus
Avonex group compared to 32% in the placebo plus
Avonex group. In addition, natalizumab monotherapy
or combination therapy appeared to significantly
reduce new enhancing lesions. The NNT estimates
for natalizumab are more favorable than the other
DMAs with NNT to render one patient relapse free
after two years of therapy being 2–2.4 (Pittock et al.,
2006). Despite its greater efficacy in terms of relapse
rate and MRI lesion load reduction, natalizumab was
withdrawn from the market on February 28, 2005,
having been approved for use in the relapsing forms
of MS in November 2004. This occurred due to the
development of a rare, but fatal complication of pro-
gressive multifocal leukoencephalopathy (PML) in
two patients. Subsequently, however, the drug has
become available, but only under a special restricted
distribution program called the TOUCH (Tysabri
Outreach: Unified Commitment to Health) Prescribing
Program. Under the TOUCH Prescribing Program,
only prescribers at infusion centers and pharmacies
associated with infusion centers registered with the
program are able to prescribe, distribute, or infuse
the product.
Adverse effects
Progressive multifocal leukoencephalopathy
(PML): PML is an opportunistic infection caused
by the JC virus that typically occurs in immunosup-
pressed patients. Two cases of PML have been reported
in 1859 MS patients who had been treated with
natalizumab for a median of 120 weeks. A third case
occurred among 1043 patients with Crohn’s disease
NICP_C03 04/05/2007 12:26PM Page 67
68 BERNADETTE KALMAN ET AL.
after the patient received eight doses of natalizumab.
The risk for PML in patients treated with natalizumab
is roughly 1 in 1000 patients treated for a mean
of 17.9 months (Yousry et al., 2006). There are no
known interventions that can reliably prevent or
adequately treat PML if it occurs. In addition, it is not
known whether early detection of PML and discon-
tinuation of the drug might mitigate the disease.
Unfortunately, the clinical picture of PML can be
difficult to distinguish from MS. It is recommended
that patients have a pretreatment brain MRI and
regular clinical follow up to allow early detection of
changes in neurological status. New or recurrent
neurological symptoms should prompt careful evalu-
ation. If PML is suspected, natalizumab dosing should
be suspended immediately and further investigation
should include brain MRI evaluation. If MRI evalu-
ation reveals lesions suspicious for PML, lumbar
puncture with evaluation of the CSF for the detection
of JC virus should be undertaken. The reader is
referred to the TOUCH prescribing program issued by
Biogen Idec and Elan for further guidelines.
Infusion-related reactions: Approximately 1–4%
of patients may develop acute hypersensitivity reac-
tions within two hours of infusion (Polman et al.,
2006). Hypersensitivity reactions consist of a com-
bination of symptoms including urticaria, dizziness,
fever, rash, rigors, pruritus, nausea, flushing, hyper-
tension, dyspnea, and chest pain. These types of
reactions should be treated by stopping the infusion
and initiating therapies such as acetaminophen, anti-
histamines, corticosteroids, and fluids as necessary.
Immunosuppression: The immune-system effects
of natalizumab may increase the risk for infection.
Pneumonia, urinary tract infections, gastroenter-
itis, vaginal infections, dental infections, tonsillitis,
and herpes infections occurred more frequently in
natalizumab-treated patients than in placebo-treated
patients in clinical trials. In the monotherapy
natalizumab study, the incidence of serious infection
was 2.1% in natalizumab-treated patients versus
1.3% in placebo-treated patients (Polman et al.,
2006). Concurrent use of antineoplastic immuno-
suppressant or immunomodulation medication
may further increase the risk of infection (including
PML and other opportunistic infections) over the
risk observed with the use of natalizumab alone.
Because of this potential interaction, it is recom-
mended that patients have a washout period if
they have been treated with immunosuppressants
or immunomodulatory medications prior to com-
mencement with natalizumab.
Laboratory abnormalities: Natalizumab may result
in substantial increases in lymphocytes, monocytes,
and eosinophils for some weeks to months after com-
mencement of infusion though neutrophil counts
generally remain unchanged.
Anti-natalizumab antibodies: Data on anti-
natalizumab antibodies is highly dependent on the
sensitivity and specificity of the assay. About 6% of
patients will develop persistent antibodies, which are
associated with a loss of efficacy and an increased
risk of infusion-related adverse events (Polman et al.,
2006).
Immunosuppressant drugs in the long-term
management of MS
Azathioprine, cyclosporin, cyclophosphamide, and
methotrexate have shown only modest beneficial
effects in MS. They are generally not prescribed by
neurologists in the management of MS (Noseworthy
et al., 2005).
Symptomatic treatments in MS
MS is commonly associated with significant complica-
tions that can result in persistent disability. These
complications can be improved by symptomatic
therapies (Stolp-Smith et al., 1997). The reader is
referred to a larger text for a more comprehensive
review of this subject (Noseworthy et al., 2005).
Here we will address some of the more common
problems affecting MS patients.
Fatigue
Fatigue is present in up to 90% of MS patients and
40% of patients consider it their most bothersome
symptom. It is typically characterized by a diurnal
circadian pattern with most prominent fatigue
after the middle of the day. Therapeutic options
for MS-related fatigue are limited and treatment is
indicated when conservative management such as
energy conservation, exercise, and optimized sleep
hygiene are ineffective. Modest benefit has been
reported with amantadine (100 mg orally twice
daily). Recent studies have failed to confirm benefit
of modafinil or pemoline in MS-related fatigue. A
randomized control cross-over trial of aspirin (1300
NICP_C03 04/05/2007 12:26PM Page 68
Multiple sclerosis 69
mg daily) for fatigue in MS reported favorable results
(Wingerchuk et al., 2005).
Spasticity
Spasticity, a common symptom in MS, interferes with
mobility and often results in muscle spasm, pain, and
disturbed sleep. Spasticity often worsens in the setting
of infection, medication, stress, fatigue, or bladder and
bowel retention. The legs are usually more markedly
affected than the arms. Extensor spasticity of the legs
may be advantageous for standing, walking, or trans-
ferring and may compensate for muscular weakness.
Treatment of spasticity requires a multidisciplinary
approach with careful assessment of the patient’s
functional status and identification of treatment
goals. Physical therapy should be the firstline
approach. Medications such as baclofen, tizanidine
HCL, clonazepam, and dantrolene sodium are usually
started at a low dose and titrated up as required.
Other options include intramuscular injection of
botulinum toxin type A (Snow et al., 1990) or baclofen
intrathecal pumps (Stolp-Smith et al., 1997).
Bladder, bowel, and sexual dysfunction
Impaired bladder control affects up to 80% of patients
with MS. Bowel and sexual dysfunction are also
common. Bladder problems generally precede bowel
problems. Bladder symptoms cause much distress
and are usually related to lesions in the spinal con-
nection between the pontine and sacral micturition
centers with resultant detrusor sphincter externus
dyssynergia with simultaneous contractions of both
sphincter and detrusor muscles. Medications to
consider in the management of urgency and urge
incontinence include anticholinergic drugs such as
oxybutynin chloride, tolterodine, terazosin hydro-
chloride, and propantheline bromide. These medica-
tions may further compromise bladder emptying and
it is recommended that post-micturition residual
volume be determined and kept at less than 100 ml,
if necessary by intermittent self-catheterization. The
combination of anticholinergic medications and
clean, intermittent self-catheterization is probably
the optimal treatment of MS patients with bladder
symptoms caused by detrusor hyperreflexia and
incomplete emptying. Desmopressin acetate may
benefit nocturia when administered via nasal spray
and may reduce urine output for six to eight hours.
The most common bowel dysfunction in MS is
constipation. Causes are often multifactorial and
include poor fluid intake, poor mobility, and side effects
of medications (e.g., anticholinergic medications).
Slow colonic transit in MS may be due to autonomic
system failure or other mechanisms. Conservative
approaches should include exercise, increasing
movement and body fitness, and the use of bran, flax
seed, linseed and mineral oils. Medical management
includes the use of medications such as Senna (oral
or rectal suppositories) or Lactulose. Fecal inconti-
nence can be a difficult symptom to manage and is
best referred to a gastroenterologist.
MS may compromise sexual function in a number
of ways including fatigue, depression, poor self-esteem,
pain and sensory loss, neurogenic bladder and bowel
symptoms, and need for catheterization. For most
patients, the problem is a result of spinal demyeli-
nation. Medications that may contribute to sexual
dysfunction should be identified and either reduced
or substituted. Treatment with oral sildenafil (25–
100 mg orally one hour before sexual activity) (Fowler
et al., 2005), alprostadil (urethral suppository, 125–
1000 mcg or injection of the corpora cavernosa of
1.25 mcg) and vildenafil (10–20 mg orally) are often
helpful for men. Sexual dysfunction in women is
less easy to manage. Vaginal dryness may respond
to estrogen creams and water-soluble lubricants
are also helpful. Some advocate use of sildenafil
(Sipski et al., 2000), but there is no definitive evid-
ence for benefit in women with multiple sclerosis.
Pain syndromes
Significant acute or chronic pain syndromes are
experienced by up to half of MS patients at some time
during their illness. Optimal management requires
accurate diagnosis. Psychosocial stressors, mechan-
ical stressors, insomnia, and mood disorders need
to be identified and addressed. Nonsteroidal anti-
inflammatory drugs and physical therapy may be
adequate. Tricyclic antidepressants such as amitri-
ptyline or nortriptyline (starting at a low nightly
dose of 10–25 mg and titrating to 75–100 mg) or
gabapentin (maximum 3600 mg daily) are widely
used for the management of chronic burning, dyses-
thetic extremity pain. Paroxysmal symptoms, which
are often painful, may occur and are due to spontan-
eous discharge of partially demyelinated axons. A
low dose of carbamazepine, sodium valproate, or other
anticonvulsants that increase membrane stability
often brings these attacks under control (Solaro et al.,
1998). Once paroxysmal episodes resolve, it is often
recommended to continue medication for two to
NICP_C03 04/05/2007 12:26PM Page 69
70 BERNADETTE KALMAN ET AL.
three months. It would then be reasonable to reduce
and stop if the paroxysms do not return. Other med-
ications to consider for management of pain include
topiramate, lamotrigine, and misoprostol.
Cognition
Cognitive impairment occurs commonly in MS. The
ability to perform complex cognitive activities and
executive functions are affected most. Memory may
also be disturbed but language is generally preserved.
There are limited treatment options for cognition
problems and treatment is multidisciplinary as with
other dementing illnesses. Acute worsening cognit-
ive function may accompany a relapse and respond
to corticosteroids. Donepezil hydrochloride, a choline-
sterase inhibitor, may have some benefits for MS-
associated cognitive decline (Krupp et al., 2004).
Movement disorders
Ataxia and tremor may result in significant dis-
ability in patients with MS and can be embarrassing,
having a negative impact on social activity. Unfor-
tunately, drug treatment of these symptoms remains
unsatisfactory. Management approaches to tremor
include physical therapy, use of physical restraint
with weight and use of splints and medications (beta
blockers (propanolol, metoprolol, nadolol or sotalol),
clonazepam, and carbamazepine). Small studies have
suggested benefit from isoniazid, ondansetron, and
gabapentin. Stereotactic neurosurgical procedures
creating lesions in the ventral lateral nucleus of
the thalamus and thalamic electrostimulation may
benefit some patients (Alusi et al., 2001; Matsumoto
et al., 2001).
Controversies regarding when to start
treatment in MS
The currently approved DMAs for treatment of MS
have been discussed earlier in this section. Opinions
vary as to who and when to treat (Frohman et al.,
2006; Pittock et al., 2006). Neurologists suggesting
that early initiation of DMAs in all MS patients is
warranted (Frohman et al., 2006) contend that:
1 Most patients with MS will become disabled over
time and it is not possible to predict early in the
course of MS the long-term outcome.
2 Pathological and radiological studies show
irreversible axonal injury evident early in the
course of the disease. Patients who appear to be
doing well clinically may actually be accumulat-
ing new lesions and progressive tissue damage
as evidenced by MRI abnormalities.
3 The FDA has suggested that DMAs work best
early in the course of the illness, even at the time
of the CIS, and work poorly, if at all, later in the
progressive phase of the illness.
4 Since there is a suggestion that relapses do trans-
late into more disability, at least early in the
illness, DMAs started early make sense since they
reduce relapse rate, lesion accrual on MRI, and
subsequent progression of disability.
5 Delayed therapy is associated with a larger
burden of disease on MRI and more patients
developing progressive disability.
Those who suggest that not all patients with MS
should be started on a DMA (Pittock et al., 2006)
contend that:
1 Many patients with MS have a favorable natural
history. In fact, approximately one in five patients
will have minimal or no disability after 20 years
of disease duration.
2 DMAs are only partially effective in the short
term and prevention of disability in the long term
is unproven.
3 It is difficult to distinguish whether a favorable
outcome reflects the favorable natural history or
successful treatment in an individual patient.
4 Expense, adverse effects, and neutralizing anti-
bodies are a concern and patients may be reluct-
ant to commit to long-term parenteral medication.
Those who argue for a “wait and see” approach for
patients who have a clinical and radiological profile
suggesting a greater chance of a benign course with
a low chance of benefit (low relapse rate and lack-
ing evidence of disease activity on MRI, i.e. lack of
gadolinium-enhancing or new T2 lesions), suggest
they be watched carefully with yearly neurological
examinations and MRI scans. Currently available
DMAs are not curative. While they do result in mild
to moderate benefit for some patients, their long-term
benefit is unproven and conclusions drawn from
drug studies may not be applicable to patients in the
community.
Future directions in treatment of MS
There is a major drive to identify better drugs for the
management of MS due to the limited efficacy of the
NICP_C03 04/05/2007 12:26PM Page 70
Multiple sclerosis 71
currently available DMAs and the lack of an oral agent.
Currently there is much interest in combination
therapies which some have argued will provide the
most immediate advances in MS therapies. The app-
roaches to novel treatments for the future include the
use of monoclonal antibodies (see natalizumab as an
example) with precise immunological effects, blockage
of presentation of antigen by antigen-presenting cells
to lymphocytes, T-cell vaccination, bone marrow
transplantation, and therapies with neuroprotective
effects or which promote regeneration/remyelination
(Noseworthy et al., 2005). Potential and evolving inter-
ventions are shown in Table 3.6. There is an extens-
ive number of clinical trials currently ongoing in MS.
These are listed at />pdf/research/clinicaltrials.pdf.
References
Aboul-Enein, F. and Lassmann, H. 2005. Mitochondrial
damage and histotoxic hypoxia: A pathway of tissue
injury in inflammatory brain disease? Acta Neuro-
pathologica, 109, 49–55.
Achiron, A. 2004. Chemokine polymorphisms:
Candidates for MS susceptibility and disease course.
Int MS J, 11, 71–7.
Alusi, S.H., Aziz, T.Z., Glickman, S., Jahanshahi, M.,
Stein, J.F. and Bain, P.G. 2001. Stereotactic lesional
surgery for the treatment of tremor in multiple
sclerosis: A prospective case-controlled study. Brain,
124(8), 1576–89.
Audoin, B., Van Au Duong, M., Malikova, I. et al. 2006.
Functional magnetic resonance imaging and cog-
nition at the very early stage of MS. J Neurol Sci,
245(1–2), 87–91.
Al-Araji, A.H. and Oger, J. 2005. Reappraisal of
Lhermitte’s sign in multiple sclerosis. Mult Scler, 11,
398–402.
Alter, M., Leibowitz, U. and Speer, J. 1966. Risk of
multiple sclerosis related to age of immigration to
Israel. Arch Neurol, 15, 234–7.
Ando, D.G., Clayton, J., Kono, D., Urban, J.L. and Sercarz,
E.E. 1989. Encephalitogenic T cells in the B10. PL
model of experimental allergic encephalomyelitis (EAE)
are of the Th-1 lymphokine subtype. Cell Immunol,
124, 132–43.
Bagnato, F., Jeffries, N., Richert, N.D. et al. 2003.
Evolution of T1 black holes in patients with multiple
sclerosis imaged monthly for 4 years. Brain, 126,
1782–9.
Bakshi, R., Minagar, A., Jaisani, Z. and Wolinsky, J.S.
2005. Imaging of multiple sclerosis: Role in neuro-
therapeutics. NeuroRx, 2, 277–303.
Balo, J. 1928. Encephalitis periaxialis concentrica. Arch
Neurol Psychiatry, 19, 242–64.
Barkhof, F. 2002. The clinico-radiological paradox
in multiple sclerosis revisited. Curr Opin Neurol, 15,
239–45.
Table 3.6 Evolving/Investigational treatments for MS (Noseworthy et al., 2005, Kappos et al., 2004).
Category
Humanized monoclonal
antibodies
Inhibitors of intracellular
activation, signaling and
T-cell proliferation
Neuroprotective and
repair strategies
New oral
immunosuppressant/
immunomodulators
Agents
CTLA4-Ig (structural homolog of CD28); daclizumab (targets α subunit of the
high-affinity interleukin-2 receptor, anti-CD25); alemtuzumab (anti-CD52,
Campath 1H); rituximab (anti-CD20); anti-CD40L/-CD154 (IDEC-131); anti-IL-12,
anti-CD6; anti-CD3 (OKT3); anti-Vβ5.2/5.3
+
T cells; anti-CD4; integrin inhibitors
Lymphocyte-specific cytoplasmic protein – tyrosine kinase P56lck; zeta-associated
protein (ZAP)-70; protein kinase C theta; mitogen-activated protein kinase; nuclear
factor of activated T cells; inhibitors of calcium release – activated Ca channels;
Janus protein tyrosine kinase (JAK 3) inhibitors; inhibitors of pyrimidine biosynthesis
(gemcitabine, leflunomide, and FK778); inosine monophosphage dehydrogenase
inhibitor; VX-497; vaccination with T cells or T-cell receptor peptides
AMPA/kainite receptor antagonists (talampanel, E2007); riluzole (inhibitor of
glutamate transmission); Na channel blockers; inhibitors of Na/Ca exchange;
antioxidants (alpha lipoic acid, tirilazide mysylate, vitamin E); neurotrophic factors;
transplantation of stem cells; rHIgM22 (remyelinating monoclonal antibodies);
IN-1 (anti-Nogo-A mAb)
Pyrimadine synthesis inhibitor (teriflunamide); CCI-779 (ester or sirolimus); FTY720
(inhibits T-cell circulation); xaliproden (inhibits cytokine synthesis); statins (induce
T-helper-cell cytokine shift and reduce T-cell migration); chemokine receptor-1
antagonists; mesopram (phosphodiesterase inhibitor); minocycline (inhibition of
matrix metalloproteinases); macrophage inhibitors
NICP_C03 04/05/2007 12:26PM Page 71
72 BERNADETTE KALMAN ET AL.
Barkhof, F., Filippi, M., Miller, D.H. et al. 1997.
Comparison of MRI criteria at first presentation to
predict conversion to clinically definite multiple
sclerosis. Brain, 120, 2059–69.
Barnett, M.H. and Prineas, J.W. 2004. Relapsing and
remitting multiple sclerosis: Pathology of the newly
forming lesion. Ann Neurol, 55, 458–68.
Beck, R.W., Cleary, P.A., Anderson, M.M. Jr. et al. 1992.
A randomized, controlled trial of corticosteroids
in the treatment of acute optic neuritis. The Optic
Neuritis Study Group. N Engl J Med, 326, 581–8.
Bell, R.B. and Ramachandran, S. 1995. The relation-
ship of TAP1 and TAP2 dimorphisms to multiple
sclerosis susceptibility. J Neuroimmunol, 59, 201–4.
Benedict, R., Bruce, J., Dwyer, M., Abderlahman, N.
and Zivadinov, R. 2006. Neocortical atrophy, third
ventricular width, and cognitive dysfunction in mul-
tiple sclerosis. Arch Neurol, in press.
Bermel, R.A. and Bakshi, R. 2006. The measurement
and clinical relevance of brain atrophy in multiple
sclerosis. Lancet, Neurol, 5, 158–70.
Bermel, R.A., Sharma, J., Tjoa, C.W., Puli, S.R. and
Bakshi, R. 2003. A semiautomated measure of whole-
brain atrophy in multiple sclerosis. J Neurol Sci, 208,
57–65.
Bielekova, B., Goodwin, B., Richert, N. et al. 2000.
Encephalitogenic potential of the myelin basic pro-
tein peptide (amino acids 83–99) in multiple scler-
osis: Results of a phase II clinical trial with an altered
peptide ligand. Nat Med, 6, 1167–75.
Biousse, V., Trichet, C., Bloch-Michel, E. and Roullet, E.
1999. Multiple sclerosis associated with uveitis
in two large clinic-based series. Neurology, 52,
179–81.
Bobowick, A.R., Kurtzke, J.F., Brody, J.F., Hrubec, Z.
and Gillespie, M. 1978. Twin study of multiple
sclerosis. An epidemiologic inquiry. Neurology, 28,
978–87.
Bjartmar, C., Kidd, G., Mork, S., Rudick, R. and Trapp, B.D.
2000. Neurological disability correlates with spinal
cord axonal loss and reduced N-acetyl aspartate in
chronic multiple sclerosis patients. Ann Neurol, 48,
893–901.
Bjartmar, C., Kinkel, R.P., Kidd, G., Rudick, R.A. and
Trapp, B.D. 2001. Axonal loss in normal-appearing
white matter in a patient with acute MS. Neurology,
57, 1248–52.
Bo, L., Vedeler, C.A., Nyland, H., Trapp, B.D. and
Mork, S.J. 2003a. Intracortical multiple sclerosis
lesions are not associated with increased lymphocyte
infiltration. Mult Scler, 9, 323–31.
Bo, L., Vedeler, C.A., Nyland, H.I., Trapp, B.D. and
Mork, S.J. 2003b. Subpial demyelination in the
cerebral cortex of multiple sclerosis patients. J
Neuropath Exp Neurol, 62, 723–32.
Boskovic, R., Wide, R., Wolpin, J., Bauer, D.J. and
Koren, G. 2005. The reproductive effects of beta
interferon therapy in pregnancy: A longitudinal
cohort. Neurology, 65(6), 807–11.
Bourneville, D.M. 1892. Oeuvres completes de JM Charcot:
Icons sur les maladies du system nerveux, Felix Alcan,
Paris, pp. 189–272.
Bourneville, D.M. and Guerard, I. 1869. De la sclerose
en plaque disseminees, A. Delahaye, Paris.
Boylan, K.B., Takahashi, N., Paty, D.W. et al. 1990.
DNA length polymorphism 5′ to the myelin basic
protein gene is associated with multiple sclerosis.
Ann Neurol, 27, 291–7.
Braun, N., Michel, U., Ernst, B.P. et al. 1996. Gene poly-
morphism at position 308 of the tumor necrosis
factor alpha (TNF-alpha) in multiple sclerosis and its
influence on the regulation of TNF-alpha production.
Neurosci Letters, 215, 75–8.
Brex, P.A., Ciccarelli, O., O’Riordan, J.I., Sailer, M.,
Thompson, A.J. and Miller, D.H. 2002. A longit-
udinal study of abnormalities on MRI and disability
from multiple sclerosis. N Engl J Med, 346, 158–64.
Buchanan, R.J., Martin, R.A., Moore, L., Wang, S.
and Ju, H. 2005. Nursing home residents with
multiple sclerosis and dementia compared to
other multiple sclerosis residents. Mult Scler, 11,
610–16.
Burwick, R.M., Ramsay, P.P., Haines, J.L. et al. 2006.
APOE epsilon variation in multiple sclerosis suscept-
ibility and disease severity. Some answers. Neurology,
66, 1373–83.
Campi, A., Pontesilli, S., Gerevini, S. and Scotti, G. 2000.
Comparison of MRI pulse sequences for investigation
of lesions of the cervical spinal cord. Neuroradiology,
42, 669–75.
Capello, E., Roccataagliata, L., Pagano, F. and
Mancardi, G.L. 2001. Tumor-like multiple sclerosis
(MS) lesions: Neuropathologic clues. Neurolog Sci,
22(2), S113–16.
Carone, D.A., Benedict, R.H., Dwyer, M.G. et al. 2006a.
Semi-automatic brain region extraction (SABRE)
reveals superior cortical and deep gray matter
atrophy in MS. Neuroimage, 29, 505–14.
Carone, D., Bruce, J., Benedict, R.H. et al. 2006b.
Regional lesion volume predicts total and then
regional gray matter atrophy in MS. Neurology, 66,
P02.101, A99.
Carswell, R. 1938. Pathologic Anatomy: Illustrations
on the Elementary Forms of Disease. Longman, Orme,
Brown, Green and Longman, London.
Cercignani, M., Inglese, M., Pagani, E., Comi, G. and
Filippi, M. 2001. Mean diffusivity and fractional
anisotropy histograms of patients with multiple
sclerosis. AJNR Am J Neuroradiol, 22, 952–8.
Chen, J.T., Narayanan, S., Collins, D.L., Smith, S.M.,
Matthews, P.M. and Arnold, D.L. 2004. Relating
neocortical pathology to disability progression
in multiple sclerosis using MRI. Neuroimage, 23,
1168–75.
Chiocchetti, A., Comi, C., Indelicato, M. et al. 2005.
Osteopontin gene haplotypes correlate with multiple
sclerosis development and progression. J Neuro-
immunol, 163, 172–8.
NICP_C03 04/05/2007 12:26PM Page 72
Multiple sclerosis 73
Cocco, E., Sardu, C., Lai, M., Spinicci, G., Contu, P.
and Marrosu, M.G. 2004. Anticipation of age at
onset in multiple sclerosis. A Sardinian cohort study.
Neurology, 62, 1794–8.
Comi, G., Filippi, M. and Wolinsky, J.S. 2001. European/
Canadian multicenter, double-blind, randomized,
placebo-controlled study of the effects of glatiramer
acetate on magnetic resonance imaging – measured
disease activity and burden in patients with relapsing
multiple sclerosis. European/Canadian Glatiramer
Acetate Study Group. Ann Neurol, 49(3), 290–7.
Confavreux, C., Hutchinson, M., Hours, M.M., Cortinovis-
Tourniaire, P. and Moreau, T. 1998. Rate of
pregnancy-related relapse in multiple sclerosis.
Pregnancy in Multiple Sclerosis Group. N Engl J Med,
339, 285–91.
Confavreux, C. and Vukusic, S. 2006. Age at disabil-
ity milestones in multiple sclerosis. Brain, 129,
595–605.
Confavreux, C., Vukusic, S., Moreau, T. and Adeleine,
P. 200. Relapses and progression of disability in mul-
tiple sclerosis. N Engl J Med, 343, 1430–8.
Cottrell, D.A., Kremenchutzky, M., Rice, G.P. et al.
1999. The natural history of multiple sclerosis: A
geographically based study. 5. The clinical features
and natural history of primary progressive multiple
sclerosis. Brain, 122(4), 625–39.
Cox, J., Yella, V. and Zivadinov, R. 2006. Evidence for
gray matter atrophy in patients with clinically
isolated syndrome suggestive of multiple sclerosis:
A voxel based morphometry study. Mult Scler,
in press.
Crusius, J.B.A., Pena, A.S., van Osten, B.W. et al. 1995.
Interleukin-1 receptor antagonist gene polymorphism
and multiple sclerosis. Lancet, 346, 979.
Cruveilhier, J. 1829–42. Anatomie pathologique du corps
humain. J.B. Bailliere, Paris.
Dalton, C.M., Chard, D.T., Davies, G.R. et al. 2004.
Early development of multiple sclerosis is associated
with progressive grey matter atrophy in patients
presenting with clinically isolated syndromes. Brain,
127, 1101–7.
Davenport, C.B. 1922. Multiple sclerosis from the
standpoint of geographic distribution and race. Arch
Neurol, 8, 51–8.
Dean, G. 1967. Annual incidence, prevalence and
mortality of multiple sclerosis in white South-African
born and in white immigrants to South Africa. Br
Med J, 2, 724–30.
Dejong, R.N. 1970. Multiple sclerosis: History, definition
and general considerations. In P.J. Vinken and
G.D. Bruyn (eds.), Handbook of Clinical Neurology,
North Holland Publishing, Amsterdam, pp. 45–62.
De Seze, J., Lanctin, C., Lebrun, C. et al. 2005. Idiopathic
acute transverse myelitis: Applicaton of the recent
diagnostic criteria. Neurology, 65, 1950–3.
De Souza, E., Albert, R.H. and Kalman, B. 2002. Cognitive
impairment in immune mediated disorders. Am J
Alzheimer Dis Other Dementias, 17, 23–9.
Dousset, V., Gayou, A., Brochet, B. and Caille, J.M.
1998. Early structural changes in acute MS lesions
assessed by serial magnetization transfer studies.
Neurology, 51, 1150–5.
Dutta, R., McDonough, J., Yin, X. et al. 2006.
Mitochondrial dysfunction as a cause of axonal
degeneration in multiple sclerosis patients. Ann
Neurol, 59
, 478–89.
Dyment, D.A., Herrera, B.M., Cader, M.Z. et al. 2005.
Complex interactions among MHC haplotypes in
multiple sclerosis: susceptibility and resistance. Hum
Mol Genet, 14, 2019–26.
Dwyer, M.G., Abdelrahman, N., Weinstock-Guttman,
B. et al. 2005. Quantitative analysis of lesion load
progression in advanced multiple sclerosis. Mult
Scler, 11, 68, S14.
Ebers, G.C. 1983. Genetic factors in multiple sclerosis.
Neurol Clin, 1, 645–54.
Ebers, G.C. 2004. Natural history of primary pro-
gressive multiple sclerosis. Mult Scler, 10(1), S8–13;
discussion S13–15.
Ebers, G.C., Kukay, K., Bulman, D.E. et al. 1996. A
full genome search in multiple sclerosis. Nat Genet,
13, 472–6.
Ebers, G.C., Sadovnick, A.D. and Risch, N.J. 1995. A
genetic basis for familial aggregation in multiple
sclerosis. Canadian Collaborative Study Group. Nature,
377, 150–1.
Ebers, G.C., Sadovnick, A.D., Dyment, D.A., Yee, M.L.,
Willer, C.J. and Risch, N. 2004. Parent-of-origin
effect in multiple sclerosis: Observations half-siblings.
Lancet, 363, 1773–4.
Eichorst, H. 1896. Uber infantile und hereditare
multiple sklerose. Virchows Arch Path Anat, 146,
173–92.
Elian, M., Alonso, A., Awad, J. et al. 1987. HLA associ-
ation with multiple sclerosis in Sicily and Malta.
Disease Markers, 5, 89–99.
Elian, M., Nightingale, S. and Dean, G. 1990. Multiple
sclerosis among the United Kingdom born children
of immigrants from the Indian Subcontinent, Africa
and the West Indies. J Neurol Neurosurg Psychiatry,
53, 906–11.
Epplen, C., Jackel, S., Eduardo, J.M. et al. 1997. Genetic
predisposition to multiple sclerosis as revealed by
immunoprinting. Ann Neurol, 41, 341–52.
Eriksson, M., Ben-Menachem, E. and Andersen, O. 2002.
Epileptic seizures, cranial neuralgias and paroxysmal
symptoms in remitting and progressive multiple
sclerosis. Mult Scler, 8, 495–9.
Erskine, M.K., Cook, L.L., Riddle, K.E., Mitchell, J.R. and
Karlik, S.J. 2005. Resolution-dependent estimates
of multiple sclerosis lesion loads. Can J Neurol Sci, 32,
205–12.
European Study Group on interferon-beta-1b in sec-
ondary progressive MS. 1998. Placebo-controlled
multicentre randomised trial of interferon beta-1b in
treatment of secondary progressive multiple sclerosis.
Lancet, 352(9139), 1491–7.
NICP_C03 04/05/2007 12:26PM Page 73