Ophthalmic Drug Delivery Systems - part 4 doc
Bạn đang xem bản rút gọn của tài liệu. Xem và tải ngay bản đầy đủ của tài liệu tại đây (566.91 KB, 58 trang )
mainlyacrossthehyaloidmembrane,the15mLinjectionsplacedcloserto
thehyaloidmembrane(hyaloid-displacedandlens-displaced)resultedin
lowermeanconcentrationsat24hoursthanthe100mLinjectionsatthe
samelocations,duetoahigherinitialrateofeliminationacrossthehyaloid
membrane.Figure12showstheconcentrationadjacenttothehyaloidmem-
braneforthe15and100mLhyaloid-displacedinjectionsoffluorescein
glucuronide.Similartofluorescein,whentheinjectionoffluoresceinglucur-
onidewasnotplacednexttoitseliminationsurface(centralandretina-
displaced),highereliminationisproducedbythe100mLinjection.
3.ClinicalImplicationsofChangesinInjectionConditions
Fromaclinicalperspective,theresultsofchangesininjectionconditionsare
verysignificant.Retinaldamagefromexcessivedrugconcentrationsis
observedperiodicallyfollowinganintravitrealinjection.Theresultsofthis
DrugDistributioninVitreousHumor203
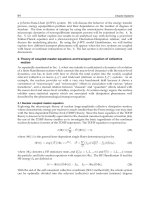
Figure11Concentrationoffluoresceinatthevitreoussiteadjacenttotheretina
following a 15 or 100 mL injection adjacent the retina on symmetry axis of vitreous.
The mass of fluorescein injected in each case was identical, resulting in higher peak
concentrations adjacent to the retina following the 15 mL injection case and, there-
fore, a higher initial loss of fluorescein across the retina.
Copyright © 2003 Marcel Dekker, Inc.
the injection positions that were examined in this study are extremes within
the anatomy of the eye, a varia tion of only 5–8 mm from a central injection
will produce these extremes. Slight changes in the injection conditions can
easily produce these variations. Knowledge of concentration variations that
are present at different sites within the vitreous will facilitate the optimiza-
tion of administration techniques for diseases that affect the posterior seg-
ment of the eye.
C. Effects of Aphakia and Changes in Retinal Permeability
and Vitreous Diffusivity on Drug Distribution in the
Vitreous
Posterior segment infections that result in endophthalmitis most often occur
as a complication following cataract extraction, anterior segment proce-
dures, and traumatic eye injuries (23–25). Vitreoproliferative disease, a dis-
order in which there is uncontrolled proliferation of nonneoplastic cells,
accounts for the majority of failures following retinal detachment surgery
(26). A common result of both of these diseases states is inflammation of the
retina, which results in a breakdown of the blood-retinal barrier (27). Long-
term diabetes is also known to result in a breakdown of the blood-retinal
barrier (28). The permeability of the retina will be affected as a result of
these disorders and will depend on the extent to which the blood-retinal
barrier has been compromised. The retinal permeability of compounds nor-
mally unable to cross the blood-retinal barrier will be increased; however,
the retinal permeability of compounds that are normally actively trans-
ported across the retina may actually decrease due to a disrupt ion in the
active transport processes. Another transport parameter that may change
indirectly with changes in the pathophysiology of the eye is the diffusivity of
drugs in the vitreous. Changes in drug diffusivity will be most significant
when drugs of different molecular weight are used to treat different patho-
logical co nditions. The developed human eye finite element model was used
to estimate how the pathophysiology of the posterior eye segment affects the
distribution and elimination of drug from the vitreous (29). In particular,
the effect of three conditions were examined: changes in the diffusivity of
drugs in the vitreous, changes in retinal permeability, and, since it is com-
mon to inject drugs into aphakic eyes, the presence or absence of the lens.
1. Range of Vitreous Diffusivity and Retinal Permeability
Values Considered
In order to cover a large number of drugs with a wide range of physico-
chemical properties, retinal permeabilities between 1 Â 10
À7
and 1 Â 10
À4
Drug Distribution in Vitreous Humor 205
Copyright © 2003 Marcel Dekker, Inc.
cm/s were considered. Retinal permeabili ties have been estimated for only a
small number of compounds, including fluorescein (2:6 Â 10
À5
cm/s), fluor-
escein glucuronide (4:5 Â 10
À7
cm/s), and dexamethasone sodium m-sulfo-
benzoate (4:9 Â 10
À5
cm/s) (1,9,15–17,30). All of the reported values fall
within the range of permeabilities that were studied.
The vitreous is composed of water and low concentrations of collagen
and hyaluronic acid. As the vitreous ages, the concentration of collagen and
hyaluronic acid increases; however, even when elevated, the concentrations
are still relatively low, at 0.13 mg/mL and 0.4 mg/mL, respectively (31). It has
long been accepted that the diffusivity of solutes in the vitreous is unrestricted
(32). An empirical relationship developed by Davis (33) can be used to deter-
mine if the concentration of collagen and hyaluronic acid would affect drug
diffusivity in the vitreous. The diffusivity of a substance in a hydrogel can be
estimated relative to its free aqueous diffusivity using the following equation:
D
P
D
o
¼ exp À 5 þ 10
À4
M
w
ðÞ
ÀÁ
C
p
ÂÃ
where D
P
and D
o
represent the hydrogen (vitreous) diffusivity and the dif-
fusivity in a polymer-free aqueous solution, respectively, M
W
represent the
molecular weight of the diffusing species, and C
P
represents the concentra-
tion of polymer (collagen and hyaluronic acid) in the hydrogel in units of
grams of polymer per gram of hydrogel. Using the sum of the maximum
concentration of collagen and hyaluronic acid ð5:3 Â 10
À4
g/g) as C
P
and the
molecular weight of fluorescein (330 Da) gives a D
P
to D
o
ratio of 0.997.
This value indicates that the diffusivity of a small molecule like fluorescein in
the vitreous is virtually identical to the diffusivity of fluorescein in a poly-
mer-free aqueous solution. Even if a molecular weight of 100,000 Da is used,
the ratio of D
P
to D
o
is still 0.992, indicating that for virtually all drugs of
interest, the diffusivity in a free aqueous solution is an accurate representa-
tion of vitreous diffusiv ity. This conclusion will hold for any molecule that
does not have some form of binding interaction with collagen and hyaluro-
nic acid. The diffusivity of molecules that do not interact with hyaluronic
acid and collagen is simply a function of the molecular weight of the diffus-
ing species. The molecular weight of drugs administered to the vitreous fall
within a range of approximately 100–10,000. Davis (33) estimated the dif-
fusivity of Na
125
I (125 Da), [
3
H]prostaglandin F
2/
(354 Da), and
125
I-
labeled bovine serum albumin (67,000 Da) in water. Although these com-
pounds would not be administered therapeutically to the vitreous, their
diffusivities represent a reasonable range of values for testing the sensitivity
of drug distribution and elimination using the model. Therefore, the diffu-
sivities used in the model simulations are 2:4 Â 10
À5
cm
2
/s (125 Da), 5:6 Â
10
À6
cm
2
/s (354 Da), and 5:4 Â 10
À7
cm
2
/s (67,000 Da).
206 Friedrich et al.
Copyright © 2003 Marcel Dekker, Inc.
Theeffectsofchangingtheretinalpermeabilityorvitreousdiffusivity
werestudiedusingthephakiceyemodel.Whenthesensitivitytothevitreous
diffusivitywasstudied,theretinalpermeabilitywasheldconstantat
5Â10
À5
cm/s.Likewise,whenthesensitivitytotheretinalpermeability
wasstudied,thevitreousdiffusivitywasheldconstantat5:6Â10
À6
cm
2
/s.
Whentheeffectsofchangingthevitreousdiffusivityandretinalpermeability
werestudiedinthephakiceyemodel,onlyacentralinjectionwasconsidered
toreducethenumberofvariablesthatwerechanged.
2.ModificationstoFiniteElementModeltoSimulateAphakic
Eyes
Althoughcataractextractionspreviouslyinvolvedremovaloftheentire
lens,itismorecommontodaytoleavetheposteriorlenscapsuleintactin
ordertoreducepostoperativecomplicationssuchasvitreouschangesand
retinaldetachment(34).Tostudyeliminationinanaphakiceye,thehuman
phakiceyemodelwasmodifiedsothatthecurvedbarrierformedbythelens
(Fig.7)wasreplacedbytheposteriorcapsuleofthelens(Fig.13).Allofthe
other tissues of the aphakic eye model were assumed to be in the same
Drug Distribution in Vitreous Humor 207
Figure 13 Cross-section view of aphakic human eye model.
Copyright © 2003 Marcel Dekker, Inc.
configurationasinthephakiceyemodel.Thevaluesnotedearlierforthe
retinalpermeabilityoffluoresceinandfluoresceinglucuronidewerealso
usedintheaphakicmodeltostudytheeffectsofremovingthelensonthe
eliminationofcompoundsthathaveeitherahighoralowretinalperme-
ability.Thediffusivityoffluoresceinandfluoresceinglucuronideusedfor
thevitreousandhyaloidmembranewas6:0Â10
À6
cm
2
/s,whichisthesame
asthediffusivityinfreesolution(35).KaiserandMaurice(30)studiedthe
diffusionoffluoresceininthelensandconcludedthatthemasstransfer
barrierformedbytheposteriorcapsuleofthelenswasthesameasan
equalthicknessofvitreous.Thedrugdiffusivityusedwithintheposterior
lenscapsule,therefore,wasalso6:0Â10
À6
cm
2
/s.
3.ResultsofChangesinVitreousDiffusivityandRetinal
Permeability
Theeffectsofchangingtheretinalpermeabilityandvitreousdiffusivityare
summarizedinTable5.Theresultsagreewithwhatwouldbeexpectedbased
on mass transfer principles. The effect of vitreous diffusivity was examined
with the retinal permeability set to an intermediate value of 5:0 Â 10
À5
cm/s,
such that both the hyaloid membrane and the retina are expected to be
important elimination routes. Decreasing the drug diffusivity through the
vitreous increases the time required for drug molec ules to travel from the
injection site to an elimination boundary. Accordingly, the mean concentra-
tions in the vitreous, calculated at 4, 12, and 24 hours after injection,
increased as the drug diffusivity was reduced. Furthermore, the rate of
drug elimination, which is inversely related to the drug’s elimination half-
life, decreased significantly as the drug diffusivity was reduced. (Note: The
half-life noted in these studies is not the terminal phase half-life normally
quoted for a drug’s pharmacokinetic properties, but rather the time required
for the average concentration in the vitreous to drop by a factor of two
immediately following injection.) At the lowest diffusivity considered
(5:4 Â 10
À7
cm
2
/s), the mean intravitreal concentration at 24 hours was
only 7.5% lower than the concentration at 4 hours. In contrast, at the highest
diffusivity examined ð2:36 Â 10
À5
cm
2
/s), the mean vitreal concentration
decreased by more than 99% between 4 and 24 hours. Consequently, drug
diffusivity can have a drastic effect upon drug distribution and elimination.
Table 5 shows the peak concentrations in the vitreous adjacent the lens
were only slightly affected by changes to the drug diffusivity. However, the
time at which the peak concentration occurred increased as the dru g diffu-
sivity decreased because the average time required for a drug molecule to
reach the lens increased. In the regions adjacent to the retina and hyaloid
membrane, the peak concentrations increased as the drug diffusivity
208 Friedrich et al.
Copyright © 2003 Marcel Dekker, Inc.
in the vitreous at 24 hours was approximately 27% lower than at 4 hours. In
contrast, when the retinal permeability was 1:0 Â 10
À4
cm/s, the mean vitreal
concentration at 24 hours was 95% lower than the concentration at 4 hours.
Peak concentrations and peak times in the vitreous adjacent to the lens
were virt ually unaffected by changes to the retinal permeability. The largest
changes in the peak concentrations were noted adjacent to the retina, where
changing the retinal permeability by four orders of magnitude caused a
sixfold variation in peak concentrations. As the retinal permeability
increases, it is less likely to be a rate-limiting barrier. Therefore, where the
permeability is high, drugs are eliminated faster, leading to a lower concen-
tration adjacent to the retina.
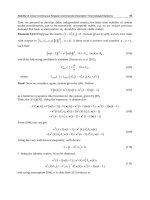
Figure 14 contains a plot of the half-life of a drug within the vitreous
as a function of either its vitreous diffusivity or its retina permeability.
210 Friedrich et al.
Figure 14 Dependence of half-life on vitreous diffusivity or retinal permeability.
Note the half-life noted in these studies is not the terminal phase half-life, but rather
the time required for the average concentration in the vitreous to drop by a factor of
two immediately following injection.
Copyright © 2003 Marcel Dekker, Inc.
Similarrelationshipsbetweenretinalpermeability,vitreousdiffusivity,mole-
cularweight,andhalf-lifehavebeenshownbyMaurice(32,36).Withinthe
rangestudied,half-lifeisinverselydependentonthevitreousdiffusivityand
retinalpermeability.Thehalf-lifehasagreaterdependenceonthevitreous
diffusivitythanontheretinalpermeability,althoughneitherrelationshipis
linear.Astheretinalpermeabilityeitherdecreasestowardszeroorincreases
toahighvalue,thehalf-lifeapproacheseitherahighoralowlimit,respec-
tively.Thisisconsistentwithexpectationsbecausealldrugiseliminated
acrossthehyaloidmembranewhentheretinalpermeabilityiszero.
Therefore,thehalf-lifewillbedependentontherateatwhichdrugreaches
thehyaloidmembrane,whichisdeterminedbythedrugdiffusivitythrough
thevitreous.Likewise,whentheretinalpermeabilityishigh,therateof
eliminationwillbelimitedbytherateofdiffusionacrossthevitreous.
Althoughtherangeofdrugdiffusivitiesconsideredisnotlargeenoughto
showtheeffectofextremevaluesofdiffusivityonhalf-life,itisexpectedthat
asthevitreousdiffusivitydecreases,thehalf-lifeshouldincreasewithout
bound.However,asthevitreousdiffusivityincreases,drugelimination
wouldoccurprimarilythroughthehyaloidmembraneintotheaqueous
humorandultimatelythroughtheaqueous/bloodbarrier.Sincediffusivity
intheaqueoushumorshouldbeatthesameasinthevitreousandhyaloid,
theflowingaqueoushumorshouldnotrepresentalimitingmasstransfer
barrier.Althoughthefiniteelementmodeldidnotaccountfortheaqueous/
bloodbarrier,thepropertiesofthisbarrierwoulddictatethelowerlimitof
vitreoushalf-lifewhenvitreousdiffusivityincreasestolargevalues.
Mostdrugsadministeredintravitreallyhavemolecularweightsran-
gingfrom300to500Da;therefore,Figure14(foravitreousdiffusivityof
5:6Â10
À6
cm
2
/s,354Da)willberepresentativeofmostdrugs.However,for
smallerorlargercompounds,thequantitativerelationshipbetweenhalf-life
andthepermeabilitywillbedifferent,aswillthelimitingvalues.
Nevertheless,thesamequalitativerelationshipshouldstillbeobserved,
regardlessofthevitreousdiffusivity.Consequently,Figure14permitsqua-
litativecomparisonsbetweentheeliminationofdifferentdrugs(molecular
weightaffectsdiffusivity).Furthermore,Figure14demonstratestheimpor-
tanceofdoseadjustmentifadrugisadministeredintoaneyecompromised
byretinalinflammationorotherdiseasethatalterthepermeabilityofthe
blood-retinalbarrier.
4.ResultsofAphakiaonDrugDistributionintheVitreous
Figure15showsthemodelcalculatedconcentrationprofileoffluoresceinon
half of a cross section of the vitreous 24 hours after a central intravitreal
injection in the phakic and aphakic eye models. The concentration contours
Drug Distribution in Vitreous Humor 211
Copyright © 2003 Marcel Dekker, Inc.
trends were noted when comparing the half-life of fluorescein in the phakic
versus aphakic eye model. In both cases, the longest half-life was found for a
central injection and the shortest half-life was found for a hyaloid-displaced
injection. The half-life for the lens-displaced injection, however, was much
Drug Distribution in Vitreous Humor 213
Table 6 Half-Life and Peak and Mean Vitreous Concentrations of Fluorescein
Calculated Using the Aphakic and Phakic Eye Models Following Intravitreal
Injections at Different Locations
Injection
location
t
1=2
(h)
a
C
mean
in vitreous
(mg=mLÞ
C
peak
in vitreous
(mg=mLÞ
4h 12h 24h
Adjacent
lens
Adjacent
retina
Adjacent
hyaloid
Phakic
Central 8.36 6.61 2.61 0.60 9.53
(3.78)
6.77
(3.17)
0.673
(6.89)
Lens 8.08 6.49 2.49 0.564 628 0.989 2.97
Displaced (0.128) (7.94) (2.83)
Retina 3.54 3.79 1.27 0.339 1.52 563 0.154
Displaced (9.89) (0.119) (11.1)
Hyaloid 1.39 2.11 0.695 0.158 5.73 0.166 210
Displaced (3.28) (12.1) (0.104)
0.084
b
(9.31)
b
Aphakic
Central 8.38 6.61 2.47 0.646 3.34 4.13 0.873
(4.33) (4.33) (5.22)
Lens 3.54 3.72 1.26 0.312 328 0.430 3.58
Displaced (0.093) (10.3) (2.01)
Retina 3.75 3.84 1.35 0.303 0.421 563 0.144
Displaced (11.2) (0.131) (11.2)
Hyaloid 2.29 2.41 0.626 0.146 3.98 0.163 238
Displaced (2.03) (12.9) (0.137)
0.102
b
(8.44)
b
Values in parentheses indicate the time (hours) to reach the peak concentrations.
a
The half-life noted in these studies is not the terminal phase half-life, but rather the time
required for the average concentration in the vitreous to drop by a factor of 2 immediately
following injection. The terminal phase half-life would not be expected to change with
changes in injection position since the terminal phase occurs after a pseudo equilibrium has
been achieved in the vitreous. After this point only vitreous diffusivity and retinal perme-
ability would govern the rate of elimination.
b
Peak concentration in vitreous adjacent hyaloid opposite the location of the intravitreal
injection.
Copyright © 2003 Marcel Dekker, Inc.
lowerintheaphakiceyemodelthaninthephakiceyemodel.Placingthe
injecteddrugclosertothelenscapsuleintheaphakiceyemodelwould
initiallyproducearapidlossofdrugtotheposteriorchamberoftheaqu-
eoushumor.However,inthephakiceyemodel,sincethereisnolossacross
thelens,injectingthedrugclosertothelenshaslittleeffect.Theinitialdrug
lossacrossthelenscapsuleintheaphakiceyemodelisconfirmedbycom-
paring,intheaphakicandphakiceyemodels,theratiobetweenthemean
concentrationsat4and24hoursforthecentralandlens-displacedinjec-
tions.Intheaphakiceyemodel,themeanconcentration4hoursfollowinga
centralinjectionis1.75timesgreaterthanthemeanconcentrationfroma
lens-displacedinjection;thisratioincreasesslightlyat24hours.Inthe
phakiceyemodel,however,thisratioisonlyapproximately1.02,despite
thefactthatthemeanconcentrationinthevitreousisthesameforthe
phakicandaphakiceyemodels4hoursfollowingacentralinjection.The
higherratiointheaphakiceyemodelisthereforeduetoincreasedtransport
acrossthelenscapsule,muchofwhichoccurswithinthefirst4hoursfol-
lowinganinjection.
Themeanvitreousconcentrationsinthephakicandaphakiceyemod-
elsdifferbylessthan10%followingcentral,retinal-displaced,andhyaloid-
displacedinjections,regardlessofthesampletimeconsidered.However,the
peakconcentrationsoffluoresceinadjacenttothelensandretinawere
higherinthephakiceyemodelthaninaphakiceyemodelforalltheinjec-
tionpositions.Adjacenttothelens,thepeakconcentrationswerehigherin
thephakiceyemodelbecausethereisnolossacrossthelens.Adjacenttothe
retina,thepeakfluoresceinconcentrationswereonlysignificantlyhigherin
thephakiceyemodelforthecentralandlens-displacedinjections.Thisis
duetoincreasedlossacrossthelenscapsuleintheaphakiceyemodeland
thefactthatthedistancebetweentheinjectionsiteandtherecordingsiteis
slightlylargerintheaphakiceyemodelthaninthephakiceyemodel.The
peakconcentrationsadjacenttothehyaloidmembranewerehigherinthe
aphakiceyemodelthaninthephakiceyemodelforthecentralandlens-
displacedinjections.Thisisduetothefactthat,intheaphakiceyemodel,
theinjectionsitesareslightlyclosertothesiteadjacenttothehyaloidwhere
theconcentrationswererecorded.
Figure16showsthemodelcalculatedconcentrationprofileoffluor-
esceinglucuronideinhalfofacrosssectionofthevitreous36hoursaftera
centralinjectioninthephakicandaphakiceyemodels.Inthiscase,since
fluoresceinglucuronidehasalowretinalpermeabilityandiseliminated
primarilyacrossthehyaloidmembrane,theconcentrationcontoursare
perpendiculartothesurfaceoftheretina.Table7liststhehalf-lives,
mean concentrations, and peak concentrations of fluorescein glucuronide
within the vitreous as a function of injection position for both the phakic
214 Friedrich et al.
Copyright © 2003 Marcel Dekker, Inc.
Therateofeliminationfromthevitreousatlongertimes(intheterm-
inalphase)shouldbeindependentoftheinjectionposition.Ingeneral,the
half-lifeoffluoresceinglucuronideishigherthanthatforfluorescein.
However,theeliminationbehaviorobservedwiththephakicmodeland
theaphakicmodelisdifferentforfluoresceinandfluoresceinglucuronide.
Thesedifferencesareduetothefactthatfluoresceinglucuronideiselimi-
natedmainlyacrossthehyaloidmembrane,ratherthanacrosstheretina.In
boththeaphakicmodelandthephakicmodel,thehighesthalf-lifeoccurred
fortheretina-displacedinjectionandthelowesthalf-lifeoccurredforthe
hyaloid-displacedinjection,whichisconsistentwiththefactthatthehyaloid
isthemaineliminationpathway.Similartofluorescein,thehalf-lifefollow-
ingalens-displacedinjectionwasmuchlowerintheaphakicmodelthanin
thephakicmodelduetotransportofdrugacrossthelenscapsuleinthe
aphakiceyemodel.Meanintravitrealconcentrationsoffluoresceinglucur-
onideat12and24hoursarelowerintheaphakicmodelforalltheinjection
locationsconsidered.
Acomparisonofpeakconcentrations(Table7)showsthatfluorescein
glucuronideconcentrationsadjacenttothelensandretinawereconsistently
lowerintheaphakiceyemodel.However,concentrationsadjacenttothe
hyaloidmembraneweretypicallyhigherfollowinginjectionintheaphakic
eyemodel.Similartrendsareobservedforthepeakfluoresceinconcentra-
tions(Table6).Theaphakicmodelcalculatedlowerpeakconcentrations
near the retina and lens, for all the injection positions, but calculated higher
concentrations near the hyaloid membrane. Thus, this comparison of elim-
ination in the aphakic and phakic eye models has indicated that not only does
the presence of the lens affect elimination, but the difference in elimination
from an aphakic eye and a phakic eye is highly dependent on the injection
location and the retinal permeability of the drug. If the drug has a low retinal
permeability, then the half-life of the drug in an aphakic eye is highly depen-
dent on the distance between the injection location and the lens capsule.
V. SUMMARY
Finite element modeling has been shown to be a useful tool to study drug
distribution within the vitreous humor, with fewer limitations than pre-
viously developed mathematical models. Using a finite element model of
the vitreous, the site of an intravitreal injection was shown to have a sub-
stantial effect on drug distribution and elimination in the vitreous. The
retinal permeability of fluorescein and fluorescein glucuronide in rabbit
eyes calculated by the model ranged from 1.94 to 3:5 Â 10
À5
and0to7:62 Â
10
À7
cm/s, respectively, depending on the assumed site of the injection. The
Drug Distribution in Vitreous Humor 217
Copyright © 2003 Marcel Dekker, Inc.
actual physiological retinal permeability will be a constant that is expected
to lie within these ranges. If the exact initial location and distribution of the
drug following injection were known, a single retinal permeability value
could be calculated using the model.
By using a finite elem ent model that matched the geometry and phy-
siology of the human eye, it was shown that variations in intravitreal injec-
tion conditions can produce radically different levels of drug exposure in
different sites within the vitreous. Variations in the injection location
resulted in peak concentrations that varied by over three orders of magni-
tude. These variations are very important to consider if toxicity to the retina
and other tissues is to be avoided. The mean calculated vitreous concentra-
tion 24 hours after an intravitreal injection varied by up to a factor of 3.8,
depending on the initial location of the injected drug. Changing the volume
of the injection from 15 to 100 mL dampened the effects of the initial injec-
tion location; however, mean concentrations at 24 hours still varied by up to
a factor of 2.5.
Using finite element modeling, it has also been shown that the rate of
drug elimination from the vitreous is highly dependent on diffusivity through
the vitreous and retinal permeability. For a constant retinal permeability of
5:0 Â 10
À5
cm/s, increasing the vitreous diffusivity from 5:4 Â 10
À7
to 2:4 Â
10
À5
cm
2
/s decreased the calculated half-life from 64 hours to 2.7 hours. For
a constant drug diffusivity of 5:6 Â 10
À6
cm
2
/s, increasing the retinal perme-
ability from 1:0 Â 10
À7
to 1:0 Â 10
À4
cm/s decreased the calculated half-life
of drug from 44 to 7 hours. Therefore, the drug diffusivity and retinal perme-
ability are key factors that affected elimination from the vitreous and must be
considered when selecting drugs and doses, particularly if the blood-retinal
barrier has been compromised. Drug elimination was higher in an aphakic
eye model than in a phakic eye model, especially for drugs with a low retinal
permeability and if the injection was close to the lens capsule .
In the modeling work presented in this chapter, injection solutions
have been assumed to be spherical or cylindrical in shape. It is known,
however, that the distribution or shape of a drug solution within the
vitreous immediately following intravitreal injection may vary depending
on factors such as needle gauge and length, injection speed, solution visc-
osity, and vitreous rheology. Such variations in shape would influence the
diffusional surface area and hence drug distribution within the vitreous.
An attempt has been made to quantitate the effect of shape by using the
extent of fingering as a quantitative indicator of shape irregularity and
simulating intravitreal drug distribution using various shapes as the initial
condition (7). Although such simulations provide some insight into the
effect of shape, given the spurious nature of injections, it is difficult to
relate the results to any given injection.
218 Friedrich et al.
Copyright © 2003 Marcel Dekker, Inc.
Another limitation of the models discussed in this chapter is that
transport of drug in the vitreous was assumed to occur only by diffusion.
Vitreous liquefaction as a result of age or disease may result in pockets of
liquefied vitreous where there may be convective transport of drug. This
convection would dampen both the concentration gradients calculated by
the model and the effects of using different intravitreal injection conditions.
However, knowledge of exactly where liquefaction occurs or how much
convection occurs in liquefied pockets was not available at the time the
modeling was performed. When better knowledge of vitreous liquefaction
becomes available, this could be incorporated into the models.
REFERENCES
1. Lee, V. H. L., Pince, K. J., Frambach, D. A., et al. Drug delivery to the
posterior segment. In: Retina, T. E. Ogden and A. P. Schachat, eds. St.
Louis: C. V. Mosby, 1989, pp. 483–498.
2. Forster, R. K., Abbott, R. L., and Gelender, H. Management of infectious
endophthalmitis. Ophthalmology 87:313–319, 1980.
3. Pflugfelder, S. C., Hernandez, E., Fliesler, S. J., Alvarez, J., Pflugfelder, M. E.,
and Forster, R. K. Intravitreal vancomycin. Retinal toxicity, clearance, and
interaction with gentamicin. Arch. Ophth. 105:831–837, 1987.
4. Stainer, G. A., Peyman, G. A., Meisels, H., and Fishman, G. Toxicity of
selected antibiotics in vitreous replacement fluid. Ann. Ophth. 9:615–618, 1977.
5. Tabatabay, C. A., D’Amico, D. J., Hanninen, L. A., and Kenyon, K. R.
Experimental drusen formation induced by intravitreal aminoglycoside injec-
tion. Arch. Ophth. 105:826–830, 1987.
6. Talamo, J. H., D’Amico, D. J., Hanninen, L. A., and Kenyon, K. R., and
Shanks, E. T. The influence of aphakia and vitrectomy on experimental retinal
toxicity of aminoglycoside antibiotics. Am. J. Ophth. 100:840–847, 1985.
7. Lin, H H. Finite element modelling of drug transport processes after an
initravitreal injection. MASc. thesis, University of Toronto, 1997.
8. Araie, M., and Maurice, D. M. The loss of fluorescein, fluorescein glucuronide
and fluorescein isothiocyanate dextran from the vitreous by the anterior and
retinal pathways. Exp. Eye Res. 52:27–39, 1991.
9. Koyano, S., Araie, M., and Eguchi, S. Movement of fluorescein and its glu-
curonide across retinal pigment epithelium-choroid. Invest. Ophth. Vis. Sci.
34:531–538, 1993.
10. Ohtori, A., and Tojo, K. In vivo/in vitro correlation of intravitreal delivery of
drugs with the help of computer simulation. Biol. Pharm. Bull. 17:283–290,
1994.
11. Tojo, K., and Ohtori, A. Pharmacokinetic model of intravitreal drug injec-
tion. Math. Biosci. 123:359–375, 1994.
Drug Distribution in Vitreous Humor 219
Copyright © 2003 Marcel Dekker, Inc.
12. Yoshida, A., Ishiko, S., and Kojima, M. Outward permeability of the blood-
retinal barrier. Graef. Arch. Clin. Exp. Ophth. 230:78–83, 1992.
13. Yoshida, A., Kojima, M., Ishiko, S., et al. Inward and outward permeability of
the blood-retinal barrier. In: Ocular Fluorophotometry and the Future, J. Cunha-
Vaz and E. Leite, eds. Amsterdam: P Kugler & Ghedini Pub., 1989, pp. 89–97.
14. Hosaka, A. Permeability of the blood-retinal barrier in myopia. An analysis
employing vitreous fluorophotometry and computer simulation. Acta Ophth.
Suppl. 185:95–99, 1988.
15. Larsen, J., Lund-Andersen, H., and Krogsaa, B. Transient transport across
the blood-retina barrier. Bull. Math. Bio. 45:749–758, 1983.
16. Lund-Andersen, H., Krogsaa, B., la Cour, M., and Larsen, J. Quantitative
vitreous fluorophotometry applying a mathematical model of the eye. Invest.
Ophth. Vis. Sci. 26:698–710, 1985.
17. Lund-Andersen, H., Krogsaa, B., and Larsen, J. Calculation of the perme-
ability of the blood-retinal barrier to fluorescein. Graef. Arch. Clin. Exp.
Ophth. 222:173–176, 1985.
18. Oguru, Y., Tsukahara, Y., Saito, I., and Kondo, T. Estimation of the perme-
ability of the blood-retinal barrier in normal individuals. Invest. Ophth. Vis.
Sci. 26:969–976, 1985.
19. Palestine, A. G., and Brubaker, R. F. Pharmacokinetics of fluorescein in the
vitreous. Invest. Ophth. Vis. Sci. 21:542–549, 1981.
20. Friedrich, S. W., Cheng, Y L., and Saville, B. A. Finite element modelling of
drug distribution in the vitreous humour of the rabbit eye. Ann. Biomed. Eng.
25(2):303–314, 1997.
21. Friedrich, S. W., Saville, B. A., and Cheng, Y L. Drug distribution in the
vitreous humor of the human eye: the effects of intravitreal injection position
and volume. Curr. Eye Res. 16(7):663–669, 1997.
22. Baum, J. Therapy for ocular bacterial infection. Trans. Ophthalmol. Soc. U.K.
10:569–577, 1986.
23. Kattan, H. M., Flynn, H. W., Pflugfelder, S. C., et al. Nosocomial
endophthalmitis survey. Current incidence of infection after intraocular sur-
gery. Ophthalmology 98:227–228, 1991.
24. Peyman, G. A., and Schulman, J. A. Intravitreal drug therapy. In: Intravitreal
Surgery. Norwalk: Appleton-Century-Crofts, pp. 407–455.
25. Speaker, M. G., and Menikoff, J. A. Postoperative endophthalmitis: patho-
genesis, prophylaxis, and management. Int. Ophthalmol. Clin. 33:51–79, 1993.
26. The Retina Society Terminology Committee. The classification of retinal
detachment with proliferative vitreoretinopathy. Ophthalmology 90:121–125,
1983.
27. Goldberg, M. F. Diseases affecting the inner blood-retinal barrier. In: The
Blood-Retinal Barriers, Cunha-Vaz, J. G., eds. New York: Plenum Press, 1979,
pp. 309–363.
28. Frank, R. N. The mechanism of blood-retinal barrier breakdown in diabetes.
Arch. Ophthalmol. 103:1303–1304, 1985.
220 Friedrich et al.
Copyright © 2003 Marcel Dekker, Inc.
29. Friedrich, S. W., Saville, B. A., and Cheng, Y L. Drug distribution in the
vitreous humour of the human eye: the effects of aphakia and changes in
retinal permeability and vitreous diffusivity. J. Ocular Pharm. Therap.
13(5);445–459, 1997.
30. Kaiser, R., and Maurice, D. M. The diffusion of fluorescein in the lens. Exp.
Eye Res. 3:156–165, 1964.
31. Sebag, J. Aging of the vitreous. Eye 1:254–262, 1987.
32. Maurice, D. M., and Mishima, S. Ocular pharmacokinetics. In: Pharmacology
of the Eye. Vol. 69, Handbook of Experimental Pharmacology, Sears, M. L.,
ed. New York: Springer-Verlag, 1984, p. 72.
33. Davis, B. K. Diffusion in polymer gel implants. Proc. Natl. Acad. Sci. USA
71:3120–3123, 1974.
34. Blinkhorst, C. Corneal and retinal complications after cataract extraction.
The mechanical aspect of endophthalmodonesis. Ophthalmology 87:609–617,
1980.
35. Algvere, P. V., Hallnas, K., Dafgard, E., et al. Panretinal photocoagulation
aggravates experimental proliferative vitreoretinopathy. Graef. Arch. Clin.
Exp. Ophthalmol. 228:461–466, 1990.
36. Tsukahara, Y., and Maurice, D. M., Local pressure effects on vitreous
kinetics. Exp. Eye Res. 60:563–574, 1995.
Drug Distribution in Vitreous Humor 221
Copyright © 2003 Marcel Dekker, Inc.
7
Anterior Segment Microdialysis
Kay D. Rittenhouse
Pfizer Inc., San Diego, California, U.S.A.
I. INTRODUCTION
Preservation of sight is the major objective of many scientific studies.
Topically administered drugs effectively treat many important ocular dis-
eases. Short-term efficacy endpoints are sometimes difficult to assess fol-
lowing these treatment approaches. Hence, it is important to determine
whether therapeutically relevant concentrations reach the site of action, as
in other regions of the body. The anterior chamber of the eye is a rela-
tively straightforward region for sampling. Anatomically accessible by
paracentesis procedures, it is possible to obtain a single sample for mea-
surement of drug concentrations. However, challenges are encountered
when time-course or steady-state data are collected. Repeat sampling of
this region is not possible by conventional methods in general.
Traditionally, rabbits or other mammal species have been used for the
assessment of intraocular concentrations of topically administered drugs.
In order to obtain time-course data in aqueous humor, many animals are
required, with each time point requiring multiple individual aqueous
humor samples following sacrifice. These procedures present a number
of challenges to be managed.
The anterior segment is an interesting and important ocular region for
exploration with research tools such as microdialysis. More than 20 papers
describing microdialysis approaches for assessment of ocular drug delivery
and endogenous substrate characterization have been published, which
include both vitreous and aqueous humor sampling.
223
Copyright © 2003 Marcel Dekker, Inc.
II. PHYSIOLOGICAL CONSIDERATIONS OF THE
ANTERIOR SEGMENT
Aqueous humor, the watery solvent produced by the ciliary body in the
posterior chamber, is, in part, an ultrafiltrate of plasma (1). However, a
number of the electrolytes are present in higher concentration in aqueous
humor than in blood, providing evidence of active secretory and metabolic
components to aqueous form ation. For example, ascorbate and lactate are
20-fold and 2-fold higher in concentration in aqueous relative to plasma,
respectively (2). Aqueous humor serves a nutritive role for avascularized
ocular tissues such as the cornea, trabecular meshwork, and lens (2).
A. Aqueous Humor Formation and Turnover
1. Inflow Dynamics
Blood, presented at the ciliary body arterioles at relatively high hydrostatic
pressure ($ 30 mmHg) (3–5), is converted into aqueous humor through
complex and not completely characterized ways. The protein concentration
in aqueous humor is less than 1% of that present in plasma (1). Plasma
proteins are prevented from entry into aqueous humor by the tight junctions
located at the nonpigmented ciliary epithelium, a component of the so-called
blood-aqueous barrier, analogous to the blood-brain barrier (1). Active
secretion of electrolytes such as sodium, deposited at the intercellu lar clefts
of the tight junction regions of the nonpigmented ciliary epithelium, provide
for a concentration gradient favoring fluid flow from the ciliary processes to
the posterior chamber (6). A number of active secretory pathways have been
identified (7,8) with specific active transport systems such as Na
þ
/K
þ
-
ATPase and others providing a major contribution. The formed aqueous
humor flows into the posterior chamber, down a pressure gradient, and is
transported via convective bulk flow through the pupil into the anterior
chamber, where the pressure is $ 16 mmHg (6).
2. Outflow Dynamics
Return of aqueous humor to the systemic circulation is facilitated by the
lower pressure of the episcleral venous system ($ 9 mmHg) relative to the
anterior chamber ($ 16 mmHg), as aqueous percolates through the trabe-
cular meshwork and collects into the canal of Schlemm (1). A second pres-
sure-independent pathway, called the uveoscleral route, provides an
important contribution to aqueous outflow in humans. In contrast, rabbits
have virtually no aqueous outflow by this route (9). Resistance to flow, or
aqueous humor outflow facility, is used to describe the passive resistance of
224 Rittenhouse
Copyright © 2003 Marcel Dekker, Inc.
the trabecular meshwork to the passage of aqueous humor (10,11). The
pressure-independent flow pathway behaves like a constant-rate pump;
however, no metabolically dependent process has been identified as a driv-
ing force for pressure-independent flow (11). The uveoscleral pathway is
described as the slow entry of aqueous humor through the face of the ciliary
body just posterior to the scleral spur, with movement by bulk flow through
the tissue and absorption into the uveal vessels or into periocular orbital
tissues (10). There is considerable discussion concerning whether or not a
significant energy-dependent component of the outflow pathway exists (10).
The cells of the trabecular meshwork have phagocytic activity (12–14),
which may contribute to increased facility of outflow. Trabecular meshwork
outflow is biologically active, providing biochemical modulation of a passive
physical process (10).
The relationship between inflow and outflow provides a means for
estimating the intraocular pressure (IOP). This relationship is described as:
IOP ¼
F À U
C
þ Pv
where F is aqueous humor formation, or flow, U is pressure-insensitive flow,
C is the facility of inflow or pressure sensitive flow, and Pv is the episcleral
venous pressure (2).
III. AQUEOUS HUMOR DYNAMIC IMPACT ON ANTERIOR
SEGMENT DRUG DISPOSITION
The pharmacokinetics of drugs in aqueous humor is complex. Aqueous
turnover, as well as availability of unbound substrate (i.e., tissue binding),
complicate the assessment of ocular clearance. Anterior chamber volume in
rabbit and humans is estimated to be $ 250À300 mL. Aqueous humor turn-
over is $ 1 % of anterior chamber volume ð$ 2:5 mL/min) (15). In the ante-
rior chamber environment, volume and clearance are not independent in the
sense that drug clearance is a function of aqueous turnover and turnover
rate is a function, in part, of anterior chamber volume (16). The nature of
aqueous humor turnover and the pharmacodynamics of drugs that affect
aqueous formation can also complicate the characterization of drug disposi-
tion. As drug is absorbed and exerts the pharmacological effect resulting in
decreased aqueous humor formation, for example, the resulting aqueous
concentrations are elevated relative to that of substrates that would not
exert this effect (17). Tissue binding and drug lipophilicity, for example,
provide input into the dispositional characteristics of the drug. Systemic
effects can also influence the ocular disposition of drugs. Analgesia may
Anterior Segment Microdialysis 225
Copyright © 2003 Marcel Dekker, Inc.
result in decreased aqueous humor turnover (17), which in turn results in
elevated aqueous humor drug concentrations.
IV. MICRODIALYSIS SAMPLING OF AQUEOUS HUMOR
A. Important Problems in the Anterior Chamber
1. Anterior Segment Pharmacokinetics
The ocular pharmacokinetics of ophthalmic drugs has been evaluated for
many years by paracentesis sampling of anterior chamber aqueous. Lee et
al. (18) examined the systemic disposition of a series of beta-adrenergic
antagonists following topical administration to the pigmented rabbit (18)
in order to establish the relationship between the physicochemical drug
properties and absorption pathways. The efficiency of nasolacrimal punc-
tum occlusion for minimization of systemic exposure and increased local
absorption also was examined. Ross et al. (19) reported a propranolol
aqueous humor C
max
of $ 5000À5500 ng/mL ($ 10À11 ng/mL/mg, dose
normalized) in anesthetized rabbits with paracentesis sampling. Others
have examined the aqueous humor disposition of propranolol and other
beta-adrenergic antagonists using this sampling technique (19–21).
Disadvantages to this approach include the large number of animals
required for evaluation and that paracentesis sampling is usually a terminal
procedure.
Rabbits are the species of choice for most ocular pharmacokinetic
experiments, although work in the cat, dog, and prim ate has been reported
(22,23). The rabbit eye is similar to the human eye in size and aqueous
humor volume. The rabbit eye has a thinner corneal thickness (0.35 mm
vs. 0.52 mm in humans) (9), slower blink reflex (9), a nictitating membrane
(absent in humans) (24), and virtuall y no uveoscleral outflow pathway (9).
2. Approaches to the Assessment of Modulation of Aqueous
Humor Inflow and Outflow
In order to study pharmacodynamics of drugs that affect aqueous humor
formation and turnover, a number of techniques have been developed.
Approaches such as fluorophotometry have been used (25,26). In essence,
fluorophotometry is a noninvasive technique that uses sophisticated instru-
mentation for the evaluation of the anterior chamber time course of topi-
cally or systemically administered fluorescing compounds such as
fluorescein or fluorescein conjugates; the dilution of a topically or systemi-
cally administered dye in aqueous is measured without direct assay of aqu-
eous humor contents. This procedure is advantageous for use in the clinical
226 Rittenhouse
Copyright © 2003 Marcel Dekker, Inc.
setting due to its lack of invasive sampling. Measurement of fluorescein in
the eye using fluorophotometry is a somewhat complex procedure with a
number of possible sources of error (25). Tonography, also a noninvasive
approach, can be used to assess aqueous humor formation indirectly.
Briefly, tonography tests the ability of the eye to recover from the elevation
of IOP induced by a tonometer. Such recovery primarily occurs through
increased outflow of aqueous humor (27). Tonography depends on the
assumption that aqueous humor formation is insensitive to moderate
changes in IOP; the facility of trabecular meshwork outflow is estimated.
This method neglects the pseudofacility compon ent. With this approach, it
is difficult to separate out the different contributions to facility (27).
Constant pressure perfusion techniques have been used to estimate outflow
facility (28–30 ). A phenomenon described as a ‘‘washing-out’’ effect is com-
monly observed with the use of this method; the perfusion results in the
clearing of macromolecules (30) usually present at the trabecular meshwork
that partially occlude these outflow channels (10). Inaccuracy in flow esti-
mates can result since time dependent changes in facility are observed (29).
An invasive approach used by Miichi and Nagataki (31) to estimate aqueous
humor formation involves the assessment of the time course of ‘‘dilution’’ of
a nondiffusable compound or dye, which is perfused at a constant rate into
aqueous humor. Perturbation of the rate of dilution of the dye can be
estimated via a change in the time course of the dye following administra-
tion of the pharmacological agent. The time-course data are approximated
mathematically employing nonlinear least-sq uares regression analysis in
order to obtain aqueous humor flow parameters perturbed by drugs that
affect inflow. This method offers some attractive features in the quantitation
of the physiological effect. However, the technical procedures are quite
involved, with numerous intrusions simultaneously to the same eye (31–36).
B. Principles of Microdialysis: Probe Design and
Recovery
Microdialysis offers a novel means for obtaining samples of biological fluids
while providing a relatively clean matrix, which may require little or no
sample preparation prior to analysis. However, microdialysis, in general,
does not provide meaningful information concerning endogenous or exo-
genous compounds implicitly. Microdialysis is a means of collecting the
sample for further analysis. The dialysate must be analyzed by other con-
ventional analysis techniques. Such analytical techniques used in conjunc-
tion with microdialysis include high-performance liquid chromatography
(HPLC) (37,38), capillary electrophoresis (39, 40), UV-visible spectrophoto-
metry (41), and liquid scintillation spectroscopy (42).
Anterior Segment Microdialysis 227
Copyright © 2003 Marcel Dekker, Inc.
1. Principles of Dialysis
Dialysis involves the separation of two compartments containing differing
concentrations of a solute in solution by a semi-permeable membrane. This
membrane allows passage of solutes of sufficien tly small size from one co m-
partment to the other along a concentration gradient. Theoretically, the
solute concentration in both compartments will establish equilibrium such
that there is no net flux of solute; the concentration of solute not bound to
nonpermeable macromolecules then will be equal in both compartments.
The solute diffusion rate, as described by Fick’s law, is a function of mem-
brane surface area, thickness, concentration gradient, compartment volume,
and ligand diffusion coefficient (43).
Tissue and plasma proteins often bind drugs and other low molecular
weight compounds. Hypothesis regarding mechanisms of binding include
the generally held view that a reaction occurs between two oppositely
charged ions (essentially salt formation). Negatively charged drugs bind to
the positively charged amino acid groups, such as histidine or lysine, of
plasma proteins. Additional contributions to binding phenomena include
hydrophobic interactions (44). Nonpolar functional groups of drug and
protein or tissue interact via van der Waals forces.
Pharmacodynamic effects of drugs are considered to be a function of
the unbound concentration in plasma (45). For this reason, it is important
to determine the unbound (i.e., therapeutically relevant) concentration of
pharmacological agents. Dialysis techniques are well suited to make these
determinations. In the anterior chamber, low co ncentrations of proteins are
encountered (4). However, under conditions of compromised blood-aqu-
eous barrier, an increased influx of proteins from plasma may result in
elevated aqueous protein concentrations (46). Under these conditions, the
assessment of unbound concentrations in aqueous humor may become more
important in the establishment of the pharmacodynamics arising from
intraocular exposures to the substrate in question.
Microdialysis is a dynamic process. Perfusion medium is perfused
through the probe. Analyte concentrations in perfusate and in the surround-
ing medium are not in equilibrium (41). This introduces a number of tech-
nical problems that must be overcome in creative ways. Microdialysis is a
relatively sophisticated tool. There are a number of challenges to appropri-
ate use of this technique. Although nonspecific binding to the microdialysis
membrane is minimized as compared to other dialysis methods, plastic
tubing is used to deliver perfusate to the probe and to deliver the dialysate
from the probe to the collection vessel. Nonspecific binding to the tubing is
possible (47). This situation can be exacerbated when coupling microdialysis
directly to other instrumentation since longer tubing usually is required. In
228 Rittenhouse
Copyright © 2003 Marcel Dekker, Inc.
experimentsexaminingplasmaproteinbindingofdruginvivo,microdialy-
sisrequiressufficienttimetoachievestableconcentrations.Thisprocess
requiresmoretime(thanultrafiltration,forexample),andrecoveryofsub-
strateacrossthemembranecanbetime-andtemperature-dependent.
2.MicrodialysisProbeDesignIssues
Theuniqueanddynamicenvironmentoftheanteriorchamberprovides
featuresamenabletomicrodialysissampling.Continuousflowofaqueous
humorabouttheprobetippreventsthecreationofmicroenvironmentsnear
theprobemembrane.Thisisanimportantadvantageformicrodialysisuse
inthisorganasopposedtoplacementinotherextracellularspaces.Special
problemsthatdevelopforspecificplacementintotheanteriorchamber
includefibrinformation(17),whichmustbecircumventedinordertopre-
ventreducedrecoveryofsubstrateinprobeeffluent.Additionally,dueto
possibledisruptionoftheblood-aqueousbarrier,proteininfluxmayalter
thedrugdispositionofhighlyprotein-boundsubstrates(17).
Specificadvantagestomicrodialysisuseforanteriorchambersam-
plingare:
1.Thereisnoextractionofinternalaqueoushumorfluids;IOPis
notadjustedartificiallysinceaqueoushumorvolumeisnot
alteredbyinfluxoffluids.
2.Microdialysissamplingofbothpharmacologicalagentandendo-
genoussubstrateisperformedsimultaneously.
3.Althoughthismethodinvolvessomeintrusionviasurgicalplace-
mentofthemicrodialysisprobeintotheanteriorchamber,a
morequantitativeapproachtotheestimationofaqueous
humorformationratesandpharmacokineticexperimentationis
possiblethanwithmanyconventionalnoninvasiveapproaches.
Fukadaetal.(48–50)usedalinearprobedesignthatinvolvedbothentry
andexitportsthroughtheanteriorchamber,asimilarapproachtothat
takenbyMachaandMitra(51,52).Fortheirworkinconsciousanimals,
Rittenhouseetal.(19,53,54)modifiedaconcentricmicrodialysisprobe
designaccordingtotheschemepresentedinFigure1,incorporatinga908
bendintheprobeshaftforeachofanchoringtheprobetothescleraofthe
rabbiteye.InFigure2,aphotographofanintactrabbiteyewithamicro-
dialysis probe in the anterior chamber is presented.
3. Microdialysis Probe Recover y
A major concern in using microdialysis as a tool for the determination of
unbound drug concentrations in the in vivo as well as in vitro settings is the
Anterior Segment Microdialysis 229
Copyright © 2003 Marcel Dekker, Inc.
also be time- and temperature-dependent. Typical recovery values observed
in the literature range from a low of $ 10 up to 100%. By maximizing the
dialysis membrane length, significant increases in recovery can be realized.
Decreases in perfusion flow rate also increase the relative recovery (although
they also decrease the available sample volume). The recovery of solute can
be difficult to ascertain. Ideally, probe perfusate composition should closely
match the environment of the medium in which it is placed. The probe also
can create a microenvironment near the probe surface, which may be dif-
ferent than the medium more distant from the membrane (47). Several
different types of recoveries are evaluated in micr odialysis studies; these
include relative recovery (or concentration recovery) and absolute recovery
(mass recovery). Relative recovery is the fraction of solute obtained in the
dialysate relative to the actual concentration in the medium in which the
probe is placed. Absolute recovery is the total amount of solute collected
over a specified time period. A number of approaches are used to estimate
the recovery of a solute by the microdialysis probe, including water recov-
ery, no-net-flux (or difference method), perfusion rate, and relative loss
(55,56).
The water-recovery method is of limited use for in vivo settings
because drug diffusion characteristics are usually different in artificial aqu-
eous physiological buffers or solutions than in the dynamic in v ivo environ-
ment. Where a solid in vitro–to–in vivo correlation is established, the water-
recovery method has utility. For this method, the microdialysis probe is
placed in a reservoir (usually stirred) containing a known concentration of
solute. The perfusion medium, an aqueous solution of similar composition
to the medium in which it is placed but without solute, is delivered through
the probe at a constant rate. Dialysate is collected and the amount of solute
determined via appropriate analytical methods. The ratio of the dialysate
concentration of the known concentration of the medium in which the probe
is placed is the relative recovery. This method is known to underestimate the
concentration in the medium sampled (55) .
The point of no-net-flux or difference method is used for in vitro and
in vivo studies. By varying the concentration of solute in the perfusion
medium and fixing the solute concentration in the surrounding medium,
the dialysate solute concentration is assessed. The direction of the concen-
tration gradient of solute depends on whether the concentration in the
perfusion medium is higher or lower than the concentration in the surround-
ing medium (55). A plot of the perfusate solute concentration versus the
difference in concentration between perfusate and dialysate is constructed;
the x-intercept identifies the concentration at whi ch no net flux of solute
occurs (55). In theory, this value will be the concentration of the surround-
ing medium. This method is very time-cons uming.
Anterior Segment Microdialysis 231
Copyright © 2003 Marcel Dekker, Inc.
The perfusion rate method is based on the principle that recovery is
dependent on the rate of perfusate transit through the probe. With an
increase in perfusate transit, there is a corresponding decrease in relative
recovery. Conversely, the lower the perfusion rate, the higher the relative
recovery. For the perfusion rate method, the initial surrounding medium
contains no solute and the probe is perfused with a fixed concentra tion of
solute (55). This method is the most exhaustive in that several different
surrounding media concentrations must be assessed separately, each at dif-
ferent perfusion rates (in vitro). A typical experiment might evaluate four
different concentrations for the medium at three diff erent perfusion rates
each over an extended period. Frequently regression models are employed
to provide the best estimates of probe performance. Typically for in vivo
determinations, the lowest possible perfusion rate (e.g., 0.1 mL=min) is
selected. This maximizes the relative recovery to nearly 100% in some
cases. At such low flow rates, longer collection times are required to obtain
sufficient sample for further analysis.
The relative loss method is similar to the water-recovery method, but is
operated in reverse. Rather than placing a known concentration of solute in
the medium surrounding the probe, the solute concentration of the perfusate
is fixed. The surrounding medium, which in most situations contains small
quantities of solute (i.e., sink conditions), then provides a negative concen-
tration gradient of the solute. The net loss of solute reflects the relative loss
of solute to medium. This method , which is based on the premise that
recovery is the same in both directions across the membrane (47), is by
far the simplest to use in the in vivo setting and provides a reliable estimate
of recovery. Relative loss is the ratio of the difference in perfusate to dialy-
sate solute concentrations to the perfusate concentration (56). This method
is often referred to as retrodialysis recovery. Under nonsink conditions of
the surrounding medium, an internal standar d is sometimes employed.
C. Anterior Versus Posterior Chamber Sampling
Anterior chamber aqueous microdialysis sampling approaches have been
explored by a number of researchers (16,17,48–54). Challenges that were
managed using this approach include sensitivity of the eye to immunopro-
tective cascades following manipulation (17) and the requirement of the
protection of visual function, also a major concern for any procedures
proposed for observation of ocular pathophysiology or ocular pharmacoki-
netic/pharmacodynamic experimentation.
In published reports as early as the 1940s, researchers attempted to
obtain information regarding aqueous endogenous substrate concentrations
in the posterior versus the anterior chambers. Becker (57) and Kinsey and
232 Rittenhouse
Copyright © 2003 Marcel Dekker, Inc.
Palmer (58,59) examined posterior chamber versus anterior chamber aqu-
eous humor ascorbate concentrations. Rittenhouse et al. (53) used a micro-
dialysis approach to estimate posterior versus anterior chamber ascorbate
aqueous concentrations; the probe tip was introduced into the anterior
chamber and directed through the pupil towards the posterior chamber.
The posterior chamber is a much smaller region ($ 55 mLVs$ 250 mL
for the anterior chamber) and provides additional challenges due to size
constraints.
V. CASE STUDIES OF MICRODIALYSIS USE IN THE
ANTERIOR SEGMENT
A. Ocular Pharmacokinetics
Recently, drug disposition in the anterior segment has been explored using
microdialysis. Fukuda et al. (48–50) were the first to examine the utility of
microdialysis sampling of anterior chamber aqueous humor. In their studies,
linear probes inserted into the temporal cornea through the anterior cham-
ber and exteriorized out of the nasal cornea were used to examine intrao-
cular disposition of fluoroquinolones following oral or topical
administration of ofloxacin, norfloxacin, or lomefloxacin in the anesthetized
rabbit (48,49). Fukada et al. (48) characterize d the ocular pharmacokineti cs
(C
max
, T
max
, T
1=2
) of ofloxacin. Sato et al. [of the same laborat ory as Fukada
(49)] were able to conclude that lomefloxacin penetrated into aqueous
sooner and was eliminated faster than norfloxacin. In later experiments,
Ohtori et al. [of the same laboratory as above (50)] examined the ocular
pharmacokinetics of timolol and carteolol in rabbit s shortly after recovery
from anesthesia. A 5 mm cellulose membrane (50 kDa) linear probe of fused
silica (0.2 mm o.d., 23 g tubing) was used. In vitro recoveries of 16–20% for
norfloxacin/lomefloxacin and $ 17À22% for timolol and carteolol were
reported. Pigmented rabbits (1.5–3.0 kg) were studied. The surgery involved
stitching the nictitating membrane in order to immobilize the eye followed
by the insertion of a 23 gauge needle attached to one end of the probe in the
temporal cornea and passing the needle through anterior chamber and out
of nasal side. The exteriorized tubing was glued at the puncture sites with
epoxy resin. The polyethylene tubing was taped to the face of the rabbit.
Rittenhouse et al. (16) developed an animal model for the evaluation
of microdialysis sampling of aqueous humor to assess the ocular absorption
and disposition of beta-adrenergic antagonist drugs. For this study using
anesthetized dogs (n ¼ 3Þ and rabbits ðn ¼ 3Þ, microdialysis probes (10 mm
CMA/20) were implanted in the anterior chamber. Immediately following
probe implantation ($ 30 min), a single dose of ½
3
HDL-propranolol was
Anterior Segment Microdialysis 233
Copyright © 2003 Marcel Dekker, Inc.
administeredtopicallyorintracamerallyinordertoestimateintraocular
bioavailabilityof[
3
HDL-propranolol.[
3
HDL-Propranololcollectedfrom
probeeffluentwasassayedbyliquidscintillationspectroscopy.Theresults
ofthisstudyindicateda10-foldhigherintraocularexposuretopropranolol
intherabbitrelativetothedog(F
AH
$0:55vs.$0:056).Timetopeakwas
longerinthedogrelativetotherabbit($87vs.$54min),andtheterminal
rateconstantforthedogwas$twofoldhigherthantherabbitð$0:0189vs.
$0:00983).Propranolrecoveriesof$32À45%werereported.Theresults
obtainedinthisinitialexaminationofpropranololdispositioninaqueous
humorusingmicrodialysiswerehighlyvariable.Ingeneral,aqueoushumor
proteinconcentrationswouldhaveminimalinfluenceonocularexposure(3)
duetothelowconcentrationspresent.However,sincepropranololisa
highlyprotein-boundsubstrate(45),Rittenhouseetal.(17)examinedthe
possibilitythattime-dependentproteinbindingmighthavebeenacontri-
butingfactortovariabilityinparameterestimates,duetosurgicalinsult
fromprobeimplantationandsubsequentincreasedinfluxofproteinsinto
aqueoushumor.Inaddition,anesthesiaisaknowncontributortoaltera-
tionsinthepharmacokineticsandpharmacodynamicsofdrugs(60).Thus,
developmentofrelevantexperimentaltechniquesforuseinconsciousani-
malswasimperative.
Followingredesignofthemicrodialysisprobesforanteriororposter-
iorchamberplacement(4mm,CMA/20with908bend)(Fig.1)inthe
conscious rabbit, studies were conducted with propranolol (17) to esti mate
the intraocular exposure (AUC
AH
), time to peak ðT
max
Þ, and aqueous
humor peak concentrations ðC
max
Þ following a >5-day recovery. This
minimum recovery period was established by following the time course
of ocular wound healing and anterior segment resorption of fibrin, a
phenomenon that could result in reduced substrate recovery via microdia-
lysis aqueous humor sampling. Briefly, the surgical probe implantation
procedure for New Zealand white rabbits (2.3–50 kg) proceeded as fol-
lows: A limbal-based conjunctival flap was created superior nasally or
temporally $ 3 mm from the limbus. A 10–12 mm conjunctival pocket
was prepared, and the probe inlet/outlets were exteriorized to the top of
head. A 20 gauge needle was inserted $ 2À3 mm from limbus into the
anterior chamber and removed. The microdialysis probe was then placed
into the opening and the anchor of probe sutured to the sclera and
covered with conjunctiva. Propranolol ocular pharmacokinetic parameter
estimates obtained from a previous study (16) were compared to those
obtained in the present study (17). It was observed that reduced dose-
normalized AUC
AH
and C
max
were obtained in the previous study relative
to the present study ($ 1:9-fold relative to anesthetized results with >5-day
recovery period). It was hypothesized that time-dependent aqueous humor
234 Rittenhouse
Copyright © 2003 Marcel Dekker, Inc.