Textbook of Neuroanaesthesia and Critical Care - part 3 doc
Bạn đang xem bản rút gọn của tài liệu. Xem và tải ngay bản đầy đủ của tài liệu tại đây (649.4 KB, 52 trang )
Pa
g
e 77
A similar correlation has been found between SEP amplitude and cerebral blood flow. SEP monitoring can be easier to maintain as
monitoring SEP amplitude produces only a single number which is more easily interpreted than the complex waveform seen with
EEG. Metaanalysis of a number of series of SEP monitoring during surgery shows that SEP has a sensitivity of about 96%.
33
A number of centres monitor some index of cerebral blood flow as opposed to neurophysiological monitoring. Two of the more
commonly applied methods are carotid stump pressure and transcranial Doppler. There are no controlled trials directly comparing
outcome between neurophysiological monitoring and transcranial Doppler. EEG would appear to be at least as sensitive though
possibly less specific than transcranial Doppler.
34
Comparison of stump pressure monitoring with EEG in the same patients would
suggest that stump pressure monitoring is possibly more sensitive with similar specificity.
31
S
pinal Surgery
Operations which compromise the spinal cord or its blood flow can also be monitored using evoked potentials. Examples of such
surgery include removal of spinal cord tumours and vascular malformations. There is also a small but significant risk of spinal cord
damage associated with the surgical management of scoliosis. This occurs particularly with sublaminar wiring. The integrity of the
spinal cord can be assessed by continuous monitoring of the SEP throughout the surgery. This can be done by recording the cortical
SEP or spinal SEP with epidural electrodes. Monitoring of the spinal SEP has the advantage of being more robust and resistant to
changes in anaesthetic concentration and blood pressure.
There is no direct evidence from controlled clinical trials that monitoring reduces the incidence of complications. However, the
occurrence and degree of preoperative changes correlate with the postoperative deficit and the risk of postoperative deficit is reduced
if the electrophysiological changes can be reversed.
35,33
A multicentre survey has shown a lower incidence of complications in those
centres where scoliosis surgery is performed with spinal monitoring performed by experienced staff.
36
Other Procedures
In many neurosurgical procedures neurophysiological monitoring may be useful in minimizing the surgical morbidity. In pituitary
gland surgery VEPs may be useful in monitoring for optic chiasm damage.
37
SEP and BAEP are useful means of monitoring
brainstem function during surgery in posterior cranial fossa.
38,39
SEP and EEG monitoring allow detection of developing cerebral
ischaemia in aneurysm surgery.
40,41
Electro
p
h
y
siolo
g
ical Monitorin
g
in the Intensive Care Unit
The techniques of neurophysiology provide a useful extension of clinical examination in the assessment of patients in the intensive
care unit. In particular, there are four areas where neurophysiological methods are beneficial:
1. making specific diagnoses;
2. continuous EEG or evoked potential monitoring of critically ill patients;
3. management of status epilepticus;
4. using EEG and evoked potentials to predict outcome.
EEG and S
p
ecific Dia
g
noses
While many neurological conditions are associated with changes on the EEG, the number of conditions with specific diagnostic EEG
changes is limited.
42
Examples of these include herpes simplex encephalitis, post measles encephalitis and Creutzfeldt-Jakob disease
(Fig. 5.9). There is also a subgroup of patients who may not be able to have an MRI scan for clinical reasons, in whom the EEG may
p
oint towards lateralized pathology such as ischaemia or space-occupying lesions before changes appear on CT scanning.
Continuous Monitorin
g
The possibility of continuous EEG monitoring is very attractive. The goal of such monitoring would be to allow the clinician to
detect cerebral dysfunction before it has become irreversible. In particular, the EEG demonstrates cerebral ischaemia, which may not
be immediately obvious in the sedated patient, and subclinical seizures
43
. While the EEG reflects changes in intracranial pressure,
this may not be relevant in centres with continuous intracranial pressure monitoring.
However, there are considerable difficulties involved in establishing continuous EEG monitoring in the ICU setting. First, it is
technically difficult to maintain a continuous low-noise, low-impedance connection between the patient and the EEG machine. To
maintain a continuous connection therefore requires
Pa
g
e 78
Figure 5.9
EEG in generalized status epilepticus. The EEG shows
continuous high-amplitude epileptiform activity.
special training of the nursing staff and several daily visits by the technician. Monitoring is also impeded by multiple generators of
artefact in the ICU setting. High-frequency electrical noise is generated by other computerized equipment in the ICU. Mechanical
ventilators generate both mechanical and electrical rhythmical artefact. Nursing procedures and chest physiotherapy can generate a
large amount of mechanical artefact that is in the frequency range of the EEG.
44
Because of the large amount of data generated by
continuous monitoring, the EEG is often supplemented by some form of automated EEG processing (Lifescan, CFAM or compressed
spectral array).
Given the considerable investment of time and resources required for continuous EEG monitoring in the ICU, it is pertinent to
question the benefits of continuous monitoring. One study of patients with a variety of different neurological diagnoses showed that
the EEG had a significant impact on patient management in 50% of cases.
45
In a study of 18 patients with carotid stenosis the EEG
showed alteration when the patients were subjected to hypotensive or hypertensive stress and this information was a factor in
considering patients for surgery.
46
Recent studies in acute stroke have shown that certain EEG patterns are predictive of a poor
outcome and allow diagnosis of cerebral infarction before changes are seen on CT scanning.
47
Further, continuous monitoring allows
detection of cerebral ischaemia and vasospasm in patients with subarachnoid haemorrhage, allowing treatment to begin earlier.
48
In
one study alterations in the processed EEG predicted vasospasm before transcranial Doppler in 70% of cases.
49
In severe head trauma
and postneurosurgical patients continuous EEG monitoring allows the immediate diagnosis and treatment of non-convulsive status
epilepticus. Unfortunately, there are no controlled trials assessing the objective benefit to morbidity and mortality of continuous
EEG. The indirect evidence that continuous EEG monitoring allows the detection of subclinical seizures and ischaemia suggests that
when available, EEG monitoring is a useful adjunct to other forms of CNS monitoring in the management of the unconscious patient.
Pa
g
e 79
The EEG in Status E
p
ile
p
ticus
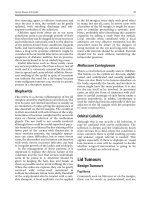
The EEG is an important tool in the management of both convulsive status epilepticus and non-convulsive status epilepticus (Fig.
5.10). While status epilepticus is a medical emergency and treatment should not be delayed if an EEG is not available, clinical
examination alone may result in misdiagnosis of status epilepticus for two reasons. First psychogenic status is a common cause of
diagnostic confusion. In one study 20% of patients presenting to an accident and emergency department of a tertiary referral centre
with intractable convulsive movements had psychogenic seizures.
49
Second non-convulsive status is underrecognized and patients
with non-convulsive status are often mislabelled as being confused or postictal.
43
Once treatment for convulsive status is established, the role for the EEG is not clear. Certainly in sedated patients treated with
general anaesthesia, continuous EEG monitoring allows immediate recognition and treatment of seizures. Seizure activity increases
cerebral metabolic rate of oxygen and causes excitotoxic cell damage.
50,51
Continuous EEG monitoring facilitates adequate seizure
control without overtreatment in status epilepticus and reduces this risk of excitotoxic cell damage. While there are no controlled
trials to support this conclusion, there is some indirect evidence. Mortality in status epilepticus increases with the duration of
seizures.
52
It is therefore reasonable to assume that early detection of subclinical seizures in the ICU reduces mortality and mortality.
Where continuous EEG monitoring is not available it is reasonable to obtain an EEG daily while the patient remains unconscious and
to consider performing an
Figure 5.10
EEG in Creutzfeldt–Jakob disease. The EEG shows a
characteristic
p
attern of
p
eriodic
p
ositive shar
p
wave com
p
lexes.
θ δ
δ θ α
δ
Pa
g
e 81
Table 5.1 Prognostic validity of Synek's grading system
63
EEG pattern Survive
d
Die
d
Benign
15.9% 1.6%
Uncertain
14.3% 13.2%
Malignant
0 55%
mately half of the 'uncertain' group died. Since about 30% of patients fell into this category, the grading system fails to fulfil the
criteria of being a universally applicable prognostic test. In essence, it only provides prognostic information for 70% of the patient
group studied.
A convenient model for studying non-traumatic coma is that of coma following cardiac arrest in hospital. In this patient group the
onset of coma is clearly documented and the timing of the EEG can be easily controlled. Four recently published studies adopting
this model are summarized in Table 5.2.
64–67
In essence, they confirm the trend seen in the retrospective studies: an EEG pattern
regarded as 'malignant' is a useful predictor of poor outcome but patterns regarded as 'benign' or 'uncertain' do not appear to predict a
good outcome.
Furthermore, a prospective study in traumatic coma,
68
although difficult to compare with the findings in non-traumatic coma (the
data are presented as a correlation between EEG score and Glasgow Outcome Score), found a correlation between EEG score and
outcome. However, the EEG did not add any further information to that provided by clinical assessment alone. The EEG is therefore
a useful extension of clinical examination and is particularly helpful when clinical assessment is impeded. However, it is not always
p
ossible to make an accurate prediction of outcome on the basis of the EEG alone.
The Somatosensory Evoked Potential (SEP)
The SEP has several advantages over the EEG in assessing outcome. In the EEG there are many patterns which have to be
subjectively graded whereas the SEP is either present or absent, delayed or not delayed, with a normal or abnormal waveform. Many
studies have looked at using the SEP to predict outcome in both traumatic and hypoxic coma. These are summarized in Table 5.3.
64–
66,69–74
To compare studies, we divided SEP findings into three groups:
1. normal SEP where the latency and the waveform of the SEP were within acceptable limits;
2. unilaterally abnormal SEP where the SEP is either delayed, absent from one hemisphere or has an abnormal waveform;
3. bilaterally absent SEP.
As with the EEG, the SEP accurately identifies a group of patients who do badly. Patients with bilaterally absent SEP will invariably
have a bad outcome. These findings are supported by a systematic review of prediction of poor outcome in anoxic ischaemic coma.
Pooled data from 11 studies showed that a bilaterally absent SEP is the most accurate predictor of a poor outcome.
75
However, if the
SEP is present patients may still do badly, so in this group of patients the SEP does not provide any additional prognostic
information. Unlike the EEG, which is generated by the brain alone, the SEP may be influenced by injuries
Table 5.2 Summary of four prospective studies looking at EEG grade and outcome in hypoxic/ischaemic coma
(from references
64–67
)
Authors No. of
patients
No. with benign,
uncertain or
grades I–III
No. with good
outcome
(GOS 3–5)
No. with malignant or
grades IV
or V
No. with bad
outcome Death
or PVS
Chen et al
34
12 5 22 20
Rothstein et al
40
29 14 11 11
Scollo et al
26
12 5 14 12
Bassetti et al
60
40 12 20 20
Total
160
93 36 66 61
Pa
g
e 82
Table 5.3 Using SEP to predict outcome in coma (from references
64–66,69–74
)
Author No. of
patients
Normal
SEP
No. with
good
outcome
Abnormal
SEP
No. with
good
outcome
Absent
SEP
No. with
good
outcome
Cant et al 40(T) 21 17 5 3 14 2
Judson et al 100(T) 38 33 26 19 36 3
Bassetti et al 60(H) 20 10 12 1 23 0
Brunko et al 50(H) 20 5 Not given Not given 30 0
Chen et al 34(H) 16 7 6 2 12 0
Goldie et al 36(T) 16 9 8 2 12 6
Rothstein et al 40(H) 14 11 7 3 19 0
Goldberg 24(H+T) 4 4 15 9 5 0
Goodwin 37(H+T) 8 6 2 0 29 0
H = hypoxic/ischaemic coma
T = traumatic coma
elsewhere in the nervous system, including the peripheral nerves and spinal cord. There are a number of studies where the SEP grade
or central conduction time is correlated with final outcome or disability score, in all of which the SEP was more effective than
clinical examination alone.
58,76,77
B
rainstem Auditor
y
Evoked Potential (BAEP)
The BAEP has a number of theoretical advantages over the SEP for assessing prognosis. It is less likely to be influenced by injury
elsewhere in the nervous system. It would appear logical to assume that the brainstem is the most critical point in determining
survival so assessing brainstem function should give a good guide as to prognosis. Again, the value of BAEP in assessing prognosis
has been investigated in a number of studies.
60,78,79
Some of these are reviewed in Table 5.4. A significant relationship between
interpeak latency and mortality has also been shown.
80
An abnormal BAEP does not always imply a poor outcome and in three of the four studies reviewed, a significant number of
survivors had an abnormal BAEP. BAEP would appear to be less useful than the SEP in prediction of outcome.
E
ven
t
-Related Potentials
These are scalp potentials produced in response to a simple discrimination task and are probably the electrophysiological
representation of cognitive processing. They are probably generated by subcortical/cortical and cortico/cortical circuits and therefore
have a potential theoretical application in predicting coma outcome since they depend on an extensive network of connections. One
such potential, the P300, was used to predict outcome in a group of 20 patients
81
in non-traumatic coma. The relationship to outcome
in this study is summarized in Table 5.5.
The P300 is useful to identify a subgroup of patients who will improve but unfortunately does not identify those patients who will do
badly. Another auditory event-related potential is the mismatch negativity (MMN) in oddball paradigms of AEP recording. The
relationship of MMN to outcome was examined in a group of hea
d
-injured patients
82
and is summarized in Table 5.6.
The other interesting finding in this study was the role of MMN in predicting awakening. They found a subgroup of 13 patients in
whom the MMN was initially absent but later returned. The return of the MMN always preceded clinical awakening (by 24 h to 21
days).
R
ole of Functional Imagin
g
Functional imaging techniques such as positron emission tomography (PET), single photon emission computed tomography (SPECT)
and functional magnetic resonance imaging (fMRI) allow an accurate determination of regional cerebral blood flow and metabolism.
Studies with SPECT in acutely brain-injured patients can potentially be used to estimate the severity of brain injury and to predict
clinical outcome.
83,84,85
In addition, early studies have shown a strong correlation between alteration in the EEG and changes in
cerebral blood flow elucidated with PET.
86
Pa
g
e 83
Table 5.4 Summary of studies looking at outcome and BAEP (from references
60,78,79
)
Author No. of
patients
No. with
normal BAEP
No.of
survivors
No. with
abnormal
BAEP
No. of
dead or
PVS
Cant et al 40 32 19 8 7
Karnaze et al 26 19 17 7 4
Karnaze et al 45 29 28 16 8
Goldberg 32 16 16 16 5
Studies which combine functional imaging with EEG and evoked potentials will allow a greater insight into the changes in cerebral
blood flow and metabolism which underlie the changes which are seen on the EEG in acute brain injury. This knowledge may allow
EEG to be even more widely applied in determining the severity of brain injury and predicting clinical outcome.
Conclusion
There are significant correlations between parameters measured by many of the neurophysiological techniques and outcome.
However, none of the techniques listed above is sufficiently accurate to predict outcome in all cases. Can the accuracy of these
neurophysiological techniques be improved? A number of studies have examined the predictive value of combinations of either EEG
and SEP
63,65
or SEP and BAEP.
87
As the EEG or BAEP is less effective at predicting outcome than SEP, the combinations are not
much more effective than SEP alone. However, a combination of bilateral SEP and EEG is easily obtained and interpreted. The EEG
may give other useful information such as the detection of epileptiform activity or burst suppression. Using these techniques, a group
of patients in whom there is a high probability of a bad outcome can be identified. More specialized techniques such as event-related
potentials may have a role in patients with prolonged coma, particularly in predicting awakening. In the future it is predicted that
functional imaging in combination with neurophysiology will widen the scope for the clinical assessment of brain-injured patients.
Table 5.5 P300 and outcome in non-traumatic
coma (from reference
81
)
Awake No awakening
P300 present 5 1
P300 absent 4 10
Summar
y
EEG, nerve conduction studies and evoked potentials provide a safe and inexpensive means of monitoring brain function in the
operating theatre and the intensive care unit. We hope that the newer techniques will shed light on the causes of the evolution in the
EEG that occurs in anaesthesia and cerebral injury. An increasing understanding of the alterations in cerebral physiology which
underlie electrophysiological changes in unconscious patients is likely to improve our ability to draw firm clinical conclusions based
on the EEG.
Acknowled
g
ements
We would like to thank Mr Nicholas Carvill, Dr Julian Ray and Mr Martin Coleman for their assistance in the preparation of this
manuscript.
Table 5.6 MMN and outcome in traumatic coma
(from reference
82
)
Alive Dead
MMN present 35 1
MMN absent 4 14
References
1. Creutzfeldt OD, Watanabe S, Lux HD. Relations between EEG phenomena and potentials of single cortical cells. Spontaneous and
convulsoid activity. Electroencephalogr Clin Neurophysiol 1966; 20: 19
–
37.
2. Thatcher R, John ER. Foundations of cognitive processes. 1977, Wiley, NewYork.
Pa
g
e 84
3. Creutzfeldt OD. The neural generation of the EEG. In: Redmond A (ed) ECN handbook, vol. 2, part C, 1974, Elsevier,
Amsterdam.
4. Li CL, Jasper HH. Microelectrode studies of the cerebral cortex of the cat. J Physiol 1953; 121: 117
–
140.
5. Burns BD. Some properties of the cat's isolated cortex. J Physiol 1950; 111: 50
–
68.
6. Jasper H. Diffuse projection system: the integrative action of the thalamic reticular system. Electroencephalogr Clin Neurophysiol
1949; 1: 405
–
409.
7. Maugiere F. Evoked potentials. In: Osselton JW (ed) Clinical neurophysiology, Butterworth-Heinemann, Oxford, 1995, pp 323–
334.
8. Hughes JR. The EEG in clinical practice, 1994. Butterworth-Heinemann, Boston.
9. Jasper HH. The ten-twenty electrode system of the international federation. Electroencephalogr Clin Neurophysiol 1958; 10: 371–
375.
10. Aminoff MJ. Electroencephalography: general principles and clinical applications. In: Aminoff MJ (Ed) Electrodiagnosis in
clinical neurology. Churchill Livingstone, NewYork, 1986, pp 21
–
76.
11. Blume WT, Kaibara M. Atlas of adult electroencephalography. 1995, Raven Press, NewYork.
12. Blume WT. Atlas of paediatric electroencephalography. 1982, Raven Press, NewYork.
13. Aminoff MJ, Eisen AA. AAEM mimeograph 19: somatosensory evoked potentials. Muscle Nerve 1998; 21: 277
–
290.
14. McPherson D, Starr A. Auditory evoked potentials in the clinic. In: Haliday AM (ed) Evoked potentials and clinical testing, 2nd
edn. Churchill Livingstone, London, 1993, pp 383
–
420.
15. Halliday AM. The visual evoked potential in healthy subjects. In: Haliday AM (ed) Evoked potentials and clinical testing, 2nd
edn. Churchill Livingstone, London, 1993, pp 358
–
379.
16. Bickford RG. Newer methods of recording and analysing EEG. In: Klass DW, Daly DD (eds) Current practice of clinical
electroencephalography. 1979, Raven Press, NewYork.
17. Gregory TK, Pettus, DC. An electroencephalographic processing algorithm specifically intended for analysis of cerebral
electrical activity. J Clin Monit 1986; 2: 190
–
197.
18. Maynard DE, Prior PF, Scott DF. Device for monitoring of cerebral activity in resuscitated patients. BMJ 1969; 4: 545
–
546.
19. Sebel PS, Maynard DE, Major E, Frank, M. The cerebral function analysing monitor (CFAM). Br J Anaesth 1983; 55: 1265–
1270.
20. Bauer G, Bauer R. EEG drug effects and central nervous system poisoning. In: Niedermyer E, Lopes Da Silva F (eds)
Electroencephalography 4th edn. Williams and Wilkins, Baltimore, 1998, pp 671
–
691.
21. McPherson RW. Neuroanaesthesia and intraoperative monitoring. In: Niedermyer E, Lopes Da Silva F (eds)
Electroencephalography 4th edn. Williams and Wilkins, Baltimore, 1998, pp 1092
–
1106.
22. Niedermyer E. Neurosurgical treatment of the epilepsies. In: Niedermyer E (ed) The epilepsies. Urban and Schwarzenberg,
Munich, 1990, pp 342
–
368.
23. Rampil IJ, Mateo RS. Spectral edge frequency
—
a new correlation of anaesthetic depth. Anaesthesiology 1987; 50: S12.
24. Yate PM, Maynard DE, Major E. Anaesthesia with ICI 35 868 monitored by the cerebral function analysing monitor. Eur J
Anaesth 1986; 3: 159
–
166.
25. Samra SK, Vandezant, CW, Domer PA, Sackellares JC. Differential effects of isoflurane on human median nerve somatosensory
evoked potentials. Anaesthesiology 1987; 66: 29
–
35.
26. Sebel PS, Flynn PJ, Ingram DA. Effect of nitrous oxide on visual, auditory and somatosensory evoked potentials. Br J Anaesth
1984; 54: 1403
–
1407.
27. Sundt TM, Sharborough FW, Piepgras DG, Kearns TP, Messick JM, O'Fallon WM. Correlation of cerebral blood flow with
electroencephalographic changes during carotid endarterectomy. Mayo Clin Proc 1981; 56: 533
–
543.
28. Igvar DH, Sjolund B, Ardo A. Correlation between dominant EEG frequency and cerebral oxygen uptake and blood flow. Clin
N
europhysiol 1976; 41: 268
–
276.
29. Rampil IJ, Holzer JA, Quest DO, Rosenbaum SH, Correll JW. Prognostic value of computerised EEG during carotid
endarterectomy. Anaesth Analg 1983; 62: 186
–
192.
30. Ballotta E, Dagiau G, Saladini M et al. Results of electroencephalographic monitoring of 369 revascularisations. Eur Neurol
1997; 37: 43
–
47.
31. McCarthy WJ, Park AE, Koushanpour E, Pearce WH, Yao JS. Carotid enarterectomy. Lessons from intraoperative monitoring —
a decade of experience. Ann Surg 1996; 224: 297
–
305.
32. Fisher RS, Raudzens P, Nunemacher M. Efficacy of intraoperative neurophysiological monitoring. J Clin Neurophysiol 1995; 12:
97
–
109.
33. Plestis KA, Loubser P, Mizrahi EM, Kantis G, Jiang ZD, Howell, JF. Continuous electroencephalographic monitoring and
selective shunting reduces the neurologic morbidity rates in carotid endarterectomy. J Vasc Surg 1997; 25: 620
–
628.
34. Arnold M, Sturzenegger M, Schaffler L, Seiler RW. Continuous intraoperative monitoring of middle cerebral artery blood flow
velocities and electroencephalography during carotid endarterectomy. A comparison of the two methods to detect cerebral ischaemia.
Stroke 1997; 28: 1345
–
1350.
35. May DM, Jones SJ, Crockard HA. Somatosensory evoked potential monitoring in cervical surgery: identification of pre- and
intraoperative risk factors associated with deterioration. J Neurosurg 1996; 85: 566
–
573.
Pa
g
e 85
36. Nuwer MR, Dawson EG, Carlson LG, Kanim LEA, Sherman JE. Somatosensory evoked potential spinal cord monitoring reduces
neurological defecits after scoliosis surgery: results of a large multicentre survey. Electroencephalogr Clin Neurophysiol 1985; 96:
6
–
11.
37. e Costa Silva I, Wang AD, Symon L. The application of flash visual evoked potentials during operations on the anterior visual
p
athways. Neurol Res 1985; 7: 11
–
16.
38. Grudy BL, Janetta PJ, Lina A, Procopio PT, Boston JR, Doyle, E. Intraoperative monitoring of brainstem auditory evoked
p
otentials. J Neurosurg 1982; 57: 674
–
681.
39. Grundy BL, Lina A, Doyle E, Procopio P. Somatosensory cortical evoked potential monitoring neurosurgical operations. Anaesth
Analg 1982; 55: 462
–
466.
40. Little JR, Lesser RP, Luders H. Electrophysiological monitoring during basilar aneurysm operations. Neurosurgery 1987; 20:
421
–
427.
41. Symon L, Wang AD, Costa e Silva IE, Gentili F. Perioperative use of somatosensory evoked potential monitoring in aneurysm
surgery. J Neurosurg 1984; 60: 269
–
270.
42. Niedermyer E. Abnormal EEG patterns (epileptic and paroxysmal). In: Niedermyer E, Lopes Da Silva F (Eds)
Electroencephalography 4th edn. Williams and Wilkins, Baltimore, 1998, pp 235
–
261
43. Jordan, KG. Neurophysiologic monitoring in the neuroscience intensive care unit. Neurol Clin North Am 1995; 13: 579
–
626.
44. Chiappa KH, Hoch DB. Electrophysiological monitoring In: Roper A (ed) Neurological and neurosurgical intensive care, 3rd
edn. Raven Press, New York, 1993, pp 147
–
183.
45. Jordan KG. Continuous EEG monitoring (CEEG) in the neuroscience intensive care unit. Neurology 1990; 40(suppl 1): 180.
46. Suzuki A, Yoshioka K, Yasui N. Clinical applications of EEG topography in cerebral ischaemia: detection of functional
reversibility and haemodynamics. Brain Topogr 1990; 3: 167
–
174.
47. Jordan KG. Regional attenuation without delta (RAWOD): a distinctive early EEG pattern in acute cerebral infarction.
N
eurology 1998; 50(suppl 1): A243.
48. Vespa PM, Nuwer MR, Juhasz C. Early detection of vasospasm after acute subarachnoid haemorrhage using continuous EEG
ICU monitoring. Electroencephalogr Clin Neurophysiol 1997; 103: 607
–
615.
49. Luther JS, McNamara JO, Carwile S. Pseudo-epileptic seizures: methods and video analysis to aid diagnosis. Ann Neurol 1982;
12: 458
–
461.
50. Meldrum, BS, Brierly JM. Prolonged epileptic seizures in primates: ischaemic cell changes and its relationship to ictal
p
hysiologic events. Arch Neurol 1993; 28: 10
–
15.
51. Nevander G, Ingvar M, Auer R. Status epilepticus in well oxygenated rats causes neuronal necrosis. Ann Neurol 1985; 18: 281.
52. Young GB, Jordan KG, Doig GS. An assessment of non-convulsive seizures in the intensive care unit using continuous EEG
monitoring: an investigation of variables associated with mortality. Neurology 1996; 47: 83
–
89.
53. Teasdale G, Jennett, B. Assessment of outcome and impairment of consciousness. A practical scale. Lancet 1974; 2(7872): 81–
84.
54. Signorini DF, Andrews PJD, Jones PA, Wardlaw JM, Miller JD. Predicting survival using simple clinical variables: a case study
in traumatic brain injury. J Neurol Neurosurg Psychiatry 1999; 66: 20
–
25.
55. Becker DP, Miller JD, Greenberg RP. Prognosis after head injury. In: YoumansJR (Ed) Neurological surgery. WB Saunders,
Philadelphia 1982, pp 2137
–
2174.
56. Hokaday JM, Potts F, Epstein E, Bonazzi A, Schwabb RS. EEG changes in acute cerebral anoxia from cardiac or respiratory
arrest. Electroencephalogr Clin Neurophysiol 1965; 18: 575
–
586.
57. SynekVM. Value of a revised EEG coma scale for prognosis after cerebral anoxia and diffuse head injury. Clin
Electroencephalogr 1990; 21(1): 25
–
30.
58. Rae-Grant AD, Barbour PJ, Reed J. Development of an EEG rating scale for head injury using dichotomous variables.
Electroencephalogr Clin Neurophysiol 1991; 79: 349
–
357.
59. Evans BM, Bartlett JR. Prediction of outcome in severe head injury based on recognition of sleep related activity in the
p
olygraphic electroencephalogram. J Neurol Neurosurg Psychiatry 1995; 59(1): 17
–
25.
60. Karnaze DS, Marshall LF, Bickford RG. EEG monitoring of clinical coma: the compressed spectral array. Neurology 1982; 32
(3): 289
–
292.
61. Gutling E, Gonser A, ImhofHG, Landis T. EEG reactivity in the prognosis of severe head injury. Neurology. 1995; 45(5): 915–
918.
62. Hulihan JF Jr, Syna DR. Electroencephalographic sleep patterns in post-anoxic stupor and coma. Neurology 1994; 44(4): 758–
760.
63. Synek VM. Validity of a revised EEG coma scale for predicting survival in anoxic encephalopathy. Clin Exper Neurol 1989; 26:
119
–
127.
64. Chen R, Bolton CF, Young B. Prediction of outcome in patients with anoxic coma: a clinical and electrophysiologic study. Crit
Care Med 1996; 24: 672
–
678.
65. Scollo-Lavizzari G, Bassetti C. Prognostic value of EEG in post-anoxic coma after cardiac arrest. Eur Neurol. 1987; 26(3): 161–
170.
66. Bassetti C, Bomio F, Mathis J, Hess CW. Early prognosis in coma after cardiac arrest: a prospective clinical,
electrophysiological, and biochemical study of 60 patients. J Neurol Neurosurg Psychiatry 1996; 61(6): 610
–
615.
67. Rothstein TL, Thomas EM, Sumi SM. Predicting outcome in hypoxic-ischemic coma. A prospective clinical and
electrophysiologic study. Electroencephalogr Clin Neurophysiol 1991; 79(2): 101
–
107.
Page 86
68. Rae Grant AD, Eckert N, Barbour PJ et al. Outcome of severe brain injury: a multi-modality neurophysiologic study. J Trauma
1996; 40(3): 401
–
406.
69. Cant BR, Hume AL, Judson JA, Shaw NA. The assessment of severe head injury by short-latency somatosensory and brain-stem
auditory evoked potentials. Electroencephalogr Clin Neurophysiol 1986; 65(3): 188
–
195.
70. Brunko E, Zegers-de-Beyl D. Prognostic value of early cortical somatosensory evoked potentials after resuscitation from cardiac
arrest. Electroencephalogr Clin Neurophysiol 1987; 66(1): 15
–
24.
71. Goodwin SR, Friedman WA, Bellefleur, M. Is it time to use evoked potentials to predict outcome in comatose children and
adults? Crit Care Med 1991; 19(4): 518
–
524.
72. Goldberg G, Karazim E. Application of evoked potentials to the prediction of discharge status in minimally responsive patients: a
p
ilot study. J Head Trauma Rehab 1998; 13(1): 51
–
68.
73. Judson JA, Cant BR, Shaw NA. Early prediction of outcome from cerebral trauma by somatosensory evoked potentials. Crit Care
Med 1990; 18: 363
–
368.
74. Goldie WD, Chiappa KH, Young RR, Brooks ER. Brainstem auditory and short latency somatosensory evoked responses in brain
death. Neurology 1981; 31: 248
–
256.
75. Zandbergen EJG, De Haan RJ, Stoutenbeek CP, Koelmen HTM, Hijdra A. Systematic review of early prediction of poor
outcome in anoxic-ischaemic coma. Lancet 1998; 352: 1808
–
1812.
76. Houlden DA, Li C, Schwartz ML, Katic M. Median nerve somatosensory evoked potentials and the Glasgow Coma Scale as
p
redictors of outcome in comatose patients with head injuries. Neurosurgery 1990; 27(5): 701
–
707.
77. Lindsay K, Pasaoglu A, Hirst D, Allardyce G, Kennedy I, Teasdale G. Somatosensory and auditory brain stem conduction after
head injury: a comparison with clinical features in prediction of outcome. Neurosurgery 1990; 26(2): 278
–
285.
78. Karnaze DS, Weiner JM, Marshall LF. Auditory evoked potentials in coma after closed head injury: a clinicalneurophysiologic
coma scale for predicting outcome. Neurology 1985; 35(8): 1122
–
1126.
79. Karnaze DS, Marshall LF, McCarthy CS, Klauber MR, Bickford RG. Localizing and prognostic value of auditory evoked
responses in coma after closed head injury. Neurology 1982; 32(3): 299
–
302.
80. Facco E, Martini A, Zuccarello M, Agnoletto M, Giron GP. Is the auditory brain stem response effective in the assessment of
p
ost traumatic coma? Electroencephalogr Clin Neurophysiol 1985; 62: 332
–
337.
81. De Giorgio CM, Rabinowicz AL, Gott PS. Predictive value of P300 event related potentials compared with EEG and
somatosensory evoked potentials in non-traumatic coma. Acta Neurol Scand 1993; 87: 423
–
424.
82. Kane NM, Curry SH, Rowlands CA et al. Event-related potentials — neurophysiological tools for predicting emergence and
early outcome from traumatic coma. Intens Care Med 1996; 22(1): 39
–
46.
83. Kao CH, Wang PY, Wang YL, Chang L, Wang SJ, Yeh SH. A new prognostic index — leucocyte infiltration — in human
cerebral infarcts by 99Tcm-HMPAO-labelled white blood cell brain SPECT. Nuclear Med Comm 1991; 12: 1007
–
1012.
84. Roper SN, Mena I, King et al. An analysis of cerebral blood flow in acute closed head injury using technetium 99m-HMPAO
SPECT and computerised tomography. J Nuclear Med 1991; 32: 1684
–
1691.
85. Jacobs A, Put E, Ingels M, Bossuyt A. Prospective evaluation of technetium-99m HMPAO SPECT in mild to moderate traumatic
b
rain injury. J Nuclear Med 1994; 35: 942
–
947.
86. Jansen HML, Van Der Naalt J, Van Zomeren AH et al. Cobalt 50 positron emission tomography in traumatic brain injury: a pilot
study. J Neurol Neurosurg Psychiatry 1996; 60: 221
–
224.
87. Haupt WF, Pawlik G. Contribution of initial mediannerve somatosensory evoked potentials and brainstem auditory evoked
potentials to prediction of clinical outcome in cerebrovascular critical care patients: a statistical evaluation. J Clin Neurophysiol
1985; 15(2): 154
–
158.
88. Sigl JC, Chamoun NG. An introduction to bispectral analysis for the electroencephalogram. J Clin Monit 1994; 10: 392
–
404.
89. Glass PS, Bloom M, Kearse L, Rosow C, Sebel P, Manberg P. Bispectral analysis measures sedation and memory effects of
p
ropofol, midazolam, isoflurane, and alfentanil in healthy volunteers. Anesthesiology 1997; 86: 836
–
847.
90. Rampil IJ. A primer for EEG signal processing in anesthesia. Anesthesiology 1998; 89: 980
–
1002.
91. Tod
d
-MM. EEGs, EEG processing, and the bispectral index. Anesthesiology 1998; 89: 815
–
817.
Pa
g
e 87
6—
Bedside Measurements of Cerebral Blood Flow
Sarah Walsh & Basil F. Matta
Introduction 89
Kety
–
Schmidt Metho
d
89
Radioactive Tracer Clearance Techniques 90
Jugular Venous Bulb Oximetry 91
Jugular Thermodilution Technique 92
Laser Doppler Flowmetry 93
Thermal Clearance 94
N
ear Infrared Spectroscopy 94
Transcranial Doppler Ultrasonography 94
References 95
Pa
g
e 89
Introduction
Although alterations in cerebral blood flow (CBF) often accompany brain injury and exacerbate secondary neuronal injury,
1–3
the
management of neurologically critically ill patients does not routinely involve the monitoring of CBF.
4
This, in part at least, is due to
the lack of non-invasive, easy-to-use, reliable equipment that can measure CBF with well-defined thresholds.
However, the benefits of monitoring CBF in the brain-injured patient are becoming more apparent. In addition to avoiding the
dangers of transferring critically ill patients for 'single time point' measurements in the CT or PET scanner, continuous bedside
monitoring may detect transient ischaemic events. Furthermore, continuous assessment of CBF permits rapid diagnoses and early
therapeutic interventions, which may improve outcome. Unfortunately, many of the techniques available for the bedside
measurement of CBF are either cumbersome, have a large interobserver bias or depend on various assumptions for calculating CBF
and hence are indirect or open to criticism. This chapter will outline the methods most commonly employed for the measurement of
CBF in theatre and intensive care.
Ket
y
–Schmidt Method
The first practical quantitative method of measuring cerebral blood flow, now regarded as the gold standard, is the technique
described by Kety and Schmidt in 1945.
5,6
All CBF measurement techniques in use today are either derived from this method or have
been validated against it. This method, adapted from the original technique for the measurement of pulmonary blood flow, is based
on the Fick principle. Briefly, this states that the amount of a substance taken up or eliminated by an organ is equal to the difference
b
etween the amount in the arterial blood and the amount in the venous blood supplying that organ, in the same time period.
Thus for the brain:
where QBt is the quantity of tracer taken up by the brain in time t, QAt is the quantity of tracer delivered to the brain by arterial blood
in time t and QVt is the amount of tracer removed by cerebral venous blood in time t.
For the measurement of CBF using N
2
O, the subject inhales 10% nitrous oxide (N
2
O) in air for 10 min during which time arterial and
j
ugular bulb blood samples are taken and analysed for N
2
O content. The initial difference between the arterial and venous
concentrations of N
2
O decreases as the tracer is taken up by the brain. The brain tissue is fully saturated when jugular bulb and
arterial blood concentrations of N
2
O are almost equal.
The amount of N
2
O delivered to or removed by the brain thus equals CBF multiplied by the arterial or venous concentrations
respectively. As the arterial and venous concentrations of N
2
O vary with time, the equation can be rearranged:
where TF is cerebral blood flow (ml/min), A is arterial N
2
O concentration (ml/l) and V is venous N
2
O concentration. Thus:
CBF per gram weight of brain is then:
where W is the brain weight in grams (g).
It is not easy to measure the brain concentration of N
2
O (QB) clinically. However, if enough time is allowed for equilibration to
occur, then the brain N
2
O concentration will equal the partition coefficient of N
2
O (the amount of gas dissolved in the blood
Figure 6.1
The Kety–Schmidt technique for measuring cerebral
blood flow using the freely diffusible tracer N
2
O.
After 10 min of N
2
O inhalation, the brain is theoretically
saturated with the arterial and venous concentrations
of N
2
O almost equal. The shaded area between the
two curves is
p
ro
p
ortional to hemis
p
heric blood flow.
Pa
g
e 90
relative to brain) multiplied by the cerebral venous concentration:
7
where λ is the partition coefficient, 1.06 in the case of nitrous oxide, and Vt is the cerebral venous concentration of nitrous oxide at
equilibrium. This yields the final expression:
It is then possible to calculate CBF once the arterial and cerebral venous concentrations of N
2
O are measured.
Once CBF is determined, additional values such as cerebral metabolic requirement for oxygen and vascular resistance may be
derived. N
2
O offers significant advantages over other agents used for the measurement of CBF in that it is safe, stable, cheap, readily
available and, most importantly, has a partition coefficient unaffected by varying levels of lipid and water and hence is unlikely to
change with age or cerebral oedema.
8,9
However, the original KetySchmidt technique for measuring CBF has a number of
limitations.
10–12
Timely arterial and jugular bulb blood samples are required. In order to reduce extracranial contamination, the
position of the jugular bulb catheter must be confirmed radiographically with the tip at the level of and just medial to the mastoid
bone. The Van Slyke manometric technique for measuring N
2
O concentration in blood, used in the original experiments, required
large volumes of blood and an experienced operator has now been replaced by more efficient, less operator-dependent methods for
measuring N
2
O concentration. These include gas chromatography and infrared spectroscopy.
13,14
Finally, CBF calculated by this technique represents the mean blood flow from the area of the brain (plus some extracranial tissues)
draining into the particular jugular venous bulb being sampled: the ipsilateral cerebral hemisphere. Therefore, the Kety–Schmidt
method of CBF measurement is unable to discriminate between grey and white matter and is insensitive to regional changes in
flow.
15
Radioactive Tracer Clearance Techni
q
ues
As an extension to Kety's work, the introduction of radioisotope techniques for the measurement of CBF allowed the progression
from global CBF measurements to two-dimensional maps of cortical blood flow.
2,16,17
The radioactive isotope (initially
85
krypton,
now replaced with
133
xenon) dissolved in saline is injected into the internal carotid artery and the radioactivity is measured using a
number of scintillation counters placed externally over the scalp.
18
By using tracers which are relatively insoluble in blood and so are
eliminated in one passage through the lungs, the arterial concentration is zero during the period of measurement. The
133
Xe is taken
up into the brain and, like nitrous oxide, this radioactive inert gas enters and leaves depending on its physical properties (diffusion
and solubility). Hence, following injection, it will distribute and rapidly equilibrate throughout the brain tissue. After completion of
injection, CBF can then be measured by the exponential pattern of clearance of the gas from the brain and hence from the body.
Scintillation crystals placed externally over the scalp, so that each counter looks at a defined volume of brain, record the γ-emissions
of
133
Xe. The signals from the crystals are fed through pulse height analysers and clearance curves are created. Mean blood flow
through the volume of brain 'seen' by each crystal is thus:
where λ = brain-blood partition coefficient, Hmax = maximal height of the clearance curve, H10 = height at 10 min, A = area under
clearance curve.
In humans, when clearance curves are plotted on a semilogarithmic scale, two rates of exponential decay representing flow through
grey and white matter are
Figure 6.2
Measurement of CBF using intracarotid injection of
133
Xe.
Blood flow is calculated from the maximal height (H
max
)
and inte
g
ration of the area under the curve
(
A
)
.
Pa
g
e 91
identified. Using a process termed 'exponential stripping', it is possible to identify the individual components of blood flow.
The inert gas clearance method can be applied quite easily to the bedside measurement of CBF and portable units are available. The
technique is relatively simple and is reliable and reproducible. Patient and operator radiation exposure is low, enabling repeated
studies on a patient, and since
133
Xe has a low solubility in blood and hence is rapidly cleared from it, further studies can be
performed within approximately 30 min.18 An obvious advantage of this method over the Kety–Schmidt technique is the absence of
repeated blood sampling. Other advantages include the ability to calculate either the 'mean' flow value from height/area under the
curve analysis or more specific regional flow rates by exponential stripping. The accuracy and specificity of this method depend on
the number and size of externally placed detectors.
19
With a larger number of detectors (up to 254 detectors have been used), it is
possible to measure flow in discrete lesions and detection of even small changes in blood flow associated with functional brain
activation is possible.
Disadvantages of the clearance technique for bedside CBF measurement include the necessity for carotid artery puncture, potential
inaccuracies from variations in the partition coefficient of
133
Xe in normal or abnormal brain tissue,
20–22
and the 'look-through'
artefact phenomenon,
23
where the external detectors pick up highly perfused brain tissue but not ischaemic areas.
Figure 6.3
Compartmental analysis of CBF using a semilogarithmic
plot. The curve shows flow through grey and white
matter or fast and slow com
p
onents res
p
ectivel
y
.
The inert gas clearance techniques have been modified over the years to reduce the disadvantages and enhance their applicability in
the bedside measurement of CBF. The radioactive isotope commonly used is
133
Xe because of its short half-life and its γ-emissions,
which are easily detected by scintillation counters. The method of administration of the radioactive isotope has also been altered to
either the less hazardous intravenous route
24
or the non-invasive inhalation route.
25
Both approaches use the same external detectors
as with the intraarterial approach, applying the same principles and theory. These routes of administration of xenon have reduced
morbidity over the intraarterial route and certainly the inhalation technique is relatively non-invasive. In addition, with the advance o
f
technology, the reduction in size of apparatus and microprocessor-based computers, equipment has become far more portable and
user friendly for application in the intensive care unit or the ward.
However, the non-invasive techniques are not without their disadvantages. As well as exposing the whole body to radiation,
inhalation of radioactive xenon distorts the clearance curves because of isotope recirculation. This necessitates the measurement of
endtidal
133
Xe and performing a correction computation which accounts for this recirculation. The presence of radioactive isotope in
the scalp and extracranial tissues requires a further correction before accurate estimations of CBF are possible.
Ju
g
ular Venous Bulb Oximetr
y
Jugular venous bulb oximetry, first described in 1927 and frequently used in the intensive care of patients with brain injury,
26
can
also be utilized as a bedside tool to estimate CBF.
27–29
Cerebral blood flow and metabolism are closely coupled. Therefore, during
periods of constant cerebral metabolism, CBF can be determined from the arteriovenous oxygen content difference across the
cerebral circulation (AVDO
2
).
30,31
The AVDO
2
can be measured using a Co-oximeter or it can be calculated using the equation:
where CaO
2
is the arterial oxygen content, CjvO
2
the jugular venous content, Hb the haemoglobin concentration, SaO
2
the arterial
oxygen saturation, PaO
2
the arterial partial pressure of oxygen, SjvO
2
the jugular venous oxygen saturation and PjvO
2
the jugular
venous partial pressure of oxygen.
Pa
g
e 92
Although this simple, relatively non-invasive method for estimating CBF can act as an 'early warning device' for cerebral ischaemia,
particularly in head-injured patients undergoing mechanical ventilation, the technique has several limitations. AVDO
2
is a global
measure that cannot reliably detect regional ischaemia. Although sampling from the right jugular bulb has been commonly assumed
to provide the best estimate of hemispheric blood flow (the cortex is preferentially drained via the right jugular bulb),
32
this may not
apply in all patients or conditions. For example, significant differences in oxygen content between the left and right jugular bulb
blood have been demonstrated in head-injured patients.
33
Other factors that can affect the accuracy of CBF estimation using jugular
bulb oximetry include contamination of jugular bulb blood with extracerebral blood, malpositioning of the catheter tip, speed of
blood withdrawal from the catheter and the position of the patient's head.
34,39
Therefore, for best results, radiographic confirmation of
catheter tip position (at the level of and just medial to the mastoid bone), withdrawal of blood at a rate < 2 ml/min and careful
attention to head position are mandatory.
Ju
g
ular Thermodilution Techni
q
ue
This technique, first used to measure coronary sinus flow by Ganz et al,
40
has been successfully adapted to measure CBF with
reasonable accuracy.
41–43
A catheter is placed in the jugular bulb and the position of its tip confirmed radiographically. Cold fluid is
then injected at a constant rate and the resulting change in temperature measured a short distance downstream with a built-in
thermistor.
Jugular venous flow, and hence CBF, are then calculated using the equation:
where Tb, Ti and Tm are the temperature of blood, indicator and mixture of blood and indicator respectively, Vb and Vi the volumes
(ml) of blood and indicator, λ
b
and λi the specific heat of blood and indicator, and ρ
b
and ρi the density of blood and indicator.
If time is brought into the equation, the volumes become flows and:
Figure 6.4
(Top trace) Diagrammatic representation of a
thermodilution catheter using two thermistors
which can be inserted in the jugular bulb for
the measurement of CBF. (Bottom trace)
This shows temperatures recorded by internal
and external thermistors over a period of 30 min
(Redrawn with permission from reference
43
).
If saline is used as the indicator:
When a preset pump determines the rate of saline infused, flow can be calculated.
This technique is simple, safe, reproducible and easy to apply at the bedside. Measurements can be repeated at frequent intervals and
as the 'indicator' is non-cumulative, there is no associated morbidity for the patient or clinician.
In addition to the limitations of jugular bulb catheters for the measurement of CBF, adequate mixing of the blood and injectate at the
thermistor, accurate injectate temperature recording and heat loss from the system may also affect the accurate measurement of CBF.
Pa
g
e 93
Laser Do
pp
ler Flowmetr
y
Laser Doppler flowmetry (LDF) is a relatively new technique for the measurement of local microcirculatory cerebral and spinal
blood flow. The flow estimate by this technique, first described by Williams et al in 1980,
44
is based on the assessment of the
Doppler shift of low-
p
ower laser light, which is scattered by the moving red blood cells (RBCs).
45,46
Briefly, monochromatic laser light, with a wavelength above maximal absorption of haemoglobin and below maximal absorption of
water (600–780 nm), is delivered to and detected from a 1mm
3
volume of brain tissue by a flexible fibreoptic light guide. The laser
light is scattered randomly by both static structures and moving tissue particles, mainly RBCs. Laser light reflected from stationary
tissues remains unchanged in frequency, whereas light reflected by moving particles is both scattered and undergoes a frequency
shift. Multiple scattering at various angles of incidence complicates and precludes the exact measurement of velocity of the moving
RBCs. However, as the bandwidth of the Doppler shift frequencies increases linearly in proportion to the RBCs' velocities when
tissue geometry remains constant, the mean frequency shift and the power are directly proportional to the velocity and the number of
moving RBCs respectively.
Figure 6.5
A graphic depiction of the principle of laser Doppler
flowmetry (Redrawn with permission from reference
55
).
As the blood cell flux is equal to the velocity of the cells multiplied by their concentration, if the concentration of the RBCs remains
constant, the power of the frequency-weighted Doppler spectrum is proportional to the RBC flux through the capillary bed and,
hence, CBF.
47
The Doppler shift back-scattered light is sampled by the detecting probe, which is present in the same flexible tubing. The signal is
then amplified, frequency analysed, squared, integrated and directed as a voltage signal. The laser Doppler flowmeter produces a
continuous, real-time flow output which is linearly related to CBF.
48–50
Currently available instruments cannot accurately quantify
absolute CBF and so relative changes are more meaningful.
Although LDF is a fast, continuous, non-radioactive bedside monitoring of CBF that can detect changes at the cellular level, there are
still many practical as well as theoretical limitations to overcome. The device is invasive, requiring insertion at operation or via a burr
hole. Changes in tissue perfusion are often accompanied by changes in the tissue geometry and may affect flow measurements.
Tissue density and geometry may also be altered after brain injury. Therefore, site selection is critical to the measurements due to the
high degree of spatial and temporal resolution. The probes are designed to
Figure 6.6
The theory behind laser Doppler flowmetry for
the measurement of CBF. Doppler frequency
and power depend on the speed of RBCs.
Bandwidth broadens as RBC speed increases
b
ut am
p
litude and sha
p
e remain constant.
Pa
g
e 94
measure capillary blood flow and so macroscopic vessels will strongly bias readings. Similarly, as the probes will measure flow
within approximately 1.5mm of the tips, the measurement area is extremely precise and localized. Therefore, caution must be
exercised in making assumptions about global cerebral blood flow. Other limitations to the technique include the problems of
movement artefacts: those of the patient, the probe relative to the tissue and also the individual optical fibres themselves. A further
source of false readings is the presence of arterioles and venules which elevate LDF signals, so overrepresenting microvascular blood
flow.
51–55
Thermal Clearance
Thermal diffusion flowmetry is used to estimate cortical blood flow by measuring changes in a temperature gradient which exists
between two gold plates within a probe applied to the cortex,
56,57
Although there are several systems available, the basic
measurement technique relies on detection of the temperature gradient between the large plate generating heat and the second smaller
detector plate. The difference in temperature between the two plates is inversely proportional to the thermal conductivity of the brain
tissue. The temperature gradient decreases as the flow increases so that:
where CBF is cortical blood flow, K is a constant, V is the voltage difference between the two plates at time of measurement and V
0
is the voltage difference at no flow.
58
The thermal diffusion CBF technique has been used to assess changes in cortical perfusion in many situations.
57,59–61
It has many
advantages in that it is simple, continuous and does not use ionizing radiation. However, in common with LDF, this technique also
suffers many limitations. Commercial devices available at present are not reliable enough for clinical use. Measurement of absolute
flow is not possible, as voltage difference at no flow cannot be determined in the clinical setting.
Near Infrared S
p
ectrosco
py
N
ear infrared spectroscopy (NIRS) is a non-invasive method of estimating cerebral oxygenation. In common with pulse oximetry,
N
IRS takes advantage of the relatively translucent nature of tissue and bone to light in the near infrared (NIR) region of the spectrum
(700–1000 nm). When NIR light enters a tissue it is both scattered and absorbed. Provided the geometry of the tissue remains
constant (and there is little evidence to suggest that this is the case in many situations where NIRS may be useful), the absorption of
N
IR light is proportional to the concentration of the chromophores (oxyhaemoglobin (HbO
2
), deoxyhaemoglobin (Hb) and oxidized
cytochrome aa3 (CytO
2
)), according to the modified Beer–Lambert Law which describes optical attenuation in a highly scattering
medium. 'Transmission spectroscopy', although possible in neonates, is not feasible in adults because of the large head and thick
skull. By placing the optodes a few centimetres apart on the same side of the head, it is possible to measure changes in cerebral
oxygenation in adults using 'reflectance spectroscopy'.
62
Despite the initial enthusiasm for this promising technology, there remain
many practical as well as theoretical limitations to overcome. It is important to understand both the assumptions on which NIRS is
b
ased and the limitations of this technology in order to interpret the results correctly.
N
IRS has been used as a non-invasive method of measuring changes in CBF and cerebral blood volume (CBV). Detailed explanation
of the principles involved have been described elsewhere (Ch. 9). Briefly, CBF can be measured using a modification of the Fick
principle. A sudden increase in SaO
2
produces a bolus of HbO
2
, which acts as an arterial tracer, which is measured in the arterial
system by the pulse oximeter and in the brain by NIRS. Similarly, CBV can be calculated by inducing small but slow changes in
SaO
2
and measuring changes in HbO
2
and Hb by NIRS. The potential advantages of being able to measure CBF and CBV non-
invasively are obvious but 30% of the data are rejected because of variations in the baseline NIR signal, MAP or end-tidal CO
2
.
Furthermore, data published by Owen-Reece et al suggest that the technique considerably underestimates CBF because of the optical
effects of extracranial tissue.
63
Hence further validation of these techniques is required before they can be adopted as part of normal
clinical practice.
Transcranial Do
pp
ler Ultrasono
g
ra
p
h
y
The transcranial Doppler ultrasonography (TCD) is a non-invasive monitor which calculates red blood cells (FV) in the large vessels
at the base of the brain using the Doppler shift principle.
64
The most commonly insonated vessel is the middle cerebral artery (MCA)
Pa
g
e 95
which carries about 75–80% of the ipsilateral carotid artery blood flow and thus is representative of hemispheric CBF. TCD
measures velocity and not flow and therefore, changes in FV only represent true changes in CBF when both the angle of insonation
and the diameter of the vessel insonated remain constant. The angle of insonation can be kept constant by fixing the probe in position
using a head strap or frame. There is also ample evidence suggesting that the diameter of the MCA does not change significantly with
changes in arterial pressure, carbon dioxide partial pressure or the use of anaesthetic or vasoactive agents.
65–70
Hence, it is generally
accepted that during steady-state anaesthesia, changes in FV reflect corresponding changes in cortical CBF.
TCD is covered elsewhere in this book (Ch. 8), so the details will not be repeated. TCD can be used with ease at the bedside to
monitor changes in FV safely, non-invasively and without detriment to the patient or clinician. It has no associated morbidity and is a
reliable, real-time monitor. However, it must be remembered that CBF indices are derived from measurements made on velocity, so
that TCD findings should not be used in isolation, as with any clinical measurement, but more to complement other monitoring
available in neurointensive care.
References
1. Bouma GJ, Muizelaar JP, Choi SC et al. Cerebral circulation and metabolism after severe traumatic brain injury: the elusive role
of ischemia. J Neurosurg 1991; 75: 685
–
693.
2. Langfitt TW, Obrist WD. Cerebral blood flow and metabolism after intracranial trauma. Prog Neurol Surg 1981; 10: 14.
3. Graham DI, Adams JH. Ischaemic brain damage in fatal head injuries. Lancet 1971; 1: 265
–
266.
4. Matta BF, Menon DK. Severe head injury in the United Kingdom and Ireland: a survey of practice and implications for
management. Crit Care Med 1996; 24: 1743
–
1748.
5. Kety SS, Schmidt CF. The determination of cerebral blood flow in man by the use of nitrous oxide in low concentrations. Am J
Physiol 1945; 143: 53
–
55.
6. Kety SS, Schmidt CF. The nitrous oxide method for the quantitative determination of cerebral blood flow in man: theory,
p
rocedure and normal values. J Clin Invest 1948; 27: 476
–
483.
7. Kety SS, Harmel MH, Brommell HT et al. The solubility of nitrous oxide in blood and brain. J Biol Chem 1948; 173: 487
–
496.
8. Mapleson WW, Evans DE, Flook V. The variability of partition coefficients for nitrous oxide and cyclopropane in the rabbit. Br J
Anaesth 1970; 42: 1033
–
1041.
9. Kozam RL, Landau SM, Cubina JM, Lukas DS. Solubility of nitrous oxide in biologic fluid and myocardium. J Appl Physiol
1970; 29: 593
–
597.
10. Sharples PM, Stuart AG, Aynsley-Green A et al. A practical method of serial bedside measurements of cerebral blood flow and
metabolism during neurointensive care. Arch Dis Child 1991; 66: 1326
–
1332.
11. Gibbs EL, Lennox WG, Gibbs FA. Bilateral internal jugular blood. Comparison of A-V differences, oxygendextrose ratios and
respiratory quotients. Am J Psychiatry 1945; 102: 184
–
190.
12. Kirsch JR, Traystman RJ, Rogers MC. Cerebral blood flow measurement techniques in infants and children. Pediatrics 1985; 75;
887
–
895.
13. Lawther PJ, Bates DV. A method for the determination of nitrous oxide in blood. Clin Sci 1952; 12: 91
–
95.
14. Swedlow DB, Lewis LE. Measurement of cerebral blood flow in children. Anesthesiology 1980; 53: S160.
15. Stocchetti N, Paparella A, Bridelli F et al. Cerebral venous oxygenation studied with bilateral samples in the internal jugular
veins. Neurosurgery 1994; 34: 38
–
44.
16. Lassen NA, Ingvar DH. The blood flow of the cortex determined by radioactive krypton. Experientia 1961; 17: 42.
17. Ingvar DH, Lassen NA. Quantitative determination of cerebral blood flow in man. Lancet 1961; 2: 806
–
807.
18. Anderson RE. Cerebral blood flow Xenon-133. Neurosurg Clin North Am 1996; 7(4): 703
–
708.
19. Paulson OB, Cronqvist S, Risberg J et al. Regional cerebral blood flow: comparison of 8-detector and 16 detector
instrumentation. J Nucl Med 1968; 10: 164
–
173.
20. Waltz AG, Wanek AR, Anderson RE. Comparison of analytic methods for calculation of cerebral blood flow after intracarotid
injection of Xenon-133. J Nucl Med 1972; 13: 66
–
72.