Handbook of Industrial Automation - Richard L. Shell and Ernest L. Hall Part 4 potx
Bạn đang xem bản rút gọn của tài liệu. Xem và tải ngay bản đầy đủ của tài liệu tại đây (557.47 KB, 37 trang )
144 Garrett
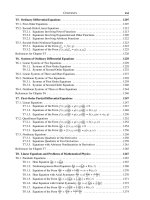
Figure 4 Butterworth lowpass ®lter design example.
Table 5 Filter Passband Errors
Frequency Amplitude response Af Average ®lter error "
filter%FS
f
f
c
1-pole
RC
3-pole
Bessel
3-pole
Butterworth
1-pole
RC
3-pole
Bessel
3-pole
Butterworth
0.0
0.1
0.2
0.3
0.4
0.5
0.6
0.7
0.8
0.9
1.0
1.000
0.997
0.985
0.958
0.928
0.894
0.857
0.819
0.781
0.743
0.707
1.000
0.998
0.988
0.972
0.951
0.924
0.891
0.852
0.808
0.760
0.707
1.000
1.000
1.000
1.000
0.998
0.992
0.977
0.946
0.890
0.808
0.707
0%
0.3
0.9
1.9
3.3
4.7
6.3
8.0
9.7
11.5
13.3
0%
0.2
0.7
1.4
2.3
3.3
4.6
6.0
7.7
9.5
11.1
0%
0
0
0
0
0.2
0.7
1.4
2.6
4.4
6.9
Copyright © 2000 Marcel Dekker, Inc.
factor n
À1=2
for n identical signal conditioning channels
combined. Note that V
diff
and V
cm
may be present in
any combination of dc or rms voltage magnitudes.
External interference entering low-level instrumen-
tation circuits frequently is substantial, especially in
industrial environments, and techniques for its
attenuation or elimination are essential. Noise coupled
to signal cables and input power buses, the primary
channels of external interference, has as its cause
local electric and magnetic ®eld sources. For example,
unshielded signal cables will couple 1 mV of interfer-
ence per kilowatt of 60 Hz load for each lineal foot of
cable run on a 1 ft spacing from adjacent power cables.
Most interference results from near-®eld sources, pri-
marily electric ®elds, whereby the effective attenuation
mechanism is re¯ection by a nonmagnetic material
such as copper or aluminum shielding. Both copper-
foil and braided-shield twinax signal cables offer
attenuation on the order of 90 voltage dB to 60 Hz
interference. However, this attenuation decreases by
20 dB per decade of increasing frequency.
For magnetic ®elds, absorption is the effective
attenuation mechanism, and steel or mu-metal shield-
ing is required. Magnetic-®eld interference is more dif-
®cult to shield against than electric-®eld interference,
and shielding effectiveness for a given thickness
diminishes with decreasing frequency. For example,
steel at 60 Hz provides interference attenuation on
the order of 30 voltage dB per 100 mils of thickness.
Magnetic shielding of applications is usually imple-
mented by the installation of signal cables in steel con-
duit of the necessary wall thickness. Additional
magnetic-®eld cancellation can be achieved by periodic
transposition of a twisted-pair cable, provided that the
signal return current is on one conductor of the pair
and not on the shield. Mutual coupling between cir-
cuits of a computer input system, resulting from ®nite
signal-path and power-supply impedances, is an addi-
tional source of interference. This coupling is mini-
mized by separating analog signal grounds from
noisier digital and chassis grounds using separate
ground returns, all terminated at a single star-point
chassis ground.
Single-point grounds are required below 1 MHz to
prevent circulating currents induced by coupling
effects. A sensor and its signal cable shield are usually
grounded at a single point, either at the sensor or the
source of greatest intereference, where provision of the
lowest impedance ground is most bene®cial. This also
provides the input bias current required by all instru-
mentation ampli®ers except isolation types, which fur-
nish their own bias current. For applications where the
sensor is ¯oating, a bias-restoration path must be pro-
vided for conventional ampli®ers. This is achieved with
balanced differential R
bias
resistors of at least 10
3
times
the source resistance R
s
to minimize sensor loading.
Resistors of 50 M, 0.1% tolerance, may be connected
between the ampli®er input and the single-point
ground as shown in Fig. 5.
Consider the following application example.
Resistance-thermometer devices (RTDs) offer com-
mercial repeatability to 0.18C as provided by a 100
platinum RTD. For a 0±1008C measurement range the
resistance of this device changes from 100.0 to
Measurement and Control Instrumentation 145
Figure 5 Signal-conditioning channel.
Copyright © 2000 Marcel Dekker, Inc.
138.5 with a nonlinearity of 0.00288C/8C. A con-
stant-current excitation of 0.26 mA converts this resis-
tance to a voltage signal which may be differentially
sensed as V
diff
from 0 to 10 mV, following a 26 mV
ampli®er offset adjustment whose output is scaled 0±
10 V by an AD624 instrumentation ampli®er differen-
tial gain of 1000. A three-pole Butterworth lowpass
bandlimiting ®lter is also provided having a 3 Hz cutoff
frequency. This signal-conditioning channel is evalu-
ated for RSS measurement error considering an input
V
cm
of up to 10 V rms random and 60 Hz coherent
interference. The following results are obtained:
"
RTD
tolerance nonlinearity  FS
FS
 100
0:18C 0:0028
8C
8C
 1008C
1008C
 100
0:38FS
"
ampl
0:22FS (Table 3)
"
filter
0:20FS (Table 5)
"
coherent
10 V
10 mV
10
9
10
9
45
1=2
Â10
À6
 1
60 Hz
3Hz
6
45
À1=2
Â100
1:25 Â 10
À5
FS
"
random
10 V
10 mV
10
9
10
9
45
1=2
Â10
À6
Â
2
p
3Hz
25 kHz
!
1=2
Â100
1:41 Â 10
À3
FS
"
measurement
"
2
RTD
"
2
ampl
"
2
filter
"
coherent
Â
"
2
random
Ã
1=2
0:48FS
An RTD sensor error of 0.38%FS is determined for
this measurement range. Also considered is a 1.5 Hz
signal bandwidth that does not exceed one-half of the
®lter passband, providing an average ®lter error con-
tributionof0.2%FSfromTable5.Therepresentative
errorof0.22%FSfromTable3fortheAD624instru-
mentation ampli®er is employed for this evaluation,
and the output signal quality for coherent and random
input interference from Eqs. (5) and (6), respectively, is
1:25 Â10
À5
%FS and 1:41 Â10
À3
%FS. The acquisi-
tion of low-level analog signals in the presence of
appreciable intereference is a frequent requirement in
data acquisition systems. Measurement error of 0.5%
or less is shown to be readily available under these
circumstances.
1.5 DIGITAL-TO-ANALOG CONVERTERS
Digital-to-analog (D/A) converters, or DACs, provide
reconstruction of discrete-time digital signals into con-
tinuous-time analog signals for computer interfacing
output data recovery purposes such as actuators, dis-
plays, and signal synthesizers. These converters are
considered prior to analog-to-digital (A/D) converters
because some A/D circuits require DACs in their
implementation. A D/A converter may be considered
a digitally controlled potentiometer that provides an
output voltage or current normalized to a full-scale
reference value. A descriptive way of indicating the
relationship between analog and digital conversion
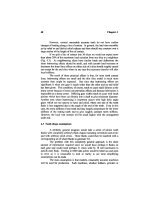
quantities is a graphical representation. Figure 6
describes a 3-bit D/A converter transfer relationship
having eight analog output levels ranging between
zero and seven-eighths of full scale. Notice that a
DAC full-scale digital input code produces an analog
output equivalent to FS À 1 LSB. The basic structure
of a conventional D/A converter incudes a network of
switched current sources having MSB to LSB values
according to the resolution to be represented. Each
switch closure adds a binary-weighted current incre-
ment to the output bus. These current contributions
are then summed by a current-to-voltage converter
146 Garrett
Figure 6 Three-bit D/A converter relationships.
Copyright © 2000 Marcel Dekker, Inc.
ampli®er in a manner appropriate to scale the output
signal. Figure 7 illustrates such a structure for a 3-bit
DAC with unipolar straight binary coding correspond-
ingtotherepresentationofFig.6.
In practice, the realization of the transfer character-
istic of a D/A converter is nonideal. With reference to
Fig. 6, the zero output may be nonzero because of
ampli®er offset errors, the total output range from
zero to FS À1 LSB may have an overall increasing or
decreasing departure from the true encoded values
resulting from gain error, and differences in the height
of the output bars may exhibit a curvature owing to
converter nonlinearity. Gain and offset errors may be
compensated for leaving the residual temperature-drift
variations shown in Table 6, where gain temperature
coef®cient represents the converter voltage reference
error. A voltage reference is necessary to establish a
basis for the DAC absolute output voltage. The major-
ity of voltage references utilize the bandgap principle,
whereby the V
be
of a silicon transistor has a negative
temperature coef®cient of À2:5mV=8C that can be
extrapolated to approximately 1.2 V at absolute zero
(the bandgap voltage of silicon).
Converter nonlinearity is minimized through preci-
sion components, because it is essentially distributed
throughout the converter network and cannot be elimi-
nated by adjustment as with gain and offset error.
Differential nonlinearity and its variation with tem-
perature are prominent in data converters in that
they describe the difference between the true and actual
outputs for each of the 1-LSB code changes. A DAC
with a 2-LSB output change for a 1-LSB input code
change exhibits 1 LSB of differential nonlinearity as
shown. Nonlinearities greater than 1 LSB make the
converter output no longer single valued, in which
case it is said to be nonmonotonic and to have missing
codes.
1.6 ANALOG-TO-DIGITAL CONVERTERS
The conversion of continuous-time analog signals to
discrete-time digital signals is fundamental to obtain-
ing a representative set of numbers which can be used
by a digital computer. The three functions of sampling,
quantizing, and encoding are involved in this process
and implemented by all A/D converters as illustrated
byFig.8.WeareconcernedherewithA/Dconverter
devices and their functional operations as we were with
the previously described complementary D/A conver-
ter devices. In practice one conversion is performed
each period T, the inverse of sample rate f
s
, whereby
a numerical value derived from the converter quantiz-
ing levels is translated to an appropriate output code.
ThegraphofFig.9describesA/Dconverterinput±
output relationships and quantization error for pre-
vailing uniform quantization, where each of the levels
q is of spacing 2
Àn
1 ÀLSB for a converter having an
n-bit binary output wordlength. Note that the maxi-
mum output code does not correspond to a full-scale
input value, but instead to 1 À 2
Àn
FS because there
exist only 2
n
À 1 coding points as shown in Fig. 9.
Quantization of a sampled analog waveform
involves the assignment of a ®nite number of ampli-
tude levels corresponding to discrete values of input
signal V
i
between 0 and V
FS
. The uniformly spaced
quantization intervals 2
Àn
represent the resolution
limit for an n-bit converter, which may also be
expressed as the quantizing interval q equal to
V
FS
=2
n
À1V.Theserelationshipsaredescribedby
Table7.ItisusefultomatchA/Dconverterword-
length in bits to a required analog input signal span
to be represented digitally. For example, a 10 mV-to-
10 V span (0.1%±100%) requires a minimum converter
wordlength n of 10 bits. It will be shown that addi-
tional considerations are involved in the conversion
Measurement and Control Instrumentation 147
Figure 7 Three-bit D/A converter circuit.
Table 6 Representative 12-Bit D/A Errors
Differential nonlinearity (1/2 LSB)
Linearity temp. coeff. (2 ppm/8C)(208C)
Gain temp. coeff. (20 ppm/8C)(208C)
Offset temp. coeff. (5 ppm/8C)(208C)
0:012
0:004
0:040
0:010
D=A
0.05%FS
Copyright © 2000 Marcel Dekker, Inc.
resulting from incomplete dielectric repolarization.
Polycarbonate capacitors exhibit 50 ppm dielectric
absorption, polystyrene 20 ppm, and Te¯on 10 ppm.
Hold-jump error is attributable to that fraction of
the logic signal transferred by the capacitance of the
switch at turnoff. Feedthrough is speci®ed for the hold
mode as the percentage of an input sinusoidal signal
that appears at the output.
1.7 SIGNAL SAMPLING AND
RECONSTRUCTION
The provisions of discrete-time systems include the
existence of a minimum sample rate for which theore-
tically exact signal reconstruction is possible from a
sampled sequence. This provision is signi®cant in
that signal sampling and recovery are considered
150 Garrett
Figure 11 Successive-approximation A/D conversion.
Table 8 Representative 12-Bit A/D Errors
12-bit successive approximation
Differential nonlinearity (1/2 LSB)
Quantizing uncertainty (1/2 LSB)
Linearity temp. coeff. (2 ppm/8C)(208C)
Gain temp. coeff. (20 ppm/8C)(208C)
Offset (5 ppm/8C)(208C)
Long-term change
A=D
0:012
0:012
0.004
0.040
0.010
0.050
0.080%FS
12-bit dual slope
Differential nonlinearity (1/2 LSB)
Quantizing uncertainty (1/2 LSB)
Gain temp. coeff. (25 ppm/8C)(208C)
Offset temp.coeff. (2 ppm/8C)(208C)
A=D
0:012
0.012
0.050
0.004
0.063%FS
Copyright © 2000 Marcel Dekker, Inc.
simultaneously, correctly implying that the design of
real-time data conversion and recovery systems should
also be considered jointly. The following interpolation
formula analytically describes this approximation
xt
ofacontinuoustimesignalxtwitha®nitenumberof
samplesfromthesequencexnTasillustratedbyFig.
13:
xtF
À1
ff xnT ÃHf g 8
x
nÀx
T
BW
ÀBW
xnTe
Àj2fnT
e
j2ft
df
T
x
nÀx
xnT
e
j2BWtÀnT
À e
Àj2BWtÀnT
j2t À nT
2TBW
x
nÀx
xnT
sin 2BWt À nT
2BWt À nT
xt is obtained from the inverse Fourier transform of
the input sequence and a frequency-domain convolu-
tion with an ideal interpolation function Hf , result-
Measurement and Control Instrumentation 151
Table 9 Representative Sample/Hold Errors
Acquisition error
Droop (25 mV=ms)(2 ms hold) in 10V
FS
Dielectric absorption
Offset (50 mV=8C208C in 10V
FS
Hold-jump error
Feedthrough
S=H
0.01%
0.0005
0.005
0.014
0.001
0.005
0.02%FS
Figure 12 Dual-slope A/D conversion.
Copyright © 2000 Marcel Dekker, Inc.
ing in a time-domain sinc amplitude response owing to
the rectangular characteristic of Hf . Due to the
orthogonal behavior of Eq. (8), however, only one
nonzero term is provided at each sampling instant by
a summation of weighted samples. Contributions of
samples other than the ones in the immediate neigh-
borhood of a speci®c sample, therefore, diminish
rapidly because the amplitude response of Hf tends
to decrease. Consequently, the interpolation formula
provides a useful relationship for describing recovered
bandlimited sampled-data signals of bandwidth BW
with the sampling period T chosen suf®ciently small
to prevent signal aliasing where sampling frequency
f
s
1=T.
It is important to note that an ideal interpolation
function Hf utilizes both phase and amplitude infor-
mation in reconstructing the recovered signal
xt, and
is therefore more ef®cient than conventional band-
limiting functions. However, this ideal interpolation
function cannot be physically realized because its
impulse response is noncausal, requiring an output
that anticipates its input. As a result, practical inter-
polators for signal recovery utilize amplitude informa-
tion that can be made ef®cient, although not optimum,
by achieving appropriate weighting of the recon-
structed signal.
Of key interest is to what accuracy can an original
continuous signal be reconstructed from its sampled
values.
It can be appreciated that the determination of sam-
ple rate in discrete-time systems and the accuracy with
which digitized signals may be recovered requires the
simultaneous consideration of data conversion and
reconstruction parameters to achieve an ef®cient allo-
cation of system resources. Signal to mean-squared-
error relationships accordingly represent sampled and
recovered data intersample error for practical interpo-
larfunctionsinTable10.Consequently,anintersam-
pleerrorofinterestmaybeachievedbysubstitutionof
a selected interpolator function and solving for the
sampling frequency f
s
by iteration, where asymptotic
convergence to the performance provided by ideal
interpolation is obtained with higher-order practical
interpolators.
The recovery of a continuous analog signal from a
discrete signal is required in many applications.
Providing output signals for actuators in digital con-
trol systems, signal recovery for sensor acquisition sys-
tems, and reconstructing data in imaging systems are
but a few examples. Signal recovery may be viewed
from either time-domain or frequency-domain perspec-
tives. In time-domain terms, recovery is similar to
interpolation procedures in numerical analysis with
the criterion being the generation of a locus that recon-
structs the true signal by some method of connecting
the discrete data samples. In the frequency domain,
signal recovery involves bandlimiting by a linear ®lter
to attenuate the repetitive sampled-data spectra above
baseband in achieving an accurate replica of the true
signal.
A common signal recovery technique is to follow a
D/A converter by an active lowpass ®lter to achieve an
output signal quality of interest, accountable by the
convergence of the sampled data and its true signal
representation. Many signal power spectra have long
time-average properties such that linear ®lters are espe-
cially effective in minimizing intersample error.
Sampled-data signals may also be applied to control
actuator elements whose intrinsic bandlimited ampli-
tude response assist with signal reconstruction. These
terminating elements often may be characterized by a
single-pole RC response as illustrated in the following
section.
An independent consideration associated with the
sampling operation is the attenuation impressed upon
the signal spectrum owing to the duration of the
sampled-signal representation xnT. A useful criterion
is to consider the average baseband amplitude error
between dc and the full signal bandwidth BW
expressed as a percentage of departure from full-scale
response. This average sinc amplitude error is
expressed by
"
sinc%FS
1
2
1 À
sinBWT
BWT
 100 9
and can be reduced in a speci®c application when it is
excessive by increasing the sampling rate f
s
. This is
frequently referred to as oversampling.
A data-conversion system example is provided by a
simpli®edthree-digitdigitaldcvoltmeter(Fig.14).A
dual-slope A/D conversion period T of 16 2/3 ms
provides a null to potential 60 Hz interference,
which is essential for industrial and ®eld use, owing
to sinc nulls occurring at multiples of the integration
period T. A 12-bit converter is employed to achieve a
nominal data converter error, while only 10 bits are
required for display excitation considering 3.33 binary
bits per decimal digit. The sampled-signal error eva-
luation considers an input-signal rate of change up to
an equivalent bandwidth of 0.01 Hz, corresponding to
an f
s
=BW of 6000, and an intersample error deter-
mined by zero-order-hold (ZOH) data, where V
s
equals V
FS
:
Measurement and Control Instrumentation 153
Copyright © 2000 Marcel Dekker, Inc.
asde®nedinTable11.Theconstant0.35de®nesthe
ratio of 2.2 time constants, required for the response to
rise between 10% and 90% of the ®nal value, to 2
radians for normalization to frequency in Hertz.
Validity for digital control loops is achieved by acquir-
ing t
r
from a discrete-time plot of the controlled-vari-
able amplitude response. Table 11 also de®nes the
bandwidth for a second-order process which is calcu-
lated directly with knowledge of the natural frequency,
sampling period, and damping ratio.
In the interest of minimizing sensor-to-actuator
variability in control systems the error of a controlled
variableofinterestisdivisibleintoananalogmeasure-
mentfunctionanddigitalconversionandinterpolation
functions. Instrumentation error models provide a uni-
®ed basis for combining contributions from individual
devices. The previous temperature measurement signal
conditioningassociatedwithFig.5isincludedinthis
temperaturecontrolloop,shownbyFig.16,withthe
averaging of two identical 0.48%FS error measure-
ment channels to effectively reduce that error by
n
À1=2
or 2
À1=2
, from Eq. (7), yielding 0.34%FS. This
provides repeatable temperature measurements to
within an uncertainty of 0.348C, and a resolution of
0.0248C provided by the 12-bit digital data bus
wordlength.
The closed-loop bandwidth is evaluated at conser-
vative gain and sampling period values of K 1and
T 0:1 sec f
s
10 Hz, respectively, for unit-step
excitation at rt. The rise time of the controlled vari-
able is evaluated from a discrete-time plot of Cn to be
1.1 sec. Accordingly, the closed-loop bandwidth is
found from Table 11 to be 0.318 Hz. The intersample
error of the controlled variable is then determined to
be 0.143%FS with substitution of this bandwidth value
and the sampling period TT 1=f
s
into the one-pole
process-equivalent interpolation function obtained
fromTable10.Thesefunctionsincludeprovisionsfor
scaling signal amplitudes of less than full scale, but are
taken as V
S
equalling V
FS
for this example.
Intersample error is therefore found to be directly
proportional to process closed-loop bandwidth and
inversely proportional to sampling rate.
The calculations are as follows:
"
measurement
0:48x (Fig. 5)
"
S/H
0:02x (Table 9)
"
=
0:08x (Table 8)
"
=
0:05x (Table 6)
"
1
2
1 À 0:318 =
0:318
=10
23
 100
0:08
"
intersample
1
sin 1 À
0:318 Hz
10 Hz
1 À
0:318 Hz
10 Hz
P
T
T
R
Q
U
U
S
2
1
10 Hz À 0:318 Hz
0:318 Hz
2
45
À1
sin 1 0:318
Hz
10 Hz
1
0:318 Hz
10 Hz
P
T
T
R
Q
U
U
S
2
1
10 Hz 0:318 Hz
0:318 Hz
2
45
À1
P
T
T
T
T
T
T
T
T
T
T
T
T
T
T
T
R
Q
U
U
U
U
U
U
U
U
U
U
U
U
U
U
U
S
À1=2
 100
0:143
"
"
 2
À1:2
2
"
2
=
"
2
=
"
2
=
"
2
"
2
45
1=2
0:39
Measurement and Control Instrumentation 155
Figure 15 Elementary digital control loop.
Table 11 Process Closed-Loop Bandwidth
Process À3dB BW of controlled variable
First order BW
0:35
1:1t
r
Hz (t
r
from Cn)
Second order BW
1
2
Àa
1
2
a
2
4!
4
n
p
1=2
Hz where a 4
2
!
2
n
4!
3
n
T À2!
2
n
À !
4
n
T
2
(natural frequency !
n
, sample period T sec, damping ratio )
Copyright © 2000 Marcel Dekker, Inc.
Chapter 2.2
Fundamentals of Digital Motion Control
Ernest L. Hall, Krishnamohan Kola, and Ming Cao
University of Cincinnati, Cincinnati, Ohio
2.1 INTRODUCTION
Control theory is a foundation for many ®elds, includ-
ing industrial automation. The concept of control the-
ory is so broad that it can be used in studying the
economy, human behavior, and spacecraft design as
well as the design of industrial robots and automated
guided vehicles. Motion control systems often play a
vital part of product manufacturing, assembly, and
distribution. Implementing a new system or upgrading
an existing motion control system may require
mechanical, electrical, computer, and industrial engi-
neering skills and expertise. Multiple skills are required
to understand the tradeoffs for a systems approach to
the problem, including needs analysis, speci®cations,
component source selection, and subsystems integra-
tion. Once a speci®c technology is selected, the suppli-
er's application engineers may act as members of the
design team to help ensure a successful implementation
that satis®es the production and cost requirements,
quality control, and safety.
Motion control is de®ned [1] by the American
Institute of Motion Engineers as: ``The broad applica-
tion of various technologies to apply a controlled force
to achieve useful motion in ¯uid or solid electromecha-
nical systems.''
The ®eld of motion control can also be considered
as mechatronics [1]: ``Mechatronics is the synergistic
combination of mechanical and electrical engineering,
computer science, and information technology, which
includes control systems as well as numerical methods
used to design products with built-in intelligence.''
Motion control applications include the industrial
robot [2] and automated guided vehicles [3±6].
Because of the introductory nature of this chapter,
we will focus on digital position control; force control
will not be discussed.
2.2 MOTION CONTROL ARCHITECTURES
Motion control systems may operate in an open loop,
closed-loop nonservo, or closed-loop servo, as shown
inFig.1,orahybriddesign.Theopen-loop
approach, shown in Fig. 1(a), has input and output
but no measurement of the output for comparison
with the desired response. A nonservo, on±off, or
bang±bang control approach is shown in Fig. 1(b).
In this system, the input signal turns the system on,
and when the output reaches a certain level, it closes
a switch that turns the system off. A proportion, or
servo, control approach is shown in Fig. 1(c). In this
case, a measurement is made of the actual output
signal, which is fed back and compared to the desired
response. The closed-loop servo control system will be
studied in this chapter.
The components of a typical servo-controlled
motion control system may include an operator inter-
face, motion control computer, control compensator,
electronic drive ampli®ers, actuator, sensors and trans-
ducers, and the necessary interconnections. The actua-
157
Copyright © 2000 Marcel Dekker, Inc.
equation for pendulum motion can be developed by
balancing the forces in the tangential direction:
F
t
Ma
t
1
This gives the following equation:
ÀMg sin À D
d
dt
Ma
t
2
The tangential acceleration is given in terms of the rate
of change of velocity or arc length by the equation
a
t
dv
dt
d
2
s
dt
2
3
Since the arc length, s, is given by
s L 4
Substituting s into the differential in Eq. (3) yields
a
t
L
d
2
dt
2
5
Thus, combining Eqs. (2) and (5) yields
ÀMg sin À D
d
dt
Ma
t
ML
d
2
dt
2
6
Note that the unit of each term is force. In imperial
units, W is in lb
f
, g is in ft/sec
2
, D is in lb sec, L is in
feet, is in radians, d=dt is in rad/sec and d
2
=dt
2
is in
rad/sec
2
. In SI units, M is in kg, g is in m/sec
2
, D is in
kg m/sec, L is in meters, is in radians, d=dt is in rad/
sec, and d
2
=dt
2
is in rad/sec
2
.
This may be rewritten as
d
2
dt
2
D
ML
d
dt
g
L
sin 0 7
This equation may be said to describe a system. While
there are many types of systems, systems with no out-
put are dif®cult to observe, and systems with no input
are dif®cult to control. To emphasize the importance
of position, we can describe a kinematic system, such as
y Tx. To emphasize time, we can describe a
dynamic system, such as g hf t. Equation (7)
describes a dynamic response. The differential equa-
tion is nonlinear because of the sin term.
For a linear system, y Tx, two conditions must
be satis®ed:
1. If a constant, a, is multiplied by the input, x,
such that ax is applied as the input, then the
output must be multiplied by the same constant:
Taxay 8
2. If the sum of two inputs is applied, the output
must be the sum of the individual outputs and
the principal of superposition must hold as
demonstrated by the following equations:
Tx
1
x
2
y
1
y
2
9
where
Tx
1
y
1
10
and
Tx
2
y
2
11
Equation (7) is nonlinear because the sine of the sum of
two angles is not equal to the sum of the sines of the
two angles. For example, sin 458 0:707, while
sin 908 1.
Invariance is an important concept for systems. In
an optical system, such as reading glasses, position
invariance is desired, whereas, for a dynamic system
time invariance is very important.
Since an arbitrary input function, f t may be
expressed as a weighted sum of impulse functions
using the Dirac delta function, t À. This sum can
be expressed as
f t
I
ÀI
f t À d 12
(Note that t is the time the output is observed and is
the time the input is applied.)
The response of the linear system to this arbitrary
input may be computed by
gth
I
ÀI
f t À d
P
R
Q
S
13
Thus by the property of linearity we obtain
gt
I
ÀI
f ht À d 14
Therefore, the response of the linear system is charac-
terized by the response to an impulse function. This
leads to the de®nition of the impulse response, ht;,
as
ht;ht À 15
Since the system response may vary with the time
the input is applied, the general computational form
for the output of a linear system is the superposition
integral called the Fredholm integral equation [7,8]:
Fundamentals of Digital Motion Control 159
Copyright © 2000 Marcel Dekker, Inc.
gt
f ht;d 16
The limits of integration are important in determining
the form of the computation. Without any assump-
tions about the input or system, the computation
must extend over an in®nite interval.
gt
I
ÀI
f ht;d 17
An important condition of realizability for a con-
tinuous system is that the response be nonanticipatory,
or casual, such that no output is produced before an
input is applied:
ht;0 for t À <0 18
The causality condition leads to the computation:
gt
t
ÀI
f ht;d 19
With the condition that f t0 for t < 0, the compu-
tation reduces to
gt
t
0
f ht;d 20
If the system is time invariant, then
ht;ht À 21
This leads to the familiar convolution equation:
gt
t
0
f ht À d 22
The reason that linear systems are so important is
that they are widely applicable and that a systematic
method of solution has been developed for them. The
relationship between the input and output of a linear,
time-invariant system is known to be a convolution
relation. Furthermore, transformational techniques,
such as the Laplace transform, can be used to convert
the convolution into an equivalent product in the trans-
form domain. The Laplace transform Fs of f t is
Fs
I
0
f te
Àst
dt 23
The convolution theorem states that
GsHsFs24
where
Gs
I
0
gte
Àst
dt 25
and
Hs
I
0
hte
Àst
dt 26
(Note that this theorem shows how to compute the
convolution with only multiplication and transform
operations.) The transform, Hs, of the system func-
tion, ht, is called the system transfer function. For
any input, f t, its transform, F s, can be computed.
Then multiplying by Hs yields the transform Gs.
The inverse Laplace transform of Gs gives the output
time response, gt.
This transform relationship may also be used to
develop block diagram representations and algebra
for linear systems, which is very useful to simplify
the study of complicated systems.
2.3.1.1 Linear-Approach Modeling
Returning to the pendulum example, the solution to
this nonlinear equation with D T 0 involves the ellip-
tical function. (The solutions of this nonlinear system
will be investigated later using Simulink.
1
) Using the
approximation sin in Eq. (7) gives the linear
approximation
d
2
dt
2
D
ML
d
dt
g
L
0 27
When D 0, Eq. (27) simpli®es to the linear differen-
tial equation for simple harmonic motion:
d
2
dt
2
g
L
0 28
A Matlab
1
m-®le may be used to determine the time
response to the linear differential equation. To use
Laplace transforms in Matlab, we must use the linear
form of the system and provide initial conditions, since
no forcing function is applied.
Remembering that the Laplace transform of the
derivative is
L
d
dt
&'
sÂsÀ0
À
29
and
160 Hall et al.
1
Matlab and Simulink are registered trademarks of the Math Works, Inc.
Copyright © 2000 Marcel Dekker, Inc.
L
d
2
dt
2
@A
s
2
ÂsÀs 0
À
À
d0
À
dt
30
Taking the Laplace transform of the linear differential
Eq. (27) gives
s
2
ÂsÀs0
À
À
d0
À
dt
D
ML
sÂsÀ0
À
g
L
Âs0
31
This may be simpli®ed to
Âs
s0
À
À
D
ML
0
À
d0
À
dt
s
2
D
ML
s
g
L
32
(Note that the initial conditions act as a forcing func-
tion for the system to start it moving.) It is more com-
mon to apply a step function to start a system. The
unit step function is de®ned as
ut
1 for t 5 0
0 for t < 0
&
33
(Note that the unit step function is the integral of the
delta function.) It may also be shown that the Laplace
transform of the delta function is 1, and that the
Laplace transform of the unit step function is 1=s.
To use Matlab to solve the transfer function for
t, we must tell Matlab that this is the output of
some system. Since GsHsFs, we can let Hs
1 and FsÂs. Then the output will be
GsÂs, and the impulse function can be used
directly. If Matlab does not have an impulse response
but it does have a step response, then a slight manip-
ulation is required. [Note that the impulse response of
system Gs is the same as the step response of system
s Gs.]
The transform function with numerical values sub-
stituted is
Âs
45s À0:0268
s
2
0:0268s 10:73
34
Note that 0458 and d0=dt 0. We can de®ne
T0 0 for ease of typing, and express the numera-
tor and denominator polynomials by their coef®cients
as shown by the num and den vectors below.
To develop a Matlab m-®le script using the step
function, de®ne the parameters from the problem
statement:
T0=45
D=0.1
M=40/32.2
L=3
G=32.3
num=[T0,D*T0/(M*L),0];
den=[1,D/(M*L),G/L];
t=0:0.1:10;
step(num,den,t);
grid on
title (`Time response of the pendulum
linear approximation')
This m-®le or script may be run using Matlab and
should produce an oscillatory output. The angle starts
at 458 at time 0 and goes in the negative direction ®rst,
then oscillates to some positive angle and dampens out.
The period,
T 2
L
g
s
35
in seconds (or frequency, f 1=T in cycles/second or
hertz) of the response can be compared to the theore-
tical solution for an undamped pendulum given in Eq.
(35) [9]. This is shown in Fig. 3.
2.3.1.2 Nonlinear-Approach Modeling
To solve the nonlinear system, we can use Simulink to
develop a graphical model of the system and plot the
time response. This requires developing a block dia-
gram solution for the differential equation and then
constructing the system using the graphical building
Fundamentals of Digital Motion Control 161
Figure 3 Pendulum response with linear approximation,
0 458.
Copyright © 2000 Marcel Dekker, Inc.
blocks of Simulink. From this block diagram, a simu-
lation can be run to determine a solution.
To develop a block diagram, write the differential
equation in the following form:
d
2
t
dt
2
ÀD
ML
d
dt
À
g
L
sin t36
Note that this can be drawn as a summing junction
with two inputs and one output. Then note that
can be derived from d
2
=dt
2
by integrating twice. The
output of the ®rst integrator gives d=dt. An initial
velocity condition could be put at this integration. A
pick-off point could also be put here to be used for
velocity feedback. The output of the second integrator
gives . The initial position condition can be applied
here. This output position may also be fed back for the
position feedback term. The constants can be imple-
mented using gain terms on ampli®ers since an ampli-
®er multiplies its input by a gain term. The sine
function can be represented using a nonlinear function.
The motion is started by the initial condition,
0 458, which was entered as the integration con-
stant on the integrator which changes d=dt to . Note
that the sine function expects an angle in radians, not
degrees. Therefore, the angle must be converted before
computing the sine. In addition, the output of the sine
function must be converted back to degrees. A block
diagram of this nonlinear model is shown in Fig. 4.
The mathematical model to analyze such a nonlinear
system is complicated. However, a solution is easily
obtained with the sophisticated software of Simulink.
TheresponseofthisnonlinearsystemisshowninFig.
5.Notethatitisverysimilartotheresponseofthe
linear system with an amplitude swinging between
458 and À458, and a period slightly less than 2 sec,
indicating that the linear system approximation is not
bad. Upon close inspection, one would see that the
frequency of the nonlinear solution is not, in fact, con-
stant.
2.3.2 Rigid-Link Pendulum
Consider a related problem, the dynamic response for
the mechanical system model of the human leg shown
inFig.6.Thetransferfunctionrelatestheoutputangu-
lar position about the hip joint to the input torque
supplied by the leg muscle. The model assumes an
input torque, Tt, viscous damping, D at the hip
joint, and inertia, J, around the hip joint. Also, a com-
ponent of the weight of the leg, W Mg, where M is
the mass of the leg and g is the acceleration of gravity,
creates a nonlinear torque. Assume that the leg is of
uniform density so that the weight can be applied at
the centroid at L=2 where L is the length of the leg. For
de®niteness let D 0:01 lb sec, J 4:27 ft lb sec
2
,
W Mg 40 lb, L 3 ft. We will use a torque ampli-
tude of Tt75 ft lb.
The pendulum gives us a good model for a robot
arm with a single degree of freedom. With a rigid link,
it is natural to drive the rotation by a torque applied to
the pinned end and to represent the mass at the center
of mass of the link. Other physical variations lead to
different robot designs. For example, if we mount the
rigid link horizontally and then articulate it, we reduce
162 Hall et al.
Figure 4 Block diagram entered into Simulink to solve the nonlinear system.
Copyright © 2000 Marcel Dekker, Inc.
We can also develop a Matlab m-®le solution to this
linear differential equation:
J=4.27;
D=0.1;
M=40/32.2;
g=32.2;
L=3;
num=[0,180/3.14159];%18/3.14159 is to
translate radians into degrees
den=[J,D,M*g*L/2];
t=0:0.1:10;
impulse(num,den,t);%®nd impulse response
grid on;
xlabel=(`Degrees');
ylabel=(`Time(seconds)');
title(`Unit impulse response of the rigid
link pendulum');
When one runs this program using Matlab, it produces
the result shown in Fig. 7.
One can also use Simulink to develop a graphical
model and solve the nonlinear system. To develop the
block diagram recall that Tt is the input and is the
output. We can manipulate the differential equation
and develop the block diagram. Various forms of the
block diagram may be developed depending on how
onesolvestheequation.OneformisshowninFig.8.
WhenthetorquestepinputisT075,thetime
responseisasshowninFig.9.Ratherthanoscillating,
the angle output appears to be going to in®nity. This
corresponds to the rigid link rotating continuously
about its axis.
2.3.2.1 Representation with State Variables
One can also determine the differential equation for
the rigid-link pendulum by applying a torque balance
around the pinned end for a vertically articulated
robot pointed upward using a state variable represen-
tation [10].
State variables are a basic approach to modern con-
trol theory. Mathematically, it is a method for solving
an nth-order differential equation using an equivalent
set of n, simultaneous, ®rst-order differential equa-
tions. Numerically, it is easier to compute solutions
to ®rst-order differential equations than for higher-
order differential equations. Practically, it is a way to
use digital computers and algorithms based on matrix
equations to solve linear or nonlinear systems. A sys-
tem is described in terms of its state variables, which
are the smallest set of linearly independent variables
that describe the system, its dynamic state variable,
the derivative of the state variable, its input, and its
output. Since state variables are not unique, many dif-
ferent forms may be chosen for solving a particular
problem. One particular set which is useful in the solu-
tion of nth-order single variable differential equations
is the set of phase variables. These are de®ned in terms
of the variable and its derivatives of the variable of the
nth-order equation. For example, in the second-order
differential equation in which we are working with,
we can de®ne a vector state variable with components,
x
1
t and x
2
dt=dt. Two state variables are
required because we have a second-order differential
equation. We would need N for an Nth-order differ-
ential equation. The state vector may be written as the
transpose of the row vector: x
1
; x
2
T
. We normally use
column vectors, not row vectors, for points. The state
equations for a linear system always consist of two
equations that are usually written as
dx
dt
Ax Bu
y Cx Du 41
where x is the state vector, dx=dt is the dynamic state
vector, u is the vector input and y is the vector output.
Suppose the state vector x has a dimension of n. For a
single input, single output (SISO) system: A is an n  n
constant coef®cient matrix called the system matrix; B
is a n  1 constant matrix called the control matrix; C
is a 1 Â n constant matrix called the output matrix; and
D is called the direct feedforward matrix. For the SISO
system, D is a 1 Â 1 matrix containing a scalar con-
stant.
Using the phase variables as state variables,
164 Hall et al.
Figure 7 Solution to nonlinear system computed with
Simulink.
Copyright © 2000 Marcel Dekker, Inc.
MgL
2J
sin x
1
Dx
2
J
0 53
So the solutions are
x
1
n n 0; 1; 2; FFF
x
2
0
It is possible to use either the state space or the transfer
function representation of a system. For example, the
transfer function of the linearized rigid link pendulum
is developed as described in the next few pages.
Taking the Laplace transform assuming zero initial
conditions gives
TtJ
d
2
dt
2
D
d
dt
Mgl
2
Âs
Ts
1=J
s
2
Ds
J
MgL
2J
54
The nonlinear differential equation of the rigid link
pendulum can also be put in the ``rigid robot'' form
that is often used to study the dynamics of robots.
M
q
q V
q; qGqT t55
where M is an inertia matrix, q is a generalized coor-
dinate vector, V represents the velocity dependent
torque, G represents the gravity dependent torque
and T represents the input control torque vector.
MJ
VD
G
MgL
2
q
Tt
56
2.3.3 Motorized Robot Arm
As previously mentioned, a rigid-link model is in fact
the basic structure of a robot arm with a single degree
of freedom. Now let us add a motor to such a robot
arm.
A DC motor with armature control and a ®xed ®eld
is assumed. The electrical model of such a DC motor is
shown in Fig. 10. The armature voltage, e
a
t is the
voltage supplied by an ampli®er to control the
motor. The motor has a resistance R
a
, inductance L
a
,
and back electromotive force (emf) constant, K
b
. The
back emf voltage, v
b
t is induced by the rotation of the
armature windings in the ®xed magnetic ®eld. The
counter emf is proportional to the speed of the
motor with the ®eld strength ®xed. That is,
v
b
tK
b
d
dt
57
Taking the Laplace transform gives
V
b
ssK
b
Âs58
The circuit equation for the electrical portion of the
motor is
E
a
sR
a
I
a
sL
a
sI
a
sV
b
s59
This may also be written as
I
a
s
E
a
sÀK
b
sÂs
L
a
s R
a
60
The torque developed by the motor is proportional to
the armature current:
T
m
sK
t
I
a
s61
This torque moves the armature and load.
Balancing the torques at the motor shaft gives the
torque relation to the angle that may be expressed as
follows:
TtJ
d
2
m
dt
2
D
d
m
dt
62
where
m
is the motor shaft angle position, J represents
all inertia connected to the motor shaft, and D all
friction (air friction, bearing friction, etc.) connected
to the motor shaft.
Taking the Laplace transform gives
T
m
sJs
2
Â
m
sDsÂ
m
s63
Solving Eq. (63) for the shaft angle, we get
m
s
T
m
s
Js
2
Ds
64
166 Hall et al.
Figure 10 Fixed ®eld DC motor: (a) circuit diagram; (b)
block diagram (from Nise, 1995).
Copyright © 2000 Marcel Dekker, Inc.
If there is a gear train between the motor and load,
then the angle moved by the load is different from the
angle moved by the motor. The angles are related by
the gear ratio relationship, which may be derived by
noting that an equal arc length, S, is traveled by two
meshing gears. This can also be described by the fol-
lowing equation:
S R
m
m
R
L
L
65
The gear circumference of the motor's gear is 2R
m
,
which has N
m
teeth, and the gear circumference of the
load's gear is 2R
L
, which has N
L
teeth, so the ratio of
circumferences is equal to the ratio of radii and the
ratio of number of teeth so that
N
L
L
N
m
m
66
or
L
m
N
m
N
L
n 67
The gear ratio may also be used to re¯ect quantities on
the load side of a gear train back to the motor side so
that a torque balance can be done at the motor side.
Assuming a lossless gear train, it can be shown by
equating mechanical, T!
1
, and electrical, EI, power
that the quantities such as inertia, J, viscous damping
D, and torsional springs with constants K may be
re¯ected back to the motor side of a gear by dividing
by the gear ratio squared. This can also be described
with the equations below:
J
mL
J
L
n
2
68
D
mL
D
L
n
2
69
K
mL
K
L
n
2
70
Using these relationships, the equivalent load quanti-
ties for J and D may be used in the previous block
diagram. From Eqs. (59), (60), (61), (64), and (67) we
can get the block diagram of the armature-controlled
DC motor as shown in Fig. 11.
By simplifying the block diagram shown in Fig. 11,
we can get the armature-controlled motor transfer
function as
Gs
Â
L
s
Es
K
t
n
sJs DL
a
s R
a
K
b
K
t
Gs
K
t
n
sJL
a
s
2
JR
a
DL
a
s DR
a
K
b
K
t
71
As we can see, this model is of the third order.
However, in the servomotor case, the inductance of
the armature L
a
could usually be ignored. Thus this
model could be reduced to a second-order system.
Now, apply this model to a simple example. Suppose
a DC motor is used to drive a robot arm horizontally as
showninFig.12.Thelinkhasamass,M5kg,length
L 1 m, and viscous damping factor D 0:1: Assume
the system input is a voltage signal with a range of 0±
10 V. This signal is used to provide the control voltage
and current to the motor. The motor parameters are
given below. The goal is to design a compensation strat-
egy so that a voltage of 0 to 10 V corresponds linearly of
an angle of 08 to an angle of 908. The required response
should have an overshoot below 10%, a settling time
below 0.2 sec and a steady state error of zero. The
motor parameters are given below:
J
a
0:001 kg m
2
=s
2
D
a
0:01 N m s=rad
R
a
1
L
a
0H
K
b
1Vs=rad
K
t
1Nm=A
First, consider a system without gears or a gear ratio of
1. The inertia of the rigid link as de®ned before is
Fundamentals of Digital Motion Control 167
Figure 11 Armature-controlled DC motor block diagram.
Copyright © 2000 Marcel Dekker, Inc.
The step response can be determined with the follow-
ing program:
V=10;
Angle=90;
Kp=V/Angle; %feedback voltage/angle
constant
G=tf([1],[0.4177 1.11 0]);
% the transfer function of the velocity
loop
sysclose=feedback (G,Kp);
%the closed loop function of position
feedback
step(sysclose);
end
After position feedback, the steady response tends to
be stable as shown in Fig. 15. However, the system
response is too slow; to make it have faster response
speed, further compensation is needed. The following
example outlines the building of a compensator for
feedback control system.
2.3.4 Digital Motion Control
2.3.4.1 Digital Controller
With the many computer applications in control sys-
tems, digital control systems have become more impor-
tant. A digital system usually employs a computerized
controller to control continuous components of a
closed-loop system. The block diagram of the digital
systemisshowninFig.16.Thedigitalsystem®rst
samples the continuous difference data ", and then,
with an A/D converter, changes the sample impulses
into digital signals and transfers them into the compu-
ter controller. The computer will process these digitral
signals with prede®ned control rules. At last, through
the digital-to-analog (D/A) converter, the computing
results are converted into an analog signal, mt,to
control those continuous components. The sampling
switch closes every T
0
sec. Each time it closes for a
time span of h with h < T
0
. The sampling frequency,
f
s
, is the reciprocal of T
0
, f
s
1=T
0
,and!
s
2=T
0
is
called the sampling angular frequency. The digital con-
troller provides the system with great ¯exibility. It can
Fundamentals of Digital Motion Control 169
Figure 14 Position and velocity feedback model of the motorized rigid link.
Figure 15 Step response of the motorized robot arm.
Copyright © 2000 Marcel Dekker, Inc.
2.3.5 Digital Motion Control System Design
Example
Selecting the right parameters for the position, inte-
gral, derivative (PID) controller is the most dif®cult
step for any motion control system. The motion con-
trol system of the automatic guided vehicle (AGV)
helps maneuver it to negotiate curves and drive around
obstacles on the course. Designing a PID controller for
the drive motor feedback system of Bearcat II robot,
the autonomous unmanned vehicle, was therefore con-
sidered one important step for its success.
The wheels of the vehicle are driven independently
by two Electrocraft brush-type DC servomotors.
Encoders provide position feedback for the system.
The two drive motor systems are operated in current
loops in parallel using Galil MSA 12-80 ampli®ers. The
main controller card is the Galil DMC 1030 motion
control board and is controlled through a computer.
2.3.5.1 System Modeling
The position-controlled system comprises a position
servo motor (Electrocraft brush-type DC motor) with
an encoder, a PID controller (Galil DMC 1030 motion
control board), and an ampli®er (Galil MSA 12-80).
The ampli®er model can be con®gured in three
modes, namely, voltage loop, current loop, and velo-
city loop. The transfer function relating the input vol-
tage V to the motor position P depends upon the
con®guration mode of the system.
Voltage Loop. In this mode, the ampli®er acts as a
voltage source to the motor. The gain of the ampli®er
will be K
v
, and the transfer function of the motor with
respect to the voltage will be
P
V
K
v
K
t
ss
m
1s
e
1
75
where
m
RJ
K
2
t
s and
e
L
R
s
The motor parameters and the units are:
K
t
: torque constant (N m/A),
R: armature resistance (ohms),
J: combined inertia of the motor and load (kg m
2
),
L: armature inductance (Henries).
Current Loop. In this mode the ampli®er acts as a
current source for the motor. The corresponding trans-
fer function will be as follows:
P
V
K
a
K
t
Js
2
76
where K
a
is the ampli®er gain, and K
t
and J are as
de®ned earlier.
Velocity Loop. In the velocity mode, a tachometer
feedback to the ampli®er is incorporated. The transfer
Fundamentals of Digital Motion Control 171
Figure 17 Two representations of digital control systems: (a) digital control system; (b) digital controller.
Copyright © 2000 Marcel Dekker, Inc.
function is now the ratio of the Laplace transform of
the angular velocity to the voltage input. This is given
by
!
V
k
a
K
t
J
s
1
K
a
K
t
K
g
s
J
s
1
K
g
s
1
1
77
where
1
J
K
a
K
t
K
g
and therefore
P
V
1
K
g
ss
1
1
The Encoder. The encoder is an integral part of the
servomotor and has two signals A and B, which are in
quadrature and 908 out of phase. Due to the quadra-
ture relationship, the resolution of the encoder is
increased to 4N quadrature counts/rev, where N is
the number of pulses generated by the encoder per
revolution.
The model of the encoder can be represented by a
gain of
K
f
4N
2
counts/rad 78
The Controller. The controller in the Galil DMC
1030 board has three elements, namely the digital-to-
analog converter (DAC), the digital ®lter and the zero-
order hold (ZOH).
Digital-to-analog converter. The DAC converts a
14-bit number to an analog voltage. The input range
of numbers is 16,384 and the output voltage is
Æ10 V. For the DMC 1030, the DAC gain is given
by K
d
0:0012 V/count.
Digital ®lter. This has a discrete system transfer
function given by
Dz
Kz À A
z
Cz
z À1
79
The ®lter parameters are K, A,andC. These are
selected by commands KP, KI, and KD, where KP,
KI, and KD are respectively the proportional, integral
and derivative gains of the PID controller.
The two sets of parameters for the DMC 1030 are
related according to the equations
K K
p
K
d
A
K
d
K
p
K
d
80
C
K
i
8
Zero-order hold. The ZOH represents the effect of
the sampling process, where the motor command is
updated once per sampling period. The effect of the
ZOH can be modeled by the transfer function
Hs
1
1 s
T
2
81
In most applications, Hs can be approximated as 1.
Having modeled the system, we now have to obtain
the transfer functions with the actual system para-
meters. This is done for the system as follows.
2.3.5.2 System Analysis
The system transfer functions are determined by com-
puting transfer functions of the various components.
Motor and ampli®er: The system is operated in a
current loop and hence the transfer function of
the motor±ampli®er is given by
P
V
K
a
K
t
Js
2
82
Encoder: The encoder on the DC motor has a reso-
lution of 500 lines per revolution. Since this is in
quadrature, the position resolution is given by 4
Â500 2000 counts per revolution. The encoder
can be represented by a gain of
K
f
4 ÂN
2
2000
2
318
DAC: from the Galil manual, the gain of the DAC
on the DMC 1030 is represented as
K
d
0:0012 V/count.
ZOH: the ZOH transfer function is given by
Hs
1
1 s
T
2
where T is the sampling time. The sampling time
in this case is 0.001 sec. Hence the transfer func-
tion of the ZOH is
Hs
2000
s 2000
83
172 Hall et al.
Copyright © 2000 Marcel Dekker, Inc.
2.3.5.3 System Compensation Objective
The analytical system design is aimed at closing the
loop at a crossover frequency !. This crossover fre-
quency is required to be greater than 200 rad/sec. An
existing system is taken as a reference and the cross-
over frequency of that system is used, since the two are
similar Ref [11].
The following are the parameters of the system:
1. Time constant of the motor, K
t
2:98 lb in,/A
(0.3375 N m/A).
2. Moment of inertia of the system, J 220 lb in.
2
(approx.) [2:54 Â 10
4
kg m
2
(approx.)].
3. Motor resistance, R 0:42 .
4. Ampli®er gain in current loop, K
a
1:2 A/V.
5. Encoder gain, K
f
318 counts/rev.
The design objective is set at obtaining a phase margin
of 458.
The block diagram of the system is shown in Fig.
18.
Motor:
Ms
K
Js
2
0:3375
2:54 Â 10
À4
1330
s
2
84
Ampli®er:
K
a
1:2 85
DAC:
K
d
10
8192
0:0012 86
Encoder:
K
f
318 87
ZOH:
Hs
2000
s 2000
88
Compensation ®lter:
GsP sD 89
LsMsK
a
K
f
K
d
Hs
1:21 Â10
6
s
2
s 2000
90
The feed-forward transfer function of the system is
given by
AsLsGs91
and the open-loop transfer function will be
Lj200
1:21 Â 10
6
j200
2
j200 2000
92
The magnitude of Ls at the crossover frequency of
200 rad/sec is
jLj200j 0:015 93
and the phase of the open-loop transfer function is
given by
Arg Lj200À180 Àtan
À1
200
2000
À1858 94
Gs is selected such that As has a crossover fre-
quency of 200 rad/sec and a phase margin of 458.
This requires that
jAsj 1 95
and
Arg Aj200 À1358 96
But we have AsLsGs, therefore we must have
jGj200j
jAj200j
jLj200j
% 66 97
and
Fundamentals of Digital Motion Control 173
Figure 18 Block diagram of the position controlled servo system.
Copyright © 2000 Marcel Dekker, Inc.
Arg Gj200 Arg Aj200 Arg Lj200
À1358 1858 508
98
Hence select the ®lter function of the form
GsP sD 99
such that at crossover frequency of 200, it would have
a magnitude of 66 and a phase of 508.
jGj200j jP j200Dj 66 100
and
Arg Gj200 tan
À1
200D
P
!
508 101
Solving these equations, we get
P 42
D 0:25
The ®lter transfer function is given by
Gs0:25s 42.
The step response of the compensated system is
shown in Fig. 19.
2.3.5.4 System Analysis with Compensator
Now with the ®lter parameters known, the open-loop
and closed-loop transfer functions are computed as
follows:
OLTF
9:62s
3
2572s
2
1:885 Â 10
5
s 4:104 Â 10
6
s
5
400s
4
47,500s
3
1:5 Â 10
6
s
2
102
The root locus and Bode plot for the system are shown
in Figs. 20 and 21, and it is clear that the system is not
stable in the closed loop because it has two poles at the
origin. This has to be further compensated by a con-
troller in order to stabilize the closed loop.
A controller with zeros that can cancel the poles at
the origin is used. Poles are added at s À50 and s
À150 in order to stabilize the closed-loop step
response.
174 Hall et al.
Figure 19 Step response of the compensated system.
Figure 20 Root locus plot of the compensated system.
Figure 21 Bode plot of the compensated system.
Copyright © 2000 Marcel Dekker, Inc.
The controller transfer function is given by
Gs
s
2
s 50s 150
103
With the controller, the open- and closed-loop transfer
functions are given by
OLTF
30:45 Â10
3
s 51:15 Â10
6
s
3
2200s
2
407,500s 15 Â 10
6
104
and
CLTF
957:6s 160,876
s
3
2200s
2
408,457s 15:16 Â 10
6
105
The experimental step response plots of the system
are shown in Fig. 22.
The analytical values of K
p
, K
i
,andK
d
which are
the proportional, integral, and derivative gains, respec-
tively, of the PID controller, are tested for stability in
the real system with the help of Galil Motion Control
Servo Design Kit Version 4.04.
2.4 CONCLUSIONS
A simple mechanism has been used to illustrate many
of the concepts of system theory encountered in con-
trolling motion with a computer. Natural constraints
often described by a differential equation are encoun-
tered in nature. The parameters such as length and
mass of the pendulum have a large impact on its con-
trol. Stability and other system concepts must be
understood to design a safe and useful system.
Analog or continuous system theory must be merged
with digital concepts to effect a computer control. The
result could be a new, useful, and nonobvious solution
to an important practical problem.
REFERENCES
1. D Shetty, RA Kolk. Mechatronics System Design.
Boston, MA: PWS Publishing, 1997.
2. H Terasaki, T Hasegawa. Motion planning of intelli-
gent manipulation by a parallel two-®ngered gripper
equipped with a simple rotating mechanism. IEEE
Trans Robot Autom 14(2): 207±218, 1998.
3. K Tchon, R Muszynski. Singular inverse kinematic pro-
blem for robotic manipulators: a normal form
approach. IEEE Trans Robot and Autom 14(1): 93±
103, 1998.
4. G Campion, G Bastin, B D'Andrea-Novel. Structural
properties and classi®cation of kinematic and dynamic
models of wheeled mobile robots. IEEE Trans Robot
Autom 12(1): 47±61, 1996.
5. B Thuilot, B D'Andrea-Novel, A Micaeelli. Modeling
and feedback control of mobile robots equipped with
several steering wheels. IEEE Trans Robot Autom
12(3): 375±390, 1998.
6. CF Bartel Jr. Fundamentals of Motion Control.
Assembly, April 1997, pp 42±46.
7. BW Rust, WR Burris. Mathematical Programming and
the Numerical Solution of Linear Equations. New
York: Elsevier, 1972.
8. EL Hall. Computer Image Processing and Recognition.
New York: Academic Press, 1979, pp 555±567.
9. FP Beer, ER Johnson Jr. Vector Mechanics for
Engineers. New York: McGraw-Hill, 1988, pp 946±948.
10. NS Nise. Control Systems Engineering. Redwood City,
CA: Benjamin/Cummings, 1995, pp 117±150.
11. J Tal. Motion Control by Microprocessors. Palo Alto,
CA: Galil Motion Control, 1989, pp 63, 64.
Fundamentals of Digital Motion Control 175
Figure 22 Experimental step response.
Copyright © 2000 Marcel Dekker, Inc.
Chapter 2.3
In-Process Measurement
William E. Barkman
Lockheed Martin Energy Systems, Inc., Oak Ridge, Tennessee
3.1 INTRODUCTION
Manufacturing operations are driven by cost require-
ments that relate to the value of a particular product to
the marketplace. Given this selling price, the system
works backward to determine what resources can be
allocated to the manufacturing portion of the cost
equation. Then, production personnel set up the neces-
sary resources and provide the workpieces that are
consumed by the market. Everyone is happy until
something changes. Unfortunately, the time constant
associated with change in the manufacturing world is
usually very short. Requirements often change even
before a system begins producing parts and even
after production is underway there are typically
many sources of variability that impact the cost/qual-
ity of the operation. Variability associated with sche-
duling changes must be accommodated by designing
¯exibility into the basic manufacturing systems.
However, the variability that is related to changing
process conditions must be handled by altering system
performance at a more basic level.
Error conditions often occur where one or more
critical process parameters deviates signi®cantly from
the expected value and the process quality is degraded.
The sensitivity of the process to these variations in
operating conditions depends on the point in the over-
all manufacturing cycle at which they occur as well as
the speci®c characteristics of a particular process dis-
turbance. Amplitude, a frequency of occurrence, and a
direction typically characterize these process errors. In
a machining operation, the typical result is a lack of
synchronization between the tool and part locations so
that erroneous dimensions are produced.
Over time, the amplitudes of process errors are typi-
cally limited to a speci®c range either by their inherent
nature or by operator actions. For example, shop tem-
perature pro®les tend to follow a speci®c pattern from
day to day, component de¯ections are directly related
to cutting forces, and cutting tools are replaced as they
wear out. As multiple process error sources interact,
the result is typically a seemingly random distribution
of performance characteristics with a given ``normal
range'' that de®nes the routine tolerances that are
achievable with a given set of operations. On the
other hand, trends such as increasing operating tem-
peratures due to a heavy workload, coolant degrada-
tion, component wear, etc. have a nonrandom
component that continues over time until an adjust-
ment is made or a component is replaced.
One solution to the problem of process variation is
to build a system that is insensitive to all disturbances;
unfortunately, this is rarely practical. A more realistic
approach is to use a manufacturing model that de®nes
the appropriate response to a particular process para-
meter change. This technique can be very successful if
the necessary monitoring systems are in place to mea-
sure what is really happening within the various man-
ufacturing operations. This approach works because
manufacturing processes are deterministic in nature:
a cause-and-effect relationship exists between the out-
put of the process and the process parameters. Events
177
Copyright © 2000 Marcel Dekker, Inc.
occur due to speci®c causes, not random chance, even
though an observer may not recognize the driving
force behind a particular action. If the key process
characteristics are maintained at a steady-state level
then the process output will also remain relatively con-
stant. Conversely, when the process parameters change
signi®cantly, the end product is also affected in a
noticeable manner.
Recognizing the deterministic nature of manufac-
turing operations leads to improvements in product
quality and lowers production costs. This is accom-
plished by measuring the important process para-
meters in real time and performing appropriate
adjustments in the system commands. Moving beyond
intelligent alterations in control parameters, parts can
also be ``¯agged'' or the process halted, as appropriate,
when excessive shifts occur in the key process vari-
ables. In addition, when an accurate system model is
available, this real-time information can also lead to
automatic process certi®cation coupled with ``sample''
certi®cation of process output and the full integration
of machining and inspection.
The system elements necessary to accomplish this
are an operational strategy or model that establishes
acceptable limits of variability and the appropriate
response when these conditions are exceeded, a
means of measuring change within the process, plus a
mechanism for inputting the necessary corrective
response. This chapter discusses the selection of the
key process measurements, the monitoring of the
appropriate process information, and the use of this
measurement data to improve process performance.
3.2 PROCESS VARIATION
An important goal in manufacturing is to reduce the
process variability and bias to as small a level as is
economically justi®able. Process bias is the difference
between a parameter's average value and the desired
value. Bias errors are a steady-state deviation from an
intended target and while they do cause unacceptable
product, they can be dealt with through calibration
procedures. On the other hand, process variability is
a continuously changing phenomenon that is caused
by alterations in one or more manufacturing process
parameters. It is inherently unpredictable and there-
fore more dif®cult to accommodate. Fortunately,
real-time process parameter measurements can provide
the information needed to deal with unexpected excur-
sions in manufacturing system output. This extension
of conventional closed-loop process control is not a
complex concept; however, the collection of the neces-
sary process data can be a challenge.
Process variability hinders the efforts of system
operators to control the quality and cost of manufac-
turing operations. This basic manufacturing character-
istic is caused by the inability of a manufacturing
system to do the same thing at all times, under all
conditions. Examples of variability are easily recog-
nized in activities such as ¯ipping a coin and attempt-
ing to always get a ``heads'' or attempting to always
select the same card from a complete deck of cards.
Machining operations typically exhibit a much higher
degree of process control. However, variability is still
present in relatively simple operations such as attempt-
ing to control a feature diameter and surface ®nish
without maintaining a constant depth of cut, coolant
condition/temperature, tooling quality, etc.
Inspecting parts and monitoring the value of var-
ious process parameters under different operating con-
ditions collects process variability data. The answers to
the following questions provide a starting point in
beginning to deal with process variability: What para-
meters can and should be measured, how much var-
tion is acceptable, is bias a problem (it is usually a
calibration issue), what supporting inspection data is
required, and does the process model accurately pre-
dict the system operation?
Error budgets [1] are an excellent tool for answering
many of these questions. It is rarely possible or cost
effective to eliminate all the sources of variability in a
manufacturing process. However, an error budget pro-
vides a structured approach to characterizing system
errors, understanding the impact of altering the mag-
nitudes of the various errors, and selecting a viable
approach for meeting the desired performance goals.
The error budgeting process is based on the assump-
tion that the total process error is composed of a num-
ber of individual error components that combine in a
predictable manner to create the total system error.
The identi®cation and characterization of these error
elements and the understanding of their impact on the
overall process quality leads to a system model that
supports rational decisions on where process improve-
ment efforts should be concentrated.
The procedure for obtaining a viable error budget
begins with the identi®cation and characterization of
the system errors, the selection of a combinatorial rule
for combining the individual errors into a total process
error, and the validation of this model through experi-
mental testing. The system model is obtained by con-
ducting a series of experiments in which a relationship
is established between individual process parameters
178 Barkman
Copyright © 2000 Marcel Dekker, Inc.
and the quality of the workpiece. In a machining
operation this involves fabricating a series of parts
while keeping all parameters but one at a constant
condition. For instance, tool wear can be measured
by making a series of identical cuts without changing
the cutting tool. Wear measurements made between
machining passes provide a wear hsitory that is useful
in predicing tool performance. In a similar fashion, a
series of diameters can be machined over time (using a
tool±workpiece combination that does not exhibit sig-
ni®cant wear) without attempting to control the tem-
perature of the coolant. This will produce temperature
sensitivity data that can be used to de®ne the degree of
temperature control required to achieve a particular
workpiece tolerance.
After all the process error sources have been char-
acterized, it is necessary to combine them in some intel-
ligent fashion and determine if this provides an
accurate prediction of part quality. Since all errors
are not present at the same time, and because some
errors will counteract each other it is overly conserva-
tive to estimate process performance by simply adding
together all the maximum values of the individual error
sources. Lawrence Livermore National Laboratory
(LLNL) has been quite successful in predicting the
performance of precision machine tools using a root-
mean-square method for combining the individual
error elements into an overall performance predictor
[2]. An excellent example of the application of the error
budget technique is the LLNL large optics diamond
turning machine shown in Fig. 1.
Once the system error model has been validated, a
reliable assessment can be made of the impact of
reducing, eliminating, or applying a suitable compen-
sation technique to the different error components.
Following a cost estimate of the resources required
to achieve the elimination (or appropriate reduction)
of the various error sources, a suitable course of
action can be planned. In general, it is desirable to
attempt to reduce the amplitudes of those error
sources that can be made relatively small (10% of
the remaining dominant error) with only a modest
effort. For example, if a single easily corrected
error source (or group of error sources) causes 75%
of a product feature's error then it is a straightfor-
ward decision on how to proceed. Conversely, if this
error source is very expensive to eliminate then it
may be inappropriate to attempt to achieve the
desired tolerances with the proposed equipment. In
this case, it is necessary to reevaluate the desired
objectives and processing methods and consider alter-
native approaches. Obviously, a critical element in
In-Process Measurement 179
Figure 1 Artist's concept of initial large optics diamond turning machine design (courtesy of Lawrence Livermore National
Laboratory).
Copyright © 2000 Marcel Dekker, Inc.